Article

Fluorescing Layered Double Hydroxides as Tracer Materials for Particle Injection during Subsurface Water Remediation

1
Grupo de Investigación Reconocido-Química del Estado Sólido, Materiales y Catálisis Heterogénea (GIR-QUESCAT), Departamento de Química Inorgánica, Universidad de Salamanca, 37008 Salamanca, Spain
2
Institute of Earth Sciences, Háskoli íslands, Sturlugata 7, 101 Reykjavík, Iceland
3
Nirás, Sortemosevej 19, 3450 Allrød, Denmark
4
Nano-Science Center, Department of Chemistry, University of Copenhagen, Universitetsparken 5, 2100 Copenhagen, Denmark
*
Author to whom correspondence should be addressed.
ChemEngineering 2020, 4(3), 53; https://doi.org/10.3390/chemengineering4030053
Submission received: 13 July 2020 / Revised: 31 August 2020 / Accepted: 10 September 2020 / Published: 16 September 2020

Abstract

:
Nowadays, the contamination of groundwater and soils by highly hazardous and toxic chlorinated solvents is a global issue. Over the past years, different remediation strategies have been developed, involving injection of reactive solutions and/or particles. However, a major difficulty is the monitoring of injected particles during the injection and after secondary mobilisation by groundwater flow. This study is focussed on the development of directly traceable particles by combining fluorescein with Layered Double Hydroxides (LDHs). We present here the facile and easily tuneable synthesis of fluorescing LDHs (Fluo-LDH) via co-precipitation under supersaturation conditions. Their ability to mimic particle sizes of previously studied reactive LDHs, which proved to be able to adsorb or degrade chlorinated organic solvents from aqueous solutions, was investigated as well. Tests using a novel Optical Image Profiler (OIP) confirmed that the fluorescent LDHs can be easily detected with this tool. Even LDHs with the lowest amount of fluorescent dye were detectable. Together with the use of an OIP, which is capable of exciting the fluorescent material and collecting real-time pictures, this can provide a new, efficient, and cost-effective method for in situ tracing of injected particles in the subsurface.

1. Introduction

In recent years, the removal of chlorinated organic solvents, which can deeply penetrate aquifers, accumulating in the sub-surface as lenses of highly hazardous and toxic pollutants [1,2] from groundwater and soil, has become a major problem. Many laboratory- as well as field-scale studies exist considering different reaction pathways between reactants and the target contaminant, such as immobilization of contaminants [3,4,5,6,7,8,9] or in situ degradation of target contaminants into less hazardous or even non-hazardous substances [10,11,12,13,14,15,16,17,18]. Thereby, a major difficulty is the monitoring of reactants during the injection and after secondary mobilisation by groundwater flow. Their behaviour in the sub-surface is usually estimated based on data gathered about contaminant transport behaviour and source zone geometries [12,19]. So far, only a few methods for direct particle detection exist, e.g., via magnetic susceptibility measurements, which are only applicable for a limited group of commonly available materials, such as iron-containing particles. In recent years, development was focussed on the production of fluorescing particles allowing the direct traceability of a broader group of particles in the subsurface after injection. One promising example was presented by Gillies et al. [20]. Detection of these novel particles can be achieved by using and/or adapting already existing systems to detect different kind of tracers, or tools to detect induced fluorescence of aquifer contamination by non-aqueous phase liquids; these are the Ultra-violet Optical Screening Tool (UVOST®) and Tar-Specific Green Optical Screening Tool (TarGOST®) from Dakota Technologies Inc. (Dargo, ND, USA) [21,22], the Rapid Optical Screening Tool (ROSTTM) from Fugro Geoscience Inc. (Houston, TX, USA) [23,24], and the Optical Image Profiler (OIP)-UV and OIP-G from Geoprobe Systems®; Kejr Inc. (Salina, KS, USA) [25,26].
The study presented here is focussed on the development of traceable particles by combining fluorescein, a commonly used, cheap, non-toxic, and non-harmful fluorescent dye, with hydrotalcite- and hydrocalumite-like Layered Double Hydroxides. Please refer to previously published studies of the authors for a detailed description of the structure of the materials used here [8,14]. In recent years, Layered Double Hydroxides (LDHs) with intercalated fluorescent dyes have been widely studied and commonly synthesised via ion exchange [27,28,29] and reaction-diffusion [30] routes. Here we present the facile and easily tuneable synthesis of fluorescing LDHs (Fluo-LDH) via co-precipitation under supersaturation conditions. LDHs related to the hydrotalcite sub-group were synthesised using Mg2+ and Al3+ with a molar ratio of 3:1 and are subsequently referred to as Mg,Al-LDHs; those related to the hydrocalumite-group are built up by Ca2+ and Al3+ in a 2:1 molar ration and are subsequently called Ca,Al-LDHs. Pre-tests revealed that the resulting particle size, one of the most important features of particles when it comes to injections, of the fluorescent particles studied here can easily be tuned by adjusting the synthesis parameters.
Further studies were carried out to compare the fluorescent LDHs presented here with previously studied reactive LDHs, which proved to be able to absorb and thus immobilize [8] or degrade [14] chlorinated organic solvents from aqueous solutions. To assess the potential traceability of the synthesised fluorescent LDHs in the subsurface, tests were carried out using an OIP-G system (Geoprobe Systems®), which is a novel tool developed for inducing fluorescence on contaminations caused by large polyaromatic hydrocarbon like creosote, coal tars, oils and fuels [26].
The aim of this study was to develop directly traceable particles for in situ remediation strategies involving the co-injection of remediating particles or solutions with tracer agents, which, in the case of particle injection, might show different transport behaviour in the subsurface. The goal was to synthesise easily adjustable fluorescing particles, which would show similar transport properties as the reactive particles. Using the novel OIP would allow the post-injection detection of reactive materials in the subsurface, as this device is able to excite fluorescent materials, take in situ pictures, and carry out in situ measurements in the subsurface in real time. The novel method studied here would combine the traceability of particles with the in situ real-time injection of reactive particles offering an efficient and cost-effective approach to directly detect injected materials in the subsurface.

2. Materials and Methods

2.1. Preparation of Samples

All studied samples were synthesized by the co-precipitation method under supersaturation conditions [31] using sodium hydroxide (NaOH) as the precipitation agent. Chemicals were received from various suppliers with a minimum purity of 95% and were used without further treatment. A complete list can be found in the supplementary section (Table S1). Carbonation of the samples by atmospheric CO2 was avoided by preparing solutions with decarbonated water, boiled, and bubbled with nitrogen, and maintaining a nitrogen atmosphere during all synthesis and aging steps. Syntheses of the Ca,Al-samples were carried out in a glove box under nitrogen atmosphere to further minimize the influence of atmospheric CO2. All syntheses were carried out at room temperature and a pH of 9 (Mg,Al-sample) or pH of 11 (Ca,Al-LDH samples), which was kept stable by the addition of 1M NaOH using a pH burette (24, Crison). A 1M solution containing the metal cations (molar ratios Mg2+/Al3+ = 3:1; Ca2+/Al3+ = 2:1) was dropwise added at a constant rate of 1 mL/min, using a peristaltic pump, to 100 mL of an aqueous solution containing different amounts of the fluorescein disodium salt. After completing the addition, the samples were aged in the parent solution for 1 day (Mg,Al-LDH) or six days (Ca,Al-LDHs) at room temperature under constant magnetic stirring. Based on the literature [32,33,34,35,36] and our previous results about the synthesis of the materials studied here [8,14,37,38,39], different aging times were selected to optimize the procedure. The literature confirms the successful synthesis of rather well-formed hydrotalcite-like structures using aging times shorter than 24 h [8,32,33]. Usually, the synthesis of LDHs, following the co-precipitation route, is carried out at higher temperatures [34,35]. However, high temperatures during the synthesis of Ca,Al-LDHs can favour the production of undesired side products, such as hydrogrossular [36,37,38,39]. Thus, all syntheses of the Ca,Al-samples were carried out at room temperature, but with a longer aging time. After the aging process, all samples were centrifuged and washed with decarbonated, distilled water and dried in an oven in open air at 45 °C for 24 h.
Before starting the synthesis, the anion solution, containing distilled water and fluorescein disodium salt, showed a yellowish–greenish fluorescence typical for low concentrated fluorescein solutions. By adding the cations, the fluorescence disappeared and the final LDH slurry, directly after synthesis, showed a milky, dark yellow–orange colour. Afterwards, the LDH slurry was evenly distributed into four glass containers and centrifuged to separate the solid from the solution. This process removed any weakly adsorbed fluorescein from the sample. Only the LDH phase showed this dark yellow–orange colour. The separated, supernatant solution was clear and showed no visible fluorescence.
Based on pre-tests, that were carried out to reveal the smallest traceable amounts of fluorescein dye using available lab equipment as well as field equipment, it was decided to incorporate into the sample only very small amounts of fluorescein. Thus, intercalation of the fluorescent dye into the structure of the LDHs was not expected, but instead an external adsorption of the fluorescent dye onto the surface of the LDHs was considered more likely.
Four samples with different amounts of fluorescein were synthesized. Samples were labelled regarding the composition of the main layer as either MA-fluoX or CA-fluoX, with X indicating the percentage of the stoichiometric amount of fluorescein disodium salt used for the synthesis of the specific LDH. For instance, CA-fluo1 corresponds to a Ca,Al-LDH sample for which 1% of the stoichiometric amount, needed to balance the net-positive charge of the main layers of the LDHs, of fluorescein disodium salt was used.

2.2. Methods

The chemical composition of the studied samples was determined using an inductively coupled plasma optical emission spectrometry. The crystalline phases were identified with powder X-ray diffraction. Thermal studies were performed on all synthesised samples. Furthermore, Fourier transform infrared spectrometry was carried out to identify characteristic absorption bands. Specific surface area was characterized by nitrogen adsorption at −196 °C and evaluated based on the Brunauer–Emmett–Teller (BET) method [40]. Particle size distribution using laser diffraction was carried out to calculate the particle size of all synthesised samples. Calculations were based the on Frauenhofer and Mie theory [41,42]. All used methods are described in detail in previously published studies by the authors [8,14].

2.3. Dectectability of Fluorescent LDHs Using an Optical Image Profiler

On site pre-tests of the synthesized samples were carried out at a test site in Denmark. To simulate the tracing of injected particles they were placed in synthetic ground water as well as in a sandy medium and their fluorescence was evaluated using an OIP-G system (Geoprobe Systems®). The system uses a high intensity light emitting diode as a light source emitting at a wavelength of 520 nm. A portion of 5 mg of the particles were filled in quartz cuvettes and suspended in 4 mL of synthetic groundwater containing 120 mg/L Ca2+, 20 mg/L Mg2+, 20 mg/L Na+, 340 mg/L HCO3, 30.8 mg/L Cl and 99 mg/L SO4 with a pH value of 8. Additionally, two measurements were done by adding some clean quartz sand (>96 wt% SiO2, geometric mean grain size from 0.18 to 0.71 mm) to the particle–groundwater mixture to simulate subsurface conditions. The cuvettes were put in a black non fluorescent cuvette holder, to exclude ambient light during the measurements, and placed together directly on the measurement window of the OIP equipment to achieve the best possible results. A detailed description about the OIP and the corresponding methodology has been previously reported by one of us [43].

3. Results and Discussion

3.1. Characterisation of Synthesised Materials

3.1.1. ICP-OES

Element chemical analysis data for Ca, Mg, Al, and Na for all synthesised samples are given in Table 1; the calculated Ca/Al and Mg/Al molar ratios are also included. Sodium was analysed to reveal possible impurities of the synthesised samples due to insufficient washing of the samples.
The metal cation molar ratios were somewhat lower than the expected ones, according to the stoichiometry of the reagents used in the reaction media. The Mg/Al molar ratio of sample MA-fluo2 was close to the pursued value of three with a deviation of 8%. The Ca/Al molar ratio of the Ca,Al-LDH samples was close to the expected value of two, while sample CA-fluo0.2 showed a maximum deviation of 15%. Nevertheless, these values were acceptable within the scope of this study and in the range that is usually accepted to yield well-defined hydrotalcite- and hydrocalumite-like structures [44,45]. As the amount of fluorescein used was well below the stoichiometric value to balance the positive charge in excess in the brucite-like layers, other anions, such as nitrate ions, from the original salts used to prepare the samples, were expected to be intercalated to balance the net positive charge of the main layers.

3.1.2. Powder X-ray Diffraction

All studied samples showed diffraction patterns typical for layered double hydroxides with the hydrotalcite- and hydrocalumite-like structures.
The pattern for sample MA-fluo2 (Figure 1, top) shows a first peak at 10.3° (2θ) (d-spacing = 8.5 Å), which was caused by reflections of the (003) planes in the hydrotalcite-like structure with a rhombohedral 3R stacking of the main layers [27,44]. Here, the lattice parameter c corresponded to three times the d-spacing value of this peak (c = 25.63 Å). Lattice parameter a corresponded to twice the d-spacing value of the peak at 60.7° (2θ), which was caused by reflections by the (110) planes. Although the intensity of the diffraction due to (110) planes seemed to be abnormally intense, there are previous reports in the literature where this peak was also very intense [46,47,48]. Spacing of peak (110) corresponded to one half of the average distance between two neighbouring atoms in the main layers. Compared to data published for carbonate intercalated hydrotalcite [8,44], the natural analogue, the value obtained here for lattice parameter a was in very good agreement, and lattice parameter c was slightly larger than that of the carbonate analogue indicating a slightly increase in the interlayer spacing.
The peaks recorded in this diffraction pattern fit rather well to those of a nitrate-intercalated Mg,Al-LDH; only the very weak and broad peak around 5° (2θ) could not be ascribed to this phase. The literature [27,29] reported an interlayer spacing for fluorescein intercalated LDHs of 12 or 17 Å, corresponding to first peaks at 7° (2θ) or 5° (2θ), respectively.
The fluorescein molecule is almost planar, and has a triangle shape, with a base length of 10.87 Å and a height of 8.64 Å. The width of a brucite-like layer is ca. 4.8 Å [44,49,50] and the spacing found for the diffraction by the (003) planes was somewhat larger than the sum of both values, so we could tentatively conclude that the peak at 5° (2θ) might be caused by a phase with intercalated dianionic fluorescein. The most probable orientation of dianionic fluorescein within the interlayer of LDHs is still a point of discussion and different theories were recently proposed by various research groups [27,29]. They report an interlayer distance of 12 Å [29] or 16.5 Å [27] caused by intercalated dianionic fluorescein arranged in a bilayer. If the peak at 5° (2θ) is caused by a dianionic fluorescein intercalated phase, the resulting interlayer spacing of 17.5 Å would be in very good agreement with the value reported by Lee et al. [29]. Due to the very small concentration of fluorescein in the solid mixture, only the most intense peak, caused by diffraction on (003) planes at 5° (2θ), was recordable.
PXRD patterns of the fluorescein containing Ca,Al-LDHs (Figure 1) are very similar to each other. All of them showed a first peak at ca. 10° (2θ), (d-spacing = 8.6 Å) which here corresponded to reflections by the (006) planes of hydrocalumite-like structure with a rhombohedral 6R stacking of the main layers [45,51]. Consequently, lattice parameter c here corresponded to six times the spacing of this first peak. The gathered values of the studied Ca,Al-LDHs were very similar indicating no significant structural differences due to the presence of different amounts of fluorescein in the sample. Lattice parameter a of the synthesised Ca,Al-samples differed significantly from that of the Mg,Al-sample. Due to the insertion of the larger calcium cation, the main layer of the resulting LDHs was slightly deformed as the distances between neighbouring atoms were increased [45,51]. The studied Ca,Al-samples showed a value of ca. 5.75 Å, which was in very good agreement with values reported in the literature (5.72 Å) [45,52]. It must be mentioned that all Ca,Al-samples showed a broad peak in the range of the first peak indicating stacking faults in the samples [53]. Similarly to the Mg,Al-samples, the c values of the Ca,Al-samples were slightly increased compared to the literature values reported for natural analogues (11.4° (2θ), 7.7 Å) [45,52] indicating an increased extension of the interlayer space. It should be noticed again that the values calculated here for the interlayer spacings do not fit to those published by Costantino et al. [27] and Lee et al. [29] for fluorescein intercalated hydrotalcite-like materials. On the contrary, those values are in very good agreement with values reported by Tanaka et al. [28] for Mg,Al-LDHs with very low amounts of intercalated fluorescein. Tanaka and colleagues postulated that low amounts of fluorescein can either be intercalated as the dianionic form and oriented as a monolayer in the interlayer of the LDH or be adsorbed on the external surface of the LDH [28]. Both variations would lead to interlayer spacings similar to that of the compared natural analogues or nitrate LDHs, as observed in the Ca,Al-samples studied here. Due to the similarity between the position of the main peak (001) of a nitrate intercalated Ca,Al-LDH with externally adsorbed fluorescein, and a Ca,Al-LDH with low content of fluorescein in the interlayer, as described by Tanaka et al. [28], a clear distinction between the two types is not possible with PXRD.
The PXRD pattern of the synthesised samples showed rather broad peaks for sample MA-fluo2, but very sharp, more intense ones, for Ca,Al-LDH samples, indicating different crystallite sizes. Calculated crystallite sizes of the studied sample are included in Table 2. Calculations were based on the Scherrer equation [54] and carried out on the first peak of each sample, as this corresponds with the maximum spacing of the LDH in c-direction. In other words, the values reported in this table correspond to the length of the crystallites in the direction perpendicular to the layers.
To achieve sufficiently crystalline, easily characterizable materials, longer aging times were selected based on information given in the literature and our previous studies regarding the synthesis of these materials [8,14,32,33]. In case of a potential injection, shorter aging times should be selected to produce particles of smaller sizes; those are supposed to be more reactive and less time consuming with respect to the economic aspects regarding an upscaling of the synthesis procedure. The different crystallite sizes of the samples are supposed to be a result of different aging times used for the Mg,Al-sample (one day) and the Ca,Al-samples (six days).

3.1.3. Thermal Analysis and Evolved Gas Analysis

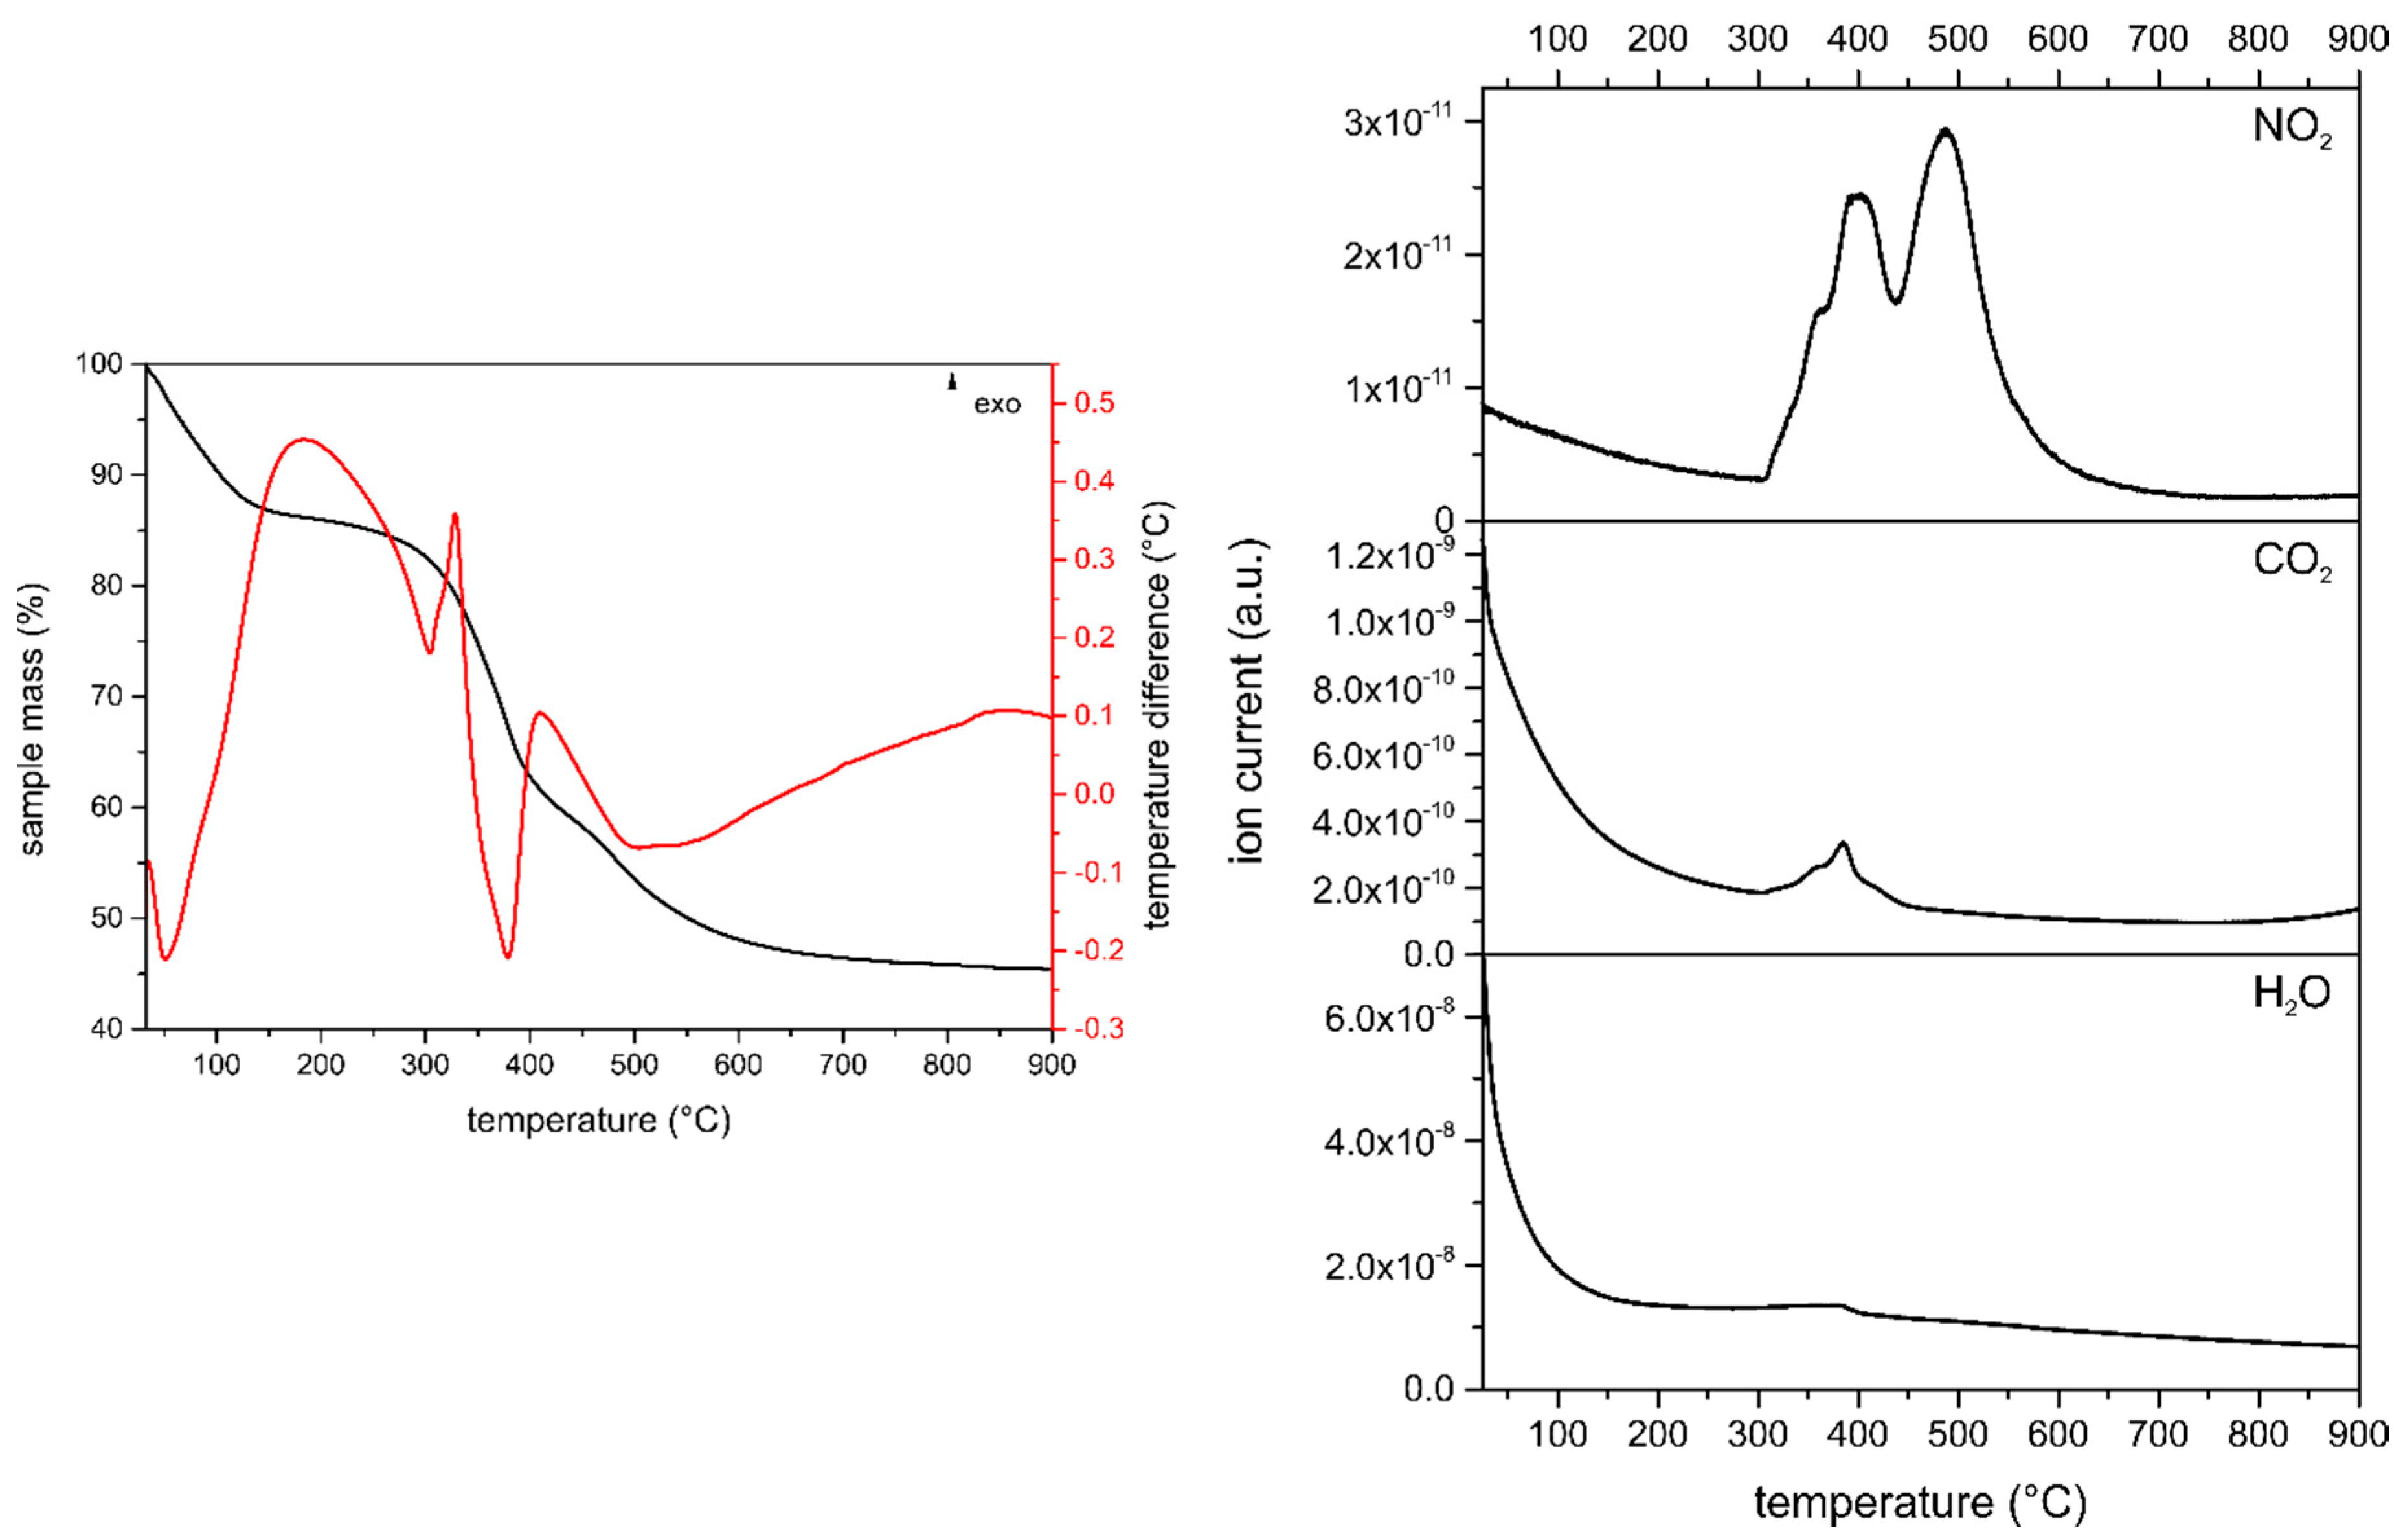
All synthesised samples were studied regarding their thermal stability using thermogravimetry (TG) coupled with differential thermal analysis (DTA). Mass spectrometry (MS) was simultaneously used to analyse the gases released during the heating process. All curves are included in the Supplementary Material Section (Figures S2–S5), and those for sample MA-fluo2 are given as an example in Figure 2.
Results of the synthesised samples revealed a stepwise thermal decomposition resulting in four mass loss events, as expected for layered materials related to hydrotalcite- and hydrocalumite-like structures [55]. Table 3 summarizes the recorded mass losses as well as the evolving gases of each thermal event for the studied samples.
For all studied samples, the first mass loss could be assigned to the removal of physisorbed water on the external surface of the LDH and of the interlayer water. The DTA curves revealed very intense endothermic peaks for the Mg,Al-sample and medium intensity endothermic peaks for the Ca,Al-samples in the same temperature range. Surprisingly, the peak for the mass-to-charge-ratio (m/z) of 18 (H2O+) was only recorded in the MS spectra of the Ca,Al-LDH samples, but only as a very weak peak for sample Mg,Al-LDH. Upon increasing the temperature, the behaviour of the Mg,Al-LDH and Ca,Al-LDH samples was quite different and will thus be described separately.
A second mass loss was recorded between 195 ° and 420 °C for sample Mg,Al-LDH, due to the decomposition of the interlayer phases and the condensation and loss of hydroxyl groups from the main layer as water molecules, as confirmed by the MS spectrum. MS peaks were recorded at m/z = 18 (H2O+), CO2 (m/z = 44, CO2+), and NO2 (m/z = 46, NO2+). The NO2 was caused by the decomposition of interlayer nitrate. The peak due to CO2 might be caused by the decomposition of the small amount of fluorescein existing in this sample, as under oxidic conditions, this would lead to the evolution of CO2 and water vapour, which was detected as well. This finding agrees with the results of the PXRD (Section 3.1.2) and FTIR (Section 3.1.4) measurements. The MS spectra together with the DTA diagram, which showed two endothermic events in the discussed temperature range, indicated a stepwise process involving several reactions. Upon increasing the temperature up to 640 °C a third significant mass loss occurred which was, as seen in the MS spectrum, due to the continuing release of the intercalated nitrate species. There, a slightly larger peak for NO2 was recorded compared to that in the previously discussed temperature range. A last, and very small, mass loss was recorded above 640 °C. It can be assumed that this corresponds to a release of gases, which were already formed at the beginning of the decomposition but occluded within the solid and released only at very high temperatures [56]. Decomposition of fluorescein in a combustion process should give raise to an exothermic effect, but due to the small amount of fluorescein in the sample and probably, to the fact that the process should take place in a broad temperature range, such an exothermic effect was not recorded, or it might be cancelled by the stronger endothermic effects.
For the Ca,Al-LDH samples a second mass loss was recorded up to 350 °C, which, in contrast to the aforementioned Mg,Al-LDH sample, was only caused by condensation of the main layer hydroxyl groups leading to water vapour formation; weak peaks for m/z = 18 (H2O+) were recorded in the MS spectra. The DTA curves showed medium intensity endothermic events in this temperature range. Upon increasing the temperatures up to 625 °C, a third mass loss occurred, which could be assigned to the release of the intercalated nitrate species as evidenced in the MS spectra by a rather large peak for NO2 (m/z = 46, NO2+). Contrary to the discussed release of the nitrate species from sample MA-fluo2, both the MS spectra as well as the DTA curves revealed that the nitrate species were released from the Ca,Al-LDH samples in a single event. During the fourth and last mass loss event, at temperatures above 620 °C, the MS spectra of the studied Ca,Al-samples showed peaks for CO2 (m/z = 44, CO2+), which were most likely a result of the decomposition of the fluorescent dye, although the expected peak due to water release was not recorded.
The calculated formulas of the studied compounds, which were based on the results of the TG-DTA-MS analyses, are given in Table 4. The content of magnesium, calcium, and aluminium were calculated based on the results of the ICP-OES analyses (see the raw data in Table 1). The water content in the interlayer was calculated from the results of the thermal analyses of the solids. The nitrate content included was calculated based on the electrical balance between the main layers and the interlayer.

3.1.4. Fourier Transform Infrared Spectroscopy

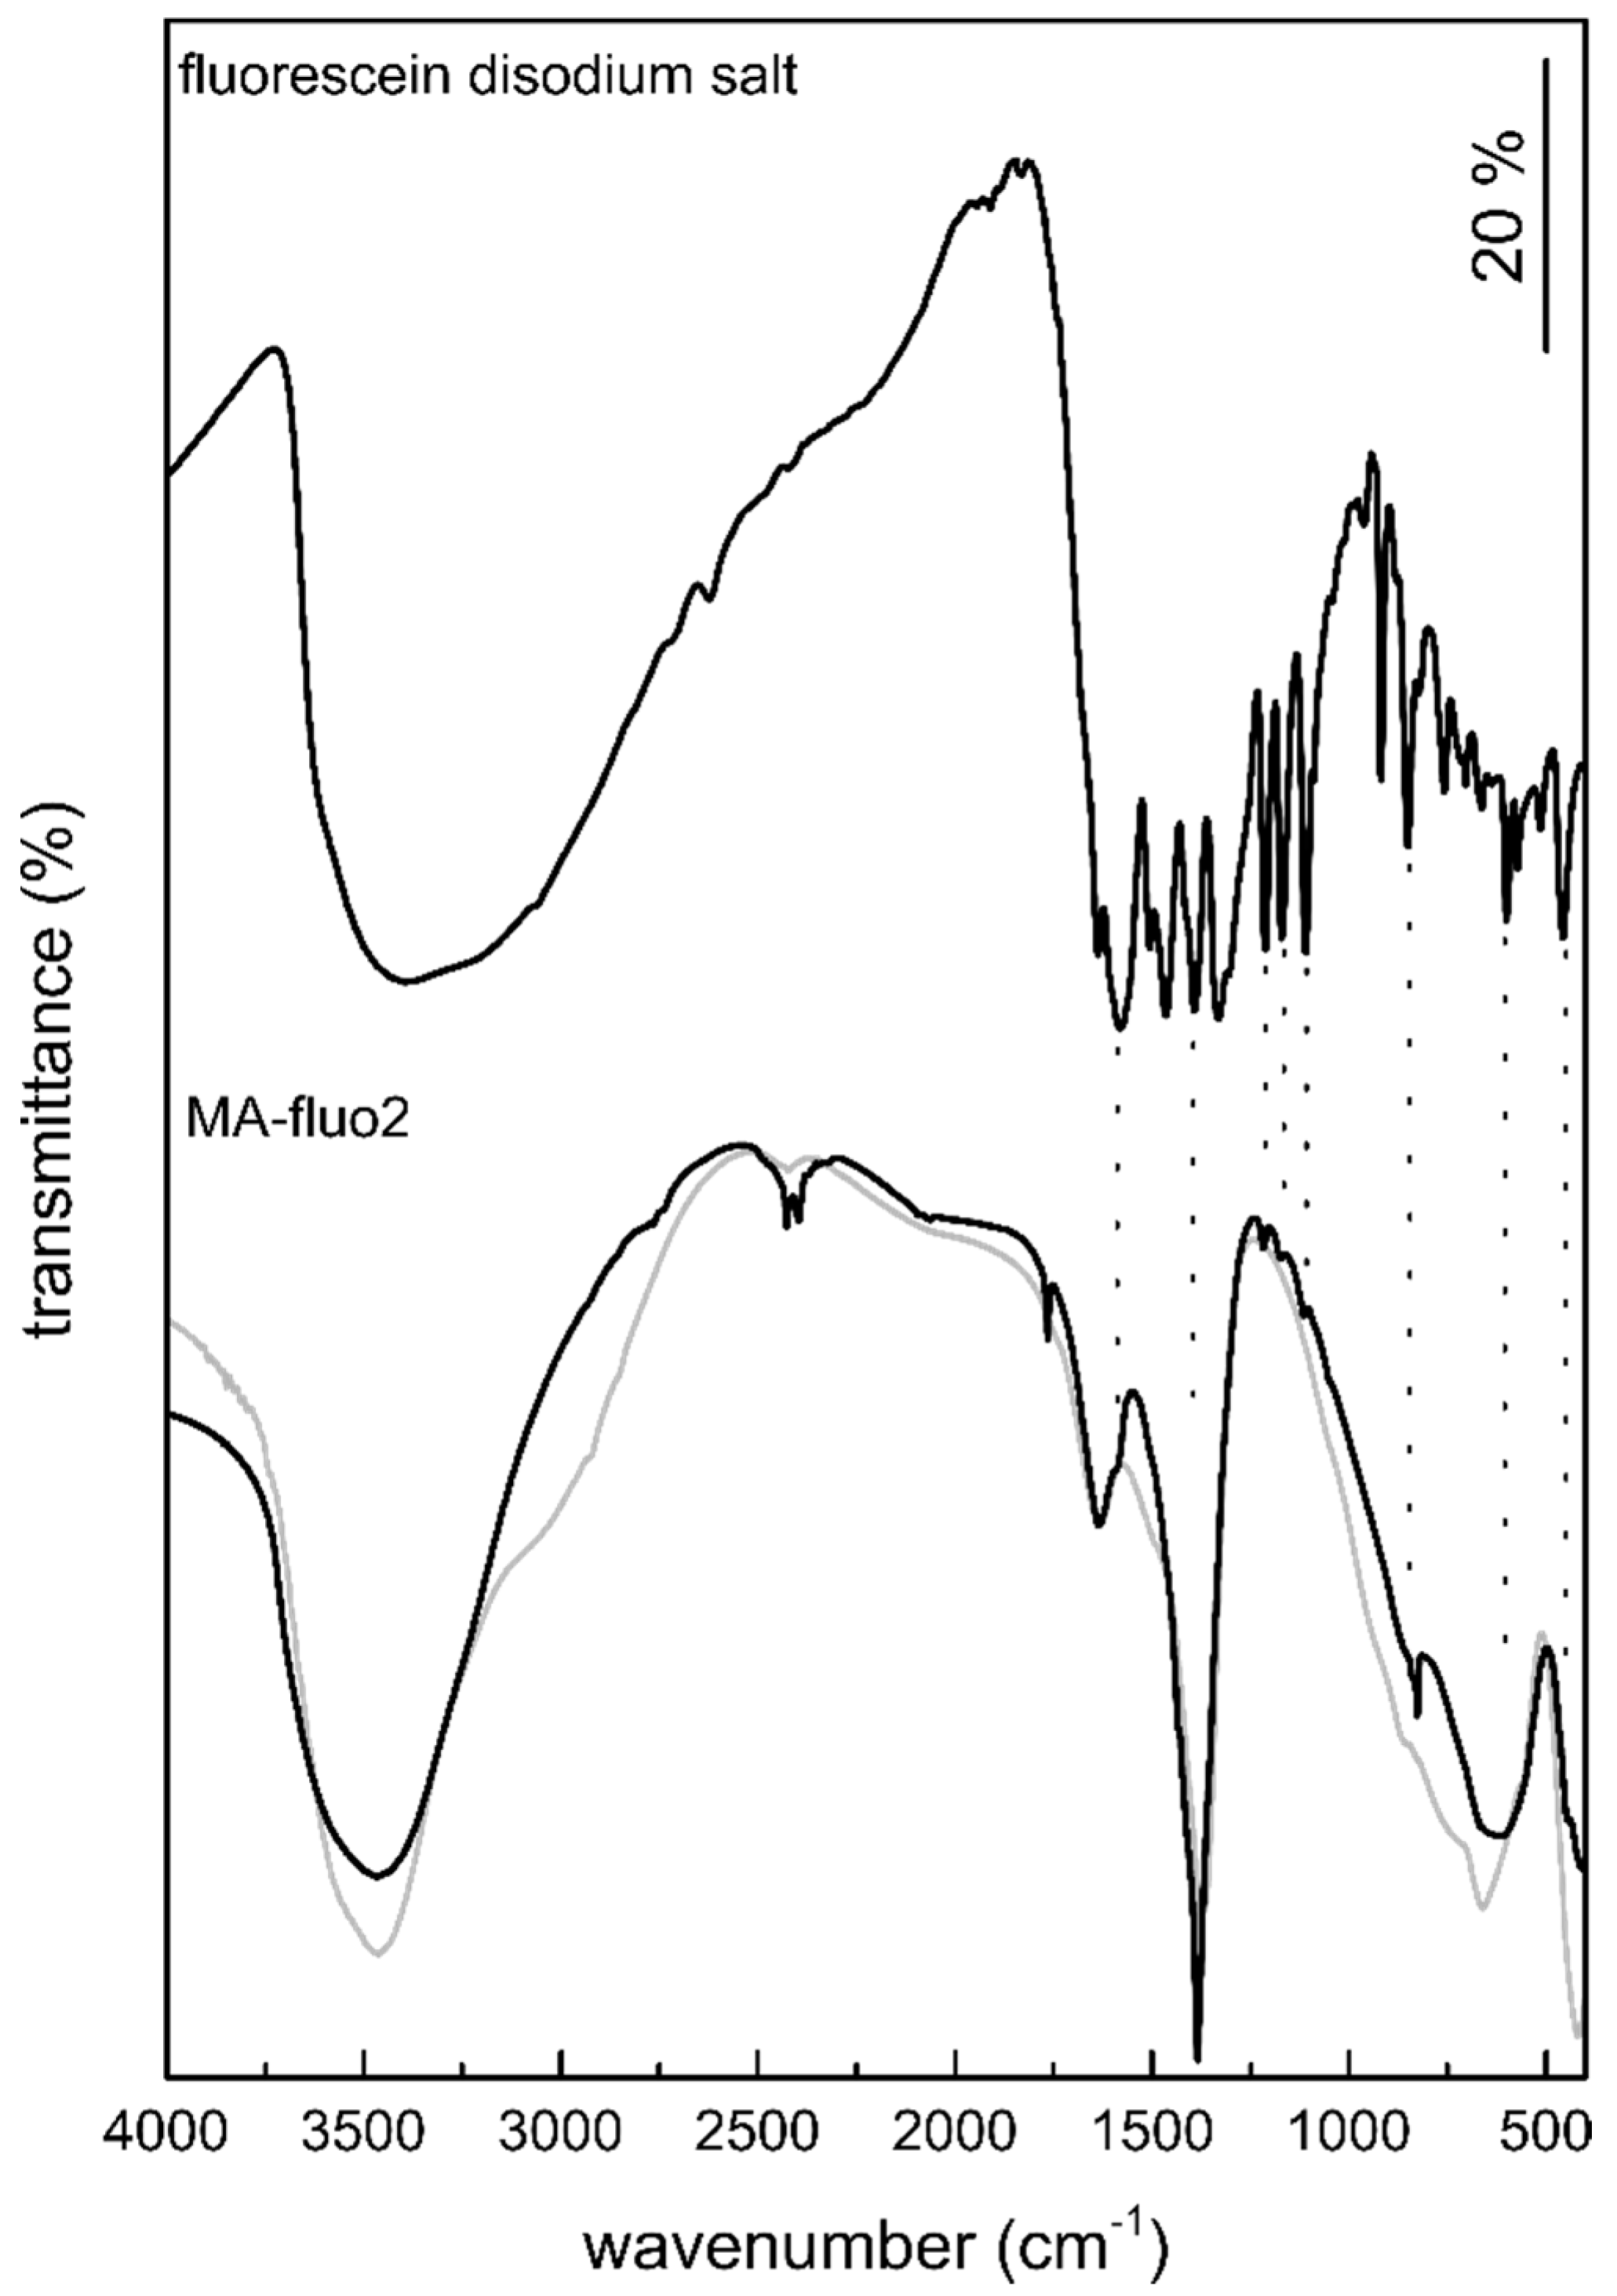
All synthesised samples were studied using FTIR spectroscopy. All spectra showed absorption bands that are typical for layered hydrotalcite- and hydrocalumite-like materials. These bands are caused by vibrations of the hydroxyl groups in the main layers and the interlayer, the intercalated anions, and lattice vibrations in the main layers [57,58,59,60,61]. The spectrum of sample MA-fluo2 is shown in Figure 3; spectra of all samples are included in the Supplementary Materials section (Figures S6–S9).
For the Mg,Al-sample a rather broad absorption band was recorded between 3630–3380 cm−1, due to the stretching vibrations of the hydroxyl groups, both in the interlayer and the main layers, of the studied LDH and the water molecules. The broadening of the band is due to hydrogen bonds between these species [58]. Vibrations of the hydroxyl groups in the main layer corresponded to the first band at 3640 cm−1 and those of the interlayer water resulted in the second, broader, band between 3500–3425 cm−1. All spectra showed intense absorption bands at 1380 cm−1 which were most likely caused by the vibrations of intercalated nitrate species [57,60,61,62,63]. Absorption bands below 750 cm−1 could be assigned to bending vibrations of the metal hydroxyl groups in the main layers [57,59,61,62,63]. Metal-hydroxyl translation modes in the crystal lattice of the studied LDHs were recorded as absorption modes below 700 cm−1 [57,58].
All FTIR spectra of the studied samples were compared to that of the unintercalated fluorescein disodium salt, showing a variety of absorption bands ranging from 1600 to 500 cm−1, in order to easily detect absorption bands caused by the fluorescent dye. The spectra of the studied fluo-LDHs showed only very weak absorption bands doubtlessly caused by a divalent fluorescein anion, as expected due to the very low fluorescein content of the samples. The most intense peak in this region at 1380 cm−1 is due to a υ3 stretching vibration mode of intercalated nitrate [63]. The spectra closely resemble those of the reference samples, Mg,Al- as well as Ca,Al-LDHs, with intercalated carbonate (grey lines). The doublet recorded in some of the spectra around 2300–2250 cm−1 resulted from a miscancellation of the atmospheric CO2 band.

3.1.5. Fluorescent Dye Stability Tests

Stability tests were carried out on the fluo-LDH samples to evaluate the stability of the externally adsorbed fluorescein-LDH compounds: if the fluorescein is easily released in aqueous suspension, the potential use as a novel tracer material has to be reassessed. To determine the stability of the synthesised fluo-LDHs, a portion of the dried sample material was transferred into small sample bottles filled with de-carbonated and de-ionised water (measured pH value of 7). After 24 h, the solution was replaced by fresh water, the UV–vis spectrum of the liquid was recorded, and the samples were left in suspension for several months. The UV–vis spectrum of the supernatant liquid was periodically recorded to reveal changes in the fluorescent dye concentration in solution. Tests revealed that the fluorescent dye concentration in solution remained constantly low (close to the detection limit) even after six months, confirming a somewhat strong bond between the fluorescent dye and the LDH.

3.1.6. Fluorescing Ability

Based on these findings, all samples were examined under ultraviolet A light (400–315 nm) to confirm their fluorescing ability. Figure 4 exemplarily shows the results of this test carried out on sample CA-fluo0.2, the sample with the lowest amount of intercalated fluorescent dye.
Under visible light the fluorescent LDHs did not show any sign of fluorescence; the dried LDH powder appeared orange, the lighter the less fluorescent dye was used during the synthesis. Under ultraviolet A light the dried powder showed a yellowish fluorescence. In suspension, the single LDH particles could easily be distinguished due to their strong yellowish–greenish fluorescence. No fluorescence was observed in the supernatant liquid. Additionally, a very small amount, some grains, of the fluorescein disodium salt, were dispersed in distilled water to compare the fluorescing potential of the studied LDHs with that of the commonly used fluorescent dye. Under visible light the solution appeared dark yellowish showing a visible greenish fluorescence on the water surface. Under ultraviolet A light the fluorescein solution showed the yellowish–greenish fluorescence typical for low concentrations of dye in water. Fluorescent streaks were visible due to the quick dissolution of the fluorescein disodium salt. As both the fluorescent LDHs and the fluorescein solution showed similar fluorescence upon excitation with ultraviolet A light, it can be proposed that the adsorption or incorporation of the fluorescent dye onto into the LDHs had no influence on the fluorescing ability of the fluorescent dye.

3.1.7. BET Measurements

To determine the specific surface areas of the synthesised samples, adsorption–desorption studies of N2 adsorption at −196 °C were carried out. The isotherms are included in the Supplementary Material Section (Figures S10–S13) and the values determined for the BET specific surface areas are given in Table 5.
All studied samples showed isotherms corresponding to type II in the International Union of Pure and Applied Chemistry (IUPAC) classification [64] indicating adsorption on non-porous or macroporous surfaces, with unrestricted monolayer–multilayer adsorption [65]. The isotherm of sample MA-fluo2 exhibited a rather broad shaped hysteresis loop type H2, which is commonly found for disordered materials with an ill-defined distribution of pore size and shape [64,65]. The specific surface area shown by this sample is surprisingly small, bearing in mind the rather soft ageing treatment to which the sample has been submitted. Such a small specific surface area has not been found even for samples submitted to hydrothermal treatment for several days after synthesis [58].
Isotherms of the Ca,Al-samples showed very narrow, nearly absent, hysteresis loops of H3 type, which is typical for the N2 adsorption on non-porous or microporous materials formed by non-rigid aggregates of plate-like particles with slit-shaped pores [64,65]. The specific surface areas calculated for these three samples are in the expected range for this sort of material. Probably the ageing treatment of six days has favoured an Ostwald ripening [66,67], removing the very small, tiny particles and thus avoiding blocking of the pores of the large particles.
It can be assumed that the surface texture of the samples was most likely a result of the different aging times and slight alterations in the drying process, which can result in a stronger aggregation of the particles. Overall, there are no significant differences among the values determined for the Ca,Al-LDH samples, suggesting that the fluorescein content has no significant effect on the surface texture of the samples studied here. The observed changes are probably caused by minor variations during the drying process.

3.1.8. Particle Size Distribution

The particle size distribution was evaluated for samples MA-fluo2, CA-fluo2, and CA-fluo0.2 using dried sample material (subsequently labelled with the suffix dry) as well as the freshly prepared and still wet LDH slurry (subsequently labelled with the suffix wet) to determine the influence of the drying process as well as the amount of fluorescent dye on the resulting particle size distribution. Single curves are included in the Supplementary Materials section (Figures S14–S19).
Measurements of the sample MA-fluo2-dry, Figure 5, revealed a maximum at ca. 340 μm with a sharp decrease in the curve progression for values above this maximum. For values below this maximum the curve progression was somewhat more steady, even revealing small shoulders at ca. 35 and 3 μm. Upon increasing times of ultrasound treatment, a new maximum was developed at around 40 μm with a shoulder at 6 μm, while the intensity of the first maximum was strongly decreased. The curves of the measurements on sample MA-fluo2-wet differed significantly from those of the dry material. For the untreated sample, a maximum at about 7 μm was revealed with a sharp decrease in the curve progression for values above and below this maximum. Additional rather weak maxima were revealed at 60, 340, and 1180 μm. Application of up to 15 min ultrasound treatment resulted in the decrease in the first maximum (7 μm) accompanied by the formation of a shoulder at ca. 3 μm. The second maximum was shifted to ca. 85 μm, while the third and fourth merged forming a new maximum at ca. 510 μm; a small shoulder was formed at 1350 μm.
These results suggest that the primary crystallites aggregated during drying and that their separation by ultrasound treatment might be tricky. Even after 15 min of ultrasound treatment, two new maxima developed at ca. 6 and 40 μm, but that formed at 340 μm still remained with a large intensity. However, if the sample is kept wet in a slurry and the particle size distribution straightforwardly studied with no drying step, a monomodal size of 7 μm could be found. Application of ultrasounds resulted in the development of many peaks, indicating a rather random distribution of particle sizes. Particles with sizes above 7 μm increased their contribution, while those with an original size of 7 μm split showing a new contribution by particles of ca. 3 μm.
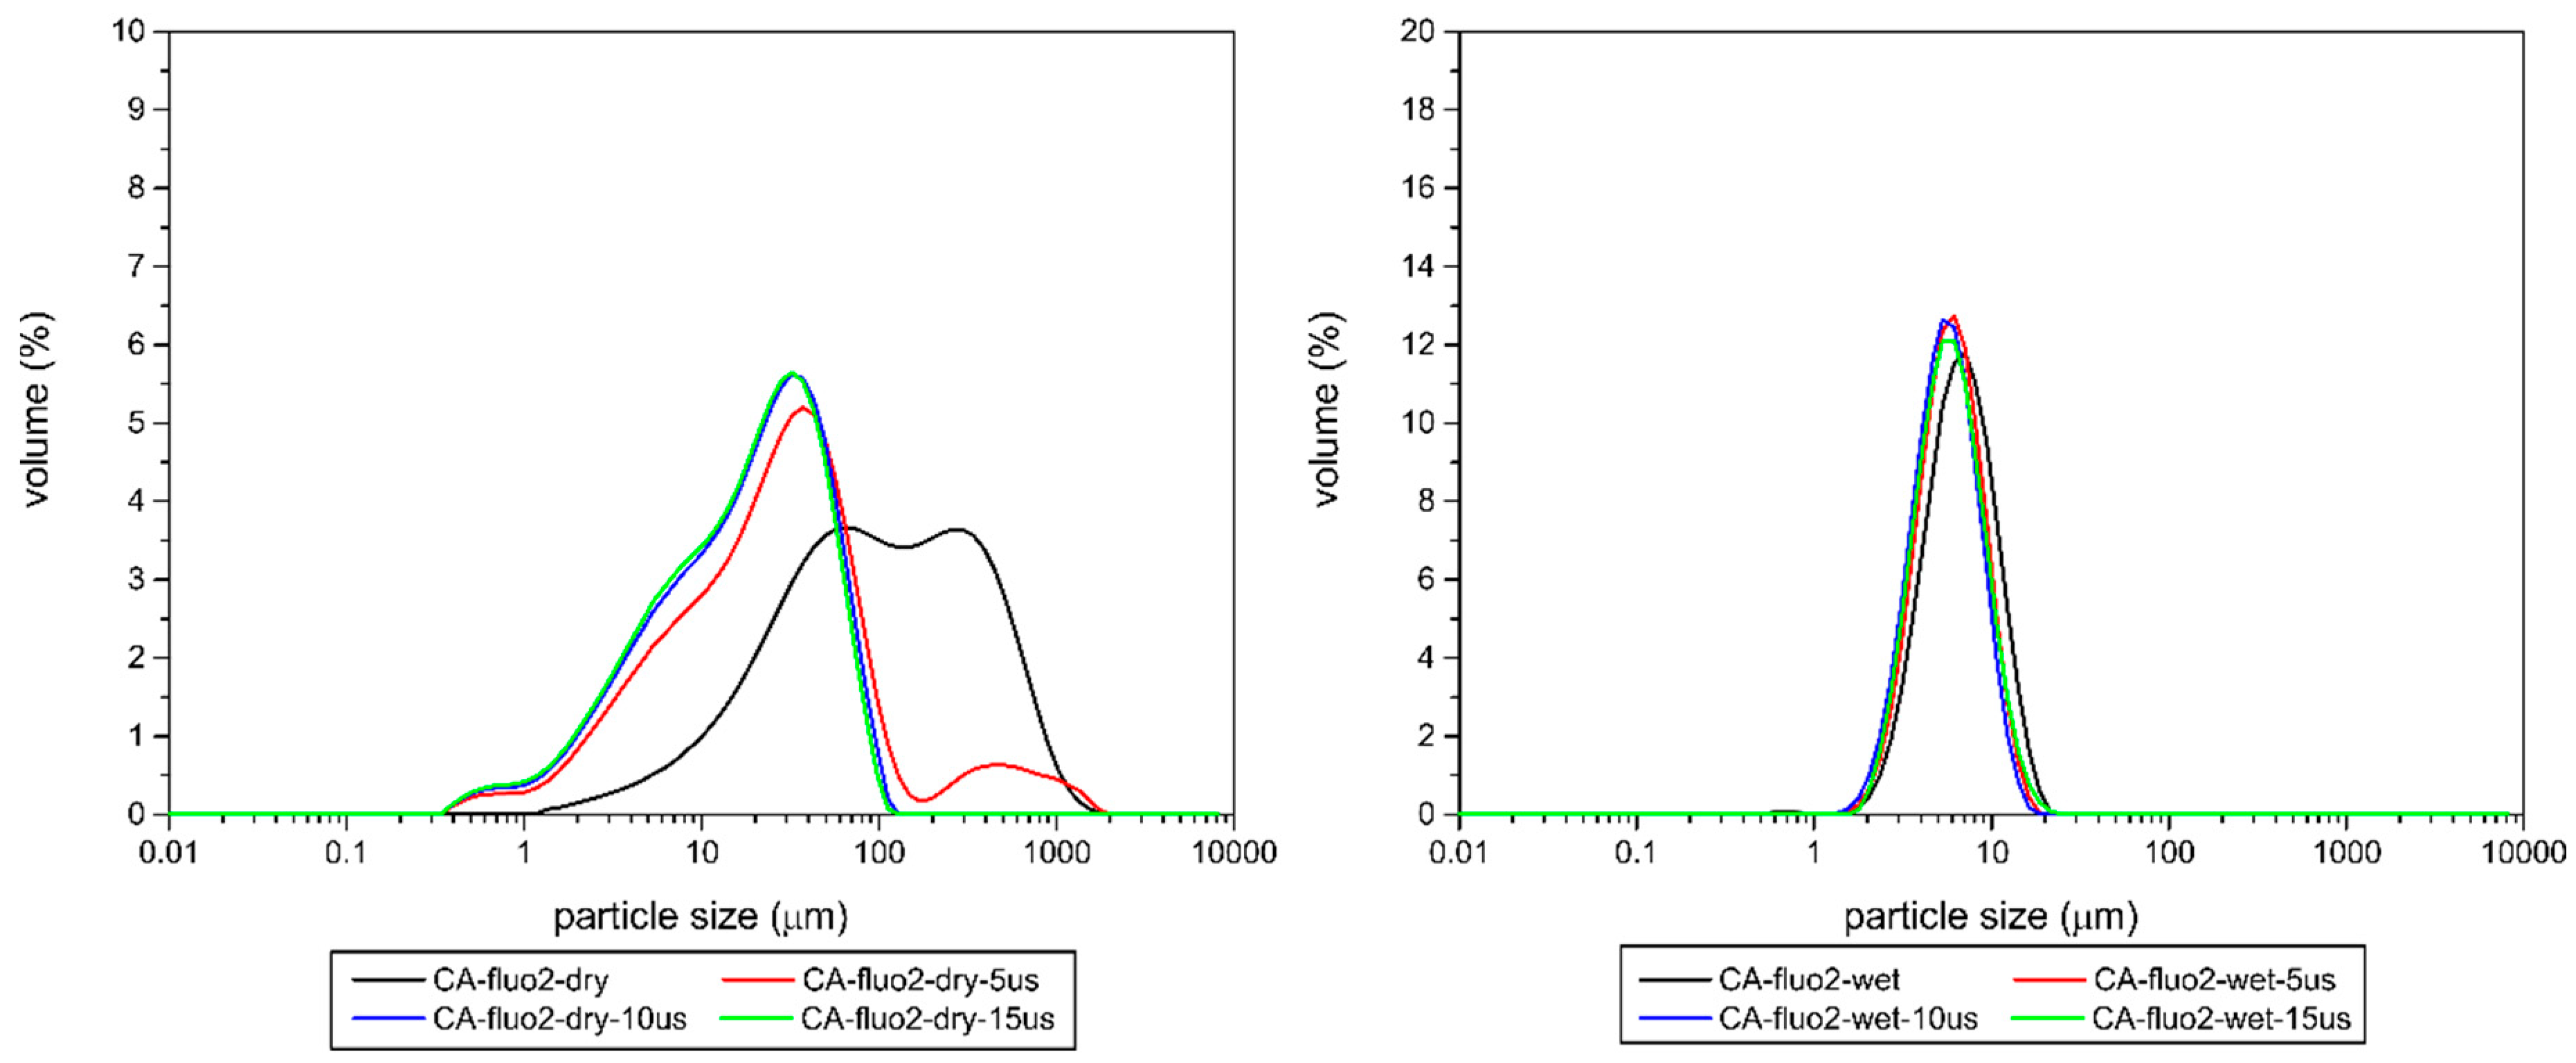
The curve of the untreated sample CA-fluo2-dry, Figure 6, showed two maxima at ca. 65 and 290 μm with a rather sharp decrease in the curve progression for values above the maximum. The curve progression for values below this maximum was slightly steadier. After 5 min under ultrasound treatment the maximum at 65 μm disappeared and the maximum at 290 μm was shifted to ca. 440 μm, with a small shoulder at 1170 μm. A large peak developed at ca. 37 μm with weak shoulders at 5 and 0.5 μm. Upon increasing times of ultrasound treatment, the maxima above 100 μm disappeared and the maximum at 37 μm shifted to ca. 30 μm, still showing the aforementioned shoulders. The curve of the particle size distribution of the undried LDH slurry of sample CA-fluo2-wet differed significantly of that of the dried sample material. It showed a unimodal particle size distribution with a maximum at ca. 7 μm, which is shifted towards smaller values (ca. 6 μm) upon increasing times of ultrasound treatment, but without development of new maxima. These data again support the importance of the drying step to form larger particles, hardly disaggregated under ultrasound treatment.
Finally, the curves for sample CA-fluo0.2-dry, Figure 7, showed a somewhat different behaviour. The curve of the untreated sample showed a rather broad maximum at around 200 μm with steady decrease in the curve for values above and below the maximum. A shoulder was revealed at ca. 8 μm. Upon extending ultrasound treatment until 15 min the first maximum is shifted towards a smaller particle size (85 μm) decreasing very sharply its intensity, the shoulder evolved into a second maximum at ca. 10 μm, this now being the most intense peak in the diagram, and a third was formed at about 1 μm, with a medium intensity. The curves of the particle size distribution of the undried LDH slurry of sample CA-fluo0.2-wet resembled closely those for sample CA-fluo2-wet. Once again, the curves expressed a unimodal particle size distribution with a maximum at ca. 5 μm, but now with a very small shoulder at 28 μm. Upon increasing times of ultrasound treatment, the shoulder disappeared resulting in an increase in the absolute maximum, showing a rather good monomodal particle size distribution.
Table 6 includes the d(0.5) values, which are defined as the median particle size in μm and divide the population exactly into two equal halves, of the particle size distribution of the samples with 2% and the sample with 0.2% fluorescent dye. On comparing the three samples submitted to this study, we can see that sample Mg,Al-LDH has a contribution by rather large particles, but also a contribution by very small particles, which might be blocking the pores of the large ones, thus accounting for the abnormally small specific surface area of this sample. However, for the Ca,Al-LDH samples studied, the peak corresponding to the larger particles is broader, while the contribution by very small particles is rather small, and in any case lower than for the Mg,Al-LDH sample. Consequently, blocking of the pores in the Ca,Al-LDH samples is avoided (or at least lowered), these samples showing a larger specific surface area than sample Mg,Al-LDH, where a contribution by very small pores is not negligible. As mentioned above, this might be a consequence of Ostwald ripening [65,66].
Table 6 reveals that the particle size distribution of a sample is heavily influenced by the drying procedure, leading to the formation of large agglomerates. Upon ultrasound treatment those express significantly smaller median particle sizes for the dried sample materials, although disaggregation never reaches the values for the undried samples. This is in good agreement with data previously published by the authors, in which the impact of the drying time on the particle size distribution was discussed [8].
For Ca,Al-LDH samples the measurements on the freshly prepared wet sample material revealed no differences in the median particle size on un-treated and treated material. An exception must be made for sample MA-fluo2, which revealed a significantly larger median particle size after ultrasound treatment compared to that of the untreated, freshly prepared sample. This was most likely possible as ultrasound energy can, in some sort of way, help to re-agglomerate very small particles which were previously released during the ultrasound treatment. It is worth mentioning that the median particle sizes of the dried and wet Ca,Al-LDH samples are significantly smaller than that of the Mg,Al-LDH sample. This finding is in very good agreement with previously published results [14], which confirmed that the median particle size also depends on the nature of the main layers of the studied material.
The finding that drying of the samples gave rise to the agglomeration of the particles and that such an agglomeration is less intense (or is even absent) if the samples are kept in a slurry, is very important regarding the potential use of the samples studied here as tracer particles in injection strategies. Using undried sample material is more cost effective and easier to apply, although storing of the slurry is more spacious and therefore more expensive than storing dried solids. Particles can directly be synthesised and applied without prior treatment.
Based on the overall goal of the study, to develop traceable particles that are able to mimic co-injected reactive particles, thus showing similar mobility in the subsurface after injection, comparative studies regarding their particle sizes, one of the most important features of particles when it comes to injections, were carried out to compare the fluorescent LDHs presented here with recently studied reactive LDHs. These reactive LDHs proved to be the best candidates in studies previously carried out and published by the authors [8,14], addressing the removal of chlorinated organic solvents. These potential remediation particles were intercalated with different interlayer anions to cover different reaction pathways of the LDHs with the target contaminants, including long-chain organic anions with various functional groups for an easy retention of the chlorinated organic solvents [8] as well as oxidising agents [14] for their chemical decomposition.
Figure 8 compares the samples studied here, MA-fluo2 and CA-fluo2, to Mg,Al-LDHs intercalated with octadecanoate (MA-17COO), octadecane sulfonate (MA-18SO3), used to adsorb chlorinated organic solvents, and permanganate (MA-MnO4), as well as a synthesised peroxydisulphate intercalated Ca,Al-LDH (CA-S2O8), used for oxidation in previous studies [8,14].
For the dried samples, the maxima of the fluorescent particles in the particle size distribution curve are in quite good agreement with that of previously studied reactive particles, only those for samples MA-17COO-dry and CA-S2O8-dry differ, the latter showing the highest deviation. Maxima of the fluorescent particles, generated using wet sample material, resemble quite nicely those of previously studied reactive LDHs. Here, sample MA-18SO3 revealed the largest deviation leading to the assumption that none of the fluorescent particles studied here would be suitable for this kind of reactant. Nevertheless, several pre-tests proved that the particle size of all studied LDHs can easily be tuned by adjusting the synthesis parameters and the aging time to match those of the fluorescent particles with that of the target reactants.
Table 7 summarizes the median particle sizes of the previously studied reactive samples used here for the comparative studies. It can be seen that the aggregated mean particle sizes of the wet samples are in good agreement with the fluorescent LDHs studied here; sample MA-18SO3 needs to be excluded from this statement as further research is required to better match the particle size of this sample with that of the fluorescent LDHs studied here.
It can be proposed that the fluorescent LDHs studied here could be used as tracer particles in in situ remediation strategies. As the particle sizes of both the fluorescent LDH as well as the studied potential reactants are rather similar, it can be assumed that all those particles might show a similar behaviour after injection. If reactants were co-injected with the fluorescent particles presented here, potential movement of the reactants, most likely caused by groundwater flow, away from the target point of reaction could be traced and a spreading rate of these could clearly be estimated due to the presence of the fluorescent particles.

3.2. Dectectability of Fluorescent LDHs Using an Optical Image Profiler

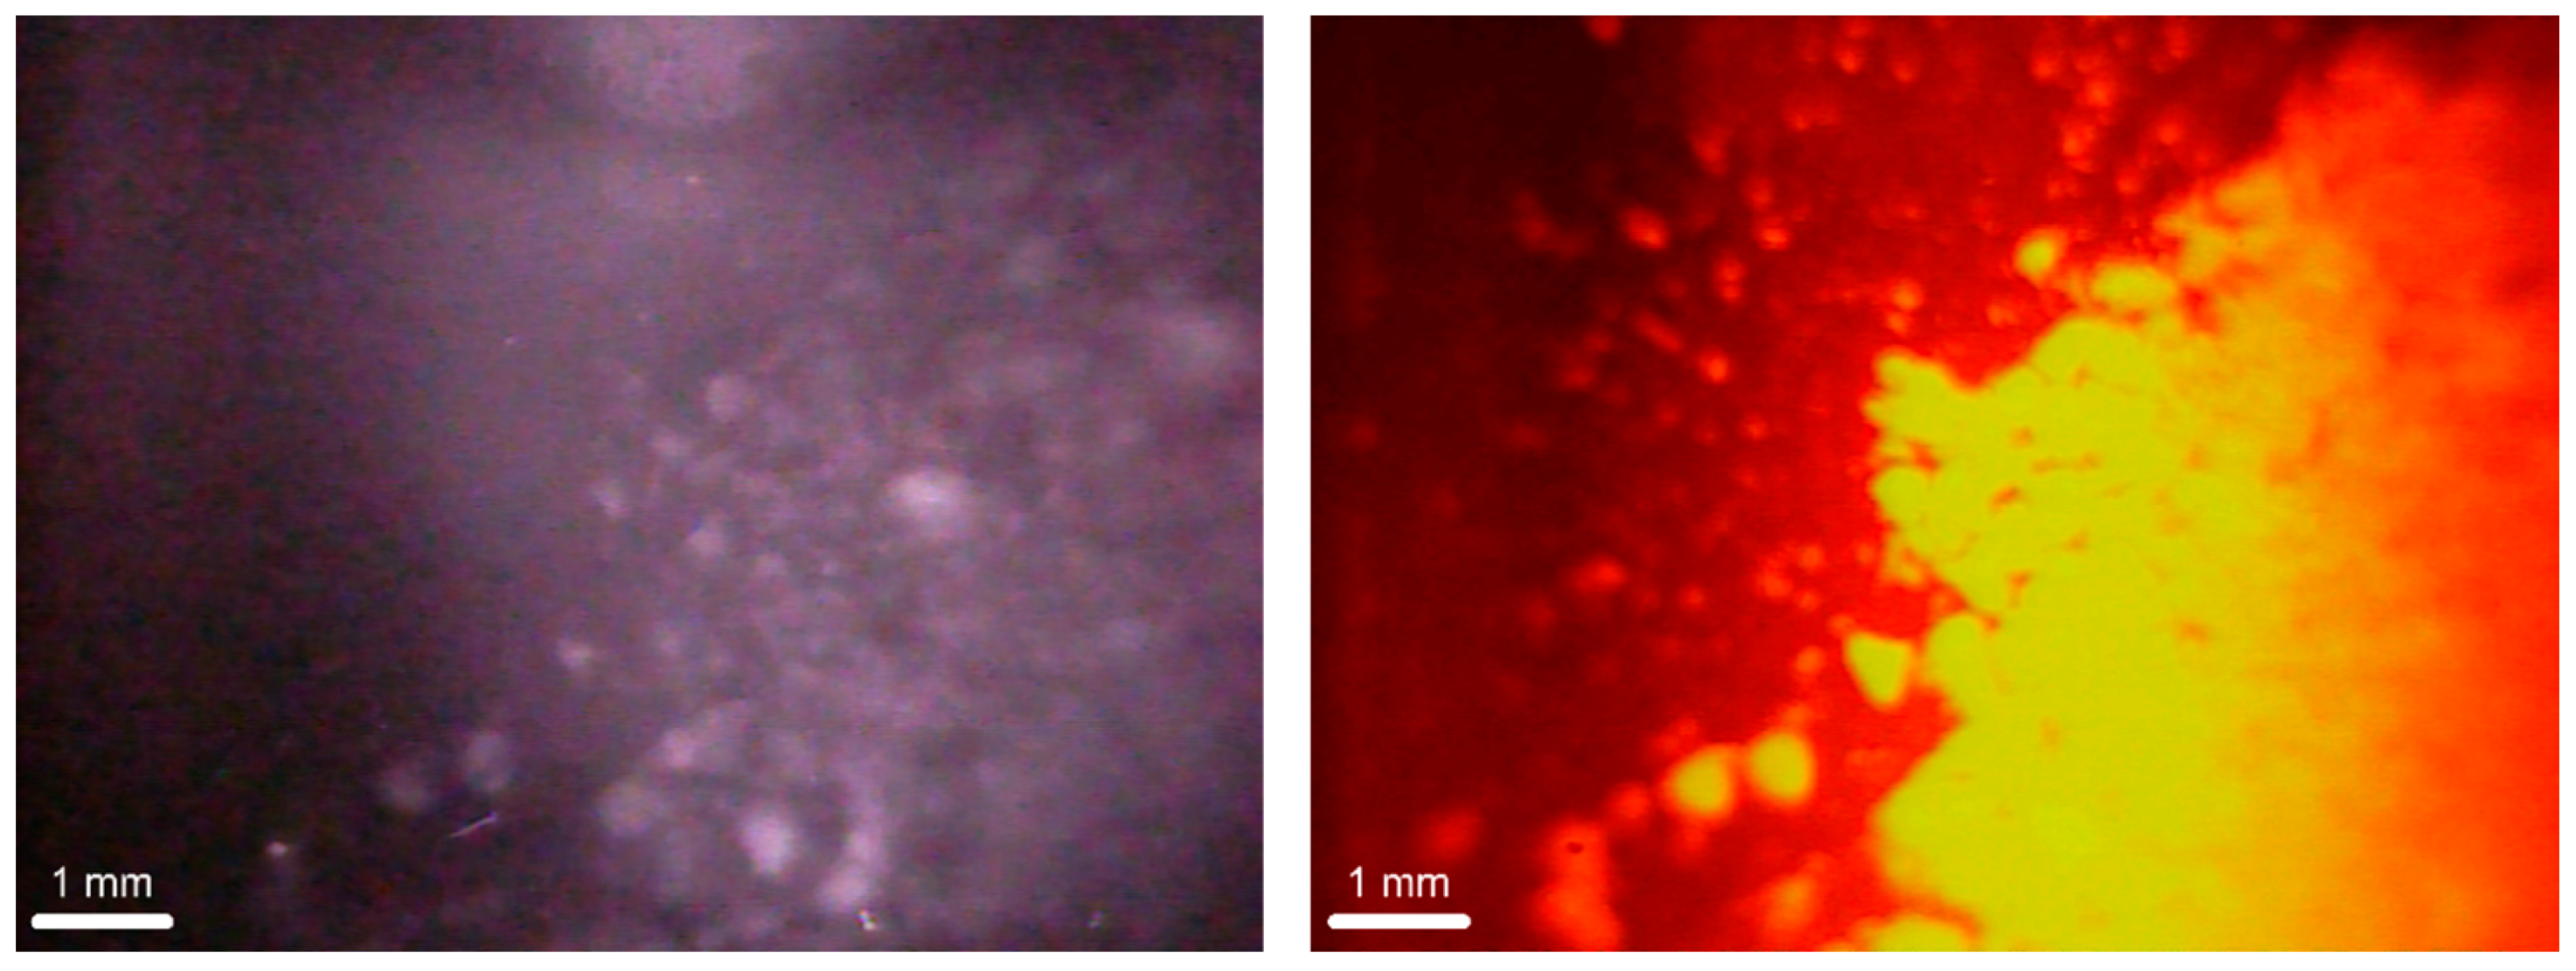
Tests were carried out to investigate the traceability of the studied fluorescent LDHs in the subsurface with an OIP-G system (Geoprobe Systems®) and to estimate the minimum amount of fluorescent dye that is required to trace the particles. Tests were carried out on all synthesised samples in synthetic groundwater, composition given in Section 2.3, and in a quartz sand–synthetic groundwater mixture using samples CA-fluo2 and CA-fluo0.2 exclusively. As an example, Figure 9 shows the results of a test in synthetic groundwater using sample CA-fluo0.2.
Under infrared light, only the largest aggregates of the sample were distinguishable when dispersed in synthetic groundwater. Upon excitation with green light at a wavelength of 520 nm, even the smallest particles were visible and easily distinguishable. Larger aggregates were hard to distinguish and appeared as one coherent particle. Surprisingly, tests revealed that even the sample containing the smallest amount of fluorescent dye, that is, CA-fluo0.2, can doubtlessly be used in combination with the selected Optical Image Profiler.
Subsequently, tests were carried out on samples CA-fluo2 and CA-fluo0.2 to simulate the traceability of the fluorescent particles in the subsurface by adding quartz sand to the LDH–synthetic groundwater mixtures. The samples with the highest and the lowest fluorescent dye concentration were selected to study the minimum required amount of fluorescent dye if embedded in a sand matrix. Figure 10 shows the results of this test using sample CA-fluo0.2.
All images showed dark rims possibly due to an uneven illumination, a shadow from the sapphire window, or imperfect mounting of the camera. As can be seen in the left panel of the figure, the quartz sand-LDH-synthetic groundwater mixture appeared to be rather homogenous, particles of the added fluorescent LDH were not distinguishable under IR light. Upon excitation with green light at a wavelength of 520 nm, particles and/or smaller aggregates of the used fluorescent LDH were clearly visible and easily distinguishable from each other.
Based on the results of the carried out tests, it can be proposed that LDHs containing amounts as low as 0.2% of fluorescent dye and potentially lower, can be easily distinguished with the OIP-G system (Geoprobe Systems®) studied here. While the particles were nearly indistinguishable from the matrix under infrared light, single particles and particle aggregates could be identified upon excitation at 520 nm.

4. Conclusions

Successful labelling of nitrate-intercalated Mg,Al- as well as Ca,Al-LDHs with fluorescein, was attained. Further research needs to be carried out to fully explain if the fluorescein is intercalated into the structure of the LDHs, as described by Costantino et al. [27], Tanaka et al. [28], and Lee et al. [29], or if the fluorescein, or just a small fraction, is adsorbed on the external surface of the LDHs, which is also postulated by Tanaka et al. [28]. To date, it cannot be specified if the main layer composition and the structure influence the way the fluorescein is attached to the LDH. The samples showed a somewhat strong bonding between the fluorescent dye and the LDHs, as confirmed by stability tests, which might favour the intercalation theory. Results of the particle size distribution measurements revealed an aggregation of the LDH particles upon synthesis and aging. Tests revealed that the particle size of the fluorescing LDH can easily be tuned by varying the synthesis conditions and aging time to mimic that of potential reactive particles. Considering a potential usage of these fluorescent LDHs as tracer particles for in situ remediation strategies, the use of undried sample materials must be favoured.
The easy and economic synthesis route plus the tuneable particle size anticipate a wide range of applications for the particles studied here. If co-injected with reactive particles showing similar properties, the reactants could easily be detected, thanks to the fluorescent particles, in the subsurface, and their potential movement and spreading rate, caused by groundwater flow, could be tracked.
Tests using an Optical Image Profiler revealed that the fluorescent LDHs can easily be detected with this tool. Even LDHs with the lowest amount of fluorescent dye were easily detectable and distinguishable in a sand matrix allowing the proposal that LDHs containing 0.2% of fluorescent dye might be the optimal tracer particles if used with this highly sensitive device. Together with the use of an OIP, which is capable of exciting the fluorescent material and collecting pictures, this can provide a new approach for tracing injected particles in the subsurface.
Although the results reported here are highly encouraging, it is necessary to further determine the behaviour of these materials under simulated field conditions, e.g., in column experiments, and under real conditions during test injections. Based on the results gathered here further investigations should be focussed on undried sample material of LDHs labelled with 0.2% of the fluorescent dye.

Supplementary Materials

The following are available online at https://www.mdpi.com/2305-7084/4/3/53/s1, Figure S1: Powder X-ray diffraction pattern of the fluorescein samples; Figure S2: Thermogravimetric Analysis-Differential Thermal Analysis-Mass spectrometry (TG-DTA-MS) analysis of sample MA-fluo2; Figure S3: Thermogravimetric Analysis-Differential Thermal Analysis-Mass spectrometry (TG-DTA-MS) analysis of sample CA-fluo2; Figure S4: Thermogravimetric Analysis-Differential Thermal Analysis-Mass spectrometry (TG-DTA-MS) analysis of sample CA-fluo1; Figure S5: Thermogravimetric Analysis-Differential Thermal Analysis-Mass spectrometry (TG-DTA-MS) analysis of sample CA-fluo0.2; Figure S6: FTIR spectra of the unintercalated fluorescein disodium salt (top) and sample MA-fluo2. Spectrum of a reference sample MA-CO3 is included as a grey line. Dotted lines indicate absorption bands caused by vibrations in the divalent fluorescein anion; Figure S7: FTIR spectra of the unintercalated fluorescein disodium salt (top) and sample CA-fluo2. Spectrum of a reference sample CA-CO3 is included as a grey line. Dotted lines indicate absorption bands caused by vibrations in the divalent fluorescein anion; Figure S8: FTIR spectra of the unintercalated fluorescein disodium salt (top) and sample CA-fluo1. Spectrum of a reference sample CA-CO3 is included as a grey line. Dotted lines indicate absorption bands caused by vibrations in the divalent fluorescein anion; Figure S9: FTIR spectra of the unintercalated fluorescein disodium salt (top) and sample CA-fluo0.2. Spectrum of a reference sample CA-CO3 is included as a grey line. Dotted lines indicate absorption bands caused by vibrations in the divalent fluorescein anion; Figure S10: N2 adsorption (filled circles)-desorption (empty circles) isotherm of the sample MA-fluo2; Figure S11. N2 adsorption (filled circles)-desorption (empty circles) isotherm of the sample CA-fluo2; Figure S12: N2 adsorption (filled circles)-desorption (empty circles) isotherm of the sample CA-fluo1; Figure S13: N2 adsorption (filled circles)-desorption (empty circles) isotherm of the sample CA-fluo0.2; Figure S14: Particle size distribution of sample MA-fluo2 after different times (min) of ultrasound treatment using dried sample material; Figure S15: Particle size distribution of sample MA-fluo2 after different times (min) of ultrasound treatment using undried LDH slurry; Figure S16: Particle size distribution of sample CA-fluo2 after different times (min) of ultrasound treatment using dried sample material; Figure S17: Particle size distribution of sample CA-fluo2 after different times (min) of ultrasound treatment using undried LDH slurry; Figure S18: Particle size distribution of sample CA-fluo0.2 after different times (min) of ultrasound treatment using dried sample material; Figure S19: Particle size distribution of sample CA-fluo0.2 after different times (min) of ultrasound treatment using undried LDH slurry; Table S1: List of chemicals used within this study.

Author Contributions

Conceptualization, K.M.D. and V.R.; methodology, K.M.D. and V.R.; formal analysis, K.M.D., T.L. and M.R.; investigation, K.M.D.; resources, V.R.; data curation, K.M.D. and V.R.; writing—original draft preparation, K.M.D.; writing—review and editing, T.L., M.R. and V.R.; visualization, K.M.D.; supervision, V.R.; project administration, V.R.; funding acquisition, V.R. All authors have read and agreed to the published version of the manuscript.

Funding

This study is part of the project Metal-Aid, which has received funding from the European Union’s Horizon 2020 research and innovation program under the Marie Skłodowska-Curie grant agreement No. 675219. For more information, see http://metal-aid.eu/.

Acknowledgments

The authors gladly thank Ruben Espinosa at AECOM Perth (formerly AECOM Madrid) for his kind provision of fluorescein disodium salt, which was used for all syntheses of the fluorescent LDHs presented here.

Conflicts of Interest

The authors declare no conflict of interest.

References

  1. Huling, S.G.; Weaver, W. Dense Nonaqueous Phase Liquids Ground Water Issue; EPA/540/4-91/002; U.S. Environmental Protection Agency: Washington, DC, USA, 1991.
  2. Sobsey, M.D.; Bartram, S. Water quality and health in the new millennium: The role of the World Health Organization Guidelines for Drinking-Water Quality. Forum Nutr. 2003, 56, 396–405. [Google Scholar] [PubMed]
  3. Chuang, Y.H.; Tzou, Y.M.; Wang, M.K.; Liu, C.H.; Chiang, P.N. Removal of 2-Chlorophenol from Aqueous Solution by Mg/Al Layered Double Hydroxide (LDH) and Modified LDH. Ind. Eng. Chem. Res. 2008, 47, 3813–3819. [Google Scholar] [CrossRef]
  4. Kameda, T.; Yamazaki, T.; Yoshioka, T. Effect of intercalated aromatic sulfonates on uptake of aromatic compounds from aqueous solutions by modified Mg–Al layered double hydroxide. Mater. Res. Bull. 2010, 45, 751–753. [Google Scholar] [CrossRef]
  5. Chaara, D.; Bruna, F.; Ulibarri, M.A.; Draoui, K.; Barriga, C.; Pavlovic, I. Organo/layered double hydroxide nanohybrids used to remove non ionic pesticides. J. Hazard. Mater. 2011, 196, 350–359. [Google Scholar] [CrossRef] [PubMed]
  6. Gao, Z.; Du, B.; Zhang, G.; Gao, Y.; Zejiang, L.; Zhang, H.; Duan, X. Adsorption of Pentachlorophenol from Aqueous Solution on Dodecylbenzenesulfonate Modified Nickel−Titanium Layered Double Hydroxide Nanocomposites. Ind. Eng. Chem. Res. 2011, 50, 5334–5345. [Google Scholar] [CrossRef]
  7. Omonmhenle, S.L.; Shannon, I.J. Synthesis and characterisation of surfactant enhanced Mg–Al hydrotalcite-like compounds as potential 2-chlorophenol scavengers. Appl. Clay Sci. 2016, 127–128, 88–94. [Google Scholar] [CrossRef]
  8. Dietmann, K.M.; Linke, T.; Trujillano, R.; Rives, V. Effect of Chain Length and Functional Group of Organic Anions on the Retention Ability of MgAl-Layered Double Hydroxides for Chlorinated Organic Solvents. ChemEngineering 2019, 3, 89. [Google Scholar] [CrossRef] [Green Version]
  9. Alonso-De-Linaje, V.; Mangayayam, M.C.; Tobler, D.J.; Dietmann, K.M.; Espinosa, R.; Rives, V.; Dalby, K.N. Sorption of chlorinated hydrocarbons from synthetic and natural groundwater by organo-hydrotalcites: Towards their applications as remediation nanoparticles. Chemosphere 2019, 236, 124369. [Google Scholar] [CrossRef]
  10. Semkiw, S.E.; Barcelona, M.J. Field Study of Enhanced TCE Reductive Dechlorination by a Full-Scale Whey PRB. Ground Water Monit. Remediat. 2011, 31, 68–78. [Google Scholar] [CrossRef]
  11. Bhattacharjee, S.; Ghoshal, S. Sulfidation of nanoscale zerovalent iron in the presence of two organic macromolecules and its effects on trichloroethene degradation. Environ. Sci. Nano 2018, 5, 782–791. [Google Scholar] [CrossRef]
  12. O’Connor, D.; Hou, D.; Ok, Y.S.; Song, Y.; Sarmah, A.K.; Li, X.; Tack, F. Sustainable in Situ Remediation of Recalcitrant Organic Pollutants in Groundwater with Controlled Release Materials: A Review. J. Control. Release 2018, 283, 200–213. [Google Scholar] [CrossRef] [PubMed]
  13. Mangayayam, M.C.; Perez, J.P.H.; Dideriksen, K.; Freeman, H.M.; Bovet, N.; Benning, L.G.; Tobler, D.J. Structural transformation of sulfidized zerovalent iron and its impact on long-term reactivity. Environ. Sci. Nano 2019, 6, 3422–3430. [Google Scholar] [CrossRef]
  14. Dietmann, K.M.; Linke, T.; del Nogal Sánchez, M.; Pérez Pavón, J.L. Layered Double Hydroxides with Intercalated Permanganate and Peroxydisulphate Anions for Oxidative Removal of Chlorinated Organic Solvents Contaminated Water. Minerals 2020, 10, 462. [Google Scholar] [CrossRef]
  15. Liu, B.; Li, G.; Mumford, K.G.; Keuper, B.H.; Zhang, F. Low permeability zone remediation of trichloroethene via coupling electrokinetic migration with in situ electrochemical hydrodechlorination. Chemosphere 2020, 250, 126209. [Google Scholar] [CrossRef] [PubMed]
  16. He, F.; Gong, L.; Fan, D.; Tratnyek, P.G.; Lowry, G.V. Quantifying the efficiency and selectivity of organohalide dechlorination by zerovalent iron. Environ. Sci. Processes Impacts 2020, 22, 528–542. [Google Scholar] [CrossRef]
  17. Nunez Garcia, A.; Bopari, H.K.; Chowdhury, A.I.A.; de Boer, C.V.; Kocur, C.M.D.; Passeport, E.; Sheerwood Lollar, B.; Austrins, L.M.; Herrera, J.; O’Carroll, D.M. Sulfidated Nano Zerovalent Iron (S-nZVI) for in Situ Treatment of Chlorinated Solvents: A Field Study. Water Res. 2020, 174, 115594. [Google Scholar] [CrossRef]
  18. Sun, Y.; Gu, M.; Lyu, S.; Brusseau, M.L.; Li, M.; Lyu, Y.; Xue, Y.; Qiu, Z.; Sui, Q. Efficient removal of trichloroethene in oxidative environment by anchoring nano FeS on reduced graphene oxide supported nZVI catalyst: The role of FeS on oxidant decomposition and iron leakage. J. Hazard. Mater. 2020, 392, 112328. [Google Scholar] [CrossRef]
  19. Bonelli, B.; Freyria, F.S.; Rossetti, I.; Sethi, R. Nanomaterials for the Detection and Removal of Wastewater Pollutants, 1st ed.; Elsevier: Amsterdam, The Netherlands, 2020; ISBN 9780128184905. [Google Scholar]
  20. Gillies, G.; Mackenzie, K.; Kopinke, F.-D.; Georgi, A. Fluorescence Labelling as Tool for Zeolite Particle Tracking in Nanoremediation Approaches. Sci. Total Environ. 2016, 550, 820–826. [Google Scholar] [CrossRef]
  21. Dakota Technologies UVOST® Brochure. Available online: http://www.dakotatechnologies.com/docs/default-source/Downloads/uvost-brochure.pdf?sfvrsn=2 (accessed on 10 July 2020).
  22. Dakota Technologies TarGOST® Brochure. Available online: http://www.dakotatechnologies.com/docs/default-source/Downloads/targost-brochure.pdf?sfvrsn=2 (accessed on 10 July 2020).
  23. Fugro Geosciences, Inc. Rapid Optical Screening Tool (ROSTTM) Brochure. Available online: http://144.76.79.134/related/english/flyers/environmental_geology/rapid_optical_screening_tool.pdf (accessed on 10 July 2020).
  24. Bujewski, G.; Rutherford, B. Rapid Optical Screening Tool (ROSTTM) Laser-Induced Fluorescence (LIF) System for Screening of Petroleum Hydrocarbons in Subsurface Soils—Innovative Technology Verification Report; EPA/600/R-97/020; U.S. Environmental Protection Agency: Washington, DC, USA, 1991.
  25. Geoprobe® Direct Image® OIP-UV and OIP-G. Available online: https://geoprobe.com/oip-optical-image-profiler (accessed on 10 July 2020).
  26. McCall, W.; Christy, T.M.; Pipp, D.A.; Jaster, B.; White, J.; Goodrich, J.; Fontana, J.; Doxtader, S. Evaluation and application of the optical image profiler (OIP) a direct push probe for photo-logging UV-induced fluorescence of petroleum hydrocarbons. Environ. Earth Sci. 2018, 77, 374. [Google Scholar] [CrossRef] [Green Version]
  27. Costantino, U.; Coletti, N.; Nocchetti, M.; Aloisi, G.G.; Elisei, F.; Latterini, L. Surface Uptake and Intercalation of Fluorescein Anions into Zn−Al−Hydrotalcite. Photophysical Characterization of Materials Obtained. Langmuir 2000, 16, 10351–10358. [Google Scholar] [CrossRef]
  28. Tanaka, M.; Aisawa, S.; Hidetoshi, H.; Narita, E.; Dong, Q.; Yin, S.; Sato, T. Intracellular release of fluorescein anion from layered double hydroxide nanoparticles indicating endosomal escape. IOP Conf. Ser. Mater. Sci. Eng. 2013, 47, 012006. [Google Scholar] [CrossRef]
  29. Lee, J.H.; Jung, D.-Y.; Kim, E.; Ahn, T.K. Fluorescein Dye Intercalated Layered Double Hydroxides for Chemically Stabilized Photoluminescent Indicators on Inorganic Surfaces. Dalton Trans. 2014, 43, 8543–8548. [Google Scholar] [CrossRef] [PubMed]
  30. Saliba, D.; Al-Ghoul, M. Kinetics of intercalation of fluorescent probes in magnesium-aluminium layered double hydroxide within a multiscale reaction-diffusion framework. Philos. Trans. A Math. Phys. Eng. Sci. 2016, 374, 20160138. [Google Scholar] [CrossRef] [PubMed] [Green Version]
  31. Miyata, S. Synthesis of Hydrotalcite-Like Compounds and their Physico-Chemical Properties—The Systems Mg2+-Al3+-SO42− and Mg2+-Al3+-CrO42−. Clays Clay Miner. 1977, 25, 14–18. [Google Scholar] [CrossRef]
  32. Reichle, W. Synthesis of anionic clay minerals (mixed metal hydroxides, hydrotalcite). Solid State Ion. 1986, 22, 135–141. [Google Scholar] [CrossRef]
  33. Constantino, V.R.; Pinnavaia, T.J. Basic Properties of Mg2+1−xAl3+x Layered Double Hydroxides Intercalated by Carbonate, Hydroxide, Chloride, and Sulfate Anions. Inorg. Chem. 1995, 34, 883–892. [Google Scholar] [CrossRef]
  34. Rousselot, I.; Taviot-Gueho, C.; Leroux, F.; Leone, P.; Palvadeau, P.; Besse, J.-P. Insights on the Structural Chemistry of Hydrocalumite and Hydrotalcite-like Materials: Investigation of the Series Ca2M3+(OH)6Cl·2H2O (M3+: Al3+, Ga3+, Fe3+, and Sc3+) by X-Ray Powder Diffraction. J. Solid State Chem. 2002, 167, 137–144. [Google Scholar] [CrossRef]
  35. Chebout, R.; Tichit, D.; Layrac, G.; Barama, A.; Coq, B.; Cota, I.; Rangel, E.R.; Medina, F. New basic catalysts obtained from layered double hydroxides nanocomposites. Solid State Sci. 2010, 12, 1013–1017. [Google Scholar] [CrossRef]
  36. Cota, I.; Ramírez, E.; Medina, F.; Sueiras, J.E.; Layrac, G.; Tichit, D. New synthesis route of hydrocalumite-type materials and their application as basic catalysts for aldol condensation. Appl. Clay Sci. 2010, 50, 498–502. [Google Scholar] [CrossRef]
  37. Linke, T. Synthese lamellarer Calciumaluminathydrate im System C3A∙CaSO4∙nH2O–C3A∙CaCl2∙nH2O–C3A∙Ca(NO3)2∙nH2O Mischkristallsystem C3A∙(1-x)CaSO4∙(x/2)CaCl2∙(x/2)Ca(NO3)2∙nH2O 0≤x≤. Bachelor’s Thesis, Martin-Luther-University Halle-Wittenberg, Halle/Saale, Germany, October 2013. [Google Scholar]
  38. Linke, T. Synthese und kristallchemische Untersuchungen ausgewählter Mischkristalle der Hydrotalcit-Supergruppe im System [MeII1−xAlx(OH)2] (CO3)x/2∙nH2O mit MeII:Al 2:1 und 3:1 und MeII = Co, Cu, Mn, Ni. Master’s Thesis, Martin-Luther-Universität Halle-Wittenberg, Halle-Saale, Germany, September 2016. [Google Scholar]
  39. Dietmann, K.M. Untersuchungen zur Möglichkeit der Fixierung von Kaliumpermanganat in die Zwischenschicht des Tetracalciumaluminathydrats—Synthese und Charakterisierung des Phasenbestandes ausgewählter Systeme. Master’s Thesis, Martin-Luther-University Halle-Wittenberg, Halle/Saale, Germany, October 2016. [Google Scholar]
  40. Brunauer, S.; Emmett, P.H.; Teller, E. Adsorption of Gases in Multimolecular Layers. J. Am. Chem. Soc. 1938, 60, 309–319. [Google Scholar] [CrossRef]
  41. Xu, R. Particle Characterization: Light Scattering Method (Particle Technology Series); Springer: Haarlem, The Netherlands, 2002; Volume 13, pp. 11–181. [Google Scholar] [CrossRef]
  42. Rawle, A.; Kippax, P. Setting New Standards for Laser Diffraction Particle Size Analysis (Technical Article). 2010. Available online: http://www.analyticjournal.de/downloads_fachreport/malvern_iso13320_laser_rawle_%20kippax.pdf (accessed on 10 July 2020).
  43. Reischer, M.; Christensen, A.G.; De Weirdt, F.; Bruns, S.; Dideriksen, K. Capabilities of an optical direct push probe for 2D-subsurface imaging. J. Contam. Hydrol. 2020, 232, 103636. [Google Scholar] [CrossRef] [PubMed]
  44. De Roy, A.; Forano, C.; Besse, J.P. Layered Double Hydroxides: Synthesis and Post-Synthesis Modification. In Layered Double Hydroxides: Present and Future; Rives, V., Ed.; Nova Science Publishers: New York, NY, USA, 2001; pp. 1–39. ISBN 978-61209-289-8. [Google Scholar]
  45. Mills, S.J.; Christy, A.G.; Génin, J.-M.R.; Kameda, T.; Colombo, F. Nomenclature of the hydrotalcite supergroup: Natural layered double hydroxides. Mineral. Mag. 2012, 76, 1289–1336. [Google Scholar] [CrossRef] [Green Version]
  46. Macala, G.S.; Robertson, A.W.; Johnson, C.L.; Day, Z.B.; Lewis, R.S.; White, M.G.; Iretskii, A.V.; Ford, P.C. Transesterification Catalysts from Iron Doped Hydrotalcite-like Precursors: Solid Bases for Biodiesel Production. Catal. Lett. 2008, 122, 205–209. [Google Scholar] [CrossRef]
  47. Perotti, G.F.; Barud, H.S.; Ribeiro, S.J.L.; Constantino, V.R.L. Bacterial cellulose as a template for preparation of hydrotalcite-like compounds. J. Braz. Chem. Soc. 2014, 25, 9. [Google Scholar] [CrossRef]
  48. Komarala, E.P.; Doshi, S.; Mohammed, A.; Bahadur, D. Efficient antibacterial activity via protein degradation of a 3D layered double hydroxide–reduced graphene oxide nanohybrid. RSC Adv. 2016, 6, 40389–40398. [Google Scholar] [CrossRef]
  49. Kopka, H.; Beneke, K.; Lagaly, G. Anionic surfactants between double metal hydroxide layers. Colloid Interface Sci. 1988, 123, 427–436. [Google Scholar] [CrossRef]
  50. Meyn, M.; Beneke, K.; Lagaly, G. Anion-exchange reactions of layered double hydroxides. Inorg. Chem. 1990, 29, 5201–5207. [Google Scholar] [CrossRef]
  51. Bookin, A.S.; Drits, V.A. Polytype diversity of the hydrotalcite-like minerals—I. Possible polytypes and their diffraction features. Clays Clay Min. 1993, 41, 551–557. [Google Scholar] [CrossRef]
  52. Rapin, J.-P.; Renaudin, G.; Elkaïm, E.; François, M. Structural transition of Friedel’s salt 3CaO·Al2O3·CaCl2·10H2O studied by synchrotron powder diffraction. Cem. Concr. Res. 2002, 32, 513–519. [Google Scholar] [CrossRef] [Green Version]
  53. Evans, D.G.; Slade, R.C.T. Structural Aspects of Layered Double Hydroxides. In Layered Double Hydroxides (Structure and Bonding); Duan, X., Evans, D.G., Eds.; Springer: Berlin/Heidelberg, Germany, 2005; Volume 119, pp. 1–87. ISBN 978-3-540-28279-2. [Google Scholar]
  54. Scherrer, P. Bestimmung der Größe und der inneren Struktur von Kolloidteilchen mittels Röntgenstrahlen Nachrichten von der Gesellschaft der Wissenschaften zu Göttingen. Math. Phys. Kl. 1918, 26, 98–100. [Google Scholar]
  55. Rives, V. Study of Layered Double Hydroxides by Thermal Methods. In Layered Double Hydroxides: Present and Future; Rives, V., Ed.; Nova Science Publishers: New York, NY, USA, 2002; pp. 127–152. ISBN 978-1-61209-289-8. [Google Scholar]
  56. Hibino, T.; Yamashita, Y.; Kosuge, K.; Tsunashima, A. Decarbonation Behavior of Mg-Al-CO3 Hydrotalcite-like Compounds during Heat Treatment. Clays Clay Miner. 1995, 43, 427–432. [Google Scholar] [CrossRef]
  57. Hernandez-Moreno, M.J.; Ulibarri, M.A.; Rendon, J.L.; Serna, C.J. IR Characteristics of Hydrotalcite-like Compounds. Phys. Chem. Miner. 1985, 12, 34–38. [Google Scholar] [CrossRef]
  58. Labajos, F.M.; Rives, V.; Ulibarri, M.A. Effect of hydrothermal and thermal treatments on the physicochemical properties of Mg-Al hydrotalcite-like materials. J. Mater. Sci. 1992, 27, 1546–1552. [Google Scholar] [CrossRef]
  59. Kloprogge, J.T.; Frost, R.L. Infrared and Raman Spectroscopic Studies of Layered Double Hydroxides (LDHs). In Layered Double Hydroxides: Present and Future; Rives, V., Ed.; Nova Science Publishers: New York, NY, USA, 2001; pp. 127–151. ISBN 978-61209-289-8. [Google Scholar]
  60. Kloprogge, T.; Hickey, L.; Frost, R.L. FT-Raman and FT-IR spectroscopic study of synthetic Mg/Zn/Al-hydrotalcites. J. Raman Spectrosc. 2004, 35, 967–974. [Google Scholar] [CrossRef] [Green Version]
  61. Richardson, M.C.; Braterman, P.S. Infrared Spectra of Oriented and Nonoriented Layered Double Hydroxides in the Range from 4000 to 250 cm−1, with Evidence for Regular Short-Range Order in a Synthetic Magnesium−Aluminum LDH with Mg:Al = 2:1 but Not with Mg:Al = 3:1. J. Phys. Chem. C 2007, 111, 4209–4215. [Google Scholar] [CrossRef]
  62. Villegas, J.C.; Giraldo, O.H.; Laubernds, K.; Suib, S.L. New Layered Double Hydroxides Containing Intercalated Manganese Oxide Species: Synthesis and Characterization. Inorg. Chem. 2003, 42, 5621–5631. [Google Scholar] [CrossRef]
  63. Nakamoto, K. Infrared and Raman Spectra of Inorganic and Coordination Compounds—Part A: Theory and Applications in Inorganic Chemistry, 6th ed.; Wiley: Hoboken, NJ, USA, 2009; ISBN 978-0-471-74339-2. [Google Scholar]
  64. Thommes, M.; Keneko, K.; Neimark, A.V.; Olivier, J.P.; Rodriquez-Reinoso, F.; Rouquerol, J.; Sing, K.S.W. Physisorption of Gases, with special reference to the evaluation of surface area and pore size distribution (IUPAC Technical Report). Pure Appl. Chem. 2015, 87, 1051–1069. [Google Scholar] [CrossRef] [Green Version]
  65. Lowell, S.; Shields, J.E.; Thomas, M.A.; Thommes, M. Characterization of Porous Solids and Powders: Surface Area, Pore Size and Density; Springer: Haarlem, The Netherlands, 2004. [Google Scholar]
  66. Ostwald, W. Studien über die Bildung und Umwandlung fester Körper. Z. Phys. Chem. 1897, 22, 289–330. [Google Scholar] [CrossRef]
  67. Alemán, J.V.; Chadwick, A.V.; He, J.; Hess, M.; Horie, K.; Jones, R.G.; Kratochvíl, P.; Meisel, I.; Mita, I.; Moad, G.; et al. Definitions of terms relating to the structure and processing of sols, gels, networks, and inorganic-organic hybrid materials (IUPAC Recommendations 2007). Pure Appl. Chem. 2007, 79. [Google Scholar] [CrossRef]
Figure 1. Powder X-ray diffraction patterns of the fluorescein samples.
Chemengineering 04 00053 g001
Figure 2. Thermogravimetric Analysis-Differential Thermal Analysis-Mass Spectrometry (TG-DTA-MS) of sample MA-fluo2.
Chemengineering 04 00053 g002
Figure 3. FTIR spectra of the fluorescein disodium salt (top) and sample MA-fluo2. The spectrum of a MA-CO3 reference sample is included as a grey line. Dotted lines indicate absorption bands caused by vibrations in the divalent fluorescein anion.
Chemengineering 04 00053 g003
Figure 4. Study of the fluorescing ability of sample CA-fluo0.2: (from left to right within each panel) solid CA-fluo0.2, CA-fluo0.2 in suspension, and fluorescein disodium salt in solution, under (left panel) visible light, and (right panel) under ultraviolet A light (400–315 nm).
Chemengineering 04 00053 g004
Figure 5. Comparative study of the particle size distribution using dried and wet sample material of sample MA-fluo2.
Chemengineering 04 00053 g005
Figure 6. Comparative study of the particle size distribution using dried and wet sample material of sample CA-fluo2.
Chemengineering 04 00053 g006
Figure 7. Comparative study of the particle size distribution using dried and wet sample material of sample CA-fluo02.
Chemengineering 04 00053 g007
Figure 8. Comparative study of the particle size distribution of the dried sample material (upper panel) and wet sample material (lower panel) of previously studied Layered Double Hydroxides (LDHs) with fluorescent particles (left panel: MA-fluo2; middle panel: CA-fluo2, right panel: CA-fluo0.2).
Chemengineering 04 00053 g008
Figure 9. Sample CA-fluo0.2 dispersed in synthetic ground water under infrared light (left) and excited at 520 nm (right).
Chemengineering 04 00053 g009
Figure 10. Sample CA-fluo0.2 embedded in a quartz sand matrix under infrared light (left) and excited at 520 nm (right).
Chemengineering 04 00053 g010
Table 1. Element chemical analysis data (% w/w) of the synthesised samples and molar ratios of layer cations. All values rounded to two decimal places.
SampleCaMgAlNaMg/AlCa/Al
MA-fluo2 20.868.440.622.74
CA-fluo212.11 4.520.65 1.80
CA-fluo112.00 4.720.78 1.71
CA-fluo0.212.61 5.05 1.68
Table 2. Lattice parameters (Å) and average crystallite size (D, Å) of the synthesised samples.
Sampleac’cD
MA-fluo23.058.5425.63130
CA-fluo25.738.5851.49790
CA-fluo15.755.6751.99735
CA-fluo0.25.748.6251.731040
Table 3. Mass losses and gases released at each event during the thermal decomposition of the studied samples.
SampleEventMass Loss (%)Temperature Range (°C)Evolved Gases
MA-fluo2I14.025–195H2O
II25.7195–423CO2, H2O, NO2
III13.1423–641NO2
IV1.7641–900
Total54.525–900
CA-fluo2I10.025–125NO2, H2O
II12.6125–309H2O
III19.7309–620NO2
IV4.2620–900CO2
Total46.525–900
CA-fluo1I10.025–148H2O
II13.0148–348H2O
III19.0348–615NO2
IV5.8615–900CO2
Total47.825–900
CA-fluo0.2I10.625–125H2O
II15.5125–352H2O
III20.9352–624NO2
IV4.9624–900CO2
Total51.925–900
Table 4. Chemical formulae of the synthesized samples. All values rounded to two decimal places.
SampleChemical Formula
MA-fluo2[Mg0.73Al0.27(OH)2](NO3)0.13∙0.93H2O
CA-fluo2[Ca0.64Al0.36OH)2](NO3)0.18∙0.74H2O
CA-fluo1[Ca0.63Al0.37OH)2](NO3)0.18∙0.74H2O
CA-fluo0.2[Ca0.63Al0.37OH)2](NO3)0.18∙0.80H2O
Table 5. Brunauer–Emmett–Teller (BET) specific surface area (m2/g) of the synthesised samples.
SampleBET Area (m2/g)
MA-fluo2<1 1
CA-fluo218
CA-fluo119
CA-fluo0.217
1 mean value of six measurements.
Table 6. d(0.5) 1 values (μm) of the particle size distribution of the aggregated (untreated) and de-aggregated samples (after 15 min ultrasound treatment).
SampleParticle Size (μm)
DryWet
d(0.5) Aggregatedd(0.5) De-Aggregatedd(0.5) Aggregatedd(0.5) De-Aggregated
MA-fluo2269478190
CA-fluo21132187
CA-fluo0.2149866
1 median particle size.
Table 7. d(0.5) 1 values (μm) of the median particle size of the wet and dried aggregated reactive samples [8,14].
SampleParticle Size (μm)
d(0.5) Aggregated
DryWet
MA-17COO15614
MA-18SO316135
MA-MnO42186
CA-S2O8706
1 median particle size.