Fluorescing Layered Double Hydroxides as Tracer Materials for Particle Injection during Subsurface Water Remediation
Abstract
1. Introduction
2. Materials and Methods
2.1. Preparation of Samples
2.2. Methods
2.3. Dectectability of Fluorescent LDHs Using an Optical Image Profiler
3. Results and Discussion
3.1. Characterisation of Synthesised Materials
3.1.1. ICP-OES
3.1.2. Powder X-ray Diffraction
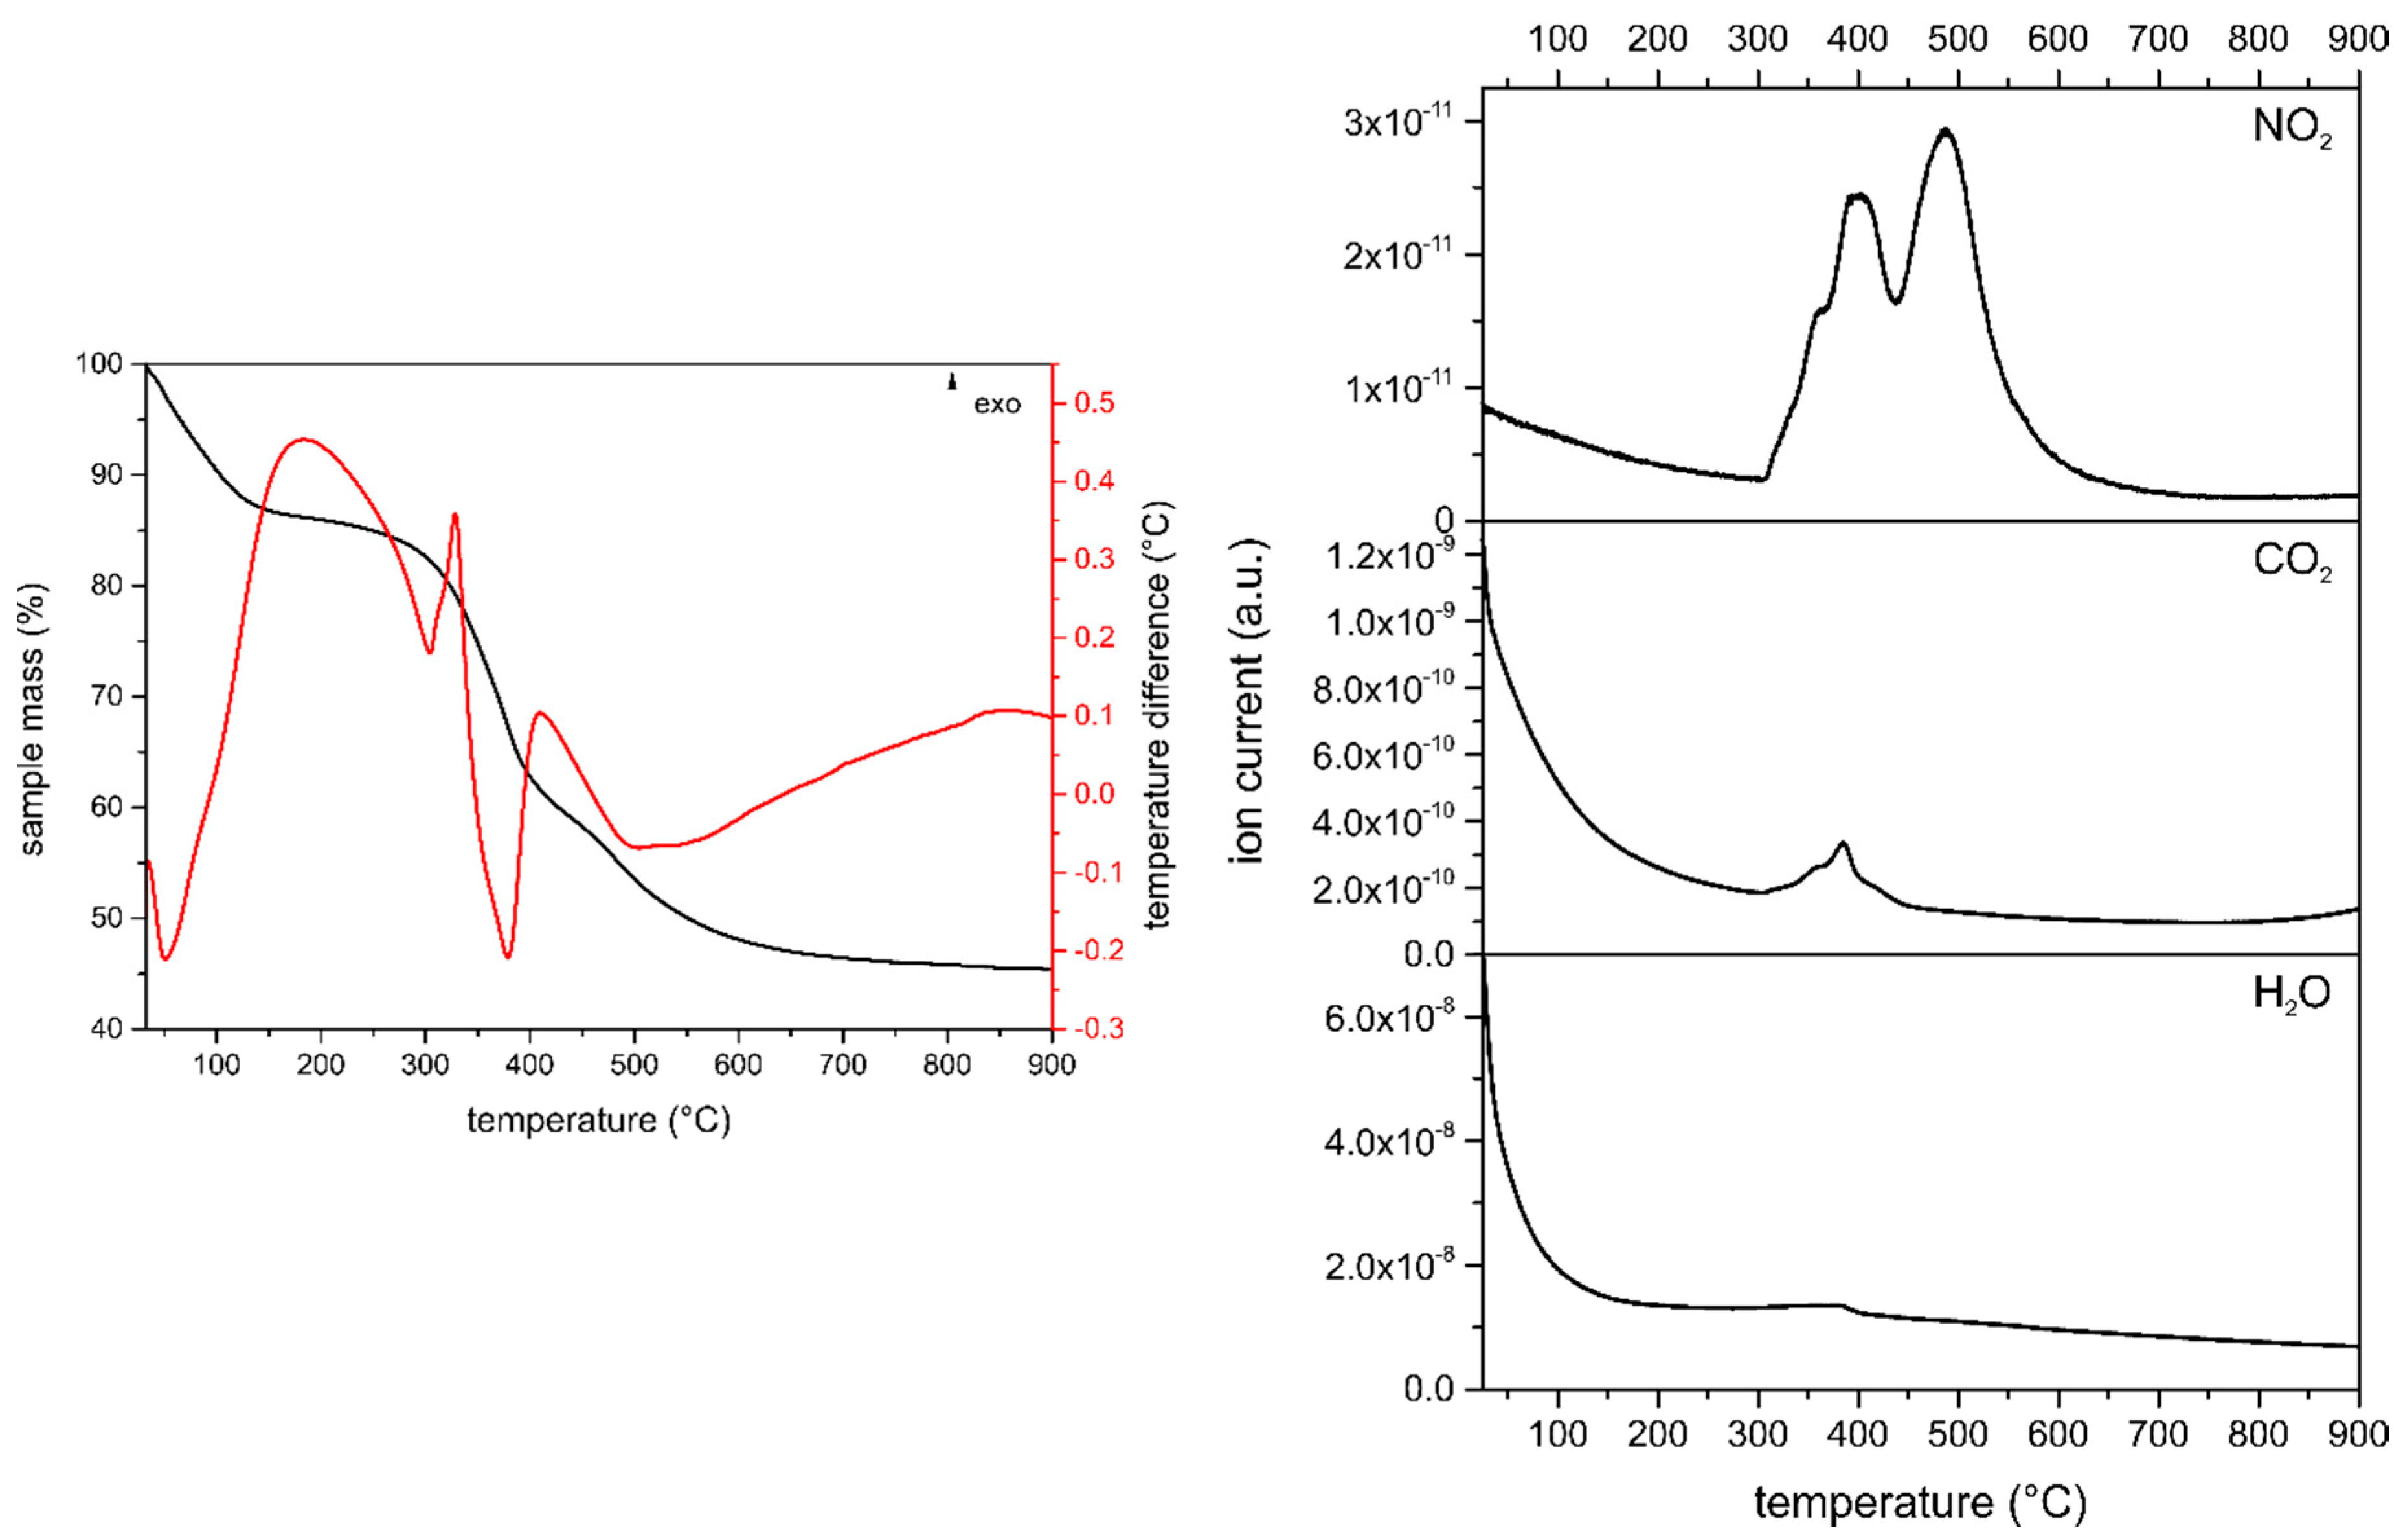
3.1.3. Thermal Analysis and Evolved Gas Analysis
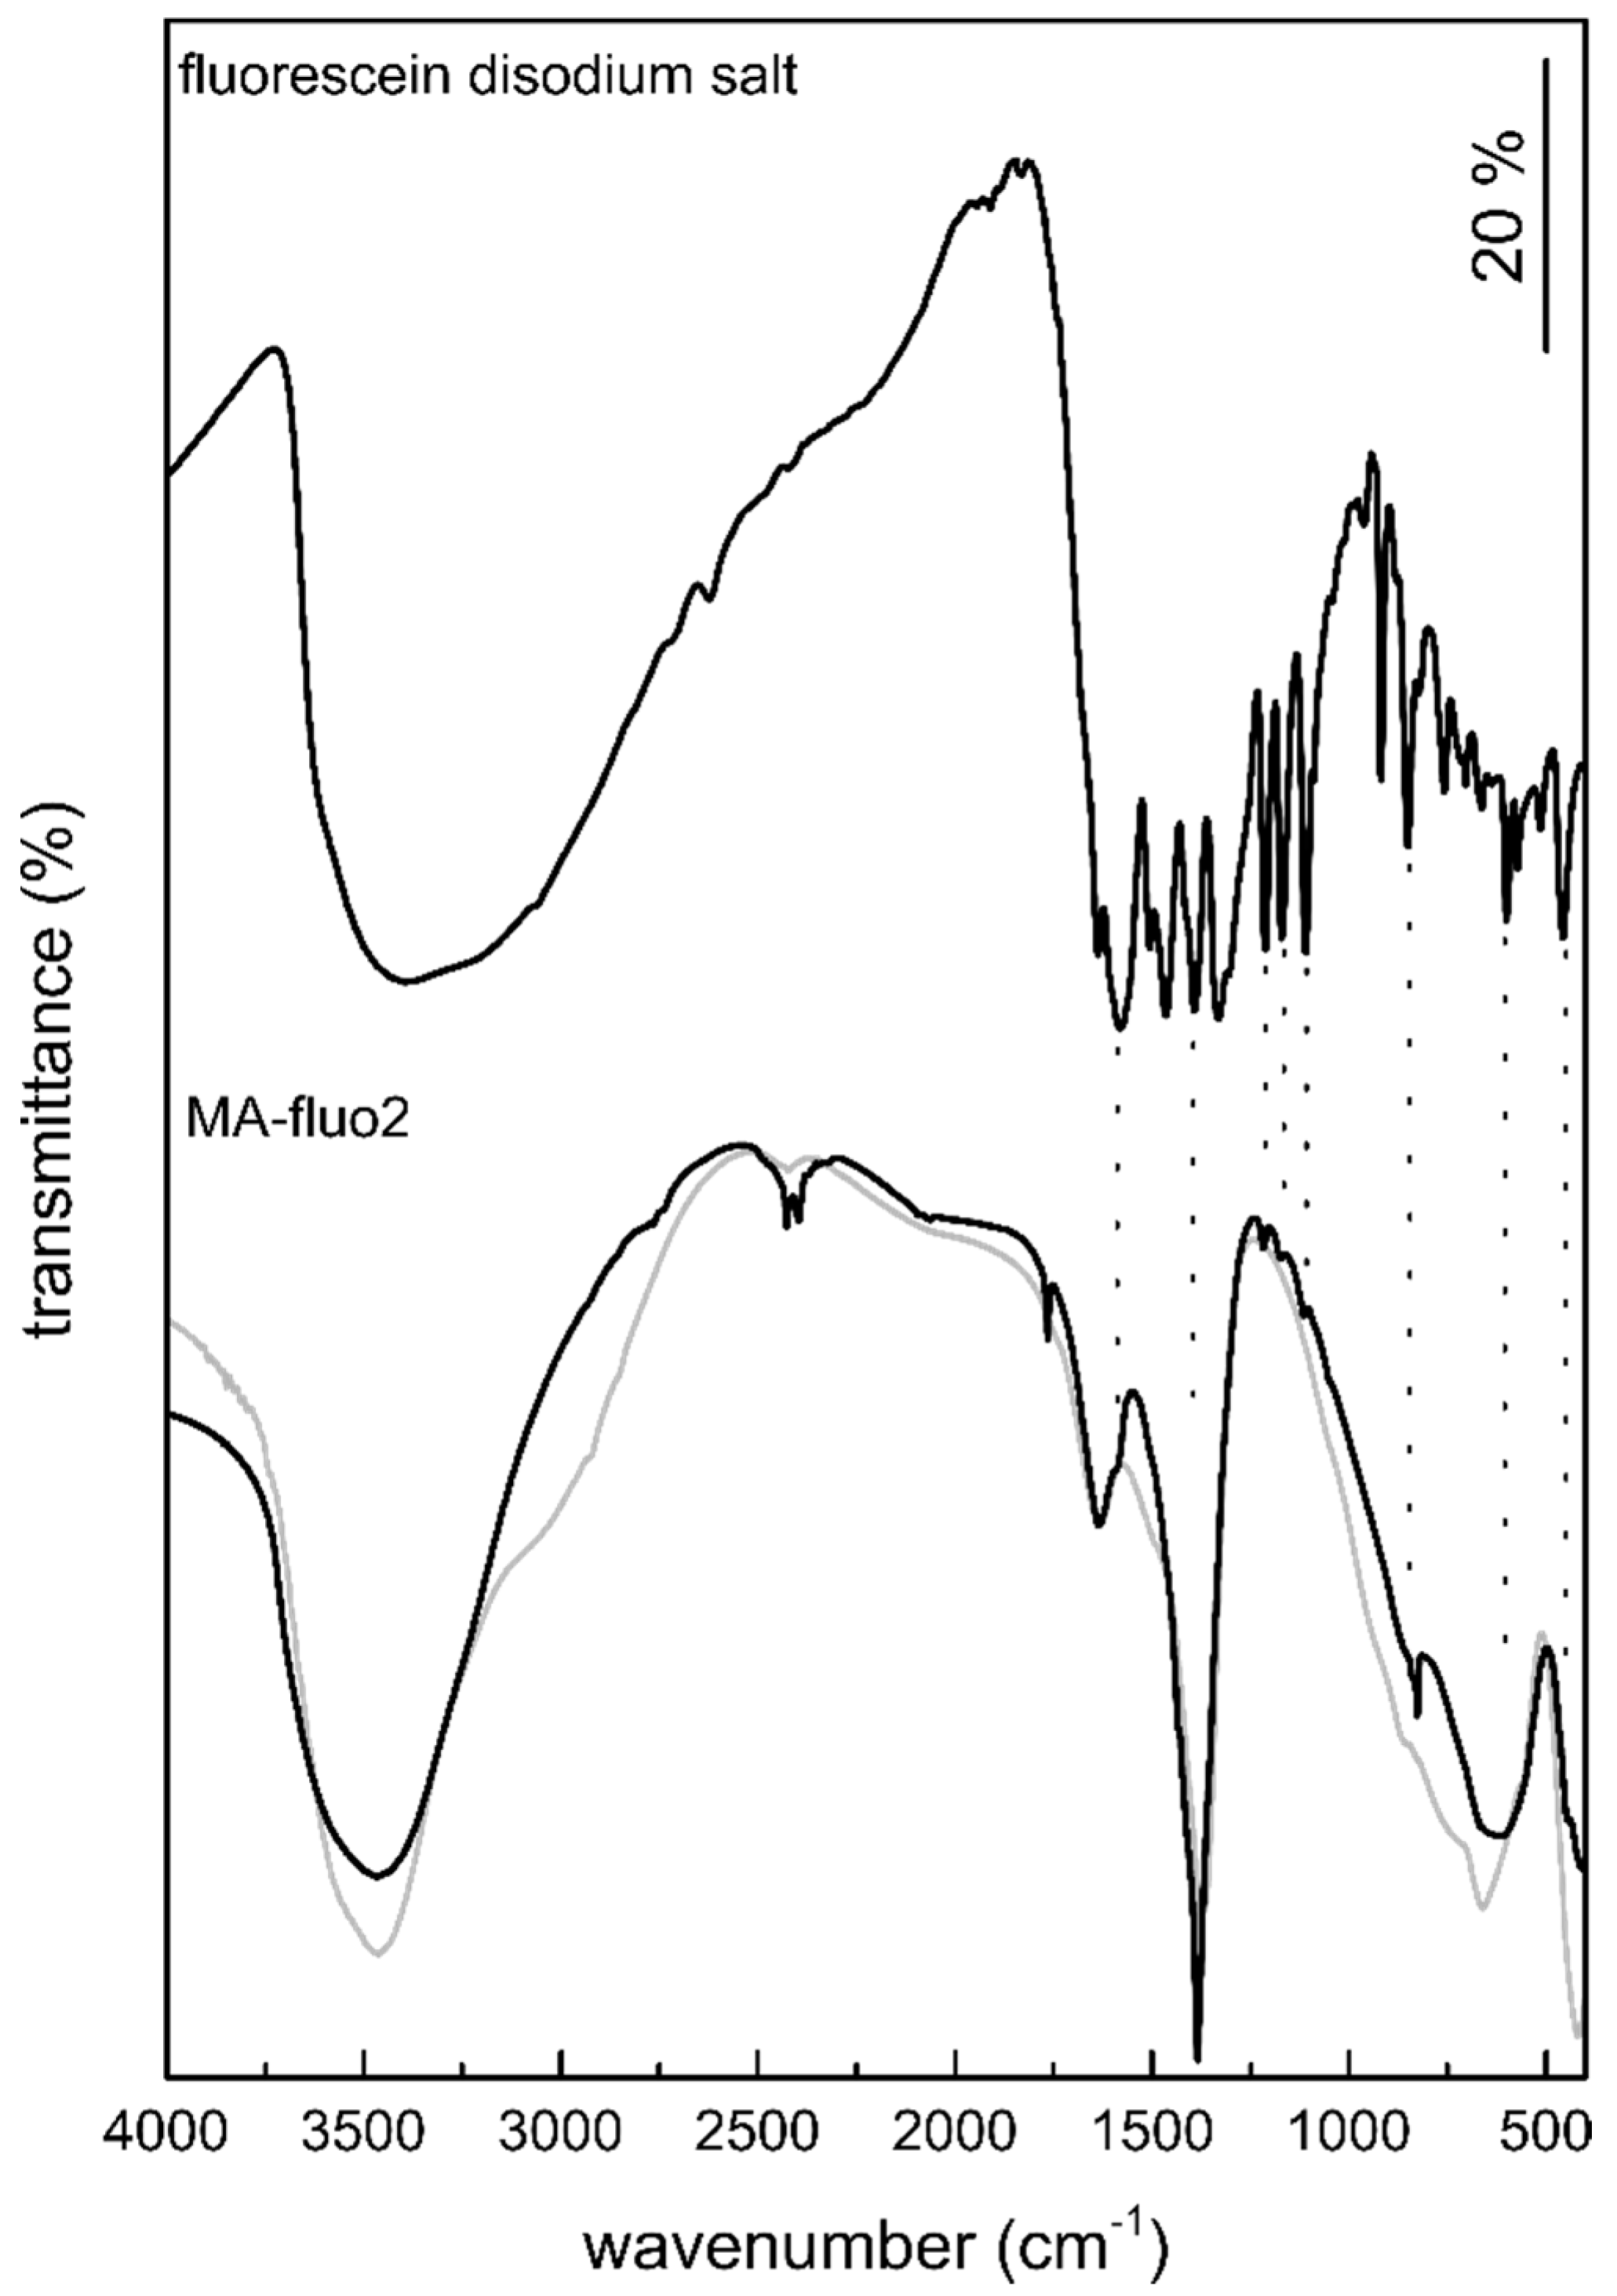
3.1.4. Fourier Transform Infrared Spectroscopy
3.1.5. Fluorescent Dye Stability Tests
3.1.6. Fluorescing Ability
3.1.7. BET Measurements
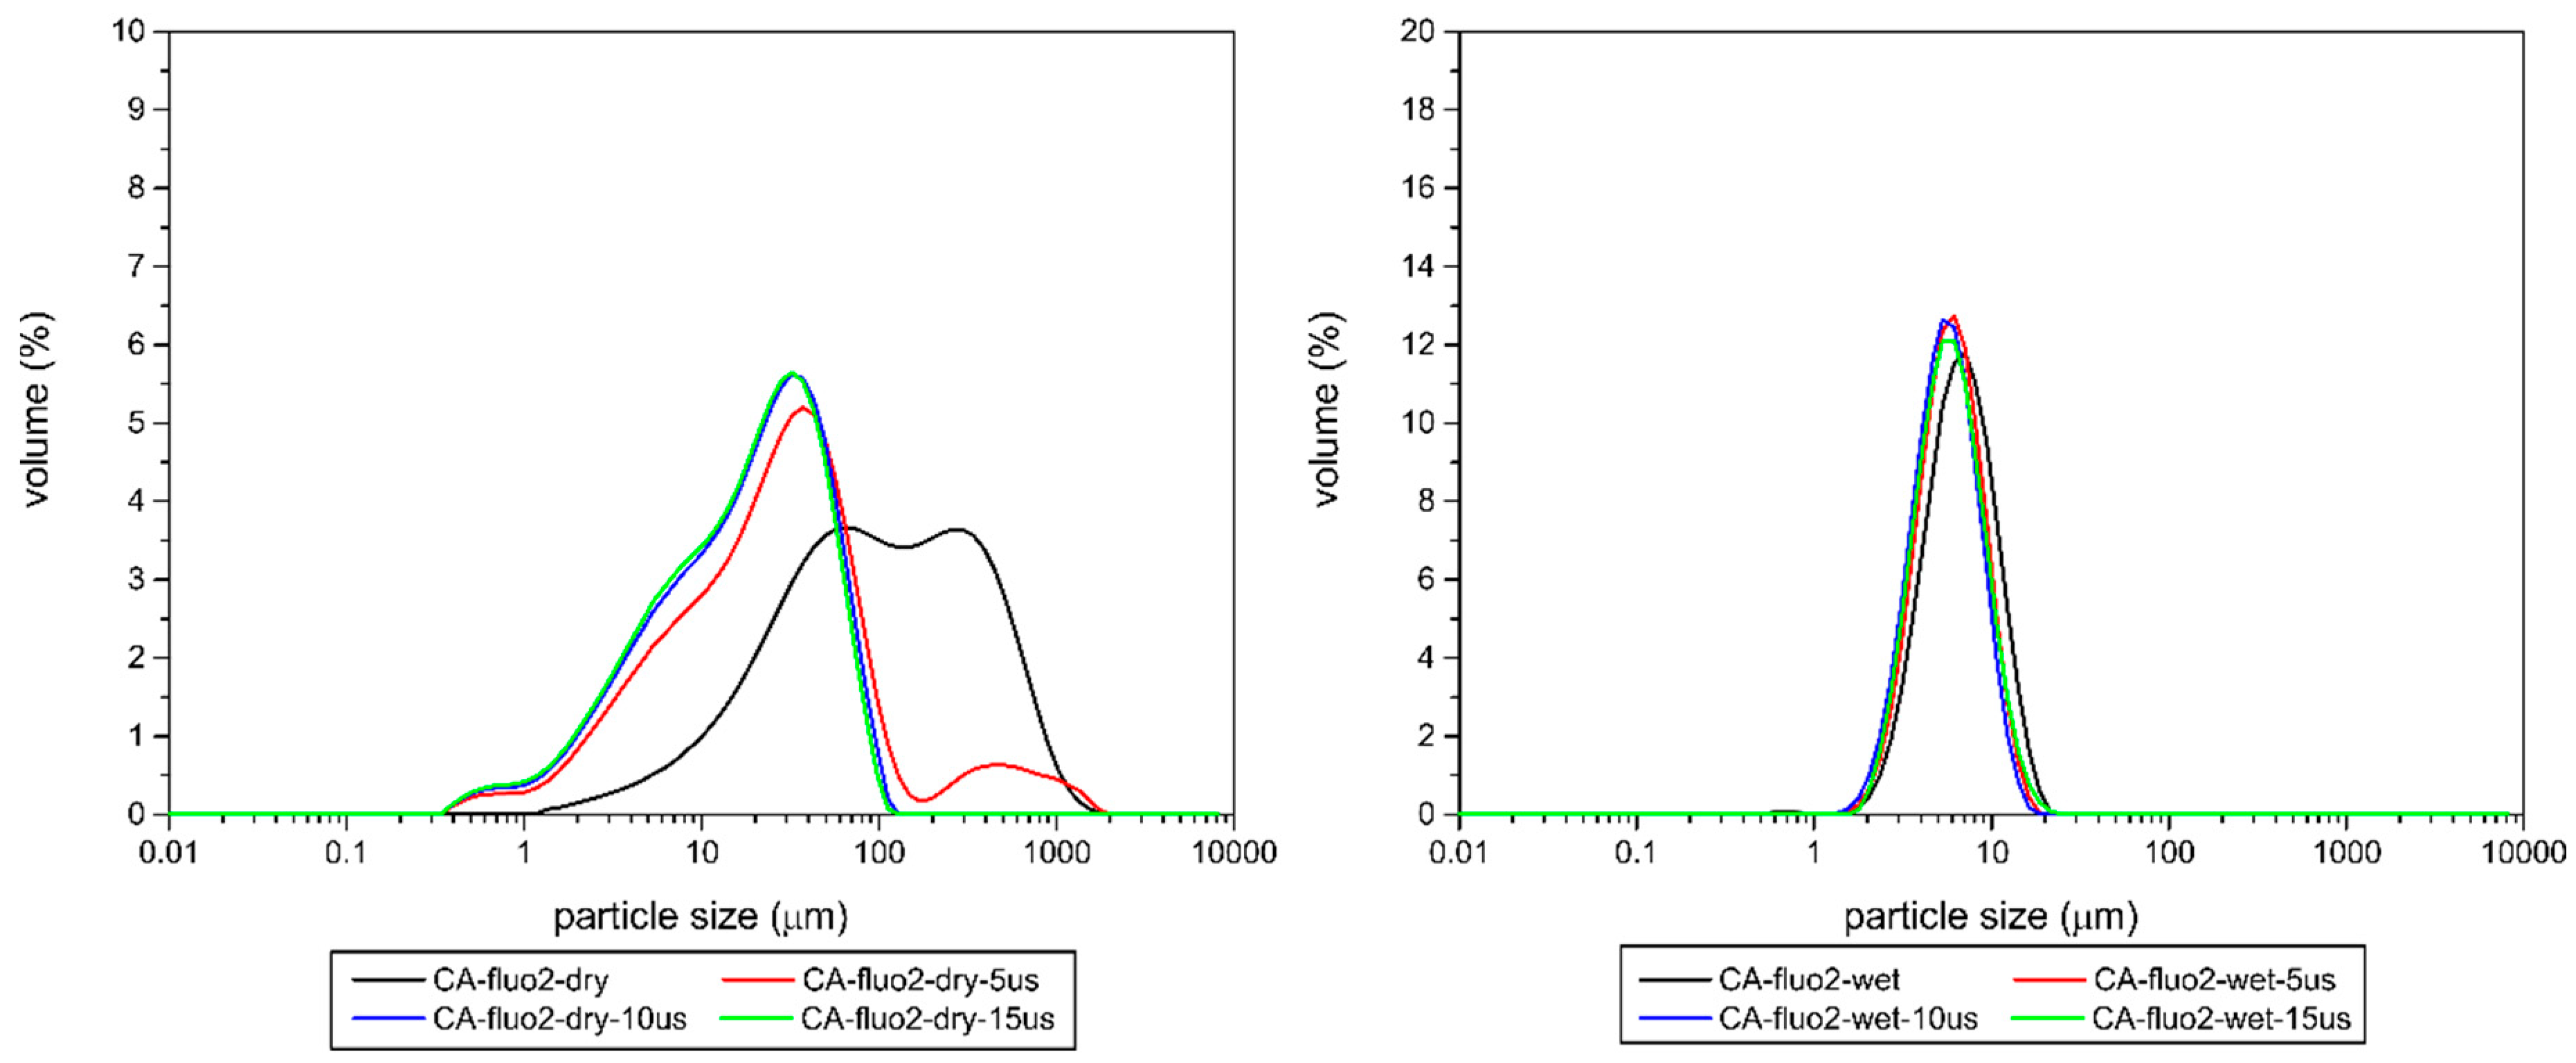
3.1.8. Particle Size Distribution
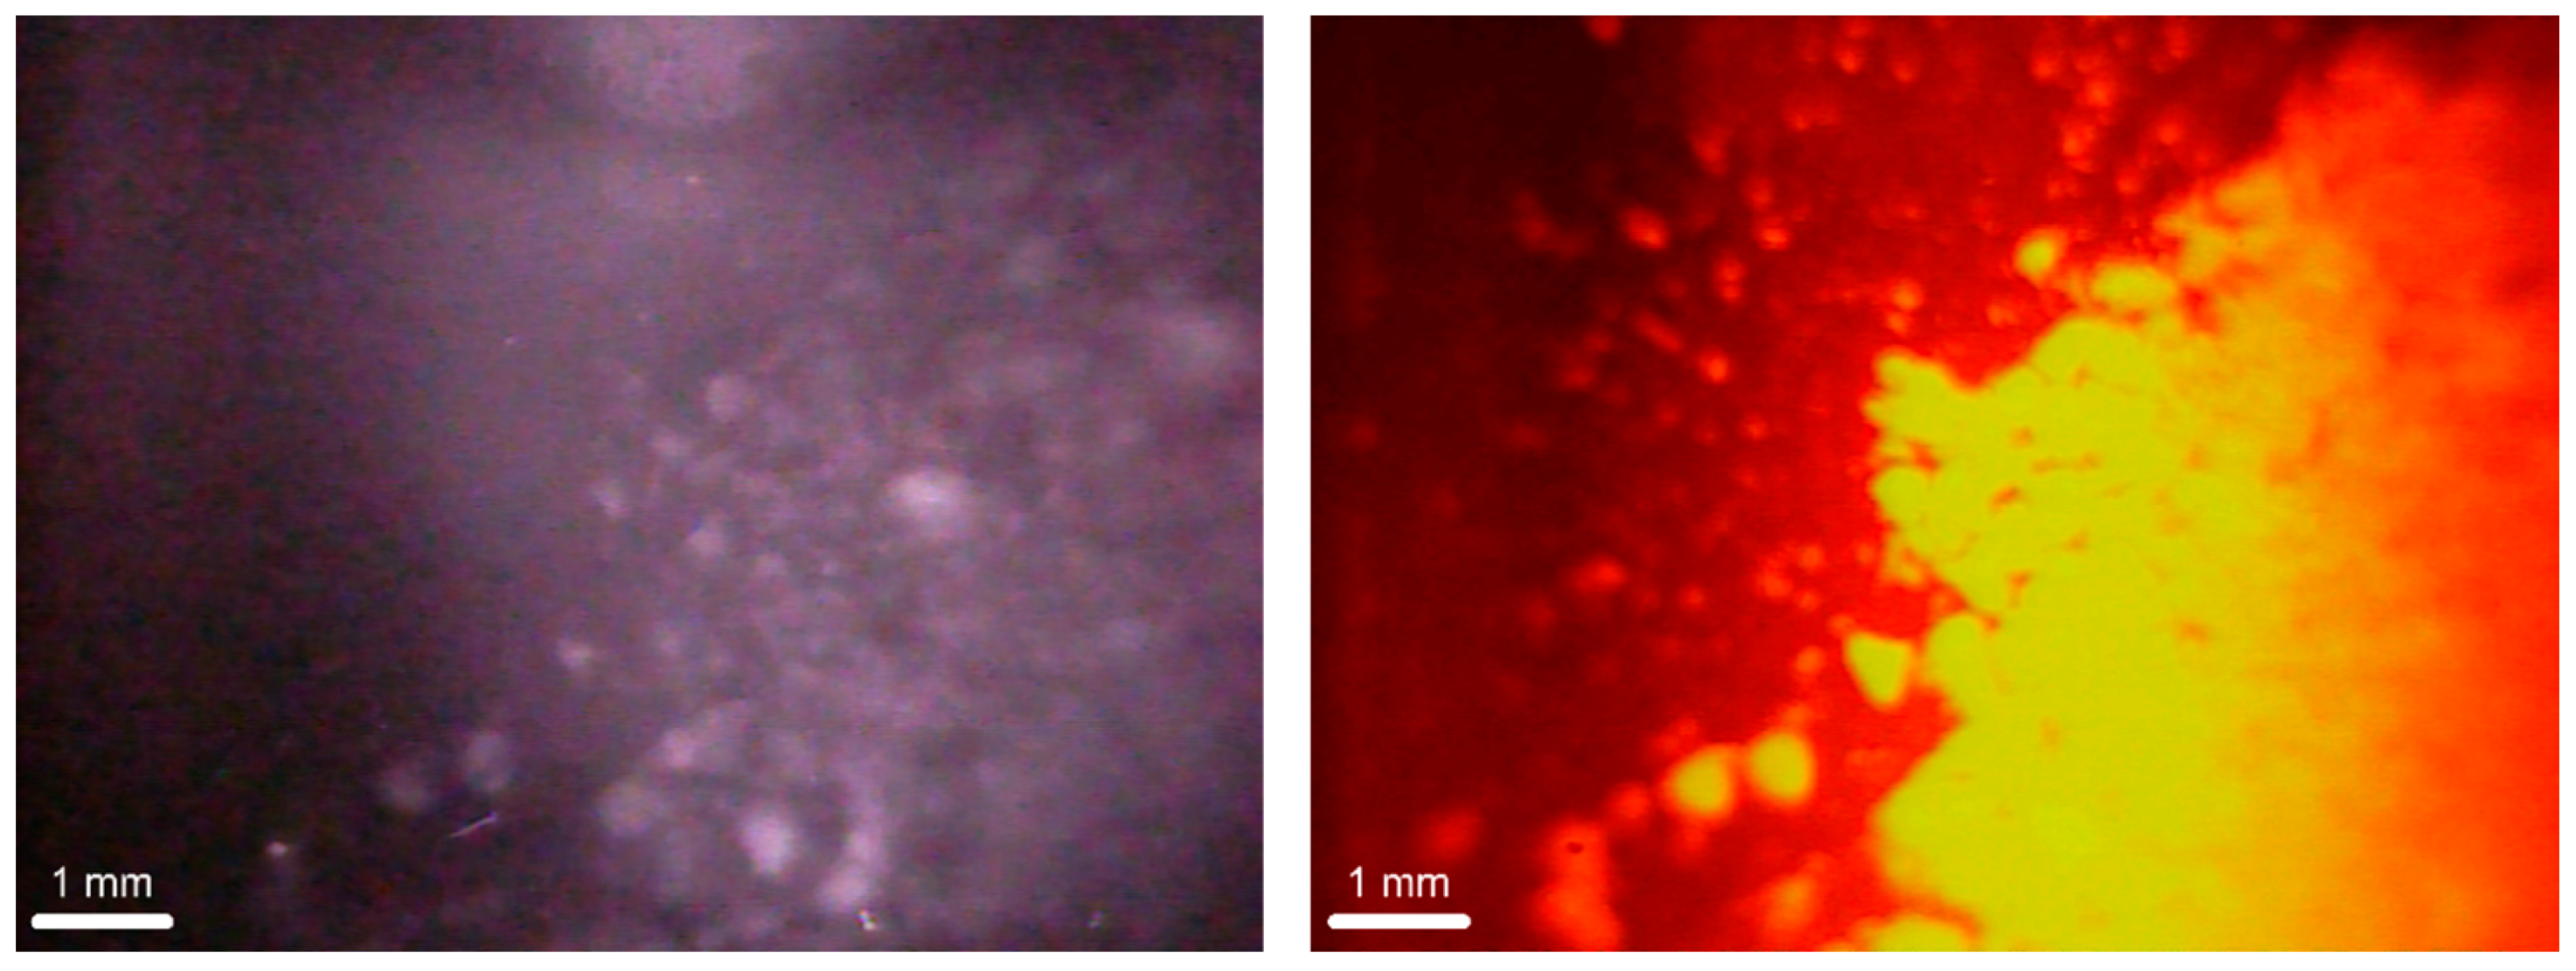
3.2. Dectectability of Fluorescent LDHs Using an Optical Image Profiler
4. Conclusions
Supplementary Materials
Author Contributions
Funding
Acknowledgments
Conflicts of Interest
References
- Huling, S.G.; Weaver, W. Dense Nonaqueous Phase Liquids Ground Water Issue; EPA/540/4-91/002; U.S. Environmental Protection Agency: Washington, DC, USA, 1991.
- Sobsey, M.D.; Bartram, S. Water quality and health in the new millennium: The role of the World Health Organization Guidelines for Drinking-Water Quality. Forum Nutr. 2003, 56, 396–405. [Google Scholar] [PubMed]
- Chuang, Y.H.; Tzou, Y.M.; Wang, M.K.; Liu, C.H.; Chiang, P.N. Removal of 2-Chlorophenol from Aqueous Solution by Mg/Al Layered Double Hydroxide (LDH) and Modified LDH. Ind. Eng. Chem. Res. 2008, 47, 3813–3819. [Google Scholar] [CrossRef]
- Kameda, T.; Yamazaki, T.; Yoshioka, T. Effect of intercalated aromatic sulfonates on uptake of aromatic compounds from aqueous solutions by modified Mg–Al layered double hydroxide. Mater. Res. Bull. 2010, 45, 751–753. [Google Scholar] [CrossRef]
- Chaara, D.; Bruna, F.; Ulibarri, M.A.; Draoui, K.; Barriga, C.; Pavlovic, I. Organo/layered double hydroxide nanohybrids used to remove non ionic pesticides. J. Hazard. Mater. 2011, 196, 350–359. [Google Scholar] [CrossRef] [PubMed]
- Gao, Z.; Du, B.; Zhang, G.; Gao, Y.; Zejiang, L.; Zhang, H.; Duan, X. Adsorption of Pentachlorophenol from Aqueous Solution on Dodecylbenzenesulfonate Modified Nickel−Titanium Layered Double Hydroxide Nanocomposites. Ind. Eng. Chem. Res. 2011, 50, 5334–5345. [Google Scholar] [CrossRef]
- Omonmhenle, S.L.; Shannon, I.J. Synthesis and characterisation of surfactant enhanced Mg–Al hydrotalcite-like compounds as potential 2-chlorophenol scavengers. Appl. Clay Sci. 2016, 127–128, 88–94. [Google Scholar] [CrossRef]
- Dietmann, K.M.; Linke, T.; Trujillano, R.; Rives, V. Effect of Chain Length and Functional Group of Organic Anions on the Retention Ability of MgAl-Layered Double Hydroxides for Chlorinated Organic Solvents. ChemEngineering 2019, 3, 89. [Google Scholar] [CrossRef]
- Alonso-De-Linaje, V.; Mangayayam, M.C.; Tobler, D.J.; Dietmann, K.M.; Espinosa, R.; Rives, V.; Dalby, K.N. Sorption of chlorinated hydrocarbons from synthetic and natural groundwater by organo-hydrotalcites: Towards their applications as remediation nanoparticles. Chemosphere 2019, 236, 124369. [Google Scholar] [CrossRef]
- Semkiw, S.E.; Barcelona, M.J. Field Study of Enhanced TCE Reductive Dechlorination by a Full-Scale Whey PRB. Ground Water Monit. Remediat. 2011, 31, 68–78. [Google Scholar] [CrossRef]
- Bhattacharjee, S.; Ghoshal, S. Sulfidation of nanoscale zerovalent iron in the presence of two organic macromolecules and its effects on trichloroethene degradation. Environ. Sci. Nano 2018, 5, 782–791. [Google Scholar] [CrossRef]
- O’Connor, D.; Hou, D.; Ok, Y.S.; Song, Y.; Sarmah, A.K.; Li, X.; Tack, F. Sustainable in Situ Remediation of Recalcitrant Organic Pollutants in Groundwater with Controlled Release Materials: A Review. J. Control. Release 2018, 283, 200–213. [Google Scholar] [CrossRef] [PubMed]
- Mangayayam, M.C.; Perez, J.P.H.; Dideriksen, K.; Freeman, H.M.; Bovet, N.; Benning, L.G.; Tobler, D.J. Structural transformation of sulfidized zerovalent iron and its impact on long-term reactivity. Environ. Sci. Nano 2019, 6, 3422–3430. [Google Scholar] [CrossRef]
- Dietmann, K.M.; Linke, T.; del Nogal Sánchez, M.; Pérez Pavón, J.L. Layered Double Hydroxides with Intercalated Permanganate and Peroxydisulphate Anions for Oxidative Removal of Chlorinated Organic Solvents Contaminated Water. Minerals 2020, 10, 462. [Google Scholar] [CrossRef]
- Liu, B.; Li, G.; Mumford, K.G.; Keuper, B.H.; Zhang, F. Low permeability zone remediation of trichloroethene via coupling electrokinetic migration with in situ electrochemical hydrodechlorination. Chemosphere 2020, 250, 126209. [Google Scholar] [CrossRef] [PubMed]
- He, F.; Gong, L.; Fan, D.; Tratnyek, P.G.; Lowry, G.V. Quantifying the efficiency and selectivity of organohalide dechlorination by zerovalent iron. Environ. Sci. Processes Impacts 2020, 22, 528–542. [Google Scholar] [CrossRef]
- Nunez Garcia, A.; Bopari, H.K.; Chowdhury, A.I.A.; de Boer, C.V.; Kocur, C.M.D.; Passeport, E.; Sheerwood Lollar, B.; Austrins, L.M.; Herrera, J.; O’Carroll, D.M. Sulfidated Nano Zerovalent Iron (S-nZVI) for in Situ Treatment of Chlorinated Solvents: A Field Study. Water Res. 2020, 174, 115594. [Google Scholar] [CrossRef]
- Sun, Y.; Gu, M.; Lyu, S.; Brusseau, M.L.; Li, M.; Lyu, Y.; Xue, Y.; Qiu, Z.; Sui, Q. Efficient removal of trichloroethene in oxidative environment by anchoring nano FeS on reduced graphene oxide supported nZVI catalyst: The role of FeS on oxidant decomposition and iron leakage. J. Hazard. Mater. 2020, 392, 112328. [Google Scholar] [CrossRef]
- Bonelli, B.; Freyria, F.S.; Rossetti, I.; Sethi, R. Nanomaterials for the Detection and Removal of Wastewater Pollutants, 1st ed.; Elsevier: Amsterdam, The Netherlands, 2020; ISBN 9780128184905. [Google Scholar]
- Gillies, G.; Mackenzie, K.; Kopinke, F.-D.; Georgi, A. Fluorescence Labelling as Tool for Zeolite Particle Tracking in Nanoremediation Approaches. Sci. Total Environ. 2016, 550, 820–826. [Google Scholar] [CrossRef]
- Dakota Technologies UVOST® Brochure. Available online: http://www.dakotatechnologies.com/docs/default-source/Downloads/uvost-brochure.pdf?sfvrsn=2 (accessed on 10 July 2020).
- Dakota Technologies TarGOST® Brochure. Available online: http://www.dakotatechnologies.com/docs/default-source/Downloads/targost-brochure.pdf?sfvrsn=2 (accessed on 10 July 2020).
- Fugro Geosciences, Inc. Rapid Optical Screening Tool (ROSTTM) Brochure. Available online: http://144.76.79.134/related/english/flyers/environmental_geology/rapid_optical_screening_tool.pdf (accessed on 10 July 2020).
- Bujewski, G.; Rutherford, B. Rapid Optical Screening Tool (ROSTTM) Laser-Induced Fluorescence (LIF) System for Screening of Petroleum Hydrocarbons in Subsurface Soils—Innovative Technology Verification Report; EPA/600/R-97/020; U.S. Environmental Protection Agency: Washington, DC, USA, 1991.
- Geoprobe® Direct Image® OIP-UV and OIP-G. Available online: https://geoprobe.com/oip-optical-image-profiler (accessed on 10 July 2020).
- McCall, W.; Christy, T.M.; Pipp, D.A.; Jaster, B.; White, J.; Goodrich, J.; Fontana, J.; Doxtader, S. Evaluation and application of the optical image profiler (OIP) a direct push probe for photo-logging UV-induced fluorescence of petroleum hydrocarbons. Environ. Earth Sci. 2018, 77, 374. [Google Scholar] [CrossRef]
- Costantino, U.; Coletti, N.; Nocchetti, M.; Aloisi, G.G.; Elisei, F.; Latterini, L. Surface Uptake and Intercalation of Fluorescein Anions into Zn−Al−Hydrotalcite. Photophysical Characterization of Materials Obtained. Langmuir 2000, 16, 10351–10358. [Google Scholar] [CrossRef]
- Tanaka, M.; Aisawa, S.; Hidetoshi, H.; Narita, E.; Dong, Q.; Yin, S.; Sato, T. Intracellular release of fluorescein anion from layered double hydroxide nanoparticles indicating endosomal escape. IOP Conf. Ser. Mater. Sci. Eng. 2013, 47, 012006. [Google Scholar] [CrossRef]
- Lee, J.H.; Jung, D.-Y.; Kim, E.; Ahn, T.K. Fluorescein Dye Intercalated Layered Double Hydroxides for Chemically Stabilized Photoluminescent Indicators on Inorganic Surfaces. Dalton Trans. 2014, 43, 8543–8548. [Google Scholar] [CrossRef] [PubMed]
- Saliba, D.; Al-Ghoul, M. Kinetics of intercalation of fluorescent probes in magnesium-aluminium layered double hydroxide within a multiscale reaction-diffusion framework. Philos. Trans. A Math. Phys. Eng. Sci. 2016, 374, 20160138. [Google Scholar] [CrossRef] [PubMed]
- Miyata, S. Synthesis of Hydrotalcite-Like Compounds and their Physico-Chemical Properties—The Systems Mg2+-Al3+-SO42− and Mg2+-Al3+-CrO42−. Clays Clay Miner. 1977, 25, 14–18. [Google Scholar] [CrossRef]
- Reichle, W. Synthesis of anionic clay minerals (mixed metal hydroxides, hydrotalcite). Solid State Ion. 1986, 22, 135–141. [Google Scholar] [CrossRef]
- Constantino, V.R.; Pinnavaia, T.J. Basic Properties of Mg2+1−xAl3+x Layered Double Hydroxides Intercalated by Carbonate, Hydroxide, Chloride, and Sulfate Anions. Inorg. Chem. 1995, 34, 883–892. [Google Scholar] [CrossRef]
- Rousselot, I.; Taviot-Gueho, C.; Leroux, F.; Leone, P.; Palvadeau, P.; Besse, J.-P. Insights on the Structural Chemistry of Hydrocalumite and Hydrotalcite-like Materials: Investigation of the Series Ca2M3+(OH)6Cl·2H2O (M3+: Al3+, Ga3+, Fe3+, and Sc3+) by X-Ray Powder Diffraction. J. Solid State Chem. 2002, 167, 137–144. [Google Scholar] [CrossRef]
- Chebout, R.; Tichit, D.; Layrac, G.; Barama, A.; Coq, B.; Cota, I.; Rangel, E.R.; Medina, F. New basic catalysts obtained from layered double hydroxides nanocomposites. Solid State Sci. 2010, 12, 1013–1017. [Google Scholar] [CrossRef]
- Cota, I.; Ramírez, E.; Medina, F.; Sueiras, J.E.; Layrac, G.; Tichit, D. New synthesis route of hydrocalumite-type materials and their application as basic catalysts for aldol condensation. Appl. Clay Sci. 2010, 50, 498–502. [Google Scholar] [CrossRef]
- Linke, T. Synthese lamellarer Calciumaluminathydrate im System C3A∙CaSO4∙nH2O–C3A∙CaCl2∙nH2O–C3A∙Ca(NO3)2∙nH2O Mischkristallsystem C3A∙(1-x)CaSO4∙(x/2)CaCl2∙(x/2)Ca(NO3)2∙nH2O 0≤x≤. Bachelor’s Thesis, Martin-Luther-University Halle-Wittenberg, Halle/Saale, Germany, October 2013. [Google Scholar]
- Linke, T. Synthese und kristallchemische Untersuchungen ausgewählter Mischkristalle der Hydrotalcit-Supergruppe im System [MeII1−xAlx(OH)2] (CO3)x/2∙nH2O mit MeII:Al 2:1 und 3:1 und MeII = Co, Cu, Mn, Ni. Master’s Thesis, Martin-Luther-Universität Halle-Wittenberg, Halle-Saale, Germany, September 2016. [Google Scholar]
- Dietmann, K.M. Untersuchungen zur Möglichkeit der Fixierung von Kaliumpermanganat in die Zwischenschicht des Tetracalciumaluminathydrats—Synthese und Charakterisierung des Phasenbestandes ausgewählter Systeme. Master’s Thesis, Martin-Luther-University Halle-Wittenberg, Halle/Saale, Germany, October 2016. [Google Scholar]
- Brunauer, S.; Emmett, P.H.; Teller, E. Adsorption of Gases in Multimolecular Layers. J. Am. Chem. Soc. 1938, 60, 309–319. [Google Scholar] [CrossRef]
- Xu, R. Particle Characterization: Light Scattering Method (Particle Technology Series); Springer: Haarlem, The Netherlands, 2002; Volume 13, pp. 11–181. [Google Scholar] [CrossRef]
- Rawle, A.; Kippax, P. Setting New Standards for Laser Diffraction Particle Size Analysis (Technical Article). 2010. Available online: http://www.analyticjournal.de/downloads_fachreport/malvern_iso13320_laser_rawle_%20kippax.pdf (accessed on 10 July 2020).
- Reischer, M.; Christensen, A.G.; De Weirdt, F.; Bruns, S.; Dideriksen, K. Capabilities of an optical direct push probe for 2D-subsurface imaging. J. Contam. Hydrol. 2020, 232, 103636. [Google Scholar] [CrossRef] [PubMed]
- De Roy, A.; Forano, C.; Besse, J.P. Layered Double Hydroxides: Synthesis and Post-Synthesis Modification. In Layered Double Hydroxides: Present and Future; Rives, V., Ed.; Nova Science Publishers: New York, NY, USA, 2001; pp. 1–39. ISBN 978-61209-289-8. [Google Scholar]
- Mills, S.J.; Christy, A.G.; Génin, J.-M.R.; Kameda, T.; Colombo, F. Nomenclature of the hydrotalcite supergroup: Natural layered double hydroxides. Mineral. Mag. 2012, 76, 1289–1336. [Google Scholar] [CrossRef]
- Macala, G.S.; Robertson, A.W.; Johnson, C.L.; Day, Z.B.; Lewis, R.S.; White, M.G.; Iretskii, A.V.; Ford, P.C. Transesterification Catalysts from Iron Doped Hydrotalcite-like Precursors: Solid Bases for Biodiesel Production. Catal. Lett. 2008, 122, 205–209. [Google Scholar] [CrossRef]
- Perotti, G.F.; Barud, H.S.; Ribeiro, S.J.L.; Constantino, V.R.L. Bacterial cellulose as a template for preparation of hydrotalcite-like compounds. J. Braz. Chem. Soc. 2014, 25, 9. [Google Scholar] [CrossRef]
- Komarala, E.P.; Doshi, S.; Mohammed, A.; Bahadur, D. Efficient antibacterial activity via protein degradation of a 3D layered double hydroxide–reduced graphene oxide nanohybrid. RSC Adv. 2016, 6, 40389–40398. [Google Scholar] [CrossRef]
- Kopka, H.; Beneke, K.; Lagaly, G. Anionic surfactants between double metal hydroxide layers. Colloid Interface Sci. 1988, 123, 427–436. [Google Scholar] [CrossRef]
- Meyn, M.; Beneke, K.; Lagaly, G. Anion-exchange reactions of layered double hydroxides. Inorg. Chem. 1990, 29, 5201–5207. [Google Scholar] [CrossRef]
- Bookin, A.S.; Drits, V.A. Polytype diversity of the hydrotalcite-like minerals—I. Possible polytypes and their diffraction features. Clays Clay Min. 1993, 41, 551–557. [Google Scholar] [CrossRef]
- Rapin, J.-P.; Renaudin, G.; Elkaïm, E.; François, M. Structural transition of Friedel’s salt 3CaO·Al2O3·CaCl2·10H2O studied by synchrotron powder diffraction. Cem. Concr. Res. 2002, 32, 513–519. [Google Scholar] [CrossRef]
- Evans, D.G.; Slade, R.C.T. Structural Aspects of Layered Double Hydroxides. In Layered Double Hydroxides (Structure and Bonding); Duan, X., Evans, D.G., Eds.; Springer: Berlin/Heidelberg, Germany, 2005; Volume 119, pp. 1–87. ISBN 978-3-540-28279-2. [Google Scholar]
- Scherrer, P. Bestimmung der Größe und der inneren Struktur von Kolloidteilchen mittels Röntgenstrahlen Nachrichten von der Gesellschaft der Wissenschaften zu Göttingen. Math. Phys. Kl. 1918, 26, 98–100. [Google Scholar]
- Rives, V. Study of Layered Double Hydroxides by Thermal Methods. In Layered Double Hydroxides: Present and Future; Rives, V., Ed.; Nova Science Publishers: New York, NY, USA, 2002; pp. 127–152. ISBN 978-1-61209-289-8. [Google Scholar]
- Hibino, T.; Yamashita, Y.; Kosuge, K.; Tsunashima, A. Decarbonation Behavior of Mg-Al-CO3 Hydrotalcite-like Compounds during Heat Treatment. Clays Clay Miner. 1995, 43, 427–432. [Google Scholar] [CrossRef]
- Hernandez-Moreno, M.J.; Ulibarri, M.A.; Rendon, J.L.; Serna, C.J. IR Characteristics of Hydrotalcite-like Compounds. Phys. Chem. Miner. 1985, 12, 34–38. [Google Scholar] [CrossRef]
- Labajos, F.M.; Rives, V.; Ulibarri, M.A. Effect of hydrothermal and thermal treatments on the physicochemical properties of Mg-Al hydrotalcite-like materials. J. Mater. Sci. 1992, 27, 1546–1552. [Google Scholar] [CrossRef]
- Kloprogge, J.T.; Frost, R.L. Infrared and Raman Spectroscopic Studies of Layered Double Hydroxides (LDHs). In Layered Double Hydroxides: Present and Future; Rives, V., Ed.; Nova Science Publishers: New York, NY, USA, 2001; pp. 127–151. ISBN 978-61209-289-8. [Google Scholar]
- Kloprogge, T.; Hickey, L.; Frost, R.L. FT-Raman and FT-IR spectroscopic study of synthetic Mg/Zn/Al-hydrotalcites. J. Raman Spectrosc. 2004, 35, 967–974. [Google Scholar] [CrossRef]
- Richardson, M.C.; Braterman, P.S. Infrared Spectra of Oriented and Nonoriented Layered Double Hydroxides in the Range from 4000 to 250 cm−1, with Evidence for Regular Short-Range Order in a Synthetic Magnesium−Aluminum LDH with Mg:Al = 2:1 but Not with Mg:Al = 3:1. J. Phys. Chem. C 2007, 111, 4209–4215. [Google Scholar] [CrossRef]
- Villegas, J.C.; Giraldo, O.H.; Laubernds, K.; Suib, S.L. New Layered Double Hydroxides Containing Intercalated Manganese Oxide Species: Synthesis and Characterization. Inorg. Chem. 2003, 42, 5621–5631. [Google Scholar] [CrossRef]
- Nakamoto, K. Infrared and Raman Spectra of Inorganic and Coordination Compounds—Part A: Theory and Applications in Inorganic Chemistry, 6th ed.; Wiley: Hoboken, NJ, USA, 2009; ISBN 978-0-471-74339-2. [Google Scholar]
- Thommes, M.; Keneko, K.; Neimark, A.V.; Olivier, J.P.; Rodriquez-Reinoso, F.; Rouquerol, J.; Sing, K.S.W. Physisorption of Gases, with special reference to the evaluation of surface area and pore size distribution (IUPAC Technical Report). Pure Appl. Chem. 2015, 87, 1051–1069. [Google Scholar] [CrossRef]
- Lowell, S.; Shields, J.E.; Thomas, M.A.; Thommes, M. Characterization of Porous Solids and Powders: Surface Area, Pore Size and Density; Springer: Haarlem, The Netherlands, 2004. [Google Scholar]
- Ostwald, W. Studien über die Bildung und Umwandlung fester Körper. Z. Phys. Chem. 1897, 22, 289–330. [Google Scholar] [CrossRef]
- Alemán, J.V.; Chadwick, A.V.; He, J.; Hess, M.; Horie, K.; Jones, R.G.; Kratochvíl, P.; Meisel, I.; Mita, I.; Moad, G.; et al. Definitions of terms relating to the structure and processing of sols, gels, networks, and inorganic-organic hybrid materials (IUPAC Recommendations 2007). Pure Appl. Chem. 2007, 79. [Google Scholar] [CrossRef]


| Sample | Ca | Mg | Al | Na | Mg/Al | Ca/Al |
|---|---|---|---|---|---|---|
| MA-fluo2 | 20.86 | 8.44 | 0.62 | 2.74 | ||
| CA-fluo2 | 12.11 | 4.52 | 0.65 | 1.80 | ||
| CA-fluo1 | 12.00 | 4.72 | 0.78 | 1.71 | ||
| CA-fluo0.2 | 12.61 | 5.05 | 1.68 |
| Sample | a | c’ | c | D |
|---|---|---|---|---|
| MA-fluo2 | 3.05 | 8.54 | 25.63 | 130 |
| CA-fluo2 | 5.73 | 8.58 | 51.49 | 790 |
| CA-fluo1 | 5.75 | 5.67 | 51.99 | 735 |
| CA-fluo0.2 | 5.74 | 8.62 | 51.73 | 1040 |
| Sample | Event | Mass Loss (%) | Temperature Range (°C) | Evolved Gases |
|---|---|---|---|---|
| MA-fluo2 | I | 14.0 | 25–195 | H2O |
| II | 25.7 | 195–423 | CO2, H2O, NO2 | |
| III | 13.1 | 423–641 | NO2 | |
| IV | 1.7 | 641–900 | ||
| Total | 54.5 | 25–900 | ||
| CA-fluo2 | I | 10.0 | 25–125 | NO2, H2O |
| II | 12.6 | 125–309 | H2O | |
| III | 19.7 | 309–620 | NO2 | |
| IV | 4.2 | 620–900 | CO2 | |
| Total | 46.5 | 25–900 | ||
| CA-fluo1 | I | 10.0 | 25–148 | H2O |
| II | 13.0 | 148–348 | H2O | |
| III | 19.0 | 348–615 | NO2 | |
| IV | 5.8 | 615–900 | CO2 | |
| Total | 47.8 | 25–900 | ||
| CA-fluo0.2 | I | 10.6 | 25–125 | H2O |
| II | 15.5 | 125–352 | H2O | |
| III | 20.9 | 352–624 | NO2 | |
| IV | 4.9 | 624–900 | CO2 | |
| Total | 51.9 | 25–900 |
| Sample | Chemical Formula |
|---|---|
| MA-fluo2 | [Mg0.73Al0.27(OH)2](NO3)0.13∙0.93H2O |
| CA-fluo2 | [Ca0.64Al0.36OH)2](NO3)0.18∙0.74H2O |
| CA-fluo1 | [Ca0.63Al0.37OH)2](NO3)0.18∙0.74H2O |
| CA-fluo0.2 | [Ca0.63Al0.37OH)2](NO3)0.18∙0.80H2O |
| Sample | BET Area (m2/g) |
|---|---|
| MA-fluo2 | <1 1 |
| CA-fluo2 | 18 |
| CA-fluo1 | 19 |
| CA-fluo0.2 | 17 |
| Sample | Particle Size (μm) | |||
|---|---|---|---|---|
| Dry | Wet | |||
| d(0.5) Aggregated | d(0.5) De-Aggregated | d(0.5) Aggregated | d(0.5) De-Aggregated | |
| MA-fluo2 | 269 | 47 | 8 | 190 |
| CA-fluo2 | 113 | 21 | 8 | 7 |
| CA-fluo0.2 | 149 | 8 | 6 | 6 |
© 2020 by the authors. Licensee MDPI, Basel, Switzerland. This article is an open access article distributed under the terms and conditions of the Creative Commons Attribution (CC BY) license (http://creativecommons.org/licenses/by/4.0/).
Share and Cite
Dietmann, K.M.; Linke, T.; Reischer, M.; Rives, V. Fluorescing Layered Double Hydroxides as Tracer Materials for Particle Injection during Subsurface Water Remediation. ChemEngineering 2020, 4, 53. https://doi.org/10.3390/chemengineering4030053
Dietmann KM, Linke T, Reischer M, Rives V. Fluorescing Layered Double Hydroxides as Tracer Materials for Particle Injection during Subsurface Water Remediation. ChemEngineering. 2020; 4(3):53. https://doi.org/10.3390/chemengineering4030053
Chicago/Turabian StyleDietmann, Karen Maria, Tobias Linke, Markus Reischer, and Vicente Rives. 2020. "Fluorescing Layered Double Hydroxides as Tracer Materials for Particle Injection during Subsurface Water Remediation" ChemEngineering 4, no. 3: 53. https://doi.org/10.3390/chemengineering4030053
APA StyleDietmann, K. M., Linke, T., Reischer, M., & Rives, V. (2020). Fluorescing Layered Double Hydroxides as Tracer Materials for Particle Injection during Subsurface Water Remediation. ChemEngineering, 4(3), 53. https://doi.org/10.3390/chemengineering4030053


