Article

Amino Ethers of Ortho-Phosphoric Acid as Extragents for Ethanol Dehydration

by
Alexander V. Klinov
1,
Alexander V. Malygin
1,
Alina R. Khairullina
1,
Alisa R. Davletbaeva
2,
Oleg O. Sazonov
2,
Ivan P. Anashkin
1 and
Ilsiya M. Davletbaeva
2,*
1
Department of Chemical Process Engineering, Kazan National Research Technological University, 420015 Kazan, Russia
2
Technology of Synthetic Rubber Department, Kazan National Research Technological University, 420015 Kazan, Russia
*
Author to whom correspondence should be addressed.
ChemEngineering 2021, 5(4), 71; https://doi.org/10.3390/chemengineering5040071
Submission received: 23 September 2021 / Revised: 15 October 2021 / Accepted: 18 October 2021 / Published: 21 October 2021
(This article belongs to the Special Issue Feature Papers in Chemical Engineering)

Abstract

:
Amino ethers of ortho-phosphoric acid prepared using triethanolamine; ortho-phosphoric acid; polyoxyethylene glycol, diethylene glycol, triethylene glycol and glycerol (AEPA-DEG/TEG/Gl) were investigated as extractants for the separation of aqueous ethanol solutions by extractive distillation. Using the method of open evaporation, the influence of the molecular structure of AEPA-DEG/TEG/Gl on the conditions of vapor–liquid equilibrium in ethanol–water solutions was studied. It has been shown that the addition of AEPA-DEG/TEG/Gl removes the azeotropic point. At the same time, the observed effect turned out to be significantly higher in comparison with the use of pure glycerol or glycols for these purposes. The UNIFAC model was used to calculate the activity coefficients in a three-component ethanol–water–AEPA-DEG/TEG/Gl mixture. Within the framework of this model, a division of AEPA-DEG/TEG/Gl molecules into group components is proposed. Previously unknown parameters of the groups PO–CH, PO–CH2, PO–OCH2, PO–NHCH2, PO–OH, and PO–H2O were determined from our own and published experimental data. The concentration dependences of the density and dynamic viscosity of AEPA-Gl aqueous solutions have been experimentally measured. Experimental studies of the extractive distillation of ethanol–water using AEPA-Gl as an extractant have been carried out in a column with bubble cap plates and a packing, and its high efficiency has been established.

1. Introduction

Ethanol is widely used in many applications, for example, as a raw material for the chemical synthesis of ethers, as a solvent in the paint and varnish industry, in the production of household chemicals, medicines, food products, and as one of the most commonly used types of biofuels. The production of anhydrous ethanol has become one of the most important issues in many countries of the world due to the great efforts aimed at using biofuels to reduce pollution and environmental impact. Currently known methods of ethanol dehydration are azeotropic distillation [1,2], extractive distillation [3,4,5,6,7,8,9,10], adsorption on activated carbon and molecular sieves, and membrane technologies [11,12,13,14,15,16,17,18,19,20]. Studies have shown that the process of extractive distillation is a rather promising technology for the dehydration of alcohols from the point of view of operation and efficiency, which primarily depend on the properties of the extractant used [21,22,23]. The main requirements for the extractant are its low cost, a significant effect on the relative volatility of ethanol, ease of regeneration, and inertness to the equipment material.
Currently, the main solvents used in extractive distillation for ethanol dehydration are glycols [5,24] and glycerol [25,26,27]. A more complete review of solvents affecting the relative volatility of alcohol is presented in [28]. However, these solvents have some disadvantages; for example, volatile extractants can contaminate the distillate, and their regeneration is possible in devices with many separation stages. It has been proposed to use salts as nonvolatile extractants [3,6,7,29], but despite their effectiveness in influencing the relative volatility of alcohol, salts have not become widespread in industrial technologies due to their complex regeneration and corrosive activity. In the last decade, much attention has been paid to the study of the properties of ionic liquids (ILs) and deep eutectic solvents, including their use as extractants for the separation of aqueous solutions of alcohols [9,30,31,32,33,34,35,36]. ILs, depending on their structure, can significantly change the relative volatility of alcohol, are practically non-volatile, and are in a liquid state at temperatures <100 °C. The main obstacle to the use of ILs in industrial technologies is their high cost. In [37,38], we presented the results of a study of the properties of amino ethers of boric acid (AEBA), which are synthesized based on boric acid, triethanolamine, and glycols of various structures. It was shown that they exhibit properties similar to IL, but at the same time have a much lower cost. This makes it possible to consider AEBA as a promising solvent for the extractive distillation of aqueous solutions of alcohols (ethanol, isopropanol).
The aim of this work was to evaluate the effect of amino ethers of ortho-phosphoric acid (AEPA) [39,40] on the conditions of phase equilibrium of aqueous ethanol solutions. The AEPA obtained using triethanolamine; ortho-phosphoric acid; and polyoxyethylene glycol, diethylene glycol, triethylene glycol and glycerol (AEPA-PEG/DEG/TEG/Gl) were investigated. AEPA-PEG/DEG/TEG/Gl, like AEBA, has ion pairs separated in space, imparting the properties inherent in ILs; are practically non-volatile; are in a liquid state under normal conditions; and have a low cost [39,40].
To assess the efficiency of AEPA-PEG/DEG/TEG/Gl as an extractive agent, the following problems were solved in this work: the conditions of vapor–liquid equilibrium in aqueous solutions of ethanol in the presence of amino ethers of ortho-phosphoric acid were studied, a method for calculating the activity coefficients of components in such mixtures was proposed, and experimental studies of the extractive distillation process in a packed column and plates were carried out.

2. Materials and Methods

2.1. Materials

All glycols, i.e., polyethylene glycol with MM = 400 (PEG), diethylene glycol (DEG), triethylene glycol (TEG), and glycerol (Gl) were purchased from PJSC Nizhnekamskneftekhim (Nizhnekamsk, Russia). Triethanolamine (TEA) was purchased from OJSC Kazanorgsintez (Kazan, Russia). An 85% aqueous solution of ortho-phosphoric acid (H3PO4) was purchased from MCD Chemicals, Ltd. (Moscow, Russia). Glycols and glycerol were additionally dehydrated at a vacuum depth of 1.3–4 mbar and a temperature of 90 °C to a moisture content less than 0.01 wt.%. These conditions were chosen experimentally, and they ensured the constancy of the residual water content. For carrying out distillation experiments, ethanol (96.3 wt.%) was used. For the preparation of aqueous solutions and mixtures, deionized water was used, prepared on the Osmodemi 12 installation.

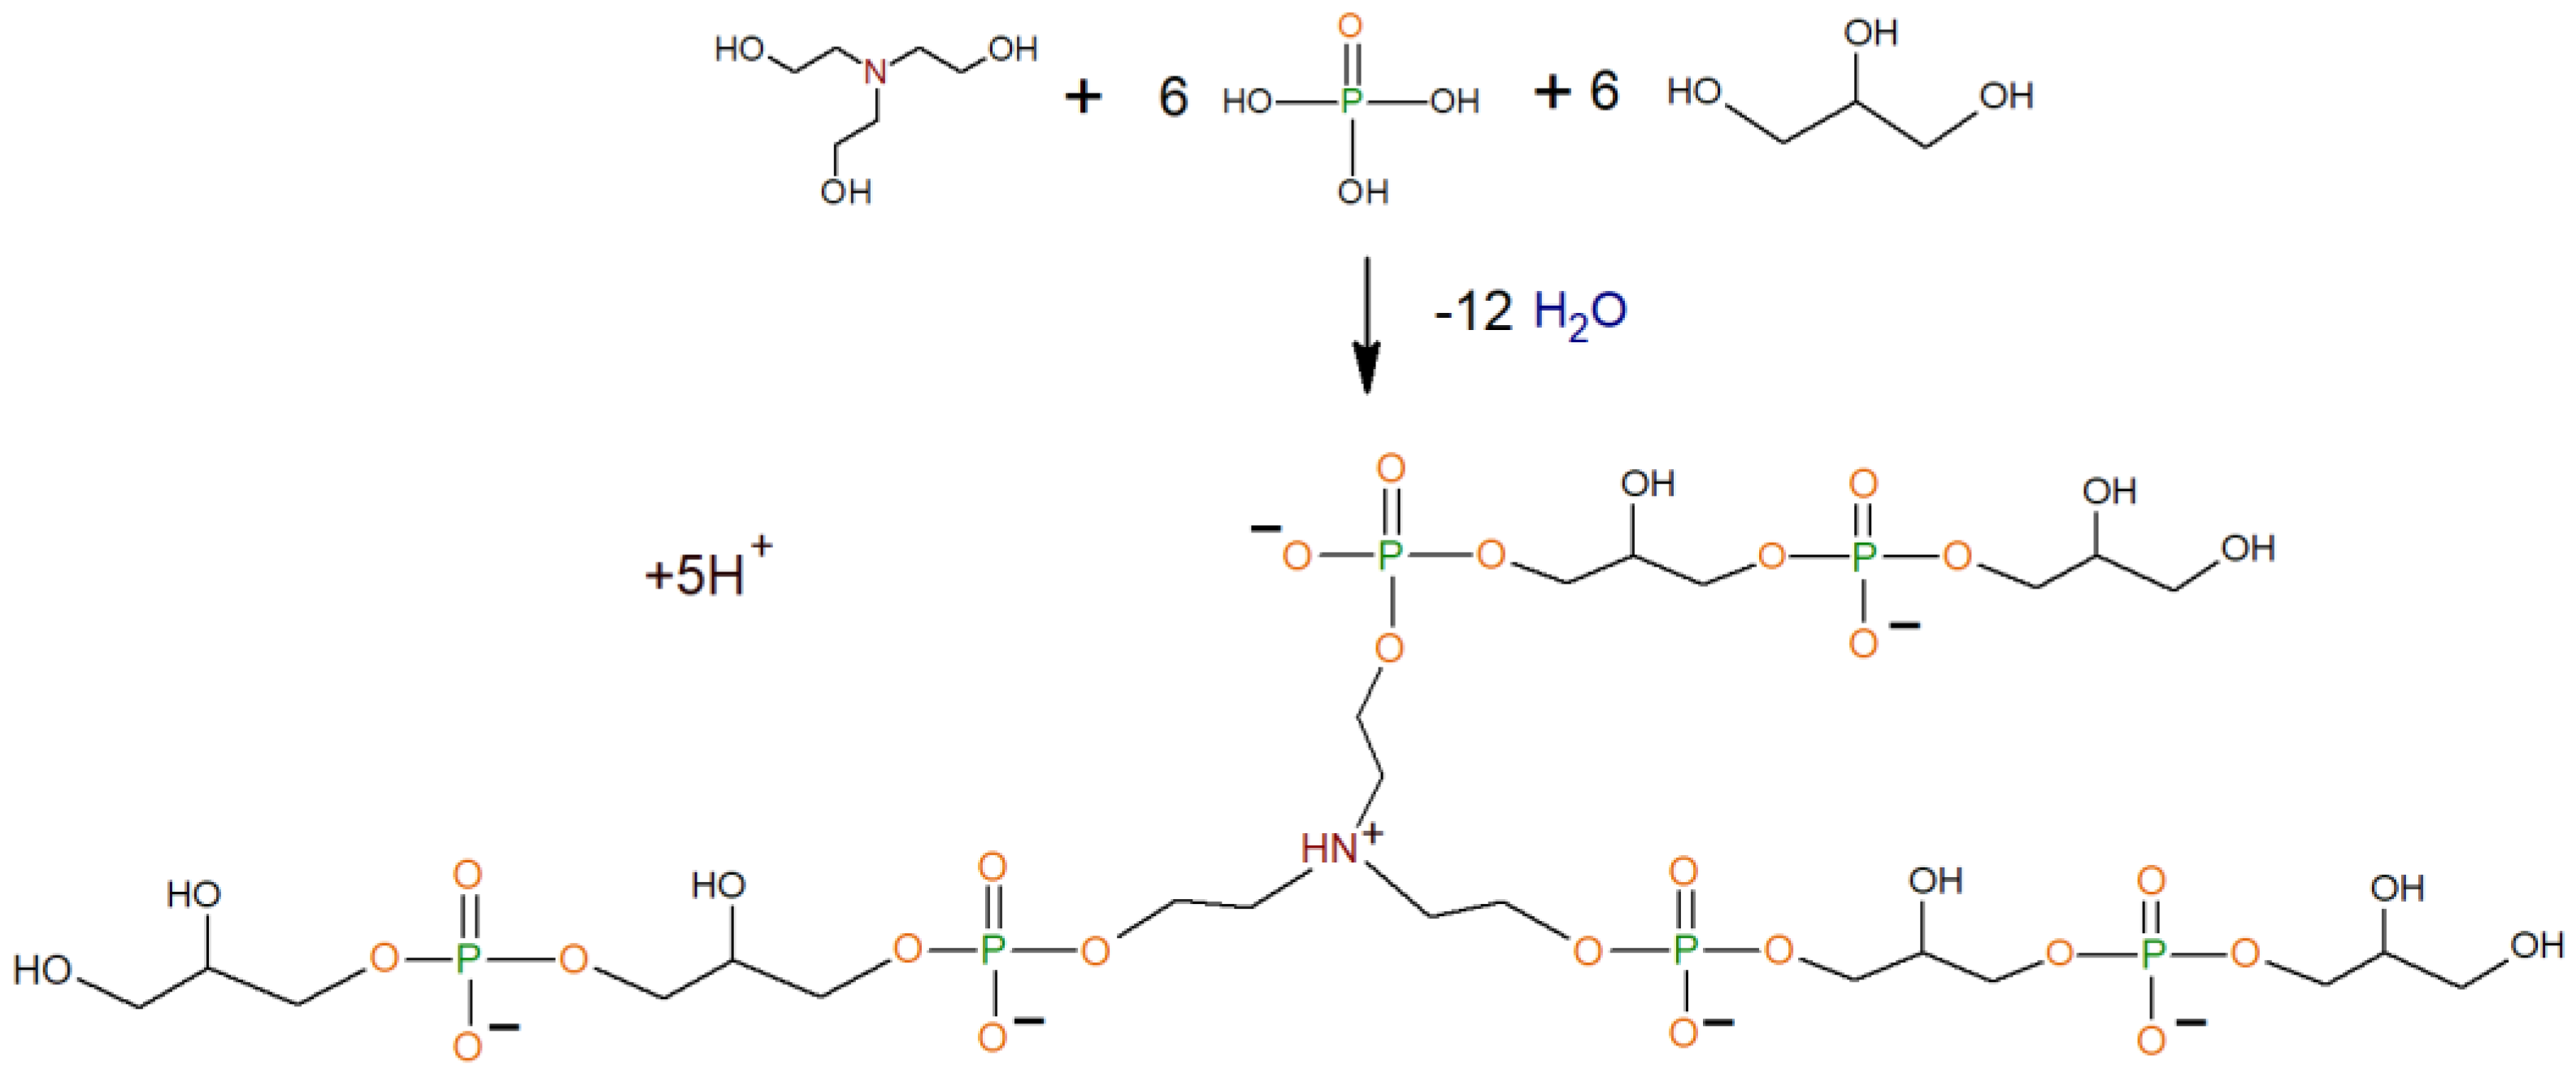
2.2. Synthesis Process

Amino ethers of ortho-phosphoric acid based on triethanolamine; ortho-phosphoric acid; and polyoxyethylene glycol, diethylene glycol, triethylene glycol and glycerol (AEPA-PEG/DEG/TEG/Gl) were obtained in one step. TEA, H3PO4, and PEG/DEG/TEG/Gl were used at their molar ratios [TEA]:[H3PO4]:[PEG/DEG/TEG/Gl] = 1:6:6. The calculated amount of H3PO4 and PEG/DEG/TEG/Gl was placed in a round-bottom flask and mixed for two minutes, then TEA was added to the reaction system. Within two hours, the reaction mass was stirred at T = 80 °C and a residual pressure of 0.7 kPa. The vacuum was created with an oil pump connected to a U-shaped moisture trap filled with zeolite. Since the dissolution rate is greater than the reaction rate, the natural bubbling of water released during the reaction carried out the mixing.
The removal of water from the AEPA-PEG/DEG/TEG/Gl after the reaction was carried out on a rotary evaporator IKA-RV 10 for 1.5–2 h at an absolute pressure of 13 mm Hg and a temperature of 120 °C. Before and after drying, the mass of the mixture and the concentration of water in it were measured. The water content was measured using a Mettler Toledo V20 volumetric titrator according to the Karl Fischer method and the mass of the samples was measured on an OHAUS Adventurer AX124 analytical balance with a discreteness of 0.0001 g and a precision of ±0.0001 g. According to the material balance data, it was found that the mass of AEPA-PEG/DEG/TEG/Gl in a cube remained unchanged, which confirms the infinitely small volatility of amino ethers of ortho-phosphoric acid.
In our previous works, by using various methods including NMR and FTIR spectroscopy and titration of hydroxyl groups, we studied in detail the structure of AEPA obtained on the basis of polyoxypropylene glycol [39,40,41,42]. In this case, we used polyoxyethylene glycol/diethylene glycol/triethylene glycol/glycerol with the same stoichiometric ratio. The reaction was quenched after the desired amount of hydroxylation toward the target product. The reaction progress was monitored by titration to determine a hydroxyl groups concentration.
The synthesis of amino ethers of ortho-phosphoric acid exemplified by AEPA-Gl is carried out according to Scheme 1.

2.3. Preparation of Aqueous Solutions and Mixtures

For the preparation of AEPA-PEG/DEG/TEG/Gl aqueous solutions and mixtures, deionized water was used. Samples were prepared on Shinco ADJ scales with a measurement error of ±0.0001 g.

2.4. Phase Equilibrium Experiments

To assess the effect of amino ethers of ortho-phosphoric acid on the relative volatility of alcohol in aqueous solutions, data on the vapor–liquid phase equilibrium in the three-component ethanol–water–AEPA-PEG/DEG/TEG/Gl system are required. Many methods are known for measuring the conditions of the vapor–liquid phase equilibrium. The accuracy of these measurements depends on a number of factors related to the design of the measuring cell and the nature of the system being measured. Therefore, even with very careful control of temperature and pressure measurements, there may be a discrepancy between the results obtained by different authors [43]. An increase in the measurement accuracy leads to a significant increase in the complexity of experiments. In this work, to study the vapor–liquid equilibrium in ethanol–water–AEPA-PEG/DEG/TEG/Gl systems, the method of open evaporation was chosen. This method was one of the first to be used to study the vapor–liquid phase equilibrium, including azeotropic mixtures [44]. In comparison with other methods of equilibrium measurement, it is less laborious and rather quickly makes it possible to qualitatively and quantitatively evaluate the effect of the addition of solvents on the conditions of phase equilibrium in an azeotropic mixture in a certain concentration range.
To carry out experimental studies on the phase equilibrium of vapor–liquid, an IKA-RV 10 digital rotary evaporator was used. The experimental technique and the evaluation of the results obtained are described in detail in [37]. The initial liquid mixture of a given composition in the amount of 200–250 g was poured into a cube-evaporator, which was immersed in an oil bath. To ensure intensive boiling, the temperature of the liquid in the oil bath was set at 10–20 °C above the boiling point of the mixture, which was determined in preliminary experiments. After the start of boiling, the forming vapors condensed and the resulting distillate was collected in a receiving flask, which, after accumulating it in an amount of 10–20 g, was taken for composition analysis. The evaporation process was carried out continuously with the sequential selection of 6–8 portions of the distillate until the residual content of one-tenth of the amount of the initial water–alcohol mixture in the evaporator cube was reached. The rest of the cube was weighed and the residual water content was determined. The data obtained were checked for compliance with the material balance, and the error did not exceed 1.5%. The resulting distillates are a binary alcohol–water mixture; therefore, the Karl Fischer titration method in a Mettler-Toledo V20 volumetric titrator was used to determine the water content.
The mass of the i-th portion of the distillate Pi and its composition yi, measured during the experiment, make it possible to determine the dependence of the change in the composition of the boiling mixture x on its mass L according to the material balance equations:
x i + 1 = L i x i P i + 1 y i + 1 L i P i + 1 ; i = 0 n 1  
L i + 1 = L i P i + 1
where n is the number of distillate samples taken and x and L were taken to be the mass concentration of ethanol in the mixture and the mass of the boiling mixture without taking into account the extractant. Based on these data, it is possible to construct the so-called residue curves.
The work also carried out measurements of the boiling points of the binary mixtures alcohol–AEPA and water–AEPA. To measure the boiling point of the binary mixtures, the Swietoslavsky ebulliometer were used (JSC “Khimlaborpribor”). The scheme of the ebulliometer and the experimental technique are presented in detail in [37].

2.5. Viscosity and Density Measurements

The dynamic viscosity of the samples was determined at T = 20 °C and atmospheric pressure on an SVM 3000 Stabinger Viscometer (Anton Paar, Austria), with a systematic error of ±0.35% of the measured value. At the same time, the density of the samples was determined with a systematic error of ±0.0005 g/cm3 and the limit of the permissible relative measurement error for temperature was ±0.02 °C. The measurement range for dynamic viscosity was from 0.2 to 104 MPa·s, for density was from 650 to 2000 kg/m3, and for temperature was from −40 to 100 °C.

3. Results

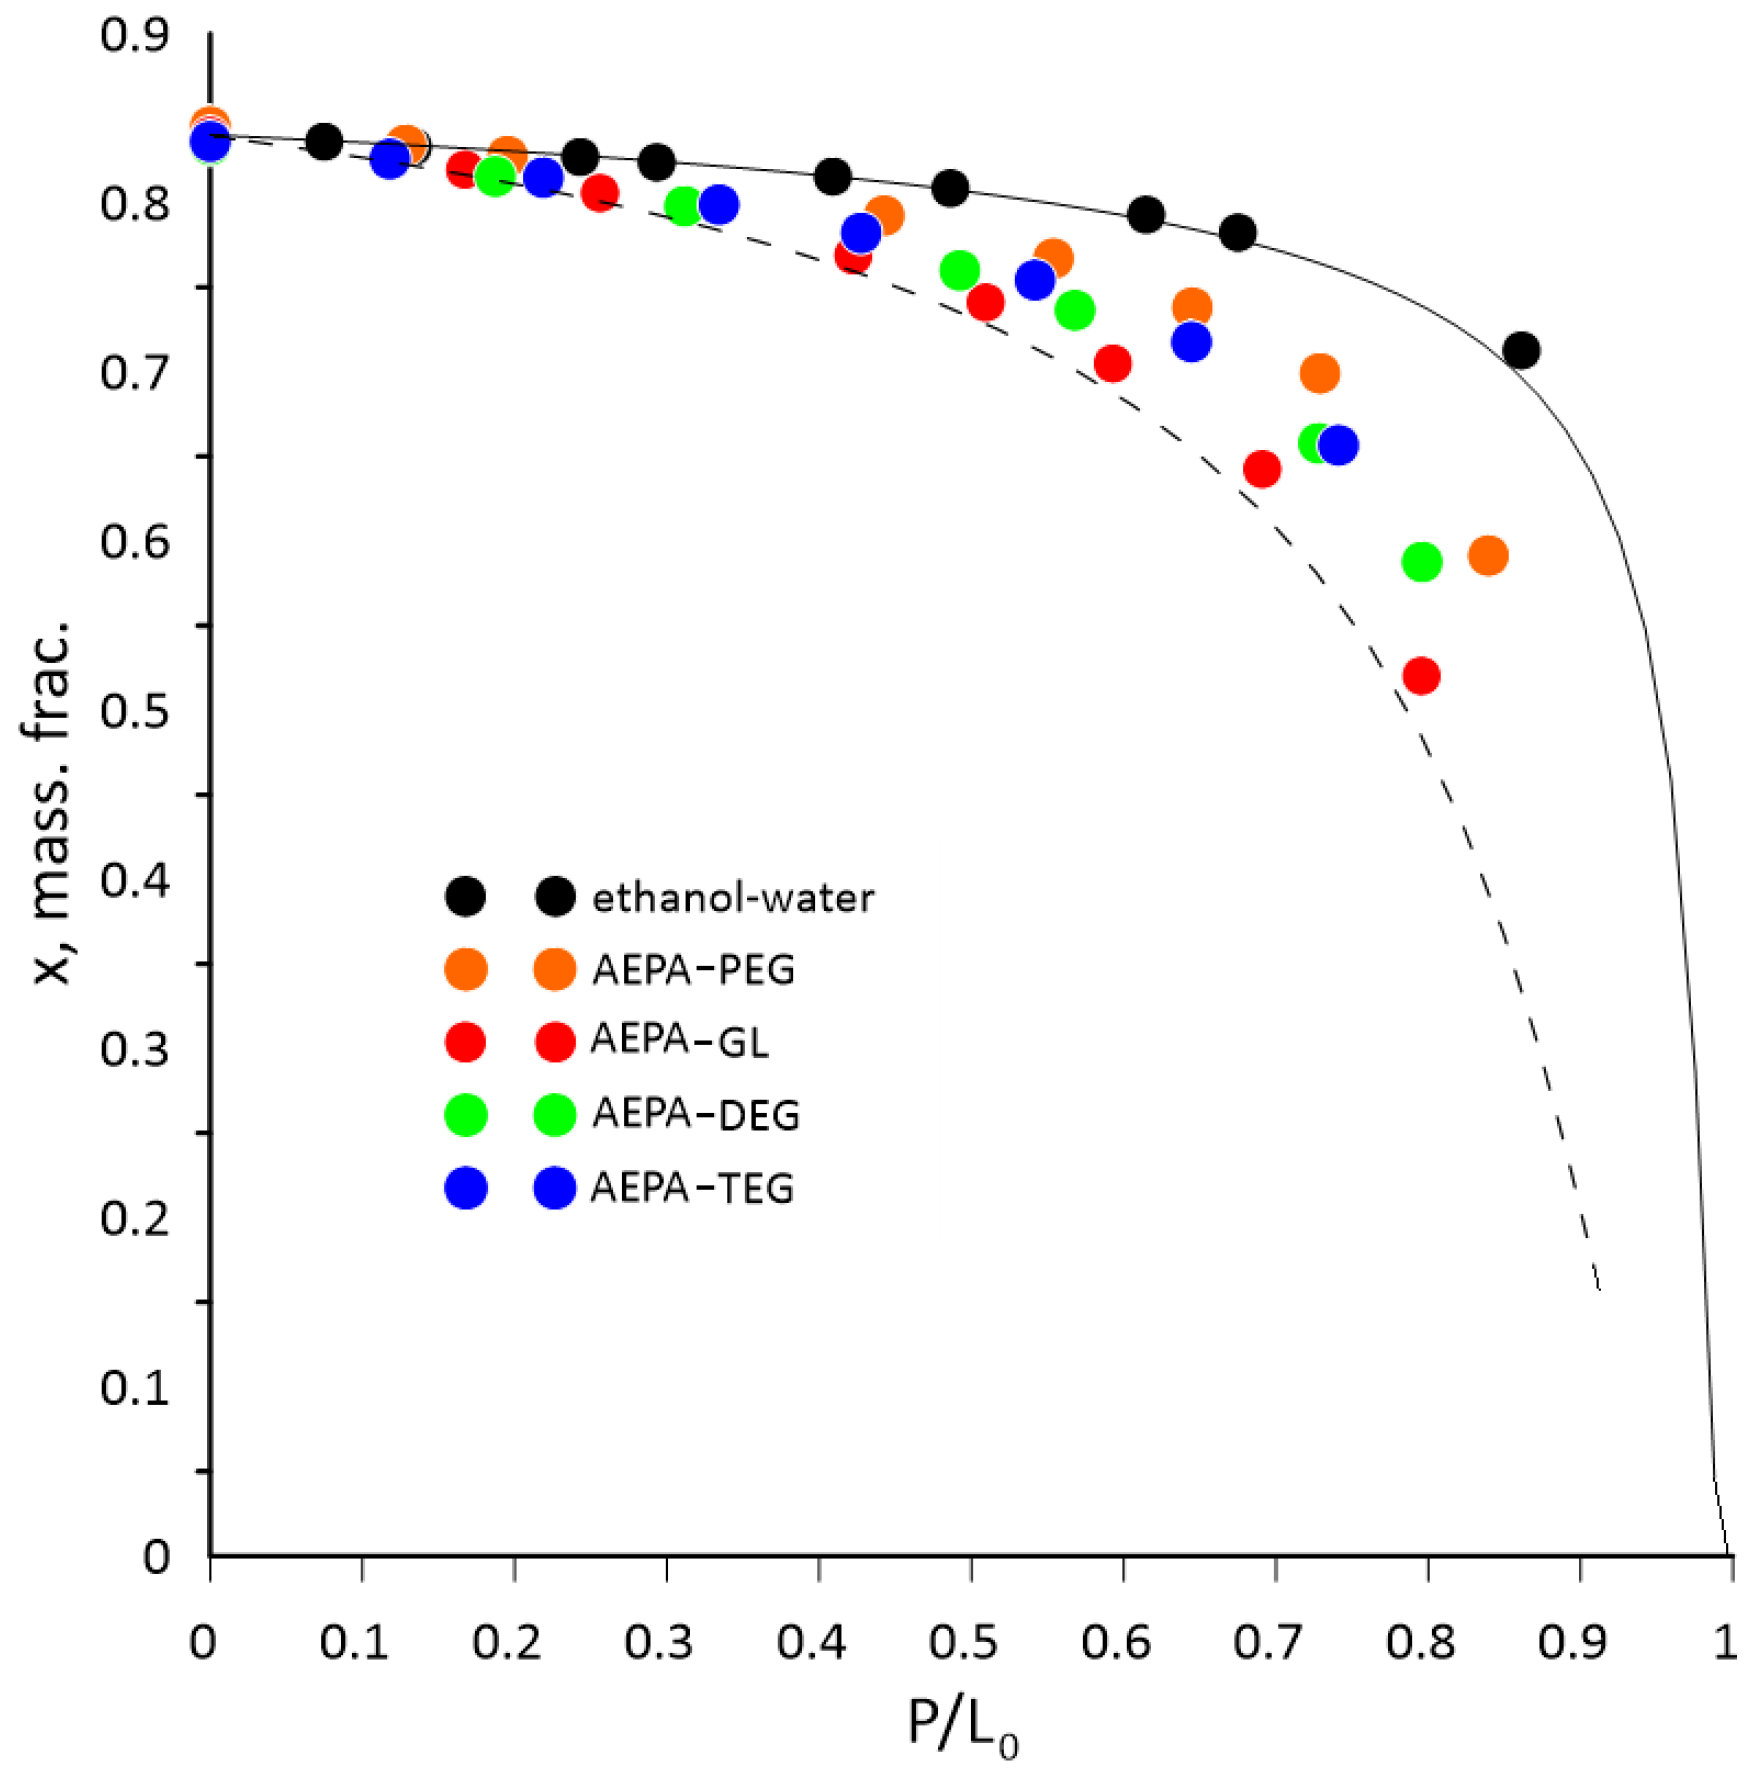
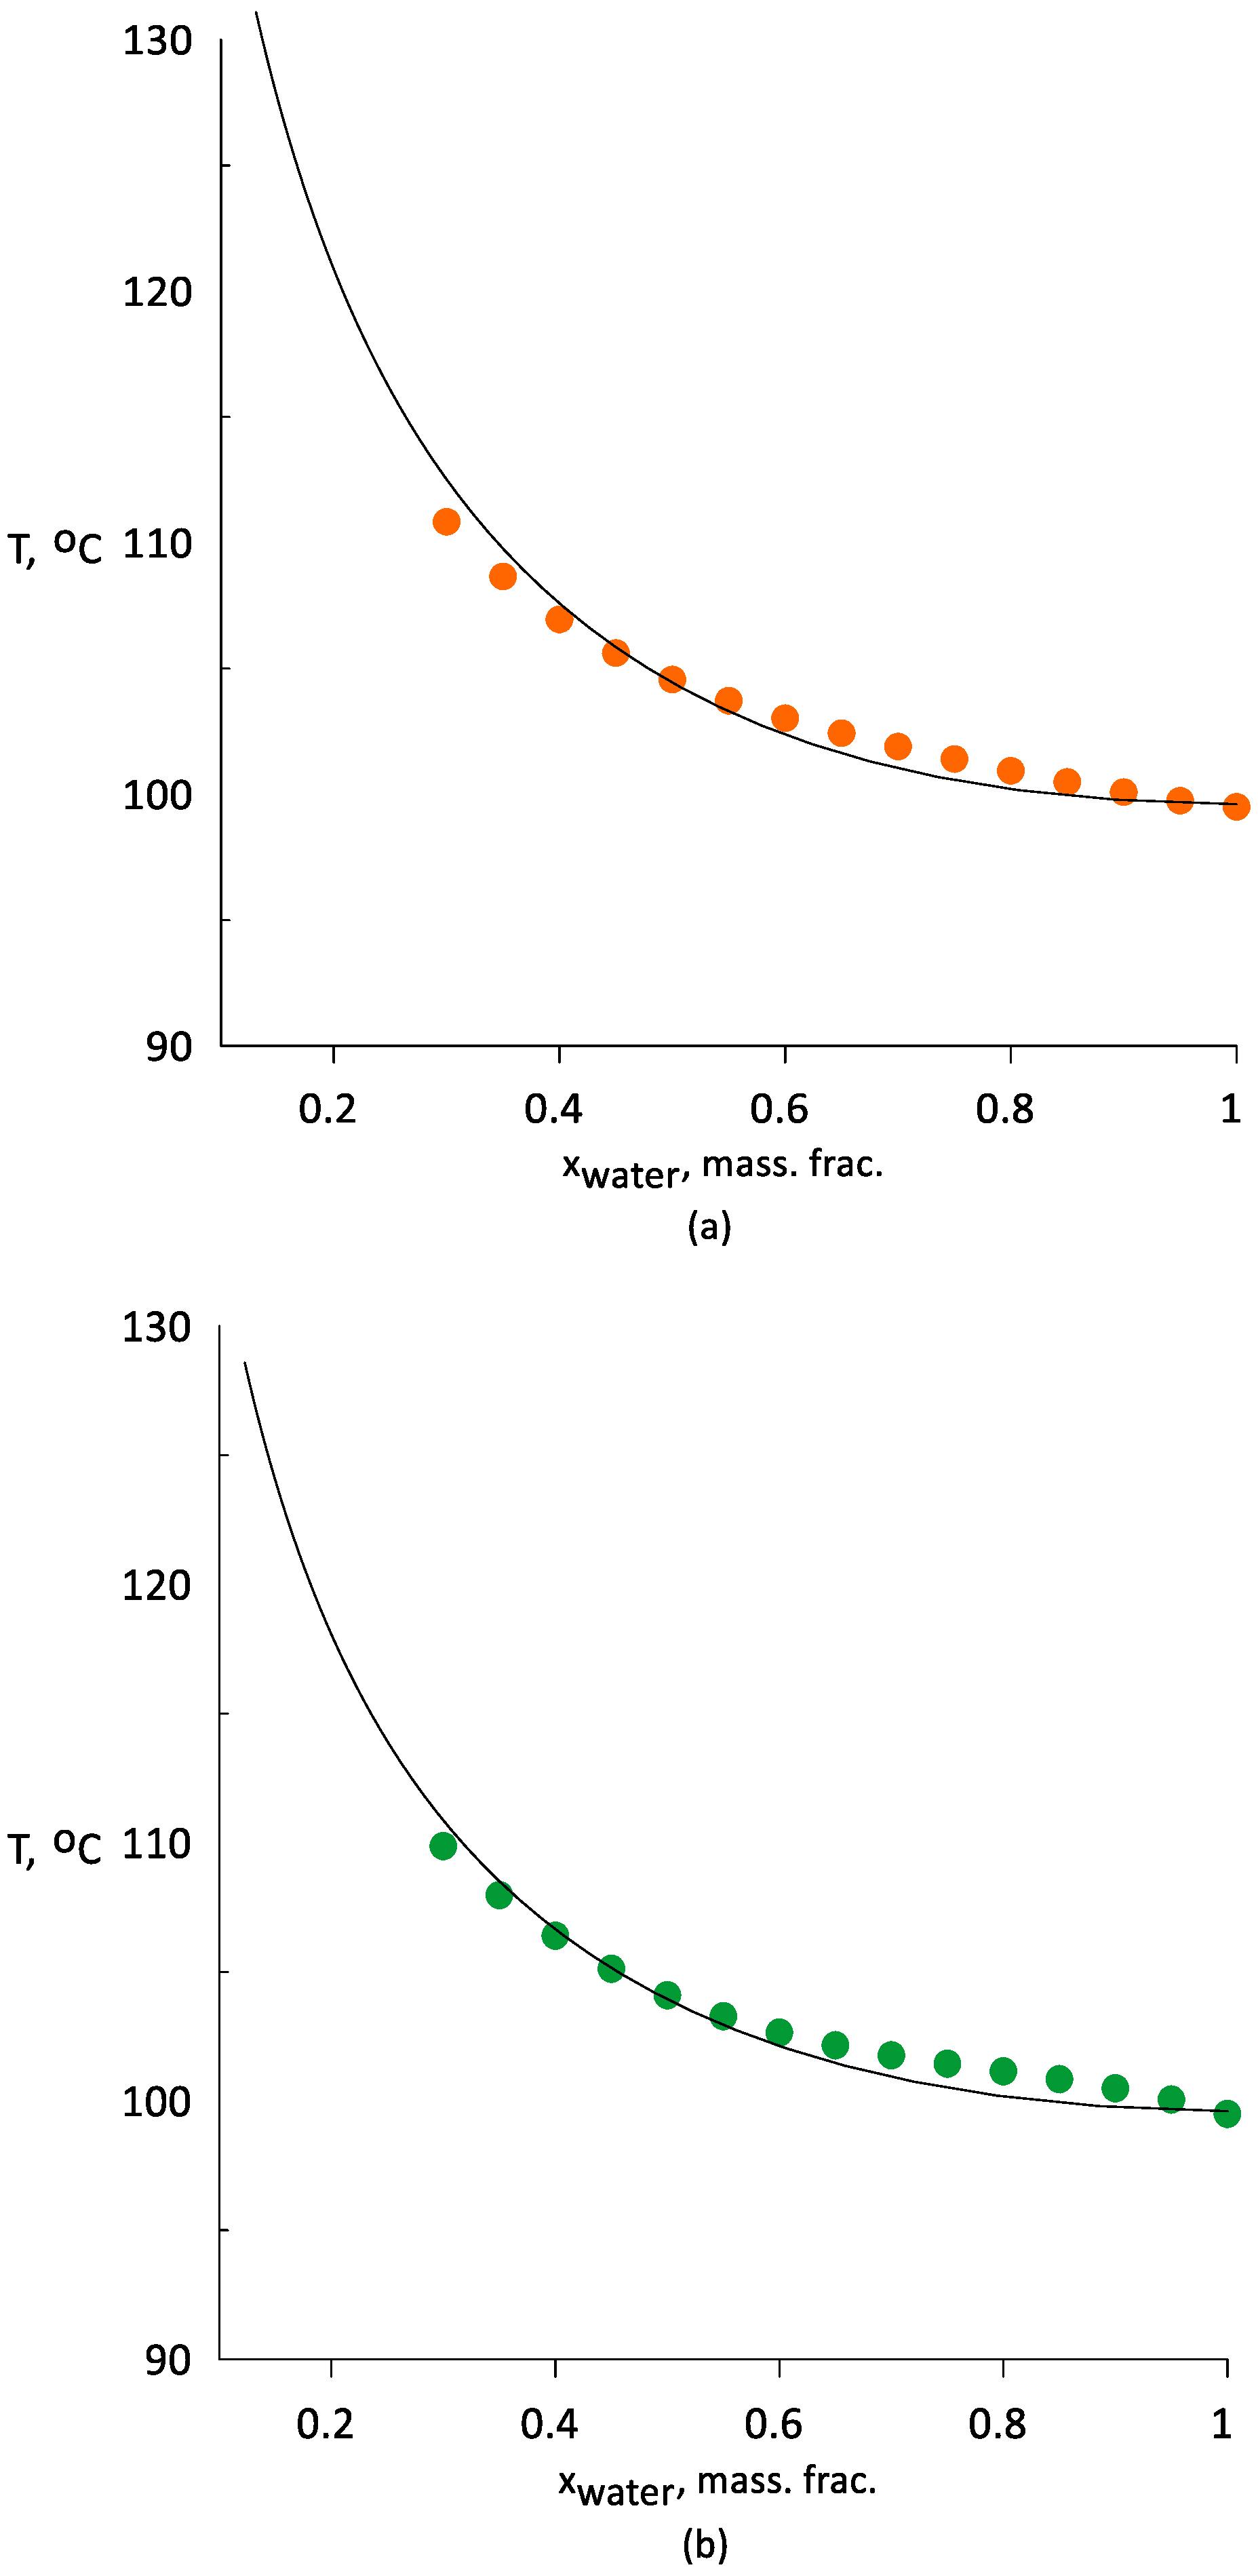
3.1. Vapor–Liquid Equilibrium of Water–Ethanol Mixtures with AEPA-(PEG/TEG/DEG/GI)

Based on the data obtained, the so-called residual concentration lines (residual curves) were plotted for a binary aqueous solution of ethanol and the ethanol–water–AEPA-(PEG/DEG/TEG/Gl) mixture (Figure 1). It can be seen that the addition of AEPA-(PEG/DEG/TEG/Gl) increases the relative volatility of the alcohol, which leads to its more rapid depletion in the still. This behavior of the open evaporation curves is a consequence of the disappearance of the azeotropic point for an aqueous solution of ethanol in the presence of AEPA-(PEG/DEG/TEG/Gl). Figure 1 also shows some regularity in the deviation of the open evaporation curves of a binary ethanol–water mixture relative to the ethanol–water–AEPA-(PEG/DEG/TEG/Gl) mixture. Calculating the average deviation from the experiment was less than 2.5%, and the maximum error was 6%. The largest deviation was observed for AEPA-Gl, and the smallest for AEPA-PEG. Such a regularity of the influence of extractants on the ethanol–water mixture can be traced not only in mass, but also in molar concentrations. The most probable explanation of the obtained regularity, in our opinion, is associated with the proportion of OH groups in one molecule of the extractant (Table 1). Here, it should be noted that the OH group has a significant dipole moment. Since the dipole moment of water is higher than that of ethanol, the dipole–dipole interaction of water and the OH group present in the extractant molecules keeps water in solution, reducing its relative volatility.
To simulate the conditions of phase equilibrium in the three-component ethanol–water–AEPA-(DEG/TEG/Gl) system, the UNIFAC model was used [45], within which the activity coefficients are calculated from the parameters of the group constituents of the mixture molecules. Molecules of AEPA-(DEG/TEG/Gl) will differ only by the number of groups of the same type, the parameters of which can be determined based on the specific AEPA-(DEG/TEG/Gl) structure, for example, AEPA-TEG and AEPA-Gl. In this case, the UNIFAC model has the potential to predict the conditions of phase equilibrium for the ethanol–water–AEPA-(DEG/TEG/Gl) mixtures.
Within the framework of the UNIFAC model, the molecules of substances must be divided into group components. For water molecules and various alcohols, such a division is already known [45]. In [46], it was proposed to divide the phosphate molecule into the following groups: CH3, CH2, OCH2, and PO. Taking into account the foregoing, the division of molecules of AEPA-(DEG/TEG/Gl) was carried out into the following groups: PO, phosphate group; CH, alkane group; CH2, alkane group, OCH2, ether group; NHCH2, amino-alkane group, and OH, alcohol group. The group composition of the molecules of AEPA-(DEG/TEG/Gl) considered here is shown in Table 1.
The activity coefficients in the UNIFAC model are represented as follows:
l n γ i = l n γ i C + l n γ i R
The first term is called the combination contribution, and the second is called the residual. To determine the combination contribution to the activity coefficient, data on the parameters of the group volume R and the group surface Q are required, which are related by the values of the van der Waals group volume Vk and the surface area Ak (van der Waals group volume and surface areas) [42,44]:
R k = V ω k 15.17 ;
Q k = A ω k 2.5 · 10 9 ,
The values of RK = 0.9371 and QK = 0.9809 for the PO group were taken from [44].
The residual (energy) part of the activity coefficient in group models is represented by the sum of the contributions of groups, which are characterized by the parameters of group interaction ψmn:
ψ m n = e x p ( a m n T )
where amn is the parameter of interaction between groups n and m. For each group-to-group interaction, amnamn two parameters are used.
Analysis of the literature [45,46,47,48] and the most complete database on the parameters of group interaction for the UNIFAC model in the form of UNIFAC Matrix 2020, presented in the Dortmund data bank (DDB) [49], showed the lack of data on the parameters of interaction with the PO group. Therefore, in this work, based on the available experimental data, the energy parameters of the interaction of the PO group with other groups present in the solutions under consideration were determined: PO–CH, PO–CH2, PO–OCH2, PO–NHCH2, PO–OH, and PO–H2O. To reliably determine the energy parameters of the UNIFAC model, experimental VLE data are required, as well as the activity coefficients of the components at infinite dilution [50,51]. Analysis of the DDB [52] showed that VLE data with phosphate solutions are rather limited. The data for the activity coefficients in a binary mixture of tributyl phosphate-n-hexane (TBP) turned out to be useful (Figure 2) [53]. Using these data, the parameters of the groups PO–CH2 and PO–OCH2 were determined (Table 2). The minimizing of the sum of squared residuals algorithm was used to determine the parameters of the groups. The average deviation of the calculated activity coefficients from the experimental data was 3.5%. A comparison of the calculated and experimental data is shown in Figure 2.
To determine the parameters of the group interaction of the remaining unknown parameters of the PO–NHCH2, PO–OH, and PO–H2O groups, we used the experimental data on the boiling points of AEPA-Gl-ethanol and AEPA-(DEG/Gl)–water mixtures.
As in our previous work [38], the experimental data were obtained using the setup proposed by Swietoslawski. The results of comparing the calculated and experimental data are shown in Figure 3 and Figure 4, and the average discrepancy was 1%.
The parameters of the interaction of the PO group determined by the boiling points are presented in Table 2.
The verification of the adequacy of the description of the vapor–liquid equilibrium of aqueous-alcoholic solutions in the presence of AEPA-(DEG/TEG/Gl) was carried out by comparing the calculated and experimental data on open evaporation. Residual concentration curves were calculated using the equation of open evaporation (Rayleigh equation) of a binary mixture [43]:
y ( x ) * = dx dln ( L ) + x
where x and L are the composition and mass of the boiling mixture and y(x)* is the equilibrium vapor composition, which was determined on the basis of the UNIFAC model using the parameters given in Table 2.
Figure 1 shows the comparison of residual curves obtained for the ethanol–water–AEPA-(DEG/TEG/Gl) mixture at [AEPA-(DEG/TEG/Gl)] = 60 wt.%. Figure 5 and Figure 6 show the comparison of residual curves obtained for the ethanol–water–AEPA-(DEG/Gl) mixture at [AEPA-(DEG/Gl)] = 20 wt.%. A good agreement between experimental and calculated data is seen, confirming the adequacy of certain energy parameters for the UNIFAC model. The average error was less than 3.5%, and the maximum error reached 11%.
To compare the effectiveness of AEPA-(DEG/TEG/Gl) as an extractive agent, it is convenient to use the change in the relative volatility of ethanol in an aqueous solution at the azeotropic point:
α 12 = y 1 x 1 y 2 x 2
where y1, y2 are the equilibrium concentrations of ethanol and water in vapor over a binary solution determined according to the UNIFAC model and x1, x2 are the concentrations of ethanol and water in solution.
Figure 7 shows the results of comparing the coefficient of relative volatility of ethanol in the ethanol–water–AEPA-(DEG/TEG/Gl) mixture and in the ethanol–water–propylene glycol/glycerol/IL (EmimCl) mixture at the azeotropic point. It should be noted here that polypropylene glycol and glycerol are the main industrial extractants.
The results of comparing the relative volatility coefficient ethanol in ethanol–water– propylene glycol/glycerol were obtained by solving Equation (7), wherein the dependence of the equilibrium composition of the vapor phase from the liquid composition was picked on the basis of an NRTL model [54]. The adequacy of the calculations was verified by comparison with the literature data [55].
The separation of molecules of imidazole IL EmimCl into group constituents was carried out similarly to the procedure in [56]. It has been shown in the literature that the ion pair in IL has a strong electrostatic interaction; therefore, it is necessary to consider the skeleton of the cation and anion together. The group parameters for modeling the separation process of the ethanol–water–Emim CL system based on the UNIFAC model were taken from [56,57].
The calculation results indicate the effectiveness of the extractant AEPA-Gl for dehydration of the ethanol–water mixture. Thus, the highest values of relative volatility were achieved when using AEPA-Gl as an extractant, and the lowest values were obtained when using AEPA-TEG. This is a consequence of the different proportions of OH groups (Table 1) in the AEPA-(DEG/TEG/Gl) molecules.
Thus, the separating ability of AEPA-Gl for an ethanol–water mixture corresponds to effective imidazole IL with the greatest effect on the relative volatility of ethanol.

3.2. Extractive Distillation of the Ethanol–Water Mixture Using AEPA-Gl

To confirm the effectiveness of using AEPA-Gl as an extractive agent in the separation of the ethanol–water mixture, an experiment was carried out on a distillation column. It is known that, in addition to the phase equilibrium conditions, the separation efficiency is influenced by the kinetics of mass transfer. The rate of interphase mass transfer is influenced by the hydrodynamic conditions of phase movement, as well as properties such as viscosity and diffusion coefficients of the mixture components. In order to evaluate the change in the viscosity of the liquid mixture in the extractive distillation column, the concentration and temperature dependences of the viscosity and density of aqueous solutions of AEPA-Gl were measured and presented in Table 3 and Table 4.
It can be seen that for the conditions of the extractive distillation process at a temperature of 80 °C (the content of AEPA-Gl is in the range of 40–50 wt.%), the viscosity of the liquid mixture AEPA-Gl aqueous solutions (3.9877 mPa·s) differs from the viscosity of water (0.355 mPa·s) by one order of magnitude. An increase in viscosity usually decreases the rate of mass transfer. Mass transfer coefficients are used to determine the mass transfer rate. In the case of a packed bed, the height of the transfer units is determined, and when using plates, the Murfrey efficiency is set. It is rather difficult to estimate with sufficient accuracy the change in these values when using AEPA-Gl as an extractant due to the lack of data on diffusion coefficients. Therefore, in this case, to assess the change in the kinetics of mass transfer, the height equivalent to a theoretical plate (HETP) was used:
HETP = H/NT
where H is the height of the contact part of the column and NT is the number of theoretical plates.
A decrease in the mass transfer rate should lead to a decrease in the number of theoretical plates in the column and an increase in HETP. Thus, the main objective of this experiment was to determine the change in the number of theoretical plates in the column with the addition of AEPA-Gl.
A schematic representation of the installation is shown in Figure 8. The distillation column had an internal diameter of 48 mm and consisted of two parts. The lower part of the column with a height of 1700 mm was filled with a packing of the “Inzhekhim-2000” type with a diameter of 12 mm [58]. In the upper part of the column, which was made of glass, there were five plates with one cap on each. The plates were installed in order to better mix the extractant with the reflux stream. A distributor was installed between the top and bottom of the column for feeding the liquid phase to the packing. The extractant, due to its low volatility, was fed to the upper plate by a gear metering pump. The cube was a 10 L container heated (in its lower part) by an electric heater. A tubular condenser was located on top of the column. The amount of reflux was controlled by the thermal balance of the condenser. For this, the temperature at the inlet and outlet of the refrigerator and the flow rate of cooling water were measured. We also measured the temperature of the liquid in the cube and the vapors entering the condenser. Measurements of the composition of the bottom liquid and the flowing down reflux were carried out by sampling through the appropriate choke.
The total volume of a water–alcohol mixture poured into the installation, containing 20 wt.% ethanol was about 3 L. The experiments were carried out at an infinite reflux ratio. The amount of heat supplied to the cube was selected from the condition of stable operation of the column packing in the film mode. This usually corresponds to a steam flow rate of 1 g/s. The onset of a stationary mode of operation of the distillation unit was recorded by constant values of the temperatures of the still and distillate vapors. Then, samples of the bottom liquid and reflux were taken and their composition was measured. The volume of samples was 10 mL (0.3% of the volume of the water–alcohol mixture poured into the installation); therefore, it did not affect the concentration distribution along the column height.
The number of theoretical plates corresponding to the contact part of the column was determined by separating a binary ethanol–water mixture. Experimental conditions and results are shown in Table 5. Several similar measurements have shown that the column contact contains the number of theoretical plates in the range from 8 to 9. The UNIFAC model was used to describe the vapor–liquid phase equilibrium conditions.
In further experiments with the extractant, its supply was carried out after the establishment of a stationary regime in the column (about 20 min from the start of heating the bottom of the column). Further, sampling was carried out only in the distillate every 5 min from the moment the extractant was fed. Table 6 shows the results of the experiment.
The experimental results show that the water content in the distillate turned out to be significantly less in comparison with its concentration at the azeotropic point. Taking into account the small number of theoretical plates in the column and the ratio of the extractant (the separated mixture, with a ratio of 0.5:1), it can be concluded that AEPA-Gl is highly separative.
A simulation was carried out for the experimental conditions using ChemCad 6.5. The addition of AEPA-Gl to the column led to an increase in the flow rate of the liquid phase and changed its properties (viscosity, diffusion coefficients, etc.). This could affect the kinetics of mass transfer in the liquid mixture. Therefore, in the simulation, the number of theoretical plates was selected from the condition of the best coincidence of the calculated and experimental data.
The results of modeling the process of extractive distillation of the ethanol–water mixture using AEPA-Gl as an extracting agent are presented in Table 6. It was determined that a satisfactory agreement between the experimental and calculated data is observed at 5.5 theoretical plates. Thus, the use of AEPA-Gl as an extractant led to a decrease in theoretical plates or a decrease in the separation efficiency due to a change in the kinetics of the mass transfer process in the liquid phase by 35%. Such a noticeable change in the number of theoretical plates can be associated not only with a change in the properties of the liquid phase, but also with the possible unsatisfactory mixing of the extractant with reflux on the upper plate. Thus, it is possible to increase the efficiency of the process by installing a mixing device on the extractant supply.

4. Conclusions

In this work, we studied the conditions of vapor–liquid equilibrium in aqueous solutions of ethanol in the presence of amino ethers of ortho-phosphoric acid. Studies have shown that AEPA-DEG/TEG/Gl are promising extractants for extractive distillation of the ethanol–water mixture. At the same mass, concentrations of AEPA significantly increase the relative volatility of ethanol compared to glycol and glycerol. Unlike the latter, AEPA-DEG/TEG/Gl have significantly lower volatility. This makes it possible to start the flow of AEPA-DEG/TEG/Gl to the upper plate without fear of contamination of the distillate. In addition, in the case of using a closed two-column scheme of ethanol dehydration, the process of AEPA-DEG/TEG/Gl regeneration is simplified. To calculate the activity coefficients of the components in AEPA–ethanol–water mixtures, the UNIFAC model of group constituents was used. A method for breaking the AEPA molecule into groups was proposed. The previously proposed unknown parameters of the UNIFAC model showed the adequacy of the calculated conditions of vapor–liquid phase equilibrium in ethanol–water–AEPA-DEG/TEG/Gl systems and can be used to simulate the processes of extractive distillation.
According to the obtained values of the viscosity of aqueous solutions of AEPA-Gl, under the conditions of the process of extractive distillation at a temperature of 80 °C and [AEPA-Gl] = 40 wt.%, the viscosity of the liquid mixture was 10 times higher than the viscosity of water under such conditions. Experimental studies of extractive distillation in a column showed an increase in HETP with the addition of AEPA-Gl compared to mass transfer in a binary ethanol–water mixture by 35%. This may be due to both a change in the properties of the liquid phase (viscosity, diffusion coefficients of the components) and unsatisfactory mixing of the extractant with reflux on the upper plates.

Author Contributions

Conceptualization, A.V.K. and I.P.A.; methodology, A.V.M.; software, O.O.S.; validation, O.O.S., A.R.D. and A.R.K.; formal analysis, A.R.K.; investigation, A.V.M. and O.O.S.; resources, I.P.A.; data curation, I.M.D.; writing—original draft preparation, A.V.K.; writing—review and editing, A.R.K. and I.P.A.; visualization, A.V.K. and I.M.D.; project administration, A.V.K.; funding acquisition, A.V.K. All authors have read and agreed to the published version of the manuscript.

Funding

This research was funded by the Ministry of Science and Higher Education of the Russian Federation, grant number 075-00315-20-01: “Energy saving processes of liquid mixtures separation for the recovery of industrial solvents”.

Institutional Review Board Statement

Not applicable.

Informed Consent Statement

Informed consent was obtained from all subjects involved in the study.

Data Availability Statement

The data presented in this study are available on request from the corresponding author.

Acknowledgments

The study was carried out using the equipment of the Center for Collective Use «Nanomaterials and Nanotechnology» of the Kazan National Research Technological University.

Conflicts of Interest

The authors declare no conflict of interest.

References

  1. Chianese, A.; Zinnamosca, F. Ethanol Dehydration by Azeotropic Distillation with Mixed Solvent Entrainer. Chem. Eng. J. 1990, 43, 59–65. [Google Scholar] [CrossRef]
  2. Gomis, V.; Pedraza, R.; Frances, O.; Font, A.; Asensi, J. Dehydration of Ethanol Using Azeotropic Distillation with Isooctane. Ind. Eng. Chem. Res. 2007, 46, 4572–4576. [Google Scholar] [CrossRef]
  3. Barba, D.; Brandani, V.; Giacomo, G.D. Hyperazeotropic Ethanol Salted-Out by Extractive Distillation Theorical Evaluation and Experimental Check. Chem. Eng. Sci. 1985, 40, 2287–2292. [Google Scholar] [CrossRef]
  4. Granjo, J.F.O.; Nunes, D.S.; Duarte, B.P.M.; Oliveira, N.M.C. A Comparison of Process Alternatives for Energy-Efficient Bioethanol Downstream Processing. Sep. Purif. Technol. 2020, 238, 116414. [Google Scholar] [CrossRef]
  5. Meirelles, A.; Weiss, S.; Herfurth, H. Ethanol Dehydration by Extractive Distillation. J. Chem. Tech. Biotechnol. 1992, 53, 181–188. [Google Scholar] [CrossRef]
  6. Fu, J. Simulation of Salt-Containing Extractive Distillation for the System of Ethanol/Water/Ethanediol/KAc. 2. Simulation of Salt-Containing Extractive Distillation. Ind. Eng. Chem. Res. 2004, 43, 1279–1283. [Google Scholar] [CrossRef]
  7. Furter, W.F. Extractive Distillation by Salt Effect. Chem. Eng. Commun. 1992, 116, 35–40. [Google Scholar] [CrossRef]
  8. Pinto, R.T.P.; Wolf-Maciel, M.R.; Lintomen, L. Saline Extractive Distillation Process for Ethanol Purification. Comput. Chem. Eng. 2000, 24, 1689–1694. [Google Scholar] [CrossRef]
  9. Pan, Q.; Shang, X.; Sun, L. Energy-Efficient Separation Process and Control Scheme for Extractive Distillation of Ethanol-Water Using Deep Eutectic Solvent. Sep. Purif. Technol. 2019, 219, 113–126. [Google Scholar] [CrossRef]
  10. Duan, C.; Li, C. Novel Energy-Saving Methods to Improve the Three-Column Extractive Distillation Process for Separating Ethyl Acetate and Ethanol Using Furfural. Sep. Purif. Technol. 2021, 272, 118887. [Google Scholar] [CrossRef]
  11. Delgado, J.A.; Agueda, V.I.; Uguina, M.A.; Sotelo, J.L.; Garcia-Sanz, A.; Garcia, A. Separation of Ethanol-Water Liquid Mixtures by Adsorption on BPL Activated Carbon with Air Regeneration. Sep. Purif. Technol. 2015, 149, 370–380. [Google Scholar] [CrossRef]
  12. Morales, J.Y.R.; Lopez, G.L.; Martinez, V.M.A.; Vazquez, F.J.S.; Mendoza, J.A.B.; Garcia, M.M. Parametric Study and Control of a Pressure Swing Adsorption Process to Separate the Water-Ethanol Mixture under Disturbances. Sep. Purif. Technol. 2019, 236, 116214. [Google Scholar] [CrossRef]
  13. Jacques, K.; Lyons, T.P.; Kelsall, D.R. Alcohol Textbook; Nottingham University Press: Nottingham, UK, 2003; p. 446. [Google Scholar]
  14. Liu, G.; Jin, W. Pervaporation Membrane Materials: Recent Trends and Perspectives. J. Membr. Sci. 2021, 636, 119557. [Google Scholar] [CrossRef]
  15. Ulrich, S.; Pavel, S. Design and Operation of a Pervaporation Plant for Ethanol Dehydration. J. Membr. Sci. 1988, 36, 463–475. [Google Scholar]
  16. Wu, Y.; Ding, L.; Lu, Z.; Deng, J.; Wei, Y. Two-Dimensional MXene Membrane for Ethanol Dehydration. J. Membr. Sci. 2019, 590, 117300. [Google Scholar] [CrossRef]
  17. Xu, C.; Zhou, C.; Wang, S.; Huang, A. Copper-Exchanged LTA Zeolite Membranes with Enhanced Water Flux for Ethanol Dehydration. Chin. Chem. Lett. 2019, 30, 1204–1206. [Google Scholar] [CrossRef]
  18. Jianga, H.; Shic, W.; Liua, Q.; Wang, H.; Lic, J.; Wua, C.; Li, Y.; Weia, Z. Intensification of Water/Ethanol Separation by PVA Hybrid Membrane with Different Functional Ligand UiO-66-X Nanochannels in Pervaporation Process. Sep. Purif. Technol. 2020, 256, 117802. [Google Scholar] [CrossRef]
  19. Ma, Y.; Wang, J.; Tsuru, T. Pervaporation of Water/Ethanol Mixtures through Microporous Silica Membranes. Sep. Purif. Technol. 2009, 66, 479–485. [Google Scholar] [CrossRef]
  20. Hietaharju, J.; Kangas, J.; Tanskanen, J. Analysis of the Permeation Behavior of Ethanol/Water Mixtures through a Polydimethylsiloxane (PDMS) Membrane in Pervaporation and Vapor Permeation Conditions. Sep. Purif. Technol. 2019, 227, 115738. [Google Scholar] [CrossRef]
  21. Kiss, A.A.; Suszwalak, D.J.-P.C. Enhanced Bioethanol Dehydration by Extractive and Azeotropic Distillation in Dividing-Wall Columns. Sep. Purif. Technol. 2012, 86, 70–78. [Google Scholar] [CrossRef]
  22. Ma, S.; Hou, Y.; Sun, Y.; Li, J.; Li, Y.; Sun, L. Simulation and Experiment for Ethanol Dehydration Using Low Transition Temperature Mixtures (LTTMs) as Entrainers. Chem. Eng. Process. Process. Intensif. 2017, 121, 71–80. [Google Scholar] [CrossRef]
  23. Vazquez-Ojeda, M.; Segovia-Hernandez, J.G.; Hernandez, S.; Hernandez-Aguirre, A.; Kiss, A.A. Design and Optimization of an Ethanol Dehydration Process Using Stochastic Methods. Sep. Purif. Technol. 2013, 105, 90–97. [Google Scholar] [CrossRef]
  24. Ravagnania, M.A.S.S.; Reisa, M.H.M.; Filho, R.M.; Wolf-Maciel, M.R. Anhydrous Ethanol Production by Extractive Distillation: A Solvent Case Study. Process. Saf. Environ. Prot. 2010, 88, 67–73. [Google Scholar] [CrossRef]
  25. Gil, I.D.; Gomez, J.M.; Rodriguez, G. Control of an Extractive Distillation Process to Dehydrate Ethanol Using Glycerol as Entrainer. Comput. Chem. Eng. 2012, 39, 129–142. [Google Scholar] [CrossRef]
  26. Lee, F.M.; Pahl, R.H. Solvent Screening Study and Conceptual Extractive Distillation Process to Produce Anhydrous Ethanol from Fermentation Broth. Ind. Eng. Chem. Process. Des. Dev. 1985, 24, 168–172. [Google Scholar] [CrossRef]
  27. Gu, Y.; Jerome, F. Glycerol as a Sustainable Solvent for Green Chemistry. Green Chem. 2010, 12, 1127–1138. [Google Scholar] [CrossRef]
  28. Yeh, A.I.; Berg, L. The Dehydration of Ethanol by Extractive Distillation. Chem. Eng. Commun. 1992, 113, 147–153. [Google Scholar] [CrossRef]
  29. Soares, R.B.; Pessoa, F.; Marisa, M. Dehydration of Ethanol with Different Salts in a Packed Distillation Column. Process. Saf. Environ. Prot. 2014, 93, 147–153. [Google Scholar] [CrossRef]
  30. Lei, Z.; Dai, C.; Zhu, J.; Chen, B. Extractive Distillation with Ionic Liquids: A Review. AIChE J. 2014, 60, 3312–3329. [Google Scholar] [CrossRef]
  31. Zhua, Z.; Riab, Y.; Lia, M.; Jiaa, H.; Wanga, Y.; Wanga, Y. Extractive Distillation for Ethanol Dehydration Using Imidazolium-Based Ionic Liquids as Solvents. Chem. Eng. Process.-Process. Intensif. 2016, 109, 190–198. [Google Scholar] [CrossRef]
  32. Meindersma, G.W.; Quijada-Maldonado, E.; Aelmans, T.A.M.; Gutierrez, J.P.; Haan, A.B. Ionic Liquids in Extractive Distillation of Ethanol/Water: From Laboratory to Pilot Plant. ACS Symp. Ser. 2012, 1117, 239–257. [Google Scholar]
  33. Graczova, E.; Steltenpohl, P. Application of Ionic Liquids in Extractive Distillation of Ethanol-Water System. Chem. Eng. Trans. 2015, 45, 1957–1962. [Google Scholar]
  34. Quijada-Maldonadoa, E.; Meindersm, G.W.; Haanc, A.B. Ionic Liquid Effects on Mass Transfer Efficiency in Extractive Distillation of Water-Ethanol Mixtures. Comput. Chem. Eng. 2014, 71, 210–219. [Google Scholar] [CrossRef]
  35. Yao, C.; Hou, Y.; Ren, S.; Wu, W.; Liu, H. Selective Extraction of Aromatics from Aliphatics Using Dicationic Ionic Liquid-Solvent Composite Extractants. J. Mol. Liq. 2019, 291, 111267. [Google Scholar] [CrossRef]
  36. Gjineci, N.; Boli, E.; Tzani, A.; Detsi, A.; Voutsas, E. Separation of the Ethanol/Water Azeotropic Mixture Using Ionic Liquids and Deep Eutectic Solvents. Fluid Phase Equilibria 2016, 424, 1–7. [Google Scholar] [CrossRef]
  37. Davletbaeva, I.M.; Klinov, A.V.; Khairullina, A.R.; Malygin, A.V.; Dulmaev, S.E.; Davletbaeva, A.R.; Mukhametzyanov, T.A. Organoboron Ionic Liquids as Extractants for Distillation Process of Binary Ethanol + Water Mixtures. Processes 2020, 8, 628. [Google Scholar] [CrossRef]
  38. Klinov, A.V.; Malygin, A.V.; Khairullina, A.R.; Dulmaev, S.E.; Davletbaeva, I.M. Alcohols Dehydration by Extractive Distillation with Use of Aminoethers of Boric Acid. Processes 2020, 8, 1466. [Google Scholar] [CrossRef]
  39. Davletbaeva, I.M.; Sazonov, O.O.; Zakirov, I.N.; Gumerov, A.M.; Klinov, A.V.; Fazlyev, A.R.; Malygin, A.V. Organophosphorus Polyurethane Ionomers as Water Vapor Permeable and Pervaporation Membranes. Polymers 2021, 13, 1442. [Google Scholar] [CrossRef]
  40. Davletbaeva, I.M.; Sazonov, O.O.; Fazlyev, A.R.; Davletbaev, R.S.; Efimov, S.V.; Klochkov, V.V. Polyurethane Ionomers Based on Amino Ethers of Orto-Phosphoric Acid. RSC Adv. 2019, 9, 18599–18608. [Google Scholar] [CrossRef] [Green Version]
  41. Davletbaeva, I.M.; Sazonov, O.O.; Fazlyev, A.R.; Zakirov, I.N.; Davletbaev, R.S.; Efimov, S.V.; Klochkov, V.V. Thermal Behavior of Polyurethane Ionomers Based on Amino Ethers of Ortho-Phosphoric Acid. Polym. Sci. Ser. A 2020, 62, 337–349. [Google Scholar] [CrossRef]
  42. Davletbaeva, I.M.; Sazonov, O.O.; Nikitina, E.A.; Kapralova, V.M.; Nizamov, A.A.; Akhmetov, I.G.; Arkhipov, A.V.; Sudar, N.T. Dielectric Properties of Organophosphorus Polyurethane Ionomers. J. Appl. Polym. Sci. 2021, e51751. [Google Scholar] [CrossRef]
  43. Hala, E.; Pick, J.; Fried, V. Vapor-Liquid Equilibrium; Pergamon Press: Prague, Czech Republic, 1967; p. 599. [Google Scholar]
  44. Gmehling, J.; Kleiber, M.; Kolbe, B.; Rarey, J. Chemical Thermodynamics for Process Simulation; Wiley-VCH: Weinheim, Germany, 2019; p. 808. [Google Scholar]
  45. Reid, R.C.; Prausnitz, J.M.; Poling, B.E. The Properties of Gases and Liquids, 4th ed.; McGraw-Hill: New York, NY, USA, 1987; p. 753. [Google Scholar]
  46. Li, Z.; Chen, J.; Bao, T.; Shang, Y.; Li, Y. Prediction of Phase Equilibria in Tributyl Phosphate Extraction System Using the Unifac Group Contribution Method. Thermochim. Acta 1990, 169, 287–300. [Google Scholar] [CrossRef]
  47. Abrams, D.S.; Prausnitz, J.M. Statistical Thermodynamics of Liquid Mixtures: A New Expression for the Excess Gibbs Energy of Partly or Completely Miscible Systems. AIChE J. 1975, 21, 116–128. [Google Scholar] [CrossRef]
  48. Wittig, R.; Lohmann, J.; Gmehling, J. Vapor-Liquid Equilibria by UNIFAC Group Contribution. 6. Revision and Extension. Ind. Eng. Chem. Res. 2003, 42, 183–188. [Google Scholar] [CrossRef]
  49. Online UNIFAC Source. Available online: http://unifac.ddbst.de/unifac-matrix.html (accessed on 24 September 2021).
  50. Gmehling, J.; Mo1llmann, C. Synthesis of Distillation Processes Using Thermodynamic Models and the Dortmund Data Bank. Ind. Eng. Chem. Res. 1998, 37, 3112–3123. [Google Scholar] [CrossRef]
  51. Wlazlo, M.; Karpinska, M.; Domanska, U. Thermodynamics and Selectivity of Separation Based on Activity Coefficients at Infinite Dilution of Various Solutes in 1-Allyl-3-Methylimidazolium Bis{(Trifluoromethyl)Sulfonyl}imide Ionic Liquid. J. Chem. Thermodyn. 2016, 102, 39–47. [Google Scholar] [CrossRef]
  52. Dortmund Data Bank. Thermophysical Data for Process Design. Available online: http://ddbonline.ddbst.com/DDBSearch/onlineddboverview.exe (accessed on 24 September 2021).
  53. Li, J.-D.; Li, Y.-G.; Chen, J.; Lu, J.-F.; Teng, T. Activity Coefficient Data and Their Correlation for Tributyl Phosphate-Hydrocarbon and Uranyl Nitrate Tributyl Phosphate Complex-Hydrocarbon Solutions. Fluid Phase Equilibria 1990, 58, 307–318. [Google Scholar] [CrossRef]
  54. Reid, R.C.; Sherwood, T.K.; Street, R.E. The Properties of Gases and Liquids, 3rd ed.; McGraw-Hill: New York, NY, USA, 1977; p. 688. [Google Scholar]
  55. Zhang, L.; Yang, B.; Zhang, W. Vapor-Liquid Equilibrium of Water + Ethanol + Glycerol: Experimental Measurement and Modeling for Ethanol Dehydration by Extractive Distillation. J. Chem. Eng. Data 2015, 60, 1892–1899. [Google Scholar] [CrossRef]
  56. Lei, Z.; Zhang, J.; Li, Q.; Chen, B. UNIFAC Model for Ionic Liquids. Ind. Eng. Chem. Res. 2009, 48, 2697–2704. [Google Scholar] [CrossRef]
  57. Dong, Y.; Guo, Y.; Zhu, R.; Zhang, J.; Lei, Z. UNIFAC Model for Ionic Liquids. Revision and Extension. Ind. Eng. Chem. Res. 2020, 59, 10172–10184. [Google Scholar] [CrossRef]
  58. Column Equipment. Online Source. Available online: https://ingehim.ru/files/kolonnoe-oborudovanie.pdf (accessed on 24 September 2021).
Scheme 1. Synthesis of amino ethers of ortho-phosphoric acid based on glycerol (AEPA-Gl).
Chemengineering 05 00071 sch001
Figure 1. Residual curves (geometric figures are experimental data) for the ethanol–water–AEPA-(PEG/DEG/TEG/Gl) mixture, [AEPA-(PEG/DEG/TEG/Gl)] = 60 wt.%. Solid line is calculated data for the binary ethanol–water mixture. Dashed line is the calculated data for the ethanol–water–AEPA-Gl mixture. P/L0 is the distillate rate.
Chemengineering 05 00071 g001
Figure 2. Comparison of the experimental (geometric figures) and calculated data (lines) of the activity coefficients for the TBP–hexane mixture [50].
Chemengineering 05 00071 g002
Figure 3. Boiling points of ethanol solutions of AEPA-Gl. Geometric figures are experimental data, continuous line is calculated data.
Chemengineering 05 00071 g003
Figure 4. Boiling points of AEPA-Gl and AEPA-DEG aqueous solutions. Geometric figures are experimental data ((a) circles: AEPA-Gl, (b) squares: AEPA-DEG) and lines are calculated data.
Chemengineering 05 00071 g004
Figure 5. Residual curves for the ethanol–water–AEPA-Gl mixture at [AEPA-Gl] = 20 wt.% (geometric figures are experimental data, continuous line is calculated data). Dotted lines are calculated values for the ethanol–water mixture.
Chemengineering 05 00071 g005
Figure 6. Curves of residual concentrations for the ethanol–water–AEPA-DEG mixture at [AEPA-DEG] = 20 wt.% (geometric figures are experimental data, continuous line is calculated data). Dashed lines are calculated data for the ethanol–water mixture.
Chemengineering 05 00071 g006
Figure 7. The coefficients of the relative volatility depending on the concentration of the extractant at the azeotropic point of the ethanol–water mixture (ethanol: 95.6 wt.%).
Chemengineering 05 00071 g007
Figure 8. Scheme of the experimental distillation column: 1—electric heater; 2—cube-evaporator; 3—diopter with attachment; 4—unit with a packing; 5—unit with plates; 6—distillate sampling unit; 7—gear pump; 8—condenser; 9—a tank with an extractant; 10—cube temperature sensor; 11—distillate vapor temperature sensor; 12 and 13—cooling water temperature sensors; 14—cooling water flow sensor.
Chemengineering 05 00071 g008
Table 1. Group composition of AEPA-(DEG/TEG/Gl) molecules.
GroupCHCH2OCH2POOHNHCH2Molar Mass,
g/mol.
Structure
AEPA–Gl651261511074.54
AEPA–DEG011186911158.70
AEPA–TEG017246911423.01
Table 2. Parameters of interaction for model UNIFAC of the PO group (j).
Groups
(i)
Parameters of Interaction from Equation (6)
aijaji
CH2557.93797.94
OCH2396.85−185.04
OH−1897.4−591.94
CNH−1137.3407.45
H2O471.35−876.48
Table 3. Dynamic viscosity of AEPA-Gl aqueous solutions, mPa·s.
Water Concentration, wt.%
T, °C1.027520406080
207245.01548.051.70825.6824.06481.8555
302890.9704.9532.32916.9393.04681.4570
401291.4354.9621.25311.7742.36581.1801
50638.22193.9914.7878.55411.88880.9775
60343.56114.6410.7356.45001.54570.8269
70198.8372.1238.08495.00881.2870
80122.3747.7926.26443.9877
9079.38933.1444.9808
10053.89623.8274.0429
Table 4. Density of AEPA-Gl aqueous solutions, g/cm3.
Water Concentration, wt.%
T, °C1.027520406080
201.43801.40911.31801.28231.15421.0722
301.43221.40311.31221.27641.14901.0680
401.42651.39691.30651.27041.14401.0637
501.42051.39091.30041.26431.13841.0588
601.41421.3851.29411.25791.13251.0534
701.40831.37911.28761.25141.1253
801.40221.3731.28101.2446
901.39631.36661.2740
1001.39051.36031.2670
Table 5. Results on the experimental distillation column.
Heating power, kW1.5
Water content in AEPA-Gl, wt.%0.61
Reflux consumption, g/s0.94
Extractant consumption, g/s0.55
Water content in the cube before the extractant supply, wt.%89.01
Water content in the distillate before the extractant feed, wt.%6.75
Table 6. Mass fraction of water in the distillate, determined at different times from the beginning of the AEPA-GL extractant supply.
Time from the Beginning of the Extractant Supply, minDistillate Water Content, wt.%
Experimental DataSimulation Results
6 Plates5 Plates
151.58240.7909171.89509
201.35930.7766041.93154
251.30780.7870011.97293
301.29630.8009112.01389
351.27840.8158322.05232
401.25740.8290212.08367
451.27620.8378742.11209
501.26360.8480292.13466
551.27340.8558682.15442
Publisher’s Note: MDPI stays neutral with regard to jurisdictional claims in published maps and institutional affiliations.

