Article

Imprinted-Zeolite-X-Based Sensor for Non-Enzymatic Detection of Blood Glucose by Potentiometry

by
Miratul Khasanah
1,*,
Alfa Akustia Widati
1,2,
Usreg Sri Handajani
1,
Akhsin Mastura
1 and
Eka Yunicha Sari
1
1
Chemistry Department, Faculty of Science and Technology, Universitas Airlangga, Surabaya 60115, Indonesia
2
Supramodification and Nano-Micro Engineering Research Group, Universitas Airlangga, Surabaya 60115, Indonesia
*
Author to whom correspondence should be addressed.
ChemEngineering 2022, 6(5), 71; https://doi.org/10.3390/chemengineering6050071
Submission received: 6 July 2022 / Revised: 27 August 2022 / Accepted: 30 August 2022 / Published: 15 September 2022

Abstract

:
The development of sensors based on imprinted zeolite X to detect blood glucose through potentiometry was performed. In this study, the sensor was made of a mixture of carbon paste and imprinted zeolite X. Zeolite X was synthesized using a sol–gel-hydrothermal method at a temperature of 100 °C with basic materials of NaAlO2, NaOH, TEOS, and distilled water. The characterization results of XRD showed the presence of specific peaks, which were confirmed with standard zeolite X. Imprinted zeolite X exhibited a 20 times greater adsorption capacity size, and an adsorption efficiency 3 times greater than that of zeolite X. This is thought to be due to the presence of a molecular template within it. The IZ–carbon paste electrode showed optimum performance due to a mass ratio of carbon, paraffin, and imprinted zeolite X of 12:7:1. The electrode performance was expressed by the Nernst factor value of 30 mV/decade, the measuring range of 10−4–10−2 M, the upper detection limit of 1.38 × 10⁻² M, and the lower detection limit of 1.28 × 10⁻⁴ M, so this electrode can be used for glucose analysis with a normal concentration (70–110 mg/dL or equivalent to 3.8 × 10⁻³–6.1 × 10⁻³ M), as well as the glucose concentration of people with diabetes mellitus (>200 mg/dL or about 10−2 M). This electrode showed precision values of 97.14–99.02%, accuracy values of 98.65–99.39%, and electrode response times of 10–13 s. The electrodes showed high stability for more than 5 weeks with 141 uses. The electrodes also showed high selectivity for glucose in the matrix of uric acid, urea, NaCl, and KCl. Therefore, its use as an alternative electrode for routine glucose analysis in the medical field is recommended.

1. Introduction

High levels of glucose in the body are generally associated with diabetes mellitus. Diabetes mellitus is a chronic disease that affects approximately 150 million people in the world and is the sixth leading cause of death in the non-communicable disease category. Indonesia occupies the fourth position in the world ranking, with the highest number of people with diabetes mellitus. The number of people with this disease continues to increase every year. Diabetes mellitus is often referred to as “the silent killer” because this disease can attack all organs of the body and slowly kill the body itself.
Glucose levels in the blood are indicators of diabetes mellitus. The current WHO diagnostic criteria for non-diabetic fasting plasma glucose levels is <7.0 mmol/L (<126 mg/dL). Frequent cases of abnormal glucose levels in the body have captured the attention of researchers in the fields of biomedical and biochemical analysis. The most commonly used method for determining glucose levels is spectrophotometry, applying chemical or enzymatic reagents [1,2]. This method has fairly good accuracy, but blood glucose analysis using this method is complicated by the presence of ketones and other monosaccharides, such as fructose and galactose.
In recent years, some methods for analyzing glucose levels have been developed, including electrochemical methods using enzymatic and non-enzymatic sensors [3,4,5,6,7,8,9,10,11], high-performance liquid chromatography (HPLC) [12], and liquid chromatography–mass spectroscopy (LC–MS) [13]. These methods are generally less selective, require a relatively large number of samples and complex sample treatment, and have a relatively high detection limit.
Several researchers have developed a method of analyzing glucose by electrometry through the modification of electrodes [14,15]. A potentiometric method using zeolite-modified electrodes has been developed for blood glucose analysis. Zeolite is an inorganic compound with a porous crystalline structure that has a three-dimensional framework where the structure makes the zeolite easy to modify [16]. It has a large surface area, high ion exchange capacity, and high thermal and chemical stability. It is not easy to swell because zeolites have a fixed upper hydration limit and undergo only limited structural expansion upon hydration [17]. Due to its unique properties, zeolite is very suitable for use as a molecular template on electrochemical sensors [18]. An imprinted zeolite (IZ) is a zeolite in which there is a template in the pores of the molecule to be analyzed. The suitability of the IZ pore size with the glucose molecule increases the capacity of zeolite adsorption, while the rigid nature of the zeolite means that it is not prone to swelling in water, so it can provide high sensitivity and selectivity in detecting glucose.
The potentiometric analysis using the IZ-modified electrode showed Nernstian over a wide measurement range and have a low detection limit; hence, it required a low blood volume. It also has a fast response, and it is stable over time. The glucose analysis utilizing sensors is unaffected by urea, uric acid, creatinine, KCl, and NaCl matrices of varied concentrations. When compared to the usual method of spectrophotometry for determining blood glucose levels, this method has a high level of accuracy. As a result, in the medical field, potentiometry with IZ-modified electrodes is recommended as an alternate sensor for the routine measurement of blood glucose levels.
Imprinted zeolite TS-1 [19] and imprinted zeolite LTA [20] have been used to modify the electrode as a potentiometric sensor in the glucose analysis in blood serum. This research used an FAU-type zeolite, namely, zeolite X, to modify the electrode. As an aluminosilicate material, the main difference between zeolite LTA, TS-1, and zeolite X is the pore geometry. Zeolite LTA, TS-1, and X have pore geometries of approximately 8-,10-, and 12-membered rings, respectively. Meanwhile, the preparation of the imprinted zeolite involves the interaction that occurrs between the O atom of Si-O-Al in zeolite and the OH of glucose. The larger the pore geometry, the higher the number of Si-O-Al; therefore, the zeolite with the largest ring tends to serve as a more active site to bind with glucose. The structure of zeolite LTA, X, and TS-1 is shown in Figure 1. For this reason, zeolite x was chosen as a modifier of the electrode because many interactions between glucose and zeolite occurred, which showed the good performance of the electrode. The development of zeolite x as a modifier electrode through the template/imprinted technique has also not been reported to date. As a modifier electrode, many researchers still use the approach of cation exchange.
Zeolite X has the ability to attract other molecules that touch the surface of the zeolite [21]. Zeolite X has a large Si/Al ratio, so it has thermal and chemical stability [22]. Zeolite X is a type of zeolite that has an α-cage (supercage) diameter of 13 Å, a β-cage (sodalite frame) diameter of 6.6 Å, and a pore diameter of 7.4 Å that form a three-dimensional structure with an Si/Al ratio of 1.0–1.5 [23]. Zeolite X has a unique crystalline structure, large adsorption capacity, and selective adsorption. Therefore, zeolite X has been widely used as an adsorbent. In this study, the development of an imprinted-zeolite-X-based sensor was carried out as a sensor for the detection of glucose in the blood. Zeolite X was synthesized with a ratio of molar composition of Na2O, Al2O3, TEOS, and H2O of 4.5:1:3:315, using the sol–gel-hydrothermal method at 100 °C [24]. The parameter that was studied was the composition of the electrode.
This study also reports the mechanism of adjusting the pore size of the imprinted zeolite according to the result of the nitrogen physisorption isotherm. This provides a more in-depth explanation of the performance of the IZ as a potentiometric sensor.

2. Materials and Methods

2.1. Materials

The chemicals used in this study were glucose (Sigma Aldrich, St. Louis, MO, USA, 99.5%) and uric acid (Fluka, Buchs, Switzerland, 99%), tetraethyl orthosilicate (Merck, Rahway, NJ, USA, 99%), sodium aluminate (Sigma Aldrich, 50%), sodium chloride (Merck, 99.99%), potassium chloride (Merck, 99.5%), isopropanol (Merck, 98%), and paraffin pellet (Merck, 99%). Potassium chloride, urea, sodium chloride, and glucose solutions were prepared using distilled water. The 10−2 M uric acid solution was prepared by dissolving the uric acid powder in 1:1 NaOH (w/w). Acetate buffer was prepared by mixing sodium acetate trihydrate (Merck, 99.5%) and the glacial acetic acid (Merck 100%). Phosphate buffers were prepared by mixing sodium hydrogen phosphate dihydrate (Merck, 99%) and sodium dihydrogen phosphate dihydrate (Merck, 98.5%) in distilled water. The chemical activation of carbon powder was achieved by immersing it in n-hexane and 0.1 M H3PO4, respectively. Furthermore, the carbon powder was heated to 300 °C for 2 h [5] and produced activated carbon with a surface area of 587.5106 m2/g. The carbon paste and potentiometer were connected via a Ag wire.
The following instruments were used in this study: Cyberscan 510 potentiometers with Ag/AgCl as a reference electrode, the Gas Sorption Quantachrome ASIQwin, X-ray diffraction (Shimadzu, Kyoto, Japan), a Fourier transform infrared (FTIR) spectrophotometer (Shimadzu), a double-beam spectrophotometer (Shimadzu UV-1800 Pharmaspec), an analytical balance (Mettler AE 200, Columbus, OH, USA), a centrifuge (HETTICH EBA 20, Westphalia, Germany), a hotplate (Termolyne S46410-2, Rockland, MA, USA), a vacuum oven (NAPCO Model 5851, Amityville, NY, USA), a pH meter (Cyberscan Eutech pH 510, Frankfurt, Germany), a polypropylene bottle, a 1000 μL micropipette tip (NescoLab, Jakarta, Indonesia), a magnetic stirrer (Heidolph, Schwabach, Germany), an agate mortar (RRC, China), and laboratory glassware (Iwaki Glass Indonesia, Jakarta, Indonesia).

2.2. Experimental Procedure

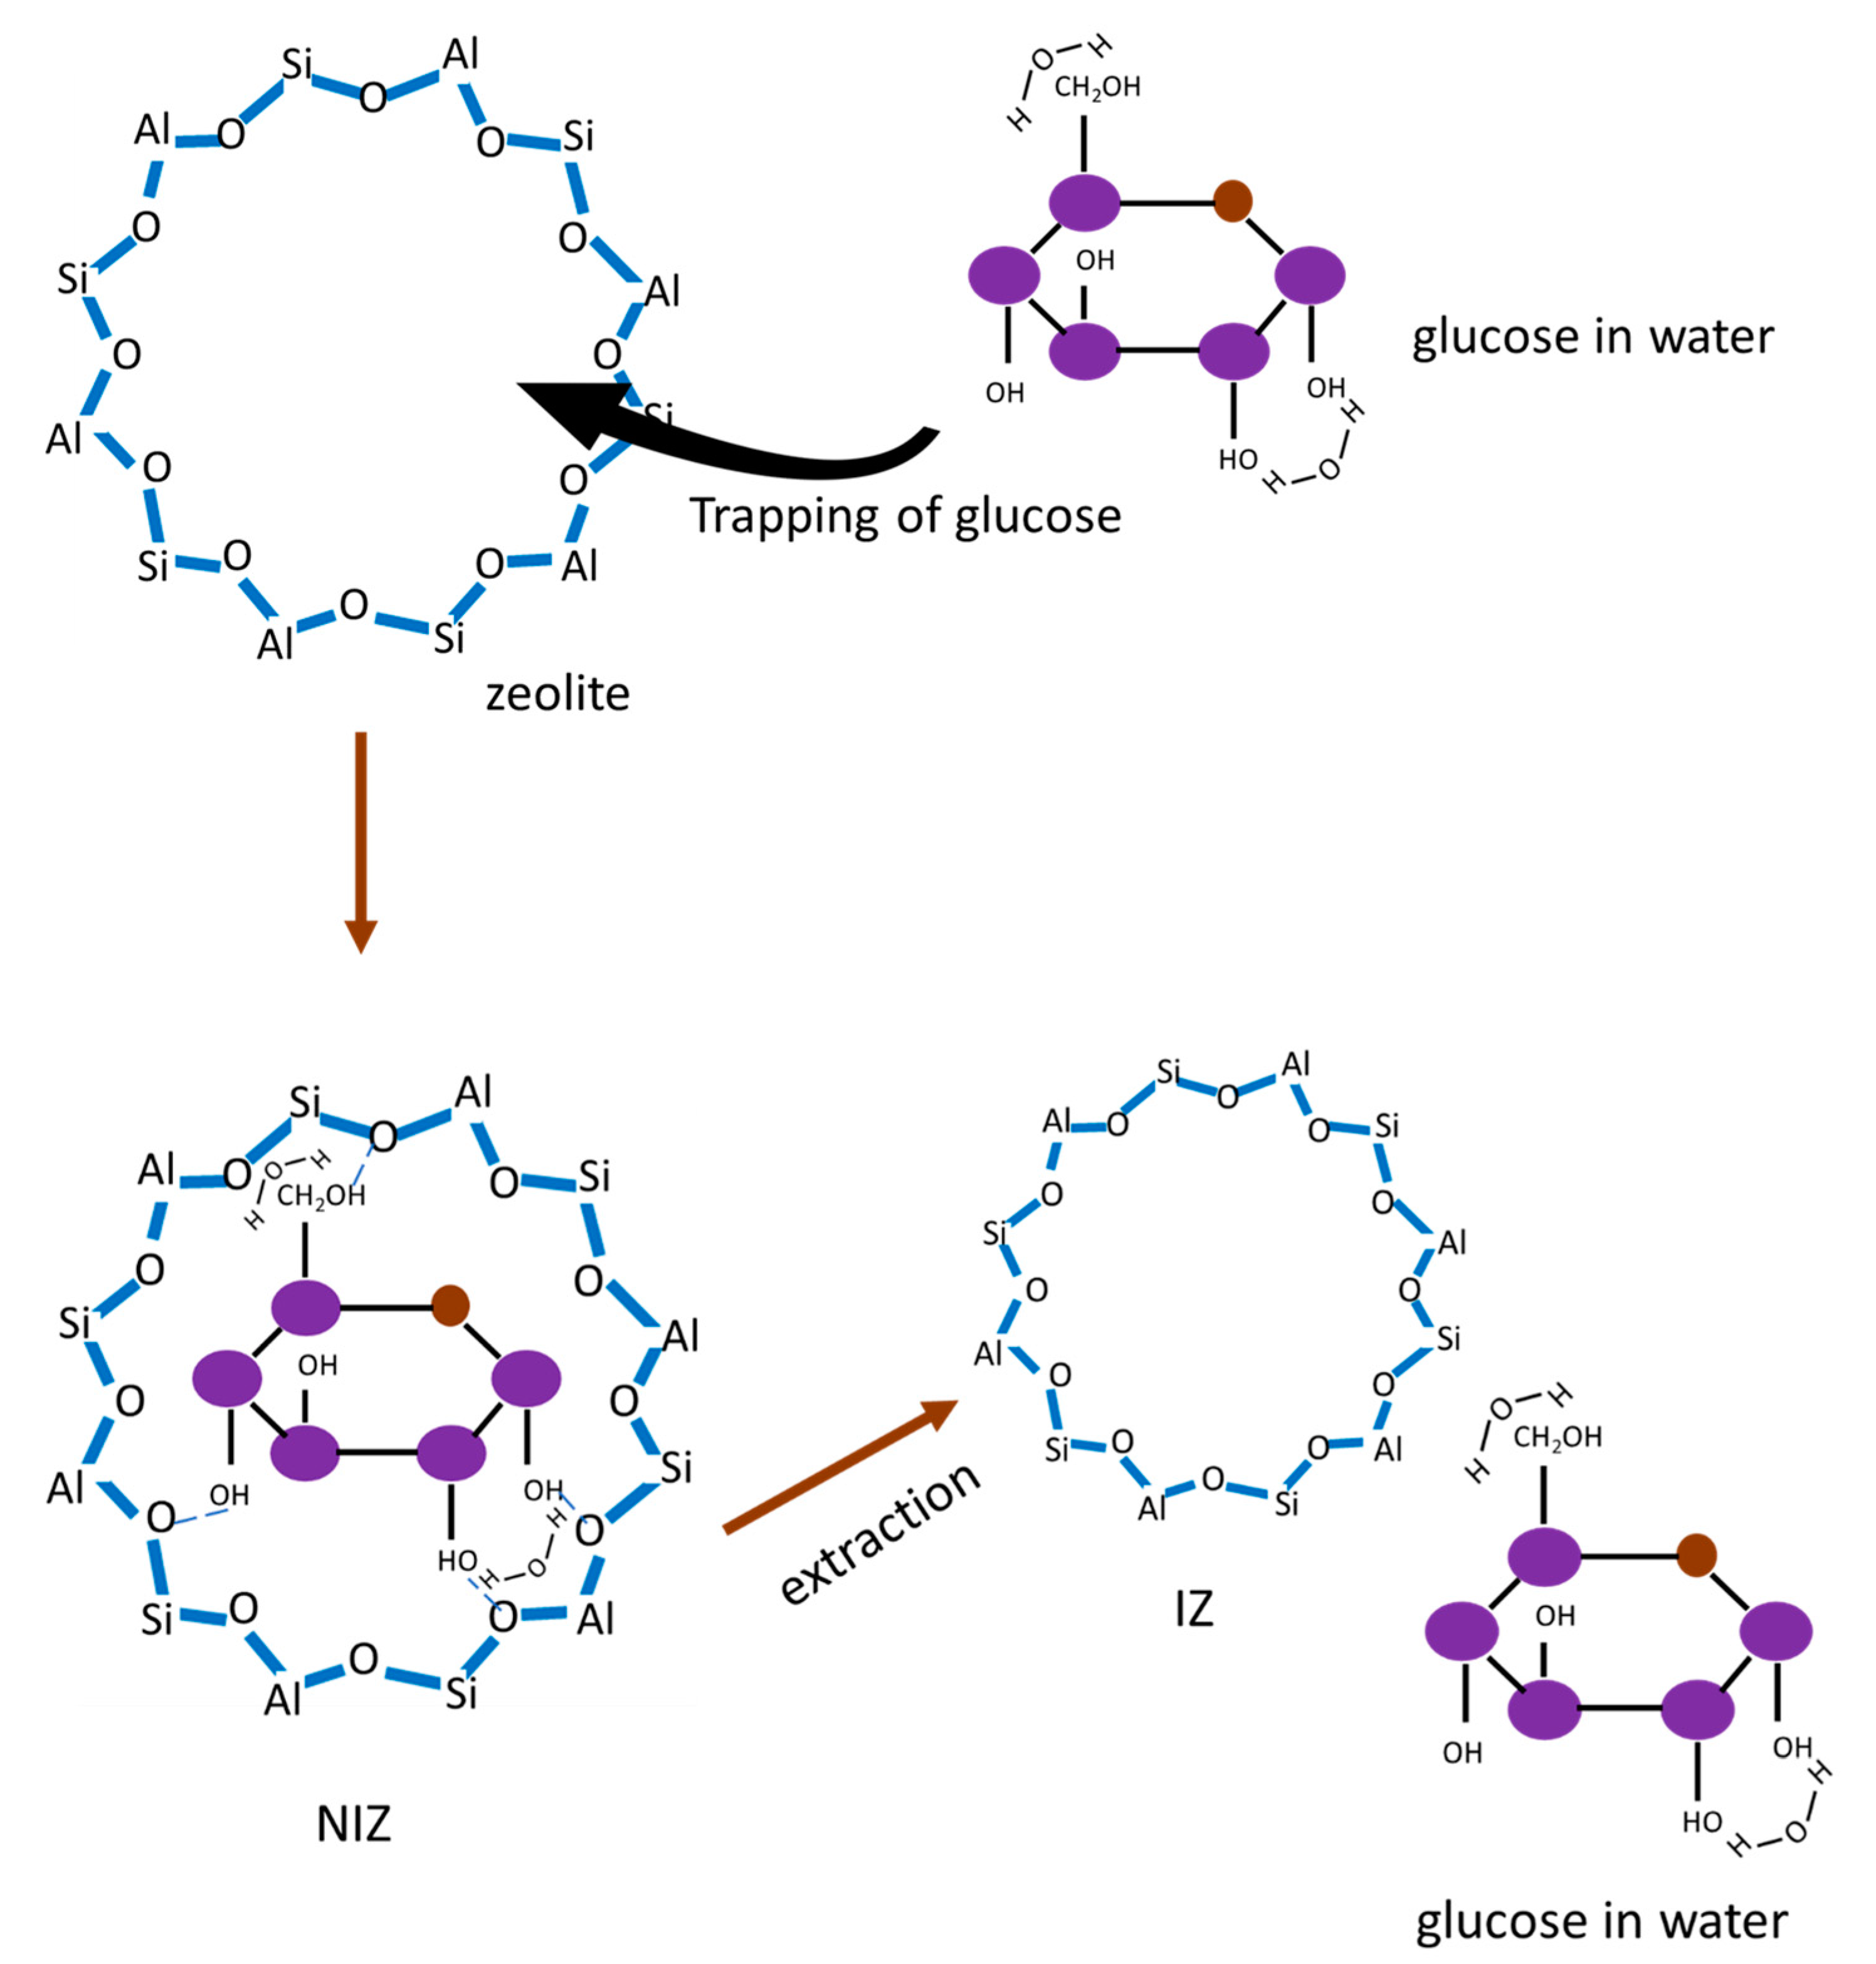
2.2.1. Synthesis of Imprinted Zeolite (IZ) X

The synthesis of zeolite X was accomplished by combining NaAlO2, NaOH, TEOS, and distilled water in a polypropylene bottle with a molar composition of Na2O: Al2O3: SiO2: H2O = 4.5:1:315 [24]. It was heated hydrothermally to 100 °C for 45 h. An amount of 2/3 of the mixture was added to a glucose solution (0.1034 g of glucose dissolved in 1 mL of distilled water) and stirred for 30 min; it was then left for 3 h so that the glucose molecules could be trapped into the pores of the zeolite and produce non-imprinted zeolites. The mixture had a glucose/Si mole ratio of 0.0306. Next, the mixture was divided into two parts. One part of the mixture was centrifuged for ±10 min to separate the filtrate and the solids. The solids were dried at 105 °C in the oven. Hot water (80 °C) was added into the other part of the mixture and centrifuged for ±10 min repeatedly to extract glucose from the zeolite pores. The obtained solids were dried at 80 °C for 5 h. These solids are called imprinted zeolites.

2.2.2. Fabrication of IZ–Carbon Paste Sensor

The preparation of the IZ–carbon paste was conducted by mixing activated carbon, IZ, and solid paraffin. The composition variation of activated carbon, IZ, and paraffin can be seen in Table 1. The micropipette tip was inserted with a Ag wire, then filled with solid paraffin as much as possible, and the rest was filled with IZ–carbon paste. The construction of the sensor is shown in Figure 2. Furthermore, the prepared electrode was conditioned by rubbing the surface using paper and being immersed in a 10−2 M glucose solution for 24 h.

2.2.3. Sensor Performance and Validity of Analysis Method

The sensor performance test and the validity of the analysis method were carried out to determine the feasibility of the analysis method used. The sensor performance and method validity studied in this research were the Nernst factor, measurement range, detection limit, precision, accuracy, response time, and lifetime. The Nernst factor value was obtained from the slope of the linear regression equation of the glucose standard curve, without the addition of buffer obtained from the relationship between the log [glucose] and electrode potential (mV). The measurement range was determined based on the concentration range of the 10−8–10−1 M glucose solution, which showed a straight line (linear) on the glucose standard curve and had a similar slope to the theoretical Nernst factor. The detection limit was calculated by intersecting the linear regression line with a non-linear line on the log [glucose] relationship curve with electrode potential. The accuracy score was calculated by measuring the potential of a 10−2–10−4 M glucose solution, analogizing the electrode potential value to the y value, and substituting it into the linear regression equation for the glucose solution standard curve. From the substitution, the concentration of the measured glucose was obtained. Accuracy was calculated through the relative error value in Equation (1):
E r = y i y t y t × 100 %
where Er is the relative error, y i is the potential of the measurement result, and y t is the actual potential of the analyte. The determination of precision was performed by calculating the coefficient of variation (CV) and standard deviation (SD) of the respective potential values of the 10−2–10−4 M glucose solution, each of which was measured three times with IZ–carbon paste electrodes. SD and CV calculations were carried out in sequence using Equations (2) and (3):
SD = i = 1 n x i x ¯ 2 n 1
CV = S D x ¯ × 100 %
where SD is the standard deviation, x i is the result of every ith measurement, x ¯ is the average value of the measurement results, n is the number of measurements, and CV is the coefficient of variation. The electrode response time was determined by measuring the potential of a standard 10−8–10−1 M glucose solution using IZ–carbon paste electrodes until a constant potential value was obtained. The response time is the time required for the electrode, starting from when the electrode is immersed in the solution, to obtain a constant potential value [25]. The electrode lifetime was determined from the time the electrode was used for measurement and showed good performance. The investigation was stopped until the electrode showed a significant decrease in performance, which was indicated by the deviation of the Nernst factor value or measurement range. The selectivity of the sensor is expressed by the value of the selectivity coefficient studied through the effect of the addition of uric acid, urea, NaCl, and KCl on glucose analysis. The selectivity coefficient was calculated using the matched potential method (MPM) [26].

3. Results and Discussion

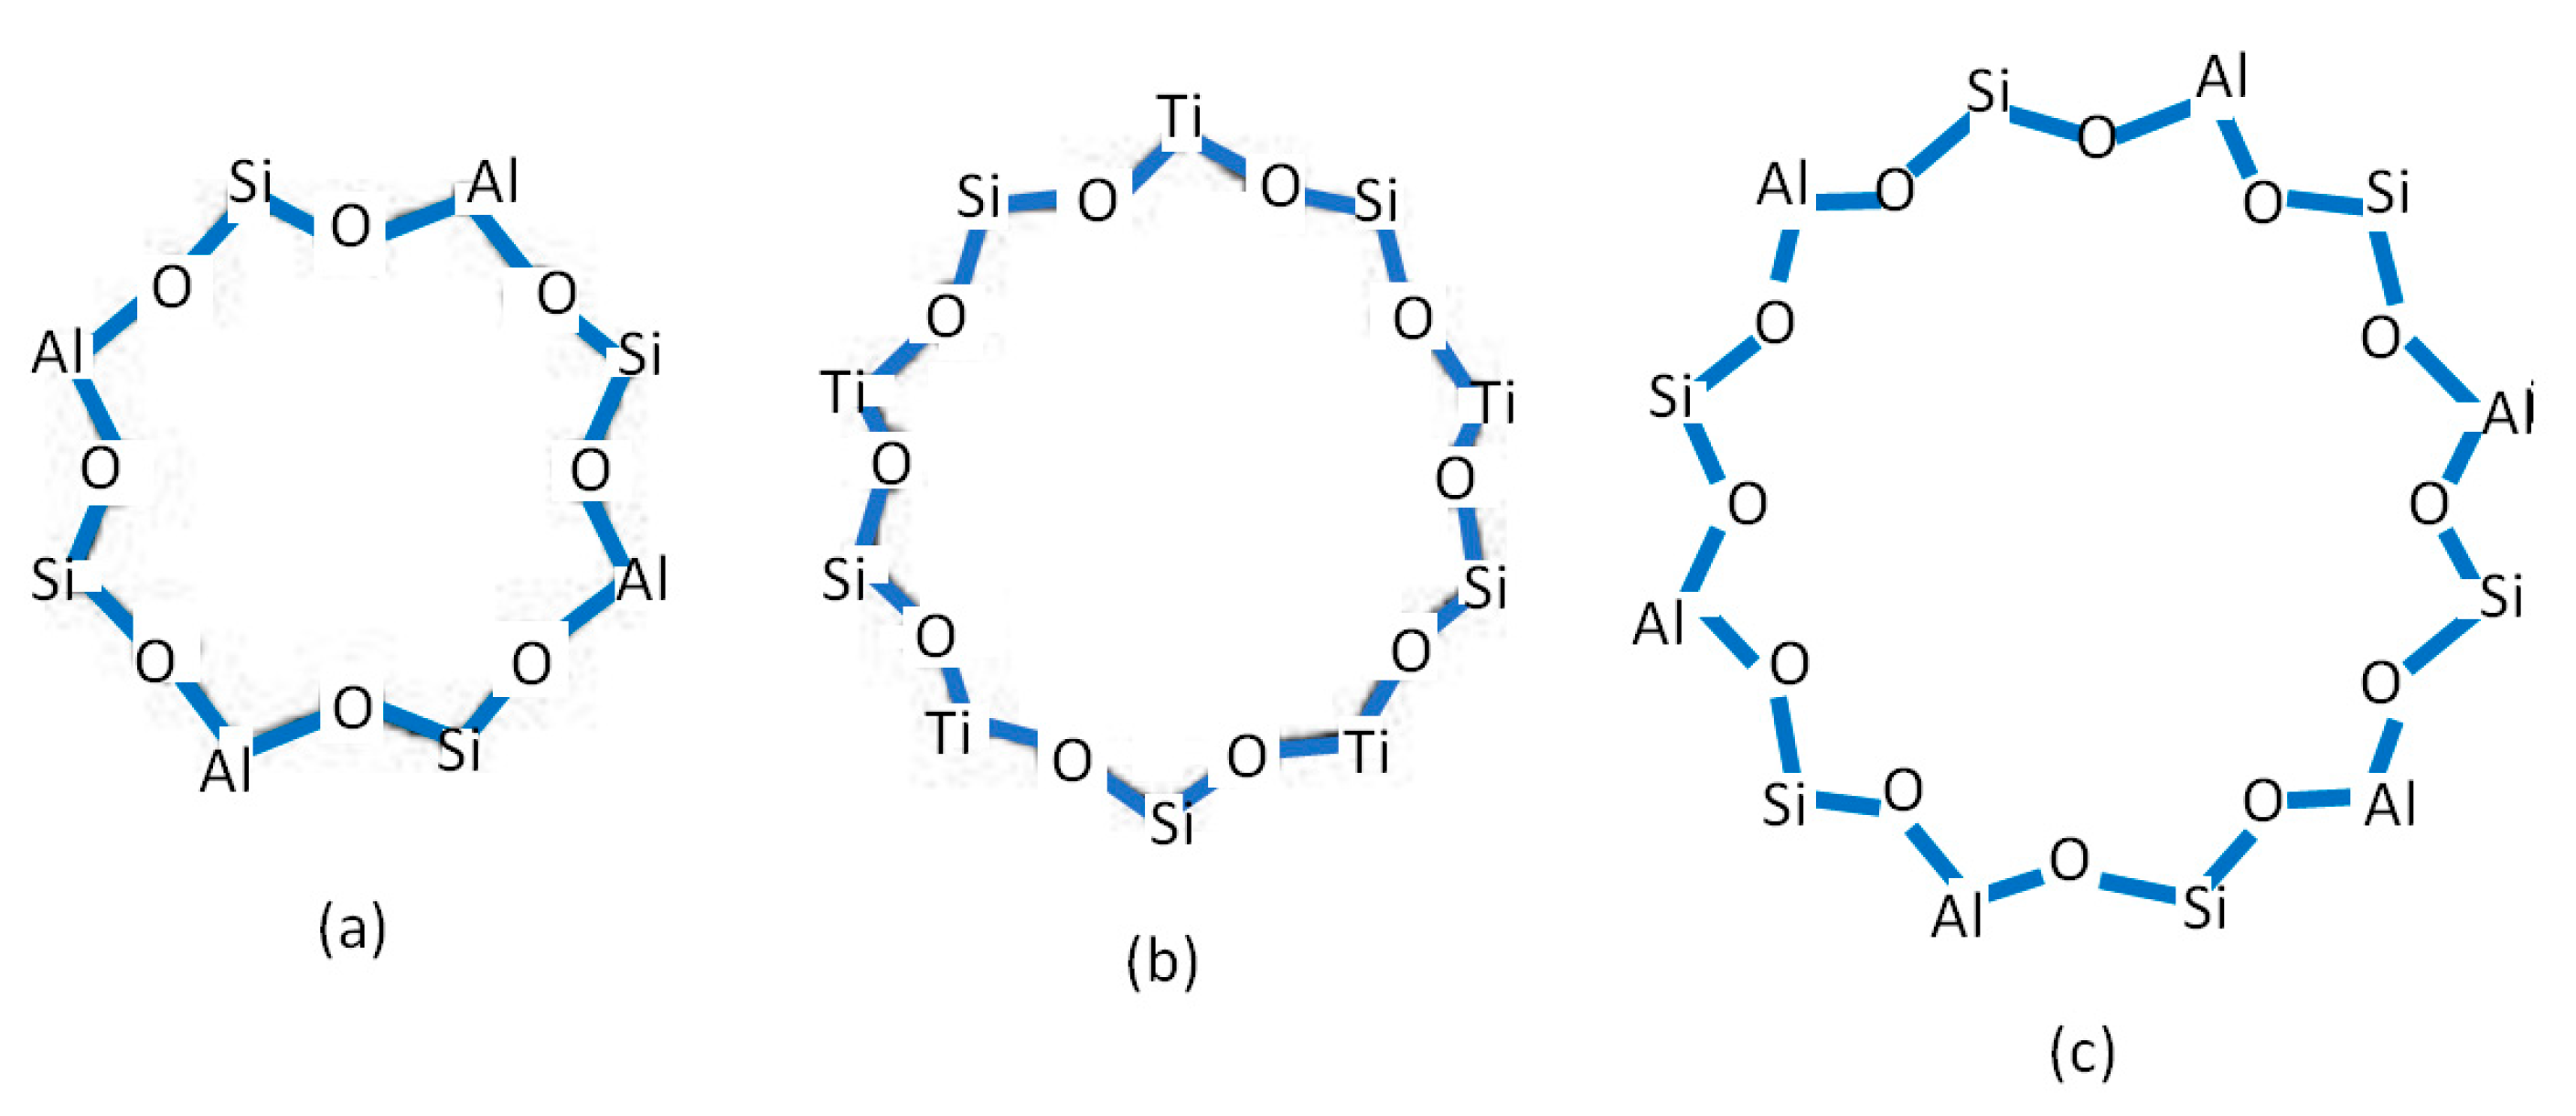
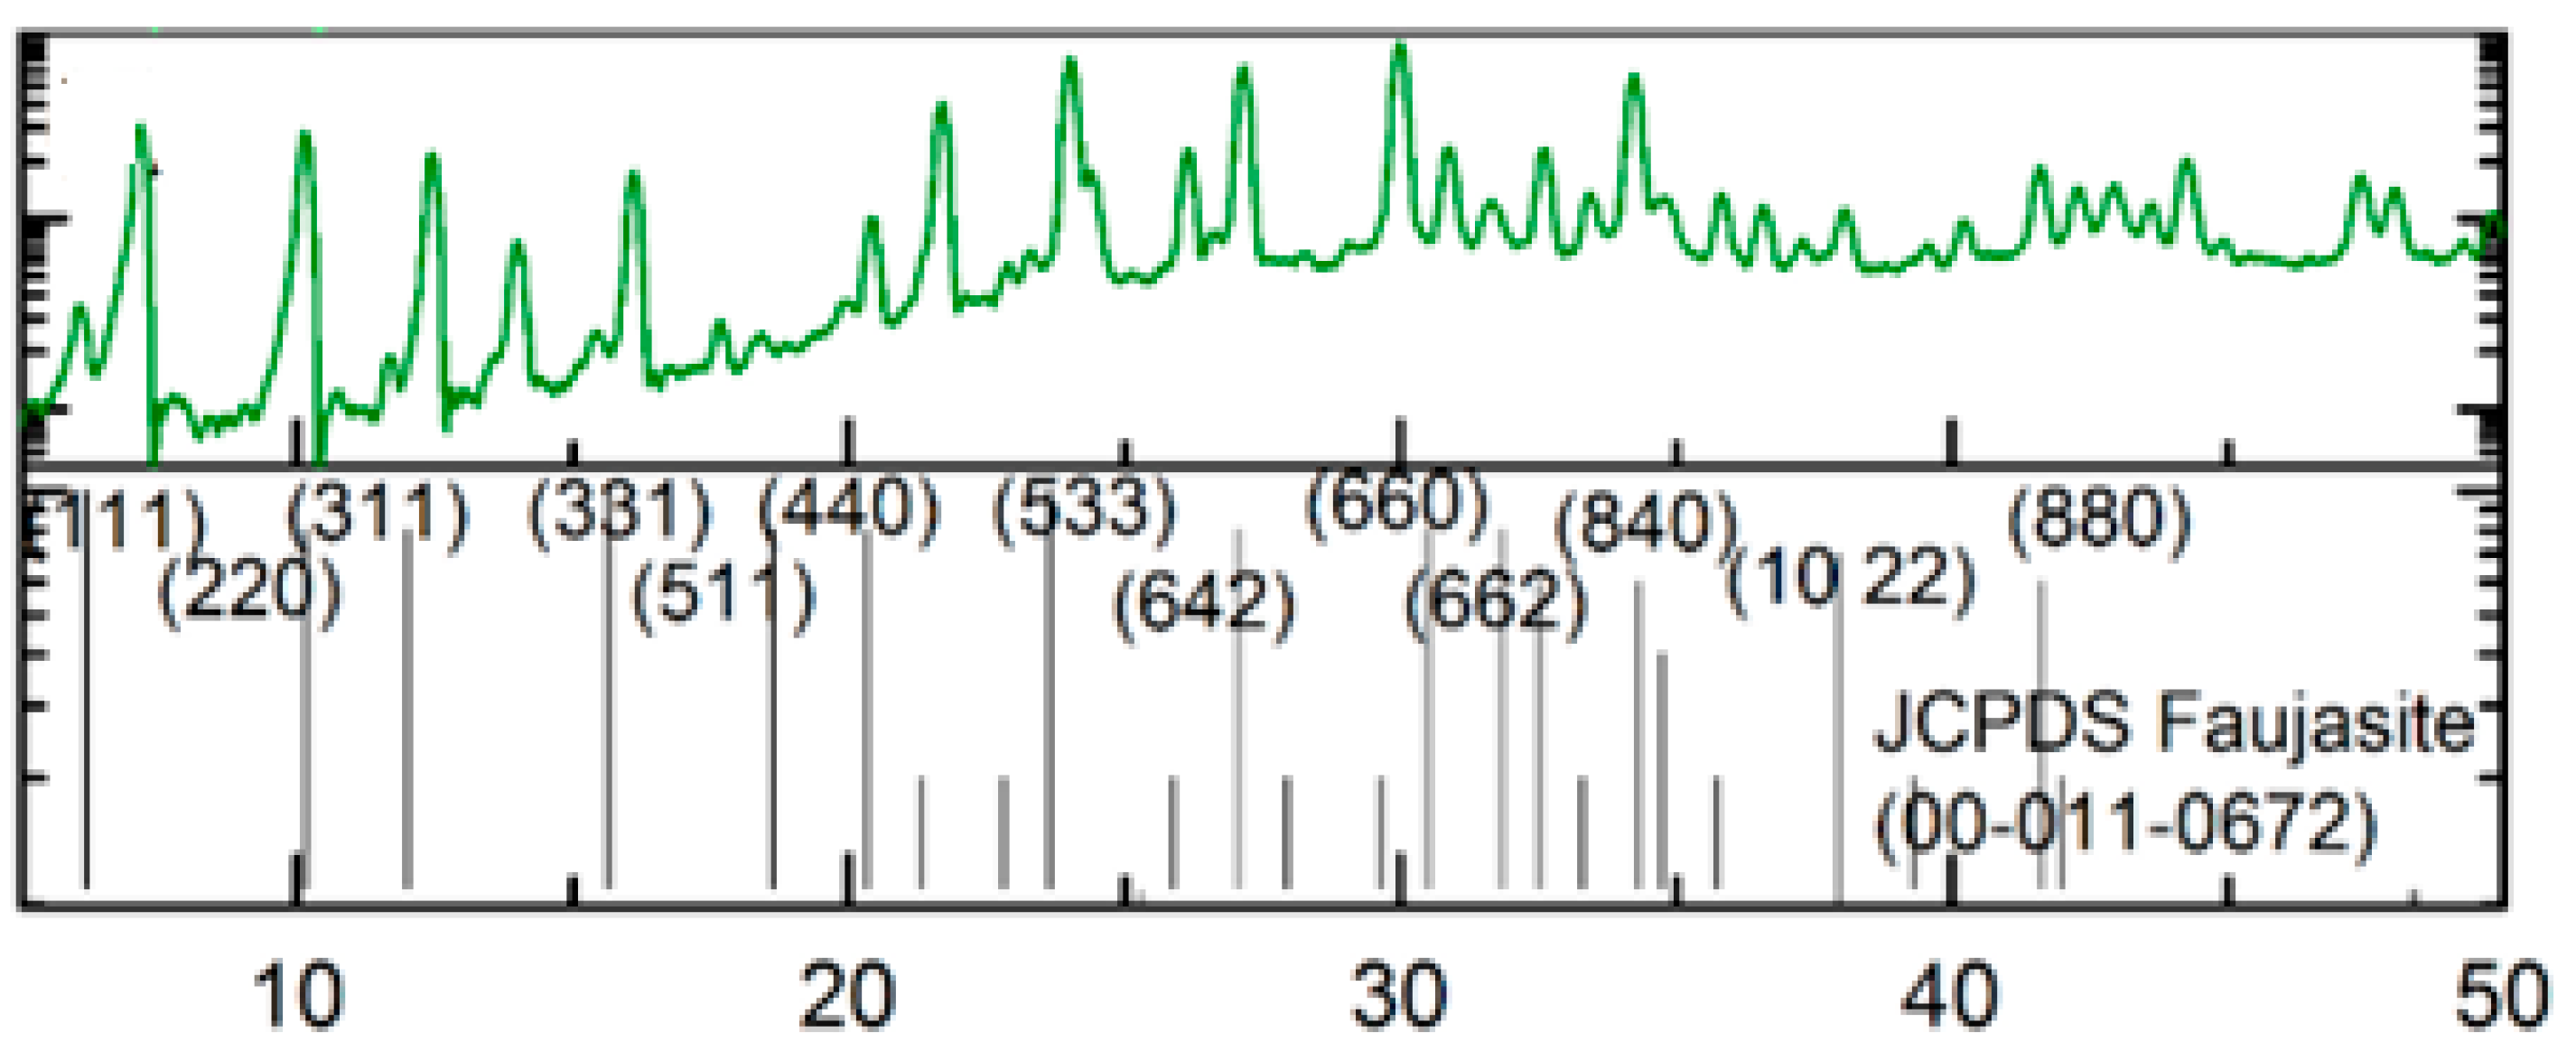
3.1. Identification the Structure of Synthesized Zeolite

The structure of the synthesized zeolite was characterized using XRD, as shown in Figure 3. Based on the diffractogram pattern and the data in Table 2, it can be seen that the peak of synthesized zeolite X is close to the standard peak. The purity of synthesized zeolite X was studied by comparing the diffractogram of the standard zeolite X, whereas zeolite X has an FAU-type framework (JCPDS No. 00-011-0672).
XRD analysis indicated that the sample has a similar diffractogram to the standard zeolite X; therefore, it could be stated the sample was zeolite X. However, it was found that there were peaks at the other position of zeolite X. These peaks were similar to those of zeolite P. The preparation of zeolite X involved the transformation phase of zeolite P to zeolite X; therefore, in certain conditions, a mixture of zeolite p and zeolite x was yielded [27].

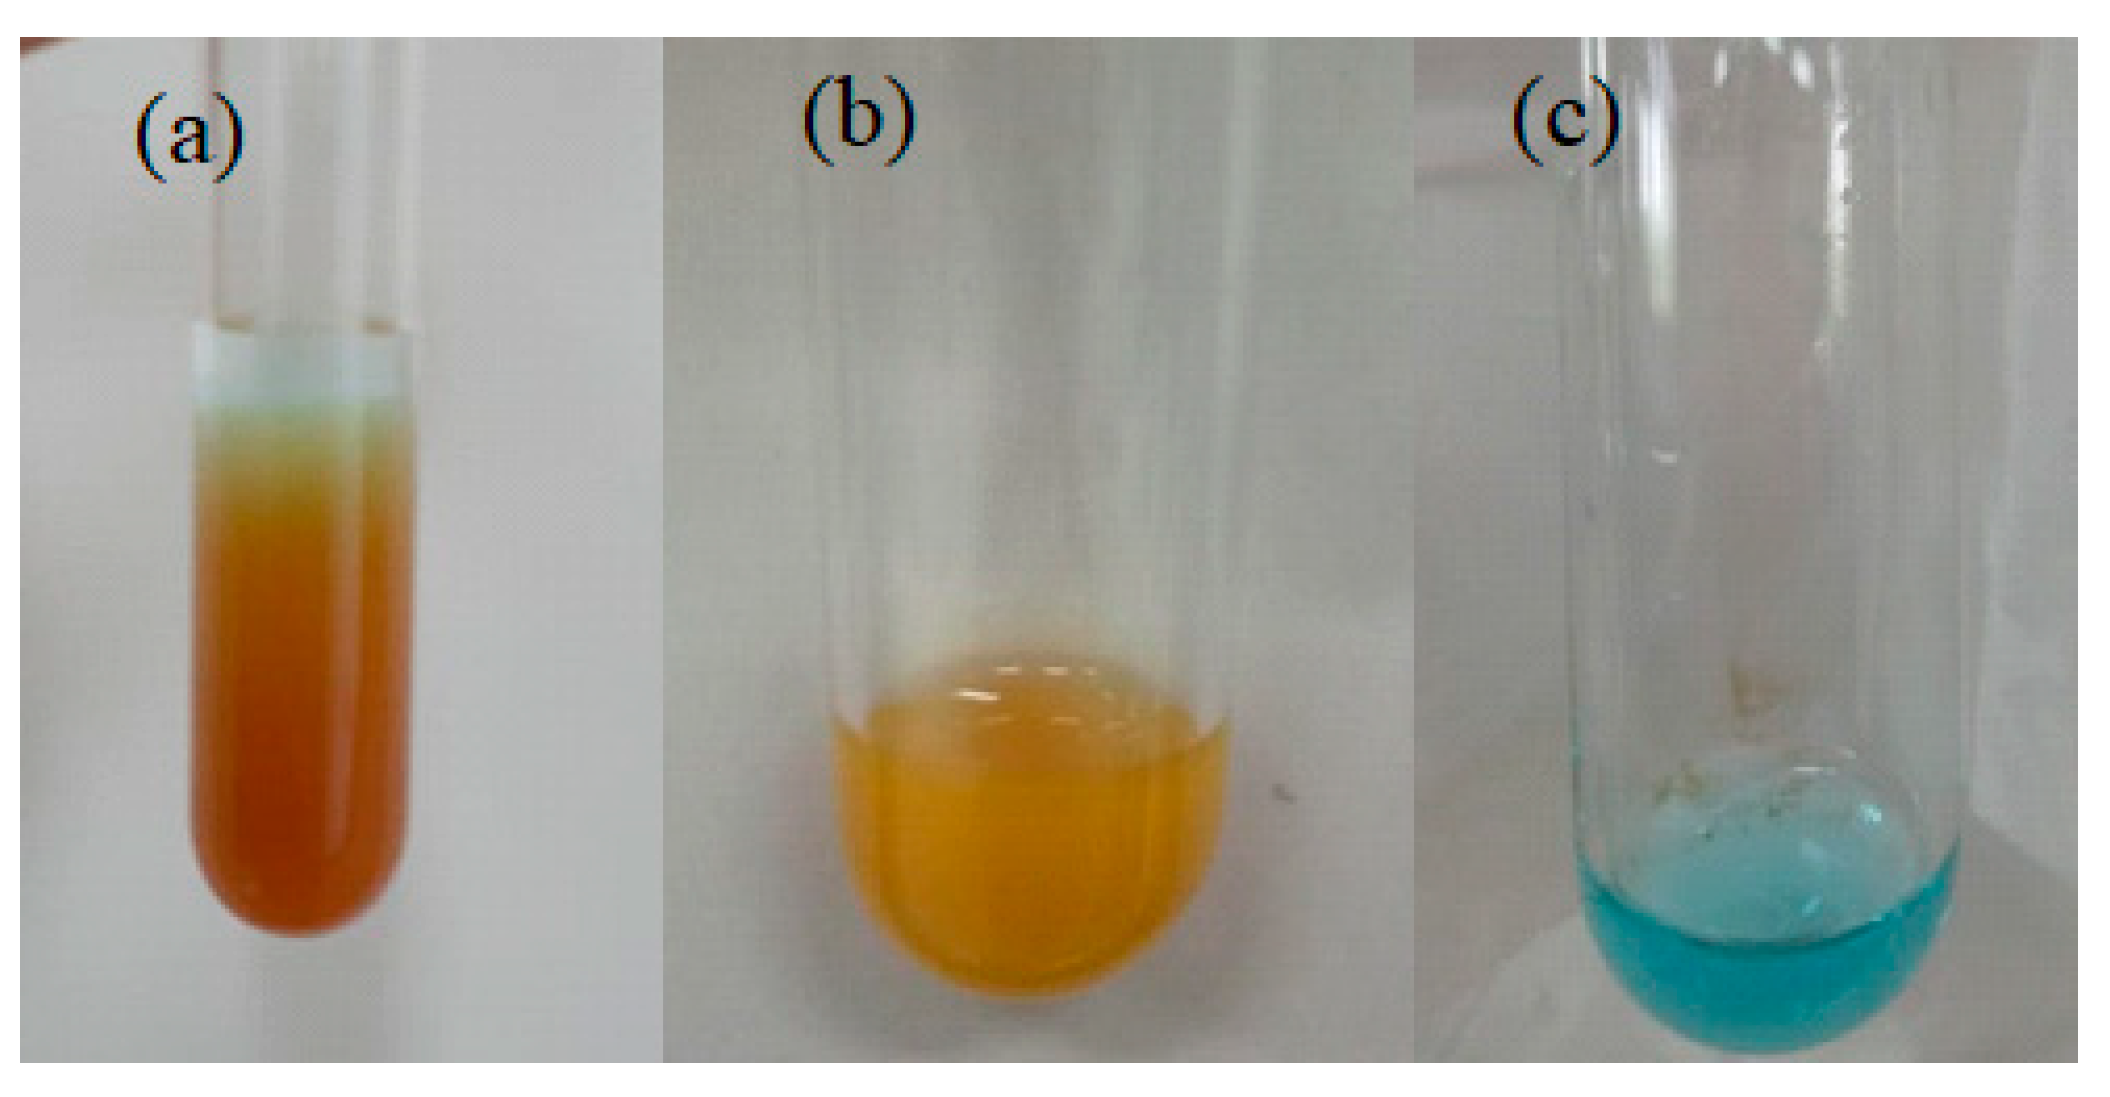
3.2. The Preparation of Imprinted Zeolite X

IZ was obtained from half of the NIZ, before the centrifugation process. Trapped glucose in NIZ was extracted with hot water (heated at 80 °C) through centrifugation. The extraction process was carried out until glucose had been extracted from the pores of the zeolite. To ensure that the glucose was successfully extracted, the filtrate was identified using Benedict’s test. Benedict’s test results on the standard glucose solution, the filtrate of NIZ after washing, and the filtrate of the IZ after washing are shown in Figure 4.
Based on Figure 4a, Benedict’s test of the standard solution of glucose produced a reddish-brown precipitate. These results indicate that the solution contains a high concentration of glucose. In Figure 4b, Benedict’s test on the NIZ filtrate produced a light-brown precipitate. This indicates that glucose was extracted from the non-imprinted zeolite. The light-brown color of this filtrate from Benedict’s test was indicated by the small concentration of glucose in the filtrate compared to the standard glucose solution. In Figure 4c, Benedict’s test on the filtrate of the IZ after washing and after the extraction process is blue. It shows that the filtrate contained no glucose, which means that the extraction process had successfully removed the glucose trapped in the NIZ.
Meanwhile, the precipitate resulting from the centrifugation was dried at 80 °C for 24 h to obtain IZ. White powder of the IZ was then used as a mixture to modify the carbon paste electrode.

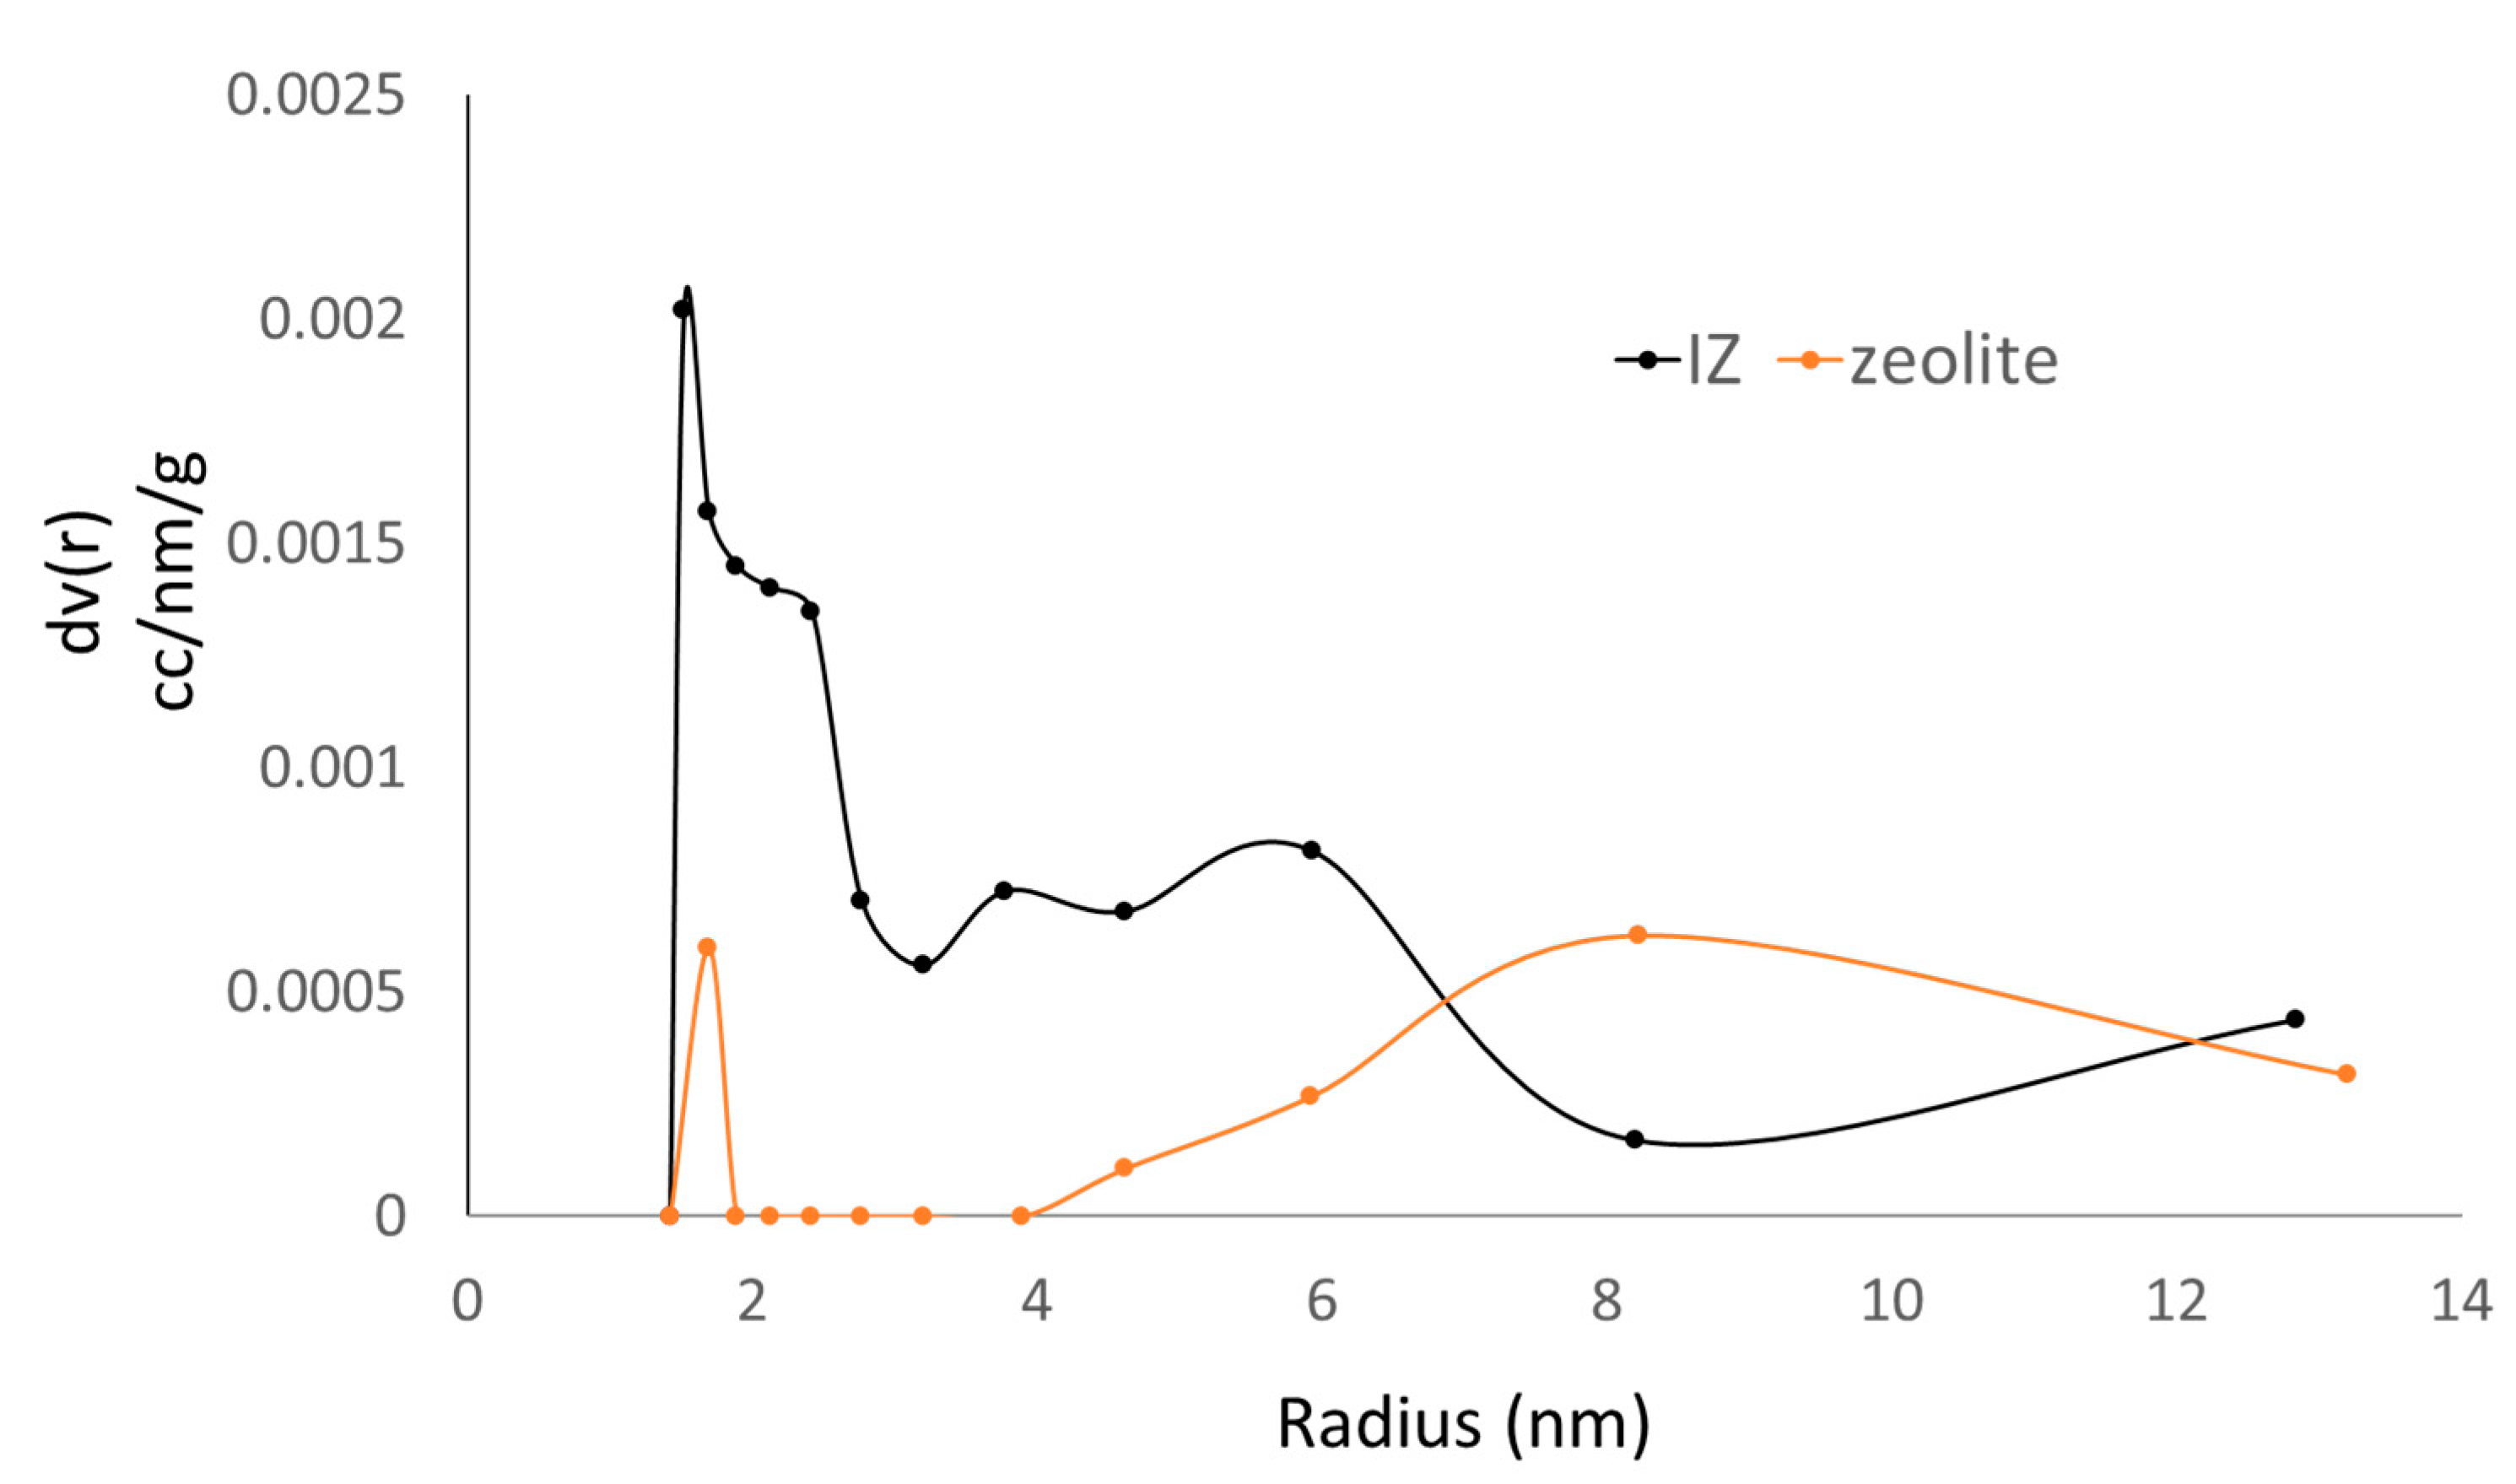
3.3. The Pore Formation of the Imprinted Zeolite

The pore formation of the imprinted zeolite was investigated using a nitrogen physisorption isotherm. Figure 5 shows the BJH pore size distribution of zeolite X and IZ. The pore size and pore distribution changed after the imprinting process. According to the data, zeolite had the two main peak pore sizes of 1.69 and 8.22 nm. After the imprinting step, the results of the IZ showed a change in the main peak pore size to approximately 1.50 nm. The pore size of approximately 8.22 nm was not found as a high peak. This indicates that there was a shrinkage of the pores according to the template. It also proves that the process of imprinting successfully modified the pores of zeolite.
By analyzing the correlation of the highest pore distribution of the IZ and the size of the glucose molecule as a template, it was found that the highest pore distribution of the IZ was 1.50 nm, whereas the size of the glucose molecule was approximately 0.9 nm. This indicates that the imprinting process did not only involve the glucose molecule. In the aqueous solution, glucose tended to solvate with water. The water molecules were also predicted to be trapped in the pores. The molecular size of the water was approximately 0.27 nm. It can be assumed that one glucose molecule and two water molecules were trapped in the same pore of zeolites. The formation process of the IZ is illustrated in Figure 6.

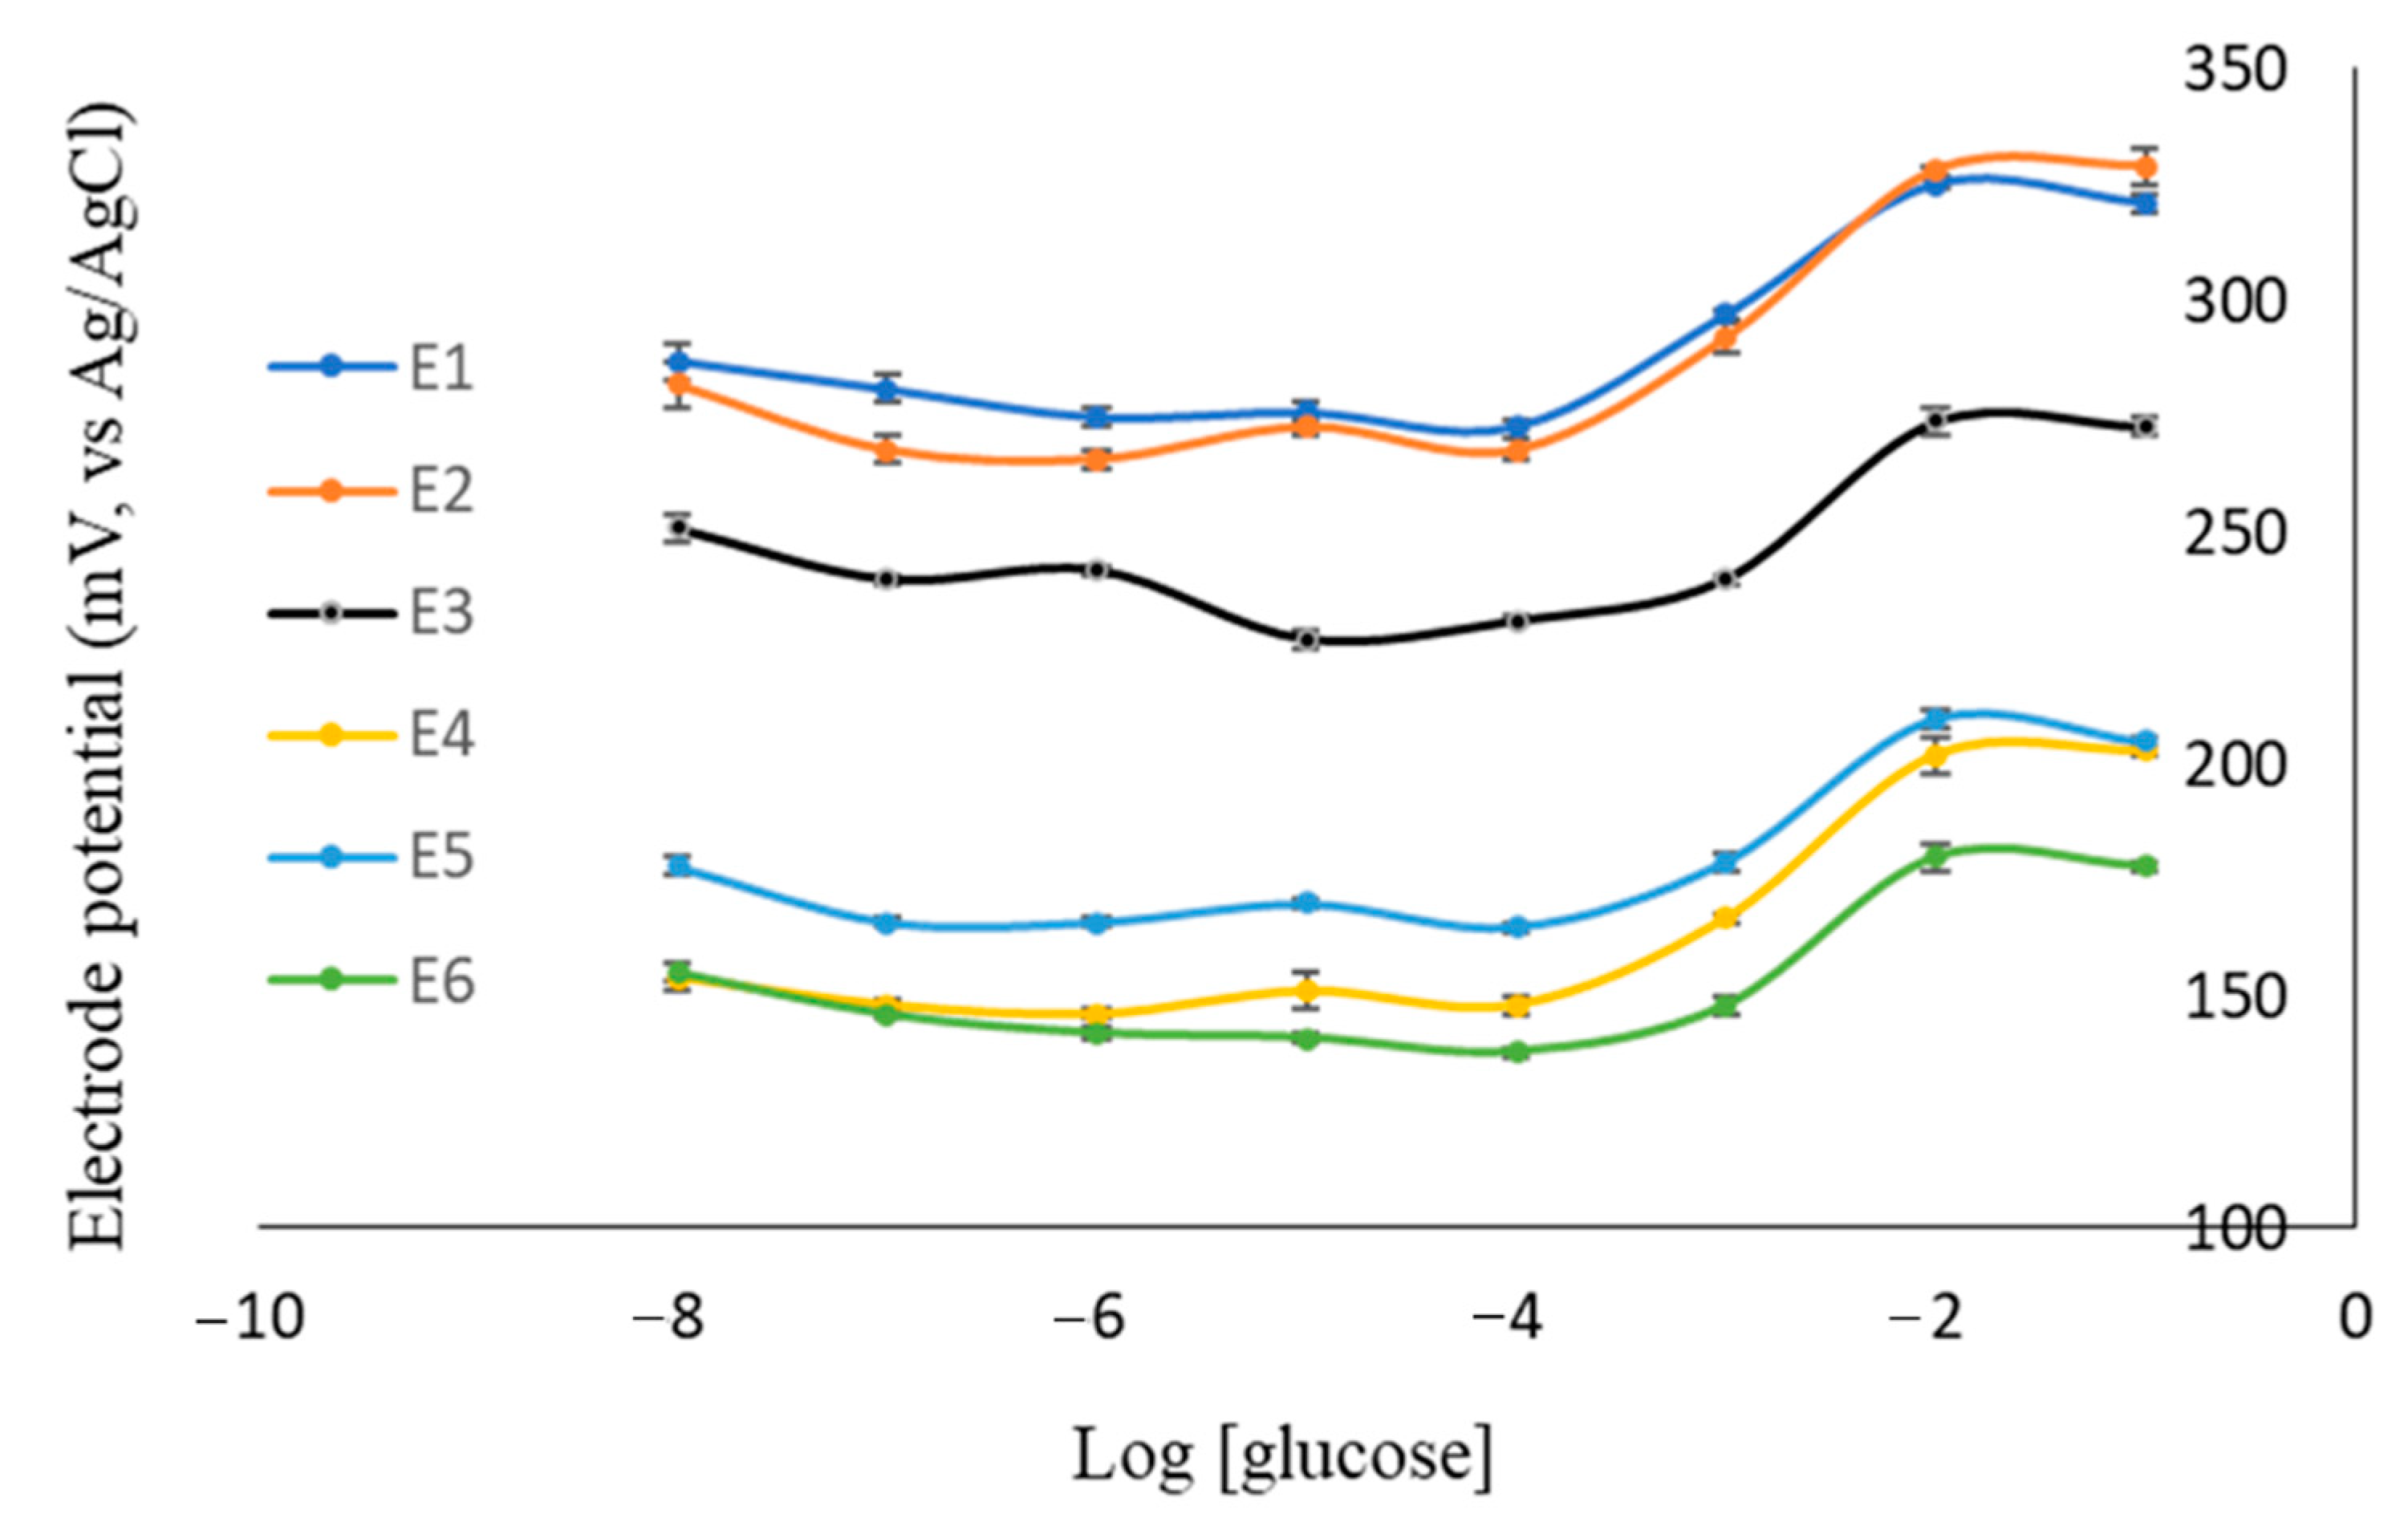
3.4. Effect of Sensor Material Composition

The IZ–carbon paste sensor was prepared using a mixture of activated carbon, paraffin, and the IZ. Activated carbon conducted the potential responses from the analyte to the Ag wire. The IZ was responsible for increasing the selectivity of the electrode toward the glucose molecule. Paraffin served as an adhesive between carbon and the IZ so that the mixture was stable under the measurement process. The effect of composition-activated carbon, paraffin, and the IZ on the Nernst factor, measurement range, and linearity of glucose analysis data are displayed in Table 3. The measured pH of the glucose solution at a concentration of 10−2, 10−3, and 10−4 M was 2.62, 4.10, and 6.90, respectively.
Potentiometric electrodes have a good performance if they produce a Nernstian factor close to the theoretical calculation ( 59 n mV/decade). In this research, the Nernst factor of glucose measurement was 29.6 mV/decade because glucose is a divalent molecule. Glucose can be oxidized to form gluconic acid by releasing two electrons [5]. Based on Table 3, the electrode that had the Nernst factor closest to the theoretical value was E2.
The Nernst factor of E2 was also exposed in the calibration curve of glucose (Figure 7). It was obtained from the linear regression slope, which was 30 mV/decade. It was closer to the Nernstian than the previous studies using zeolite LTA [19] and zeolite TS-1 [20]. Sensor performance can also be determined from the linearity of the calibration curve of glucose. The linearity value close to 1 showed a good correlation between the log [glucose] and y potential of electrode. The E2 electrode had linearity close to 1, which was 0.9868. In addition, the wider the measurement range, the better the electrode performance. Interestingly, all of the electrodes had the same range of measurement of 10−4–10−2 M. Regarding these results, the optimum composition of electrode was found using the E2 electrode.

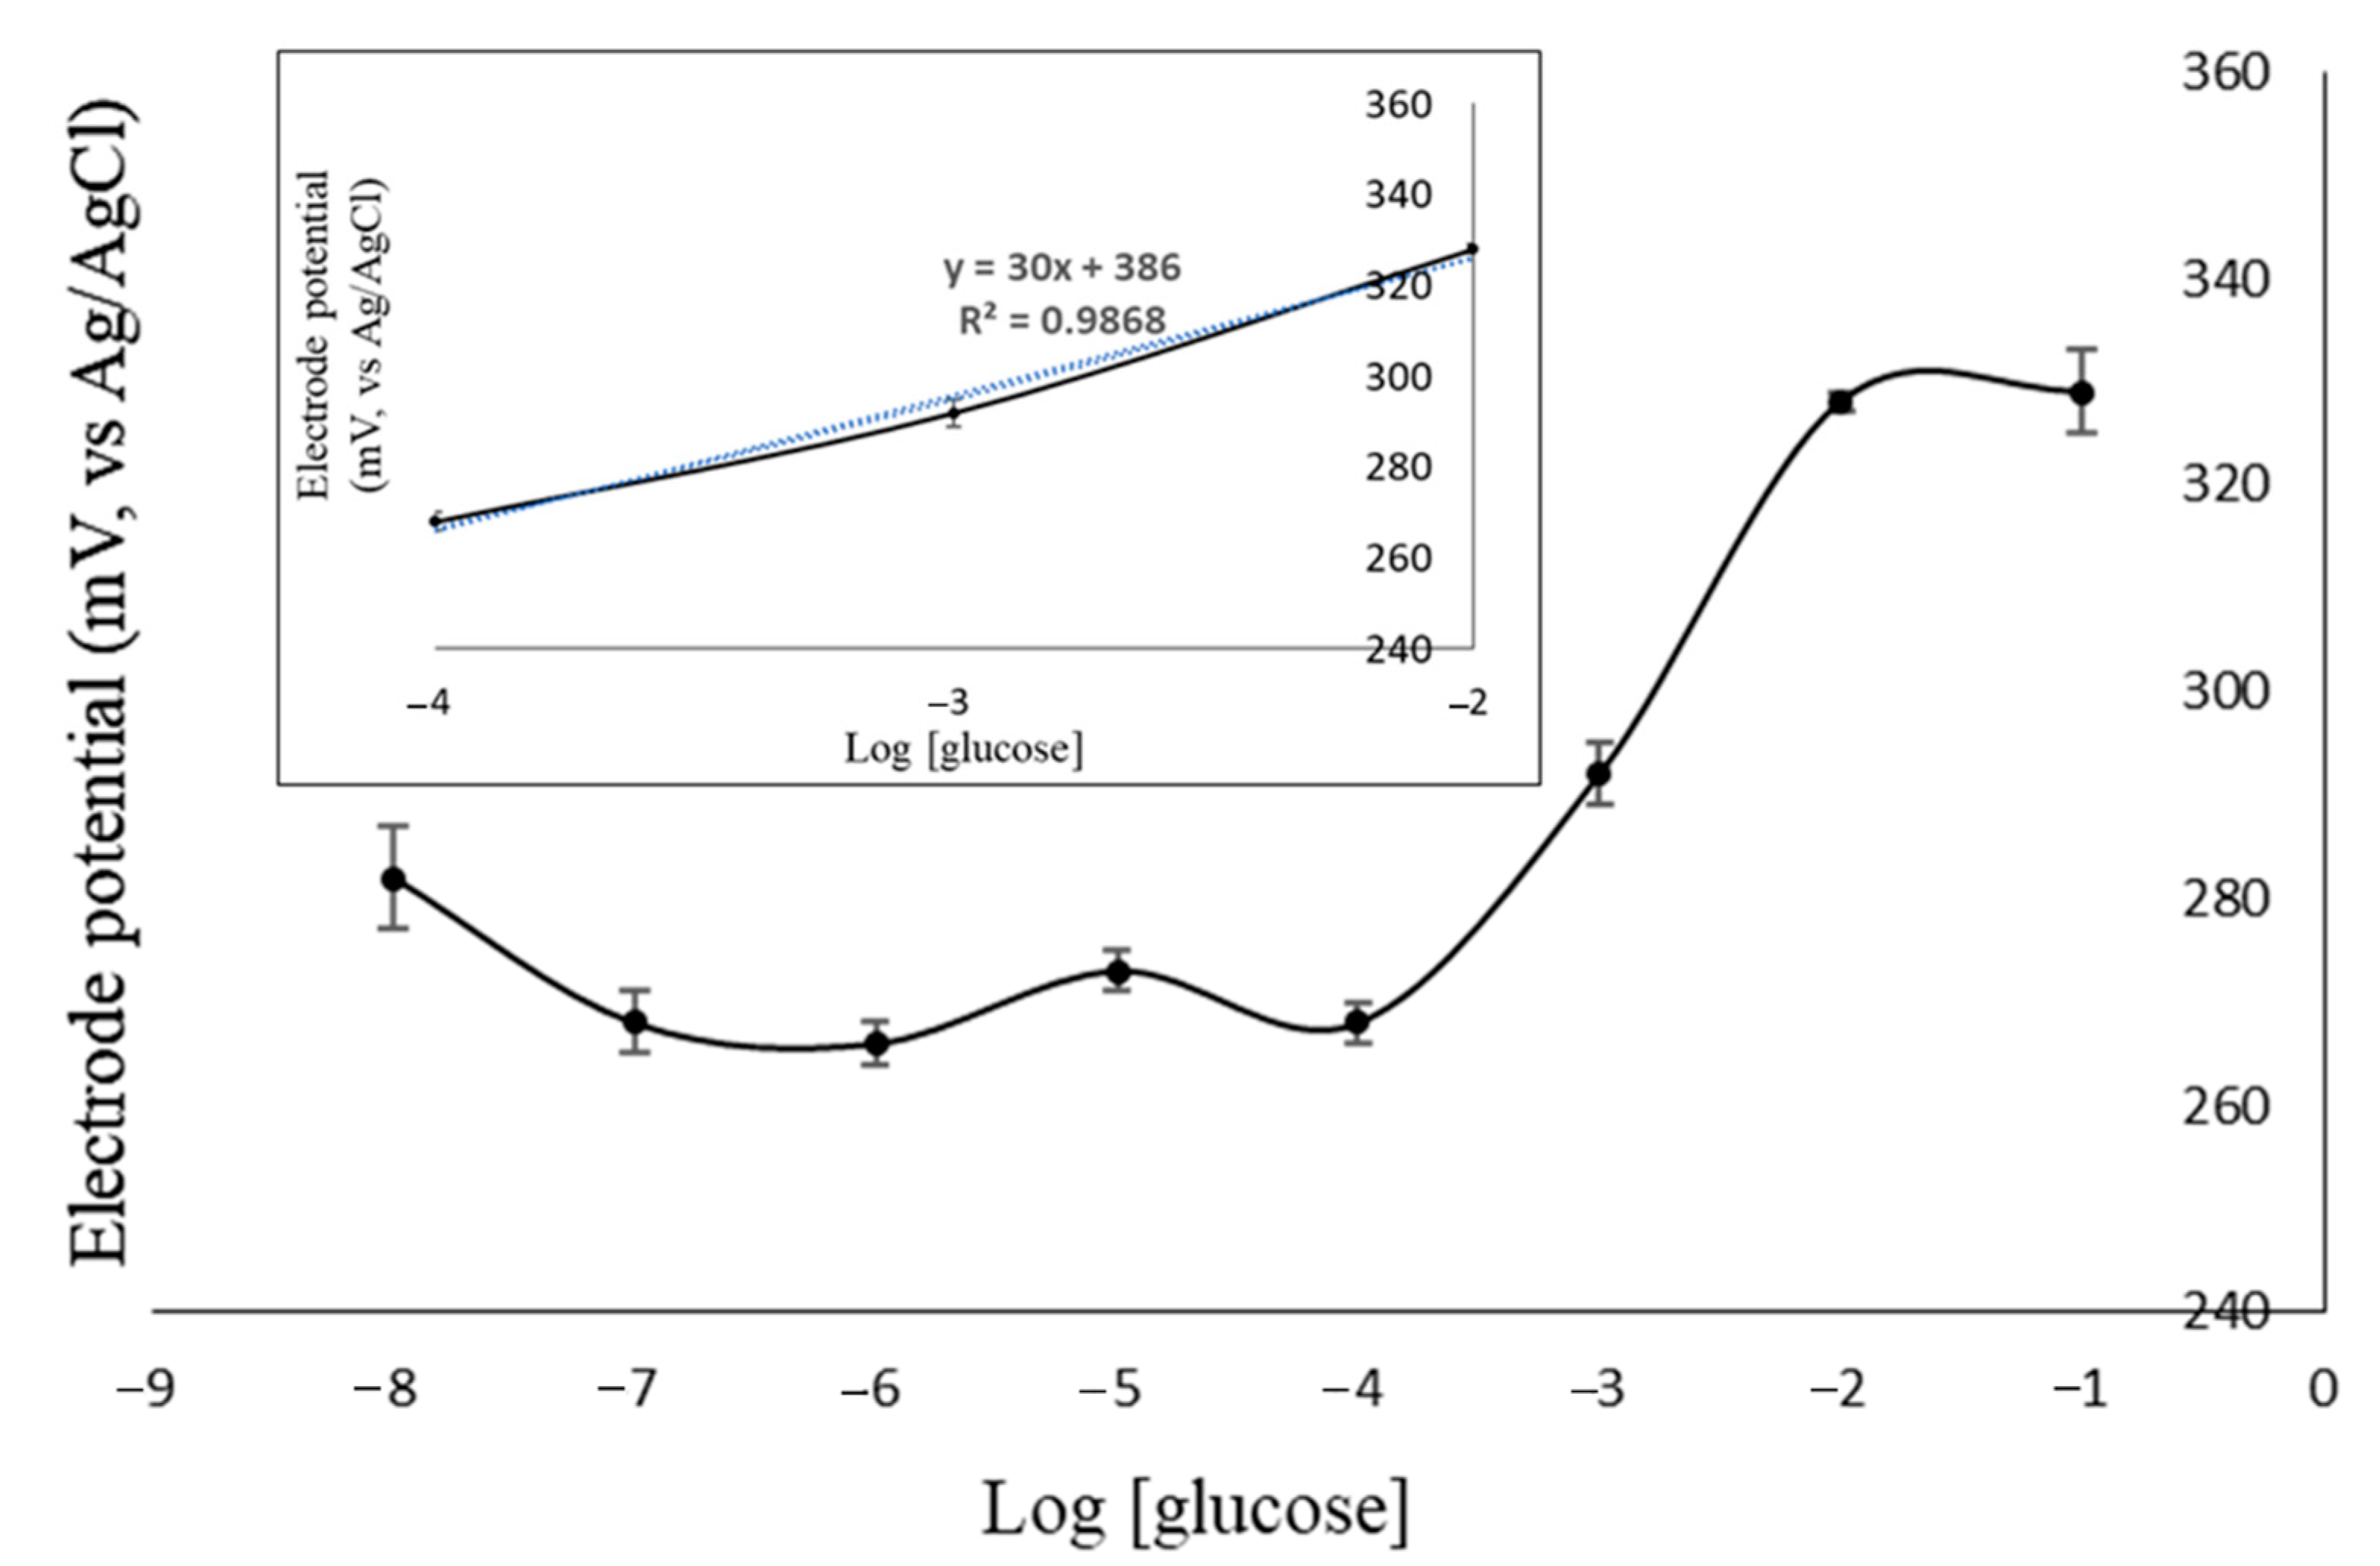
3.5. The Performance of Electrode and Analysis Method Validity

Furthermore, the zeolite-modified carbon paste electrode (EZ) and non-imprinted zeolite-modified carbon paste electrode (ENIZ) were prepared using a similar composition to the E2 electrode. EZ and ENIZ were used to measure the electrode potential at various concentrations of glucose solution. By comparing potential electrodes, the effect of the addition of the IZ on the electrode performance was determined. The method validity of EZ, ENIZ, and E2, including the range of measurement, Nernst factor, and linearity, is shown in Table 4. The correlation of the electrode potential with the log [glucose] concentration is also expressed in Figure 8. The zeolite-modified electrode showed a sub-Nernstian response, while ENIZ performed a super-Nernstian response caused by the presence of binding between glucose molecules and the zeolite; thus, there was no diffusion of the glucose molecule from ENIZ to the free molecule in the solution.
A good working electrode has a wide measurement range. The range of measurement is the range of concentrations, which shows the linear and Nernstian potential responses. The developed electrode has a measurement range between 10−4 and 10−2 M. This value is narrower than that of the zeolite TS-1-modified carbon paste electrode, which was previously developed [19].
Potentiometric sensors can have upper and lower limits of detection. The upper detection limit of the IZ–carbon paste electrode was 1.38 × 10⁻² M, and the lower detection limit was 1.28 × 10⁻⁴ M. The lower detection limit of this IZ X–carbon paste electrode was higher than that of the IZ TS-1–carbon paste electrode (4.79 × 10⁻⁵ M) [19] and the carbon paste electrode IZ LTA (1.21 × 10⁻⁵ M) [20]. Although the limit of detection was higher than that in previous studies, it can still be used to measure glucose in blood serum samples with a normal concentration (70–110 mg/dL, equivalent to 3.8 × 10⁻³–6.1 × 10⁻³ M), as well as glucose concentrations in diabetes mellitus (>200 mg/dL or equivalent to 10−2 M) [28].
The determination of precision was conducted through the measurement of the glucose solution of 10−4–10−2 M using E2. The precision value was expressed as the coefficient of variation (CV) value. The obtained CV of the 10−4–10−2 M glucose solution was 0.98–2.86%. In other words, this method had a precision of approximately 97.14–99.02%, as shown in Table 5. If a method has good precision, the solution with a concentration of 10−4–10−2 M should have a CV value of less than 7.3% [29]. The smaller the CV value, the higher the precision because the standard deviation is also smaller. Thus, the potentiometric method for measuring glucose using this developed IZ X-carbon paste electrode has good precision. This precision was better than the IZ TS-1-carbon paste electrode which have been previously developed [19].
The accuracy of this method was found to be between 98.65 and 99.29%. It was categorized as having good accuracy because the accuracy range permitted for the 10−4–10−2 M solution is 80–110% [29]. The response time is the required time for an electrode to respond to an analyte. The response time was measured from the immersion time of the electrode in solution until it produced a constant potential. The response time of the electrode correlates with the sensitivity of the electrode. The quicker the response time, the more sensitive the electrode to the detection of an analyte [24]. The response times of electrodes in a glucose solution are shown in Table 6.
The higher the glucose solution concentration, the faster the response time. This is because the number of molecules is greater in large concentrations, and the movement between molecules is faster, so the movement of molecules in the solution to the electrode is also faster. In the IZ–carbon paste electrode, a change in potential occurred because there was an equilibrium between IZ–glucose and glucose molecules. The presence of glucose in the analyte solution disrupts the equilibrium diffusion between glucose and the IZ in the electrode. The equilibrium mechanism that causes the potential difference in potentiometric measurements is shown in Figure 9.
Interestingly, the response time of the prepared electrode was faster than electrodes that were modified using TS-1 [19] and LTA [20]. This fast response showed that the method demonstrated high sensitivity towards the glucose molecule. It can be an advantageous method as it can be applied in routine analysis in a laboratory.
In this study, the lifetime of the electrode was expressed by the number of electrode usages, which still showed good performance. The performance was measured using the Nernst factor value. The data for determining the lifetime of the electrode are shown in Table 7.
Table 7 illustrates that the electrode still showed a good performance when it was used 141 times (within a period of 5 weeks). It was found that there was a change in the Nernst factor value after 141 measurements. This lifetime was shorter than that of the IZ TS-1-modified carbon paste electrode [19] and the IZ-LTA-modified electrode [20]. The lifetime of the electrode was influenced by the mechanical properties of the electrode material, such as the solubility of the material, the pH of the measured solution, and the flexibility of the material [30]. An electrode that is frequently used forms holes on its surface and is vulnerable to some of its components being dissolved. If more components of the electrode dissolve, the performance of the electrode decreases.
Selectivity is the ability of a method to measure the analyte accurately in the presence of other components [26]. The selectivity of the electrode can be expressed by the value of the selectivity coefficient (Kij) of glucose in the presence of the interfering matrix. The interference compounds were uric acid, urea, NaCl, and KCl.
Uric acid and urea in the blood could interfere with the analysis of glucose because they have a similar structure to glucose. They have a carbonyl group (C=O) and amine groups (−NH), which can form hydrogen bonds with zeolites. NaCl and KCl are hygroscopic, which means that they can increase blood viscosity. Thus, this affects the measured electrode potential value. The potential of the 10−4–10−2 M uric acid solution was measured using the carbon paste electrode and the IZ–carbon paste electrode to determine the selectivity coefficient of glucose in the uric acid matrix. Table 8 shows the selectivity coefficient value of the electrode in uric acid, urea, NaCl, and KCl solutions.
Based on the data on the value of Kij in Table 8, it can be concluded that the presence of uric acid, urea, NaCl, and KCl did not interfere with the potentiometric analysis of glucose using IZ–carbon paste electrodes. This is because the pores of the electrode already contained glucose templates, so the electrode only recognized glucose molecules. However, the selectivity of the IZ X–carbon paste electrode is lower than that of the LTA-type IZ-modified electrode [20].

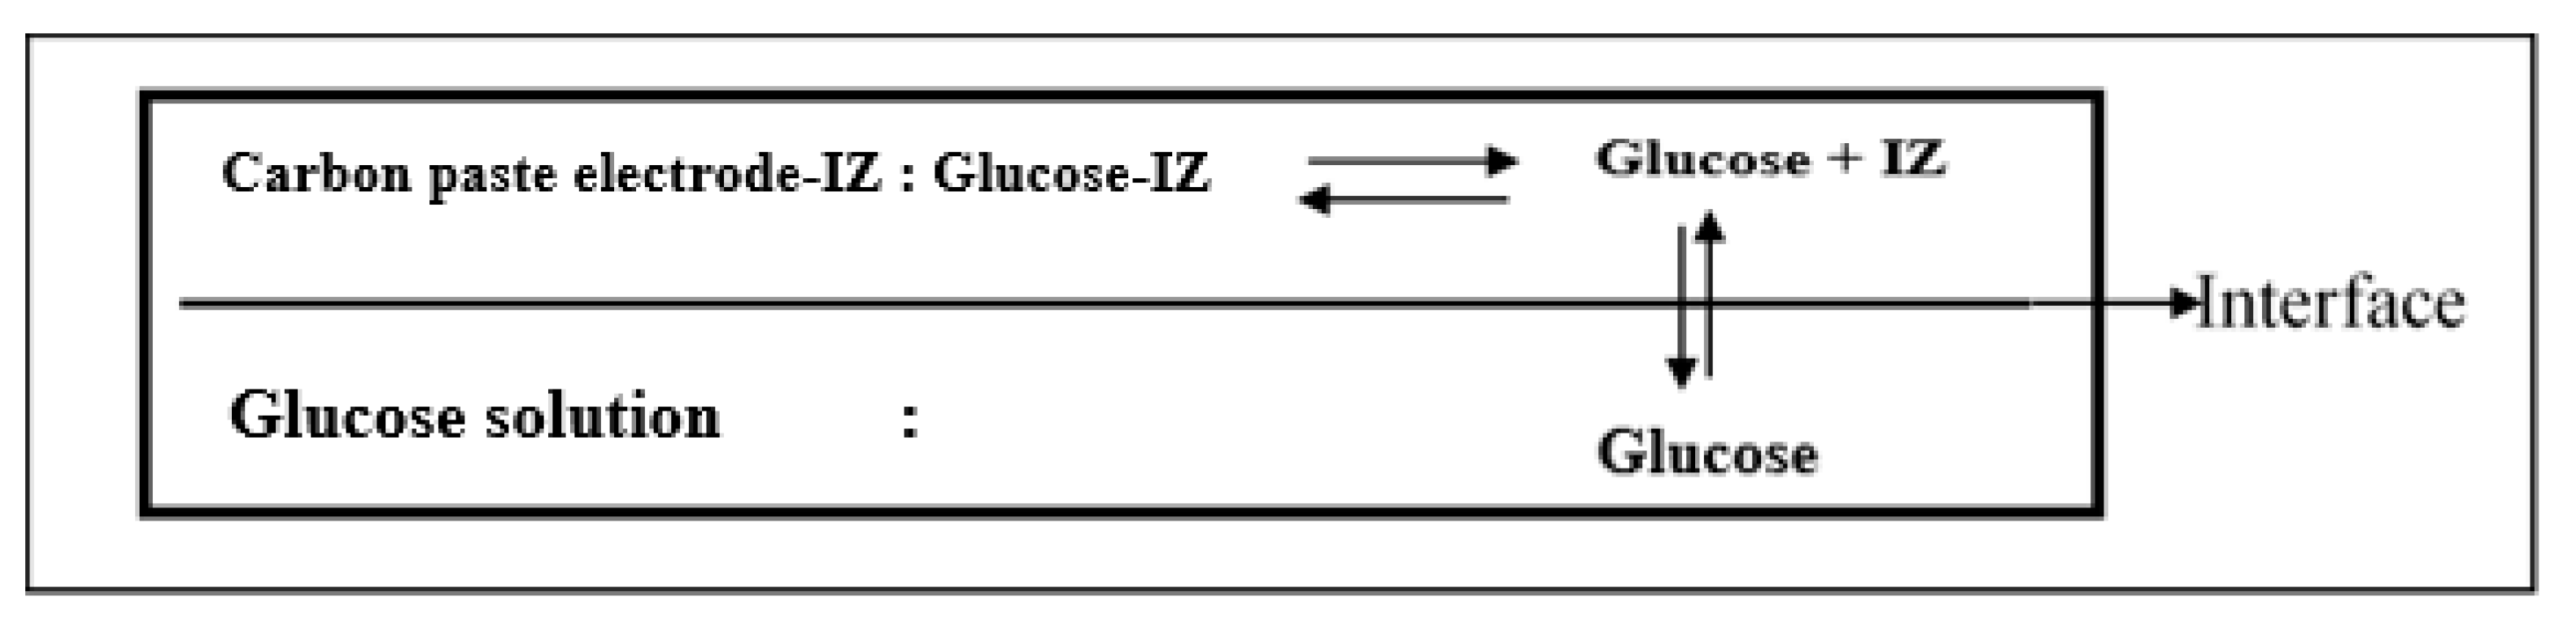
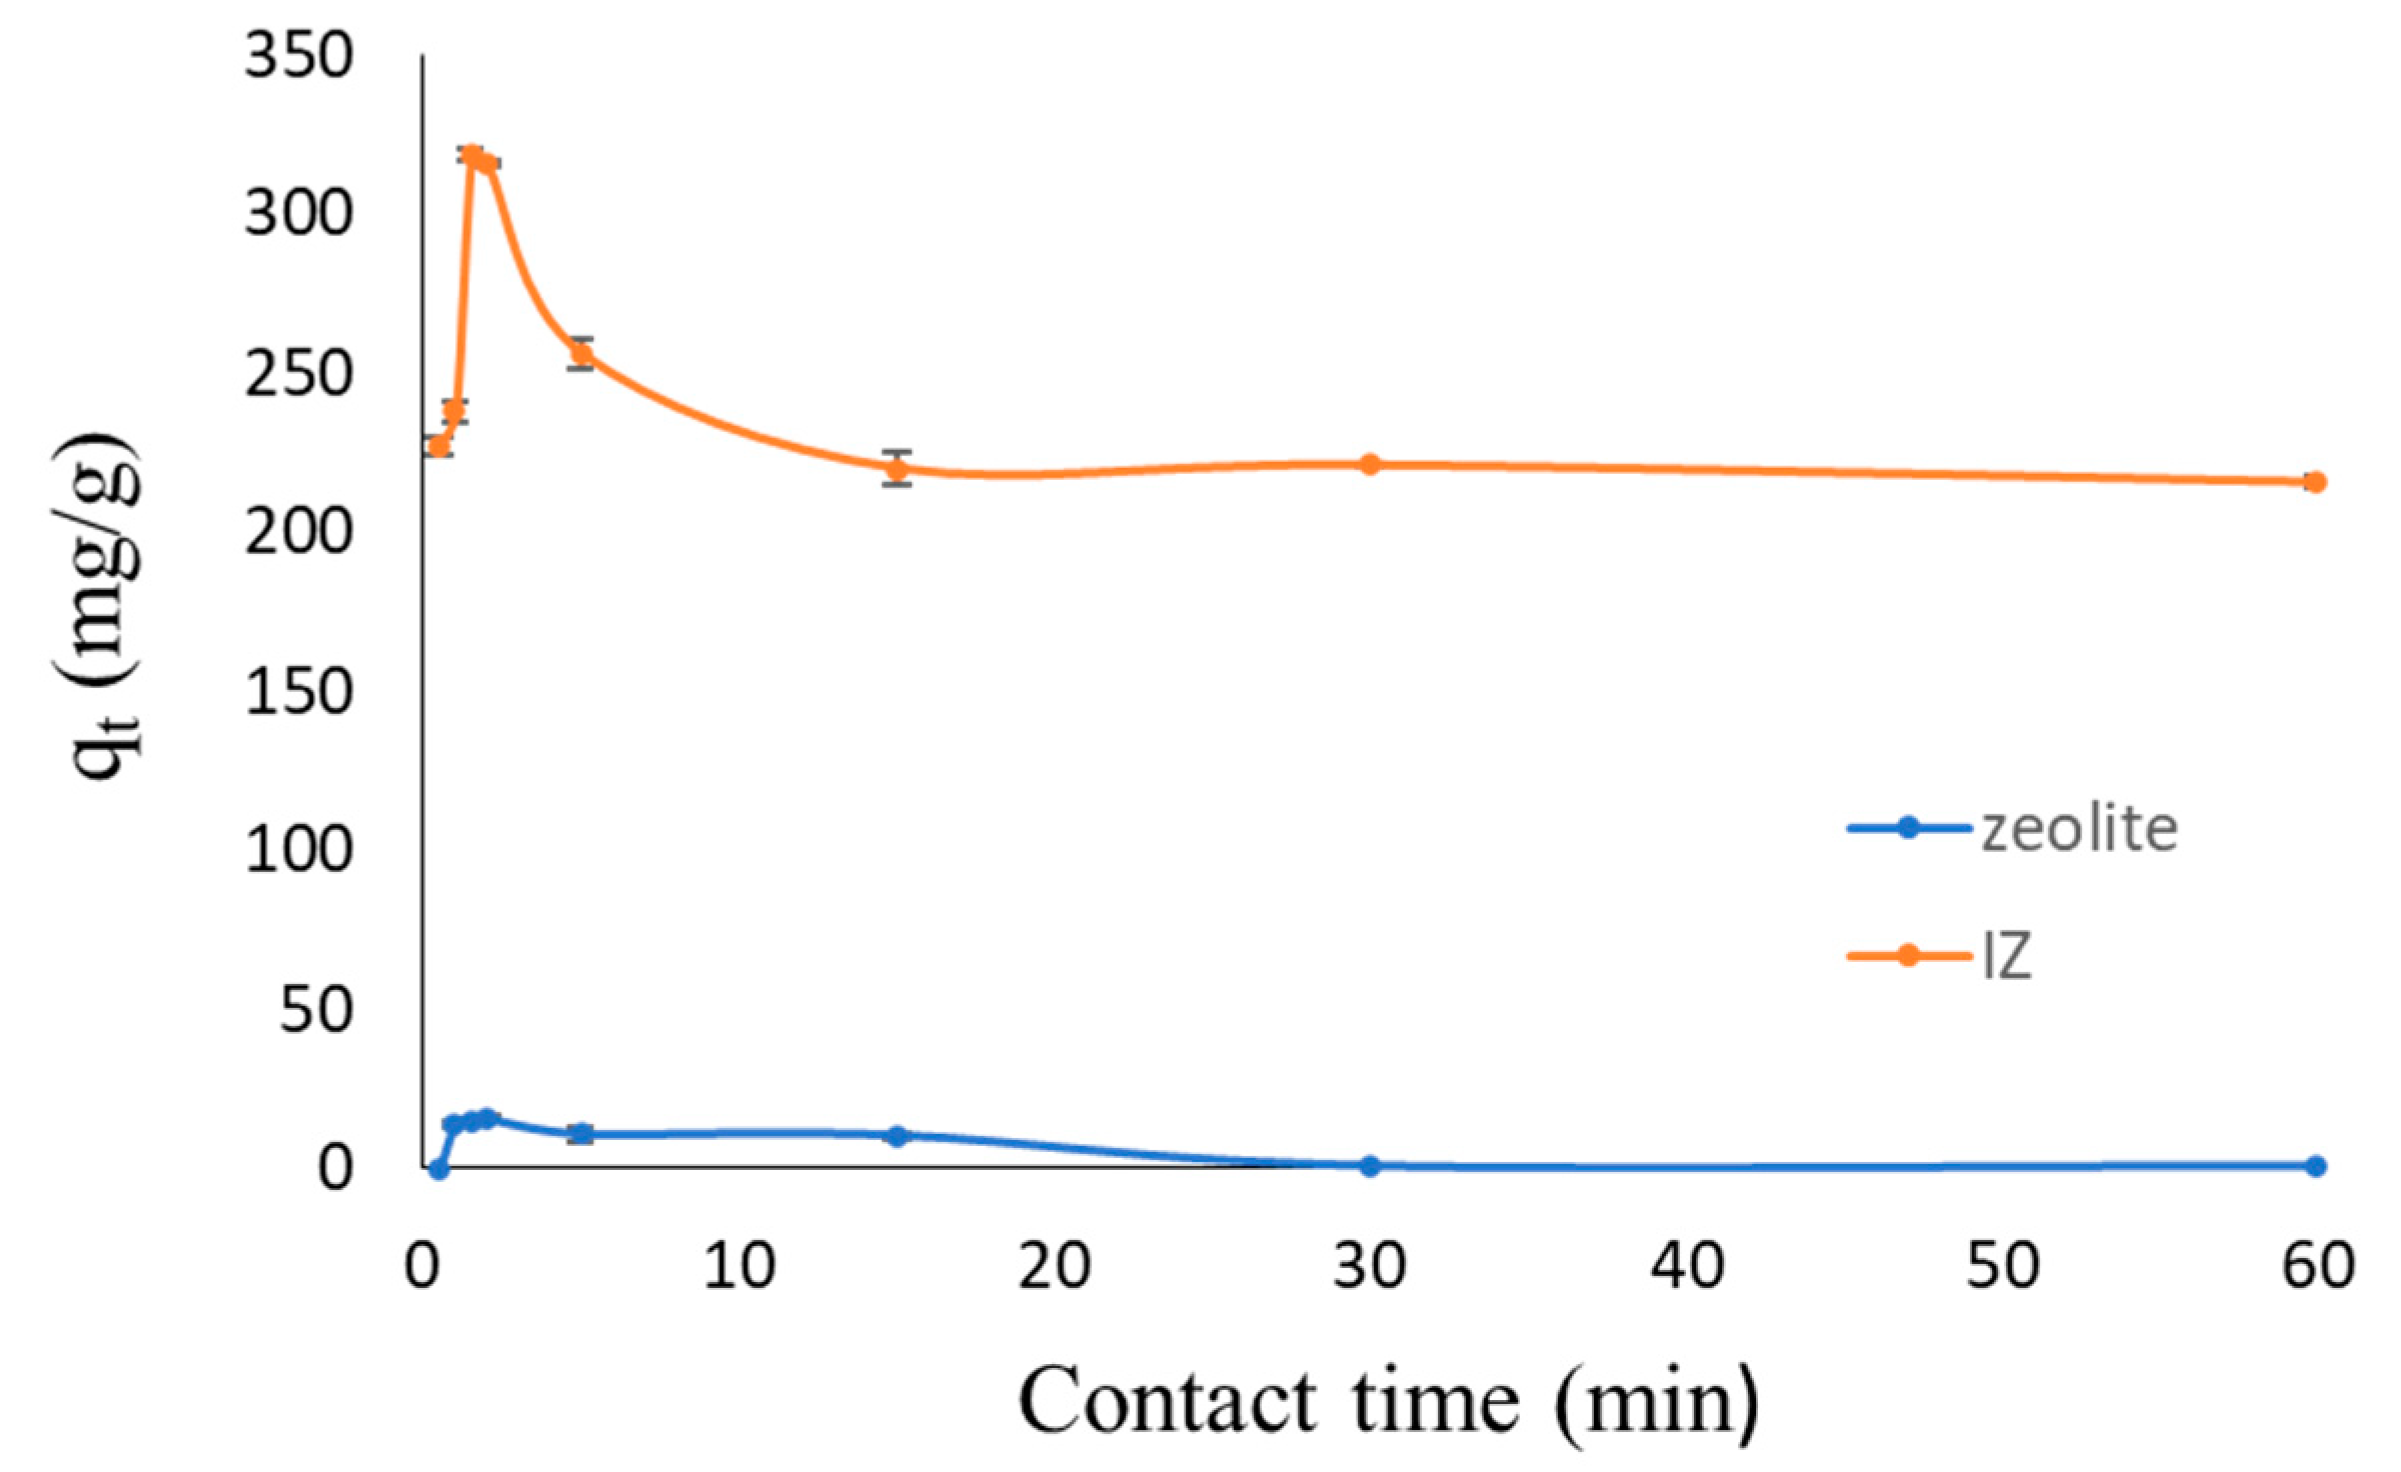
3.6. The Adsorption Performance of IZ

Table 4 shows that the IZ–carbon paste electrode produced a stable curve compared to the electrode without modification, as well as the zeolite or NIZ. To date, there has been no research reporting the mechanism of IZ in improving the performance of carbon paste electrodes. In terms of the suitability of the pore sizes of zeolite and glucose molecules, and the unique properties of zeolite as an adsorbent, this research conducted an adsorption ability test of zeolites and IZs in relation to glucose molecules.
Figure 10 displays the relationship curve between the contact time and adsorption ability of the zeolite and IZ in relation to glucose molecules. The presence of templates in zeolite X caused the adsorption to increase by more than 20 times, while the adsorption efficiency increased by approximately 3 times.
The maximum adsorption of glucose was determined within a varied time period, between 0 and 60 min, with an adsorbent dosage of 2 g/L of 10 mL 10−3 M glucose solution. The results demonstrated that the glucose adsorption time increased to 1.5 min for the IZ and 2 min for the zeolite. After this, there was a decrease in the uptake of glucose because the pores of the adsorbent became enclosed, and desorption occurred. Thus, IZ improves the performance of the carbon paste sensor through the adsorption mechanism.
The principle of imprinting zeolite was adopted from the technique of the mesoporous zeolite. The mesoporosity was introduced after the zeolite was formed. It is important to note that the pore directing agent can control the pores of the zeolite if the framework strength of the zeolite is weak or medium. Zeolites can be modified before aging or after the hydrothermal process. When the zeolite has high crystallinity, it is necessary to break the Si–O–Si bonds to offer some flexibility in the crystalline structure [31]. The hydrogen interaction between -OH of glucose molecules and O from Si-O-Al bonds on the zeolite caused the crystal structure to rearrange and form a specific pore size. In the removal process of glucose, the bonding sites left by glucose molecules increased the adsorption ability of the IZ in terms of glucose.

4. Conclusions

The imprinted zeolite X showed good performance as an electrode modifier for carbon paste in its application as a sensor for glucose detection by potentiometry. The sensor shows the Nernstian response, a wide measurement range, a low detection limit, and high precision and accuracy. The sensor also exhibited a fast response; therefore, it can be used in routine analysis. The developed method had a high economical value because it showed a long usage lifetime. The performance of the IZ–carbon paste electrode did not interfere with the presence of uric acid, urea, KCl, and NaCl. According to the method validity and stability in terms of interference, this method is highly recommended as a non-enzymatic sensor in the routine analysis of blood glucose concentration in the medical field.

Author Contributions

Conceptualization, M.K. and A.A.W.; methodology, M.K.; software, A.M. and E.Y.S.; validation, M.K. and U.S.H.; formal analysis, M.K., A.M. and E.Y.S.; investigation, M.K. and A.A.W.; resources, A.M. and E.Y.S.; data curation, A.M. and E.Y.S.; writing—original draft preparation, M.K.; writing—review and editing, M.K.; visualization, A.A.W.; supervision, U.S.H.; project administration, U.S.H.; funding acquisition, M.K. All authors have read and agreed to the published version of the manuscript.

Funding

The authors would like to thank the Ministry of Research and Technology/National Research and Innovation Agency of Indonesia for their financial support of this study through the PDUPT Grant in 2020 based on Decree Number 27lEI/KPT/2020 and Agreement/Contract Numbers 4/AMD/E1/KP.PTNBH/2020 and 807/UN3.14/PT/2020.

Institutional Review Board Statement

Not applicable.

Informed Consent Statement

Not applicable.

Data Availability Statement

Not applicable.

Acknowledgments

The authors also thank the Department of Chemistry, Faculty of Science and Technology of Universitas Airlangga for providing laboratory facilities.

Conflicts of Interest

The authors declare no conflict of interest.

References

  1. Yoo, E.H.; Lee, S.Y. Glucose biosensors: An overview of use in clinical practice. Sensors 2010, 10, 4558–4576. [Google Scholar] [CrossRef] [PubMed]
  2. Galant, A.L.; Kaufman, R.C.; Wilson, J.D. Glucose: Detection and analysis. Food Chem. 2015, 188, 149–160. [Google Scholar] [CrossRef] [PubMed]
  3. Wang, J. Glucose biosensors: 40 years of advances and challenges. Electroanalysis 2001, 13, 983–988. [Google Scholar] [CrossRef]
  4. Lim, S.H.; Wei, J.; Lin, J.; Li, Q.; KuaYou, J. A glucose biosensor based on electrodeposition of palladium nanoparticles and glucose oxidase onto nafion-solubilized carbon nanotube electrode. Biosens. Bioelectron. 2005, 20, 2341–2346. [Google Scholar] [CrossRef] [PubMed]
  5. Rahman, M.M.; Saleh Ahammad, A.J.; Jin, J.H.; Ahn, S.J.; Lee, J.J. A comprehensive review of glucose biosensors based on nanostructured metal-oxides. Sensors 2010, 10, 4855–4886. [Google Scholar] [CrossRef] [PubMed]
  6. Du, J.; Yu, X.; Wu, Y.; Di, J. ZnS nanoparticles electrodeposited onto ITO electrode as a platform for fabrication of enzyme-based biosensors of glucose. Mater. Sci. Eng. C 2013, 33, 2031–2036. [Google Scholar] [CrossRef]
  7. Zhang, L.; Ni, Y.; Li, H. Addition of porous cuprous oxide to a Nafion film strongly improves the performance of a nonenzymatic glucose sensor. Microchim. Acta 2010, 171, 103–108. [Google Scholar] [CrossRef]
  8. Zhou, X.; Dai, X.; Li, J.; Long, Y.; Li, W.; Tu, Y. A sensitive glucose biosensor based on Ag@ C core–shell matrix. Mater. Sci. Eng. C 2015, 49, 579–587. [Google Scholar] [CrossRef]
  9. Bishop, D.K.; La Belle, J.T.; Vossler, S.R.; Patel, D.R.; Cook, C.B. A disposable tear glucose biosensor—Part 1: Design and concept testing. J. Diabetes Sci. Technol. 2010, 4, 299–306. [Google Scholar] [CrossRef]
  10. Wang, R.T.; Yang, L.W.; Xu, A.F.; Liu, E.E. Achieving non-enzymatic blood glucose sensing by uprooting saturation. Anal. Chem. 2020, 92, 10777–10782. [Google Scholar] [CrossRef]
  11. Yang, L.W.; Liu, E.E.; Xu, A.F.; Chen, J.Y.; Wang, R.T.; Xu, G. Improving linear range limitation of non-enzymatic glucose sensor by OH- concentration. Crystals 2020, 10, 186. [Google Scholar] [CrossRef]
  12. Gonzales, N.M.; Fitch, A.L.; Al-Bazi, J. Development of a RP-HPLC method for determination of glucose in Shewanella oneidensis cultures utilizing 1-phenyl-3-methyl-5-pyrazolone derivatization. PLoS ONE 2020, 15, e0229990. [Google Scholar] [CrossRef] [PubMed]
  13. Kamal, M.A.; Klein, P. Determination of sugars in honey by liquid chromatography. Saudi J. Biol. Sci. 2011, 18, 17–21. [Google Scholar] [CrossRef] [PubMed]
  14. Çiftçi, H.; Tamer, U.; Teker, M.Ş.; Pekmez, N.Ö. An enzyme free potentiometric detection of glucose based on a conducting polymer poly (3-aminophenyl boronic acid-co-3-octylthiophene). Electrochim. Acta 2013, 90, 358–365. [Google Scholar] [CrossRef]
  15. Çelik, F.; Çiftçi, H.; Tamer, U. A Glucose Selective Non-enzymatic Potentiometric Chitosan-Goldnanoparticle Nanocomposite Sensor Based on Boronic Acid-Diol Recognition. Electroanalysis 2018, 30, 2696–2703. [Google Scholar] [CrossRef]
  16. Kianfar, E. Zeolites: Properties, applications, modification and selectivity. In Zeolites: Advances in Research and Applications; Mahler, A., Ed.; Nova Science Publishers, Inc.: Hauppauge, NY, USA, 2020. [Google Scholar]
  17. Bish, D.L. Parallels and distinctions between clay minerals and zeolites. Dev. Clay Sci. 2013, 5, 783–800. [Google Scholar]
  18. Wang, J.; Walcarius, A. Zeolite-modified carbon paste electrode for selective monitoring of dopamine. J. Electroanal. Chem. 1996, 407, 183–187. [Google Scholar] [CrossRef]
  19. Khasanah, M.; Widati, A.A.; Handajani, U.S.; Shofiyyah, M.R.; Rakhma, S.A.; Predianto, H. Imprinted zeolite modified carbon paste electrode as a selective potentiometric sensor for blood glucose. In AIP Conference Proceeding; AIP Publishing LLC: Melville, NY, USA, 2020. [Google Scholar]
  20. Khasanah, M.; Widati, A.A.; Handajani, U.S.; Harsini, M.; Ilmiah, B.; Oktavia, I.D. Imprinted zeolite modified carbon paste electrode as a selective sensor for blood glucose analysis by potentiometry. Indones. J. Chem. 2020, 20, 1301–1310. [Google Scholar] [CrossRef]
  21. Qiang, Z.; Shen, X.; Guo, M.; Cheng, F.; Zhang, M. A simple hydrothermal synthesis of zeolite X from bauxite tailings for highly efficient adsorbing CO2 at room temperature. Micro. Meso. Mater. 2019, 287, 77–84. [Google Scholar] [CrossRef]
  22. Ardakani, M.M.; Akrami, Z.; Kazemian, H.; Zare, H.R. Electrocatalytic characteristics of uric acid oxidation at graphite–zeolite-modified electrode doped with iron (III). J. Electroanal. Chem. 2006, 586, 31–38. [Google Scholar] [CrossRef]
  23. Thammavong, S. Studies of synthesis, kinetics and particle size of zeolite X from narathiwat kaolin. Master Thesis, Suranaree University of Technology, Nakhon Ratchasima, Thailand, 2003. [Google Scholar]
  24. Masoudian, S.K.; Sadighi, S.; Abbasi, A. Synthesis and characterization of high aluminum zeolite X from technical grade materials. Bull. Chem. React. Eng. Catal. 2013, 8, 54–60. [Google Scholar] [CrossRef] [Green Version]
  25. Maccà, C. Response time of ion-selective electrodes: Current usage versus IUPAC recommendations. Anal. Chim. Acta 2004, 512, 183–190. [Google Scholar] [CrossRef]
  26. Tohda, K.; Dragoe, D.; Shibata, M.; Umezawa, Y. Studies on the matched potential method for determining the selectivity coefficients of ion-selective electrodes based on neutral ionophores: Experimental and theoretical verification. Anal. Sci. 2001, 17, 733–743. [Google Scholar] [CrossRef] [PubMed]
  27. Azizi, S.N.; Daghigh, A.A.; Abrishamkar, M. Phase Transformation of Zeolite P to Y and Analcime Zeolites due to Changing the Time and Temperature. J. Spectrosc. 2013, 2013, 428216. [Google Scholar] [CrossRef]
  28. McCuistion, L.E.; Dimaggio, K.V.; Winton, M.B.; Yeager, J.J. Pharmacology: A Patient-Centered Nursing Process Approach, 11th ed.; Elsevier: Amsterdam, The Netherlands, 2021. [Google Scholar]
  29. Taverniers, I.; De Loose, M.; Van Bockstaele, E. Trends in quality in the analytical laboratory. II. Analytical method validation and quality assurance. Trends Anal. Chem. 2004, 23, 535–552. [Google Scholar] [CrossRef]
  30. Buhlmann, P.; Umezawa, Y.; Rondinini, S.; Vertova, A.; Pigliucci, A.; Bertesago, L. Lifetime of ion selective electrodes based on charged ionophores. Anal. Chem. 2000, 72, 1843–1852. [Google Scholar] [CrossRef] [PubMed]
  31. García-Martínez, J.; Johnson, M.; Valla, J.; Li, K.; Ying, J.Y. Mesostructured zeolite Y—High hydrothermal stability and superior FCC catalytic performance. Catal. Sci. Technol. 2011, 2, 987–994. [Google Scholar] [CrossRef]
Figure 1. The pore geometry of (a) zeolite LTA, (b) zeolite TS-1, and (c) zeolite Y.
Chemengineering 06 00071 g001
Figure 2. The construction of the IZ–carbon paste sensor [19] (Source: please see reference [19]).
Chemengineering 06 00071 g002
Figure 3. Diffractogram pattern of zeolite X.
Chemengineering 06 00071 g003
Figure 4. Results of Benedict’s test of (a) glucose solution, (b) filtrate of NIZ after washing, and (c) filtrate of IZ after washing.
Chemengineering 06 00071 g004
Figure 5. The BJH pore size distribution of zeolite and IZ.
Chemengineering 06 00071 g005
Figure 6. Illustration of the formation process of IZ.
Chemengineering 06 00071 g006
Figure 7. The correlation of log [glucose] with electrode potential (inset: the linearity curve of the E2 electrode).
Chemengineering 06 00071 g007
Figure 8. The correlation of electrode potential toward log [glucose] in the various compositions of the electrode.
Chemengineering 06 00071 g008
Figure 9. Mechanism of glucose equilibrium, which results in potential difference on the electrode surface in potentiometry.
Chemengineering 06 00071 g009
Figure 10. Relationship curve of zeolite X and IZ X contact time toward adsorption of glucose.
Chemengineering 06 00071 g010
Table 1. The composition of activated carbon, solid paraffin, and IZ.
Sensor CodeMass of Activated Carbon:Paraffin:IZ
E113:7:0
E212:7:1
E311:7:2
E410:7:3
E59:7:4
E68:7:5
Table 2. Data on the peak positions on the diffractogram of synthesized zeolite and standard zeolite X.
2θ (°) Position
Synthesized ZeoliteStandard Zeolite X
18.4418.42
23.3523.58
24.6924.64
27.3227.32
29.9129.21
30.3230.30
47.0247.06
Table 3. Data on the Nernst factor, measurement range, and linearity of glucose solution variations in sensor composition.
Sensor CodeMass of Activated Carbon:Solid Paraffin:IZNernst Factor (mV/Decade)Measurement Range (M)Linearity (r)
E113:7:02610−4–10−20.9980
E212:7:13010−4–10−20.9868
E311:7:226.510−4–10−20.9740
E410:7:32710−4–10−20.9695
E59:7:422.510−4–10−20.9556
E68:7:52110−4–10−20.9162
Table 4. Data on E1, E2, EZ, and ENIZ performances.
Sensor CodeMass Ratio of Activated Carbon, Paraffin, Modifier *Nernst Factor
(mV/Decade)
Measurement Range (M)Linearity (r)
E113:7:02610−4–10−20.9980
E212:7:13010−4–10−20.9868
EZ12:7:125.510−4–10−20.9884
ENIZ12:7:13210−4–10−20.9720
* modifier = IZ/Z/NIZ.
Table 5. Precision value when measuring glucose solution using E2.
[Glucose] (M)Electrode Potential
(mV, vs. Ag/AgCl)
SDCV (%)Precision (%)
123
10−42552662527.372.8697.14
10−32782862746.112.1897.82
10−23113153093.050.9899.02
Table 6. Data of E2 electrode response time in glucose solution measurement.
[Glucose] (M)Potential
(mV, vs. Ag/AgCl)
Response Time (Second)
10−427413
10−329311
10−230210
Table 7. Data of Nernst factor and measurement range in the determination of sensor lifetime.
The _st MeasurementNernst Factor (mV/Decade)Measurement Range (M)
413010−4–10−2
1113010−4–10−2
14128.510−4–10−2
Table 8. Data on the Kij value of carbon paste and IZ–carbon paste electrodes.
SolutionConcentration (M)Selectivity Coefficient (Kij)
Carbon PasteIZ–Carbon Paste
Urea10−43.86 × 10−24.04 × 10−3
10−32.84 × 10−27.02 × 10−3
10−21.85 × 10−22.09 × 10−3
Uric acid10−44.804.37 × 10−2
10−33.011.16 × 10−2
10−20.334.94 × 10−2
NaCl10−48.051.21 × 10-1
10−32.912.66 × 10−1
10−24.561.98 × 10−1
KCl10−41.333.30 × 10−1
10−31.026.46 × 10−1
10−29.673.41 × 10−1
Publisher’s Note: MDPI stays neutral with regard to jurisdictional claims in published maps and institutional affiliations.

