Article

Comparative Study of Physicochemical Characteristics and Catalytic Activity of Copper Oxide over Synthetic Silicon Oxide and Silicon Oxide from Rice Husk in Non-Oxidative Dehydrogenation of Ethanol

1
Center of Physical and Chemical Methods of Research and Analysis, Almaty 050012, Kazakhstan
2
Faculty of Chemistry and Chemical Technology, Al-Farabi Kazakh National University, Almaty 050040, Kazakhstan
3
Laboratory of Engineering Profile, Satbayev University, Almaty 050013, Kazakhstan
*
Author to whom correspondence should be addressed.
ChemEngineering 2022, 6(5), 74; https://doi.org/10.3390/chemengineering6050074
Submission received: 15 August 2022 / Revised: 10 September 2022 / Accepted: 19 September 2022 / Published: 28 September 2022

Abstract

:
The article presents the results of comparative research on the physicochemical characteristics and catalytic activity of copper oxide supported on synthetic SiO2 and SiO2 (RH) from rice husk. SiO2 (RH) is more hydrophobic compared to SiO2, which leads to the concentration of copper oxide on its surface in the form of a “crust”, which is very important in the synthesis of low-percentage catalysts. According to SEM, XRD, and TPR-H2, the use of SiO2 (RH) as a carrier leads to an increase in the dispersion of copper oxide particles, which is the active center of ethanol dehydrogenation.

Graphical Abstract

1. Introduction

Acetaldehyde is one of the most important chemicals. It can be used as a raw material for the production of acetic acid, butanol, 1,3-butylene glycol, acetic anhydride, ethyl acetate, butylaldehyde, crotonaldehyde, pyridine, and many other products [1,2,3]. In addition, it is widely used in industries, including the food industry, the plastic industry, as well as in the pharmaceutical and cosmetic industries in the production of materials [4,5,6].
The main industrial method for producing acetaldehyde is the oxidation of valuable ethylene in the presence of aqueous solutions of expensive palladium and copper chloride. This technology is characterized by the formation of a number of toxic organochlorine by-products, including acetic acid and croton aldehyde, dissolved in large amounts of water. Recently, against the background of tightening requirements for environmentally friendly technologies and the desire to shift away from oil dependence, interest in the synthesis of acetaldehyde by ethanol dehydrogenation has again increased [7].
Ethanol is very attractive due to its availability and safety during storage and handling [8,9]. In addition, ethanol is relatively inexpensive, it is easy to transport, it has low toxicity, and it does not contain catalytic poisons such as sulfur, chlorine, etc. More importantly, ethanol can be produced from renewable raw materials by the fermentation of biomass, as well as from agro-industrial waste, residues of timber, and the organic fraction of municipal solid waste. Ethanol thus produced is called bioethanol, which is a mixture of ethanol and water with a molar ratio of 1:13 (about 12 wt.% ethanol) [10,11]. It should be noted that since biomass absorbs carbon dioxide from the atmosphere for its growth, the processing of ethanol obtained from biomass does not contribute to global warming. Two gas-phase processes of ethanol conversion to acetaldehyde are known [12,13]: selective catalytic oxidation with oxygen or air and non-oxidative catalytic dehydrogenation. The non-oxidative dehydrogenation of ethanol to acetaldehyde in comparison with the oxidative dehydrogenation method has obvious advantages such as no oxidant, its partial oxidation to acetic acid and carbon dioxide, and that the resulting acetaldehyde is easily separated from the reaction by-products. In addition, the non-oxidative dehydrogenation of ethanol is inherently safe, while the mixture of ethanol and oxygen presents a serious problem due to the explosive nature of large-scale industrial processes [2,14]. To create a competitive technology for the production of acetaldehyde from ethanol, it is necessary to develop an efficient catalyst. The activity and selectivity of catalysts depend on the physical and chemical characteristics of the active components. As a general rule, catalysts for the dehydrogenation of alcohol to acetaldehyde can be mainly divided into two types: metal (Cu, Ag, Pd, Au, etc.) and metal oxides (CuO, ZnO, MgO, Cr2O3, etc.) [15,16,17,18,19,20,21,22,23,24,25]. Among these catalysts, copper-based catalysts are very active and highly selective against acetaldehyde, partly because Cu can split C–C and C–O bonds at much lower speeds than other transition metals (Pd and Pt) [26]. However, the main problem of copper catalysts is their rapid deactivation. Therefore, special attention is paid to preventing copper sintering and extending the life of the catalyst. Bueno et al. [27] found that the selectivity to acetaldehyde in ethanol dehydrogenation is related to the dispersion of copper. Cassinelli and co-workers [28,29] reported that Cu+ cations are more active in ethanol dehydrogenation, while other groups of authors [29] found that Cu metal particles are responsible for the activity of ethanol dehydrogenation. The catalytic activity and stability of the catalyst in ethanol dehydrogenation also depend on the nature of the support. A good carrier should provide the necessary dispersion of the active phase (Cu), possibly stabilizing it during the high-temperature reaction [30]. As a carrier for copper, the following have been studied: silicon oxide (SiO2) [31,32] mesoporous carbon [33], silicon carbide (SiC) [34], coated with a carbon layer of SiO2 [35], etc.
In our work, synthetic (commercial) silicon oxide (SiO2) and silicon oxide synthesized from rice husk (SiO2 (RH)) were examined as a carrier for copper oxide. Rice husks are a cheap, predominant by-product in the process of grinding uncooked grains of rice in agriculture [36]. Usually, it is burned or thrown away, which leads not only to the depletion of resources but also to environmental pollution. RH has great potential to develop various ceramic materials such as refractories, glass, household appliances, oxide, and non-oxide ceramics, silicate airgel, and other composites [37].
The authors [38,39] note that rice husks are used as a binder and additive to concrete in construction, in the production of animal feed and fertilizer, as well as in the production of biofuels. Rice husks are also used to produce silica [40]. In addition, many studies have analyzed the application of RH to wastewater treatment.
Comparative studies have been carried out on the influence of the nature of silicon oxide on the activity and selectivity of copper oxide in the process of obtaining acetaldehyde by non-oxidative dehydrogenation of ethanol. The physicochemical characteristics of the developed catalysts were analyzed by the methods of XRD, SEM, TGA, FTIR, TPR-H2, and TPD-ammonia.

2. Materials and Methods

2.1. Reagents and Materials

Chemicals such as copper nitrate (Cu(NO3)2·6H2O; T4163-68), synthetic silicon oxide (SiO2 carrier), technical ethanol 95%, (Talgar alcohol LLP), Argon (Ar) (IhsanTechnogaz LLP), and Helium (He) (IhsanTechnogaz LLP) were used as starting materials.

2.2. Synthesis of Catalysts

A detailed procedure for obtaining silicon dioxide SiO2 (RH) from rice husks is described in [41]. Catalysts supported on synthetic silicon oxide (3–5 wt.% CuO/SiO2) were prepared by the capillary impregnation of silicon oxide SiO2 according to its moisture capacity with an aqueous solution of copper nitrate salt (Cu(NO3)2·6 H2O, 99%, T4163-68, Minsk, Belarus). Catalysts on silicon oxide from rice husk (3–5 wt.% CuO/SiO2 (RH)) were also prepared by the capillary impregnation of silicon oxide (RH) according to its moisture capacity with an aqueous solution of copper nitrate salt (Cu(NO3)2·6H2O, 99%, T4163-68, Minsk, Belarus). After that, the catalysts were dried at 150 °C for two hours and calcined at 350 °C for three hours in a stream of air at atmospheric pressure.

2.3. Characterization

The carriers and catalysts were characterized by a complex of modern physicochemical methods. The morphology of the samples was studied using a low-vacuum scanning electron microscope complete with energy-dispersive X-ray microanalysis system (JSM-6490 LA, Jeol, Tokyo, Japan). The main electron beam is generated by a heated tungsten filament or field ejection gun and is typically accelerated by applying a voltage of 1–30 kV. The presence of electromagnetic lenses leads to the focusing of the beam on the sample to a spot size in the nanometer range. The study of the surface morphology of the obtained samples was carried out by analyzing the data of the secondary electron detector.
The phase composition and crystal structure of the obtained samples were studied with an X-ray diffractometer (XRD, X′ Pert Pro MPD, Malvern Panalytical, Almelo, Netherlands) with Cu-Kα radiation (α = 0.154 nm).
The reducibility of the prepared catalyst was studied using the method of temperature-programmed hydrogen reduction (TPR-H2) on a chemisorption analyzer (UNISIT, USGA-101, Moscow, Russia). The setup consists of a gas treatment system, a tube furnace flow reactor (internal diameter 4 mm), and a thermal conductivity detector. The samples (0.063 g) were firstly pretreated by Ar at 400 °C for 40 min, then cooled down to room temperature, and followed by turning the flow of 5 vol.% H2 and 95 vol.% Ar into the system with a flow rate of 30 mL/min. The samples were heated from room temperature to 950 °C at a rate of 10 °C/min. The change in the hydrogen concentration was monitored using a thermal conductivity detector.
The temperature-programmed desorption of ammonia (TPD-NH3) was carried out on the a chemisorption analyzer (UNISIT, USGA-101, Moscow, Russia). Ammonia (NH3) was used as probe molecules to determine the acidity of catalysts. To carry out the analysis, the sample was previously saturated with the analyzed substance, the weakly bound molecules were blown off, then linear heating was started in the inert gas current. At a certain temperature, which depends on the force of the interaction between the probe molecule and the active center, the substance is desorbed from the composite material. To carry out TPD-ammonia, the sample (0.06 g) was first treated (pretreatment), i.e., heated at a temperature of 500 °C, holding for 40 min in a helium flow (25 mL/min), cooling to a temperature of 60 °C, saturation with ammonia at this temperature for 15 min, then blowing weakly bound ammonia in a helium flow at 100 °C and cooling to 60 °C. In the second stage, the temperature was raised from 5 °C/min to 800 °C in the helium of 30 mL/min. Then, a trap was used in case of water release from the sample; further, there was cooling in the furnace up to 100 °C.
Thermogravimetric analysis and differential thermal analysis (TGA and TG-DTA) was carried out on a simultaneous thermal analyzer (NETZSCH STA 409 PC/PG, 6000 device, Perkin Elmer, Inc., Waltham, MA, USA) in a nitrogen atmosphere. The temperature range of the study ranged from 50 to 950 °C with a heating rate of 10 °C/min−1.
The FTIR spectrometer (Bruker Optik GmbH, VERTEX 70, Ettlingen, Germany) was used to explore functional groups of molecules and compounds. The FTIR spectra were recorded using a VERTEX 70 equipped with a PIKE MIRacle ATR single-disturbed internal total reflection prefix with a germanium crystal in the range of 4000–500 cm−1. The results were processed according to the OPUS 7.2.139.1294 program.

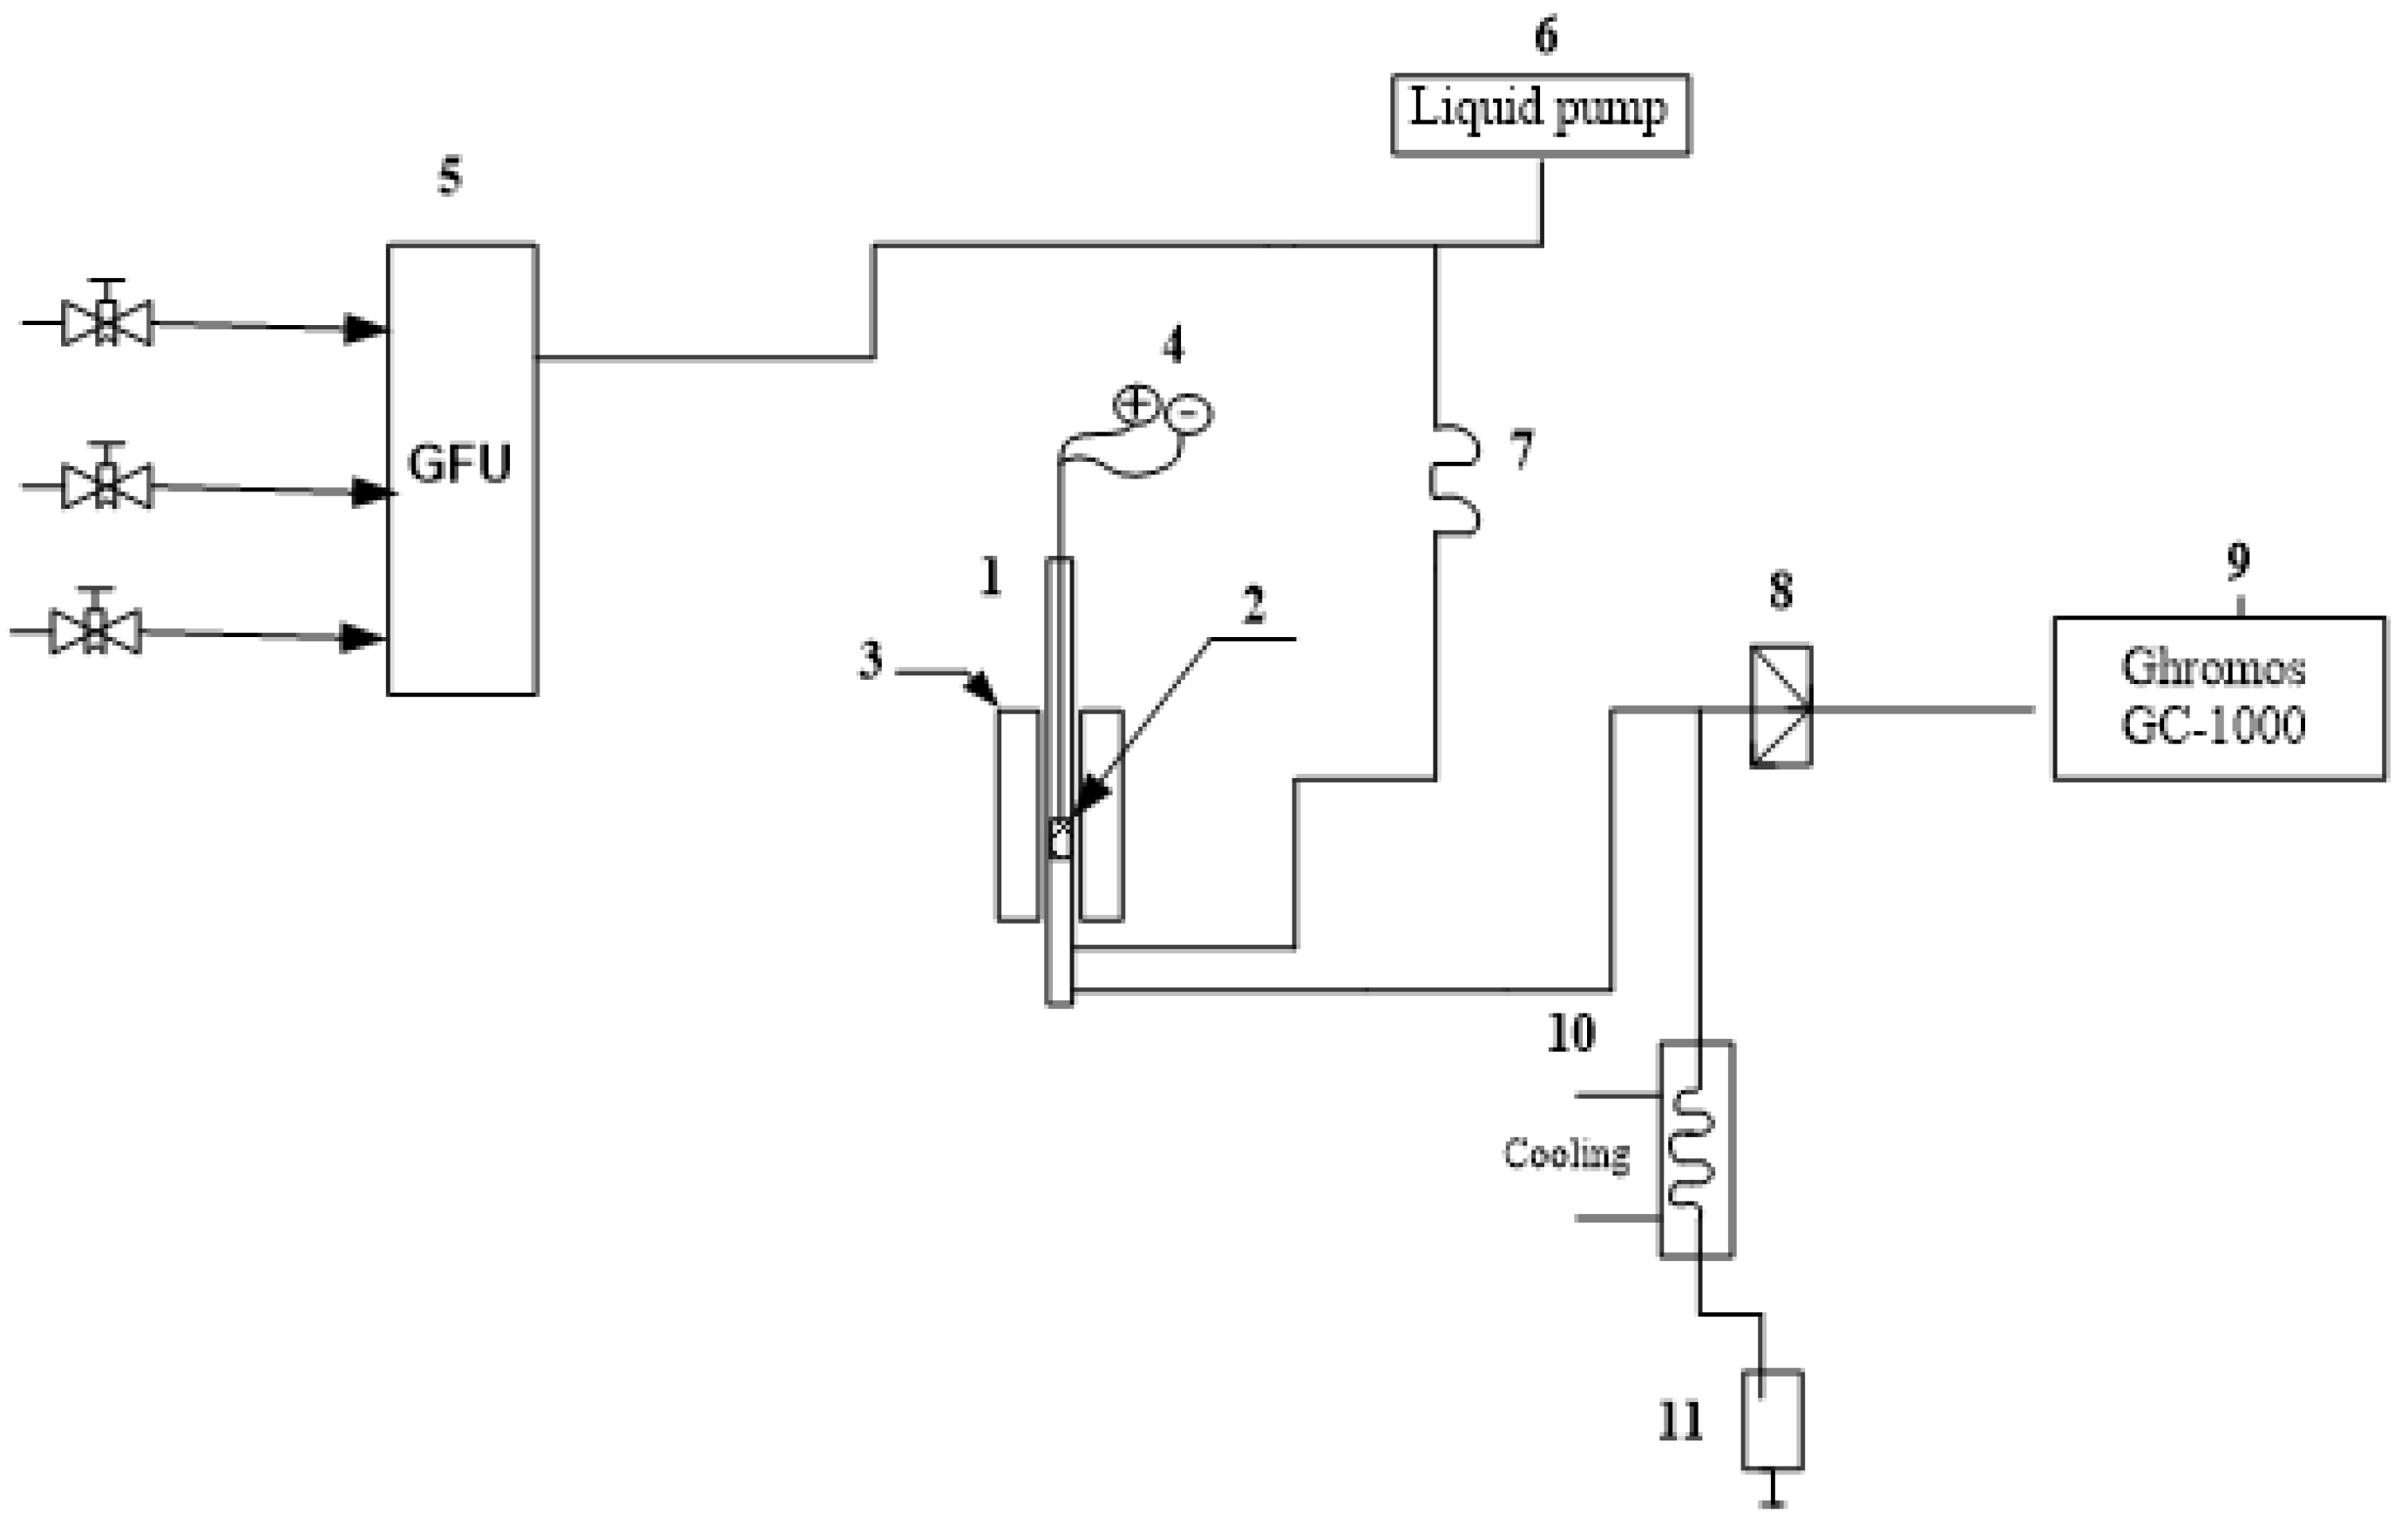
2.4. Testing of Catalysts in Ethanol Conversion

Tests of the activity of carriers and catalysts in the non-oxidative dehydrogenation of ethanol were carried out on an automated flow-through catalytic setup. The installation includes a gas flow regulator, a liquid pump, a reactor, an evaporator, a switch, and a separator (Figure 1).
The stainless steel reactor was located vertically. The flow from the evaporator was fed upwards and passed through the container and the reactor pipe (length 335 mm, diameter 12.5 mm) containing the catalyst. Gases from the reactor’s outlet entered the separator, where part of the flow was channeled through the metering valve and the heated line into the chromatograph for analysis. Catalytic tests were carried out with a space velocity (WHSV) in the range of 0.5–1.5 h−1 and a temperature range of 150–400 °C. The ethanol flow rate was 0.02 mL/min and the experiments were carried out without inert gas. Ethanol conversion and product selectivity were calculated according to the equations:
Ethanol   conversion   ( mol . % ) = [ Ethanol ] inlet [ Ethanol ] outlet [ Ethanol ] inlet × 100 %
Acetaldehyde   selectivity   ( mol . % ) = [ Acetaldehyde ] outlet [ Ethanol ] inlet [ Ethanol ] outlet × 100 %

2.5. Analysis of Reaction Products

The reaction products were identified on “CHROMOS GC-1000” using absolute calibration and thermal conductivity detectors. The reaction products H2, N2, and O2 were determined using a column with a sorbent CaA, column length l = 2 m, column diameter d = 3 mm, and T = 350 °C. To determine CO, CO2, and CH4 used a column with the HP/Plot Q speed of the carrier gas (H2)—20 mL/min, temperature column—T = 250 °C. For the determination of ethanol, acetaldehyde, dietoxyethane, etc., a capillary column with an XSEP sorbent was used. The length of the column is 25 m, and the diameter of the column is d = 0.32 mm. The maximum operating temperature is 250 °C.

3. Results

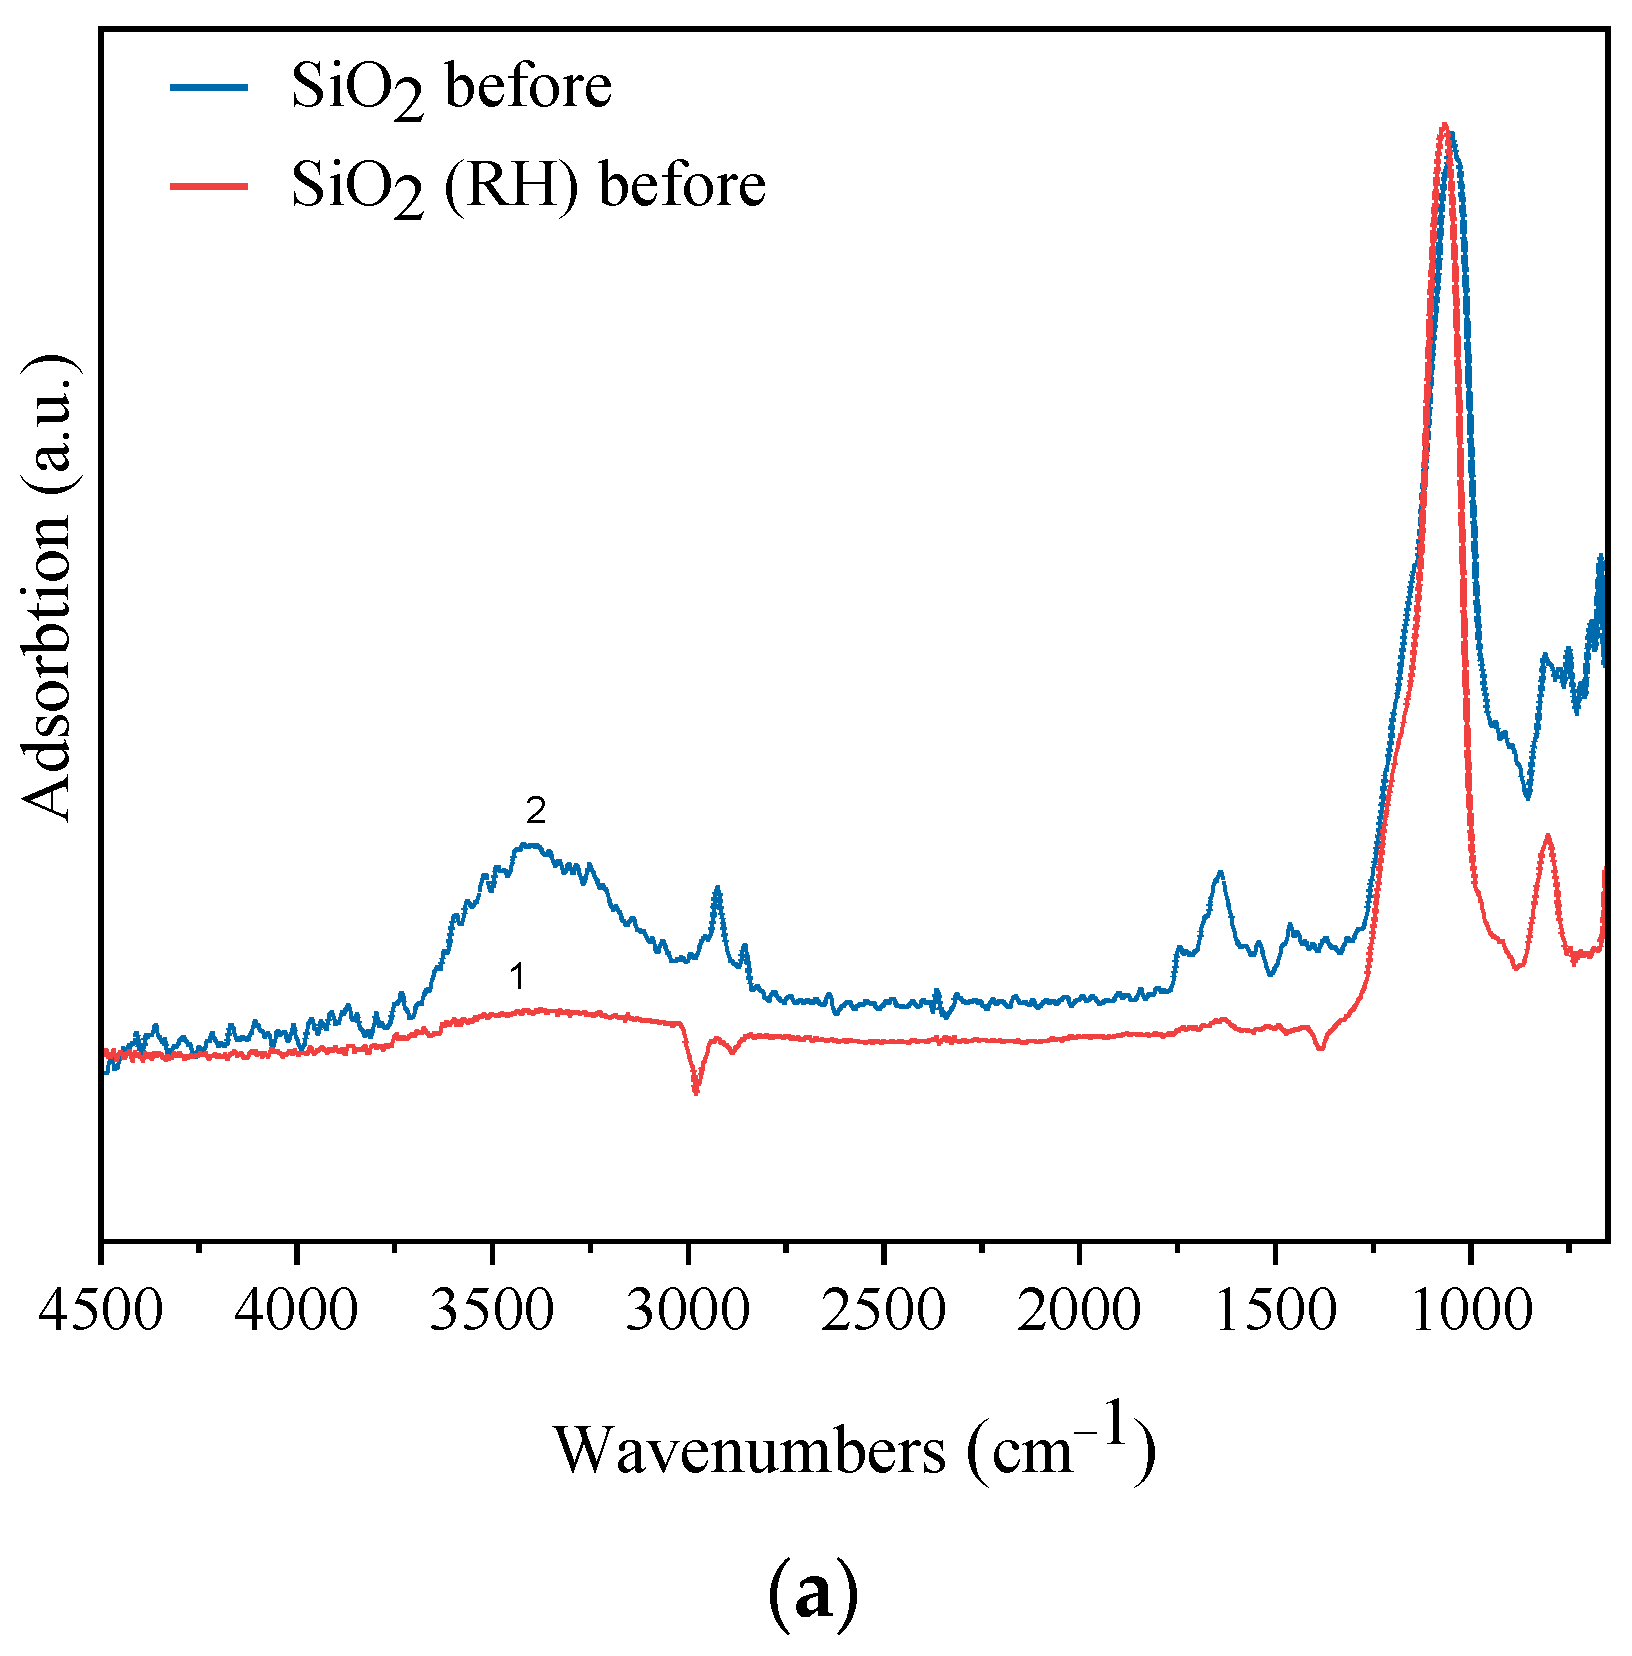
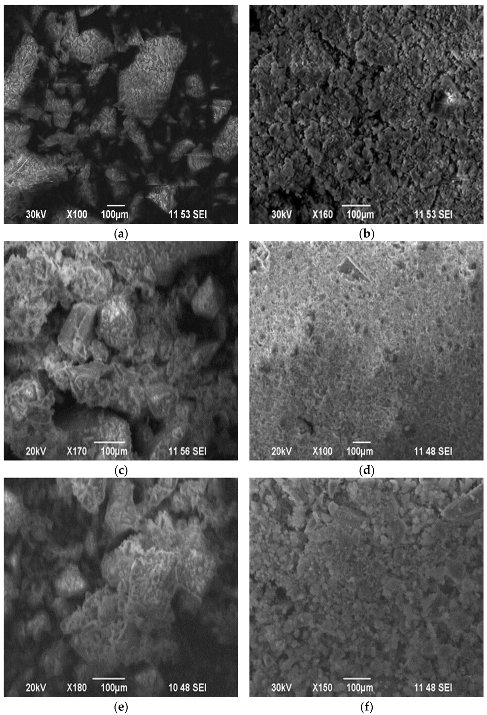
3.1. Characterization

The structures of SiO2 and SiO2 (RH) molecules were studied by FTIR spectroscopy. Figure 2a shows the FTIR spectra for fresh SiO2 and SiO2 (RH) samples in the range of 750–4500 cm−1. In the spectrum of SiO2, absorption bands are observed at 794 cm−1, 1049 cm−1, and in the intervals, 2700–3620 cm−1 and 1500–1790 cm−1. Absorption bands at 794 cm−1 and 1049 cm−1 are typical for silicon oxide; the absorption bands are associated with the vibration of the Si–O bond and the asymmetric valence vibration of the siloxane bonds (Si-O-Si), respectively. The broad absorption band in the range of 2700–3620 cm−1 refers to the valency vibrations of the water molecule. Absorption bands were in the range of 1500–1790 cm−1 to deformation vibrations of the water molecule [42]. The absorption bands 795 and 1049 cm−1, characteristic of silicon oxide, are also observed on the SiO2 (RH) sample, indicating the presence of a Si–O and Si–O–Si bond [43]. The SiO2 (RH) sample also exhibits absorption bands characteristic of silicon oxide at 795 and 1049 cm−1, indicating the presence of Si–O and Si–O–Si bonds [43]. The FTIR spectrum SiO2 (RH) does not have an absorption band of the valence and deformation molecules of the water, which may indicate the hydrophobicity of SiO2 (RH) compared to SiO2.
Figure 2b shows the FTIR spectra of SiO2 and SiO2 (RH) after testing them in the non-oxidative dehydrogenation of ethanol. It is seen from the figure that SiO2 (RH) retains the absorption bands characteristic of the Si–O and Si–O–Si bonds, and a new absorption band appears at 900 cm−1, which can be attributed to the Si–O–C bond [44]. In addition, a broad peak appears in the region of 3200–3700 cm−1, which is associated with the O–H valence vibration of the alcohol bond.
After testing SiO2 in the non-oxidative dehydrogenation of ethanol, the bonds characteristic of silicon oxide are not observed on the FTIR spectrum, which may indicate the destruction of the structure of silicon oxide under the influence of temperature, as well as ethanol and its decomposition products.
Morphological properties of carriers and catalysts were studied by scanning electron microscopy. Micrographs of carriers and catalysts are shown in Figure 3. Figure 3a,b shows that synthetic SiO2 and silicon oxide obtained from rice husks differ greatly in morphology.
The morphology of SiO2 (RH) is more dispersed compared to SiO2. The SiO2 sample consists of aggregates of different shapes and sizes. The support of 3 wt.% copper oxide to the carrier leads to an increase in the dispersion of particles, compared with 5 wt.% CuO, as in the case of SiO2 (RH) and SiO2. On the surface of 3 wt.% CuO/SiO2 (RH), more amorphous copper oxide particles are observed (Figure 3c), which are distributed more evenly, compared with 5 wt.% CuO/SiO2 (RH).
Consequently, an increase in the content of copper oxide on a CuO/SiO2 (RH) sample (up to 5 wt.%) leads to poor dispersion due to volume agglomeration of CuO [45]. Figure 4 shows X-ray diffraction patterns of the fresh catalysts and carriers. The SiO2 (RH) and SiO2 carriers have a wide peak at 2θ = 22, which refers to the silicon oxide phase [46,47,48]. The X-ray diffraction patterns of 3 wt.% CuO/SiO2 (RH) and 5 wt.% CuO/SiO2 (RH) catalysts showed diffraction peaks, indicating the formation of relatively small crystalline CuO particles (2θ = 35, 38) [49,50]. For samples of 3 wt.% CuO/SiO2 and 5 wt.% CuO/SiO2, there were no clear peaks of copper oxide, despite the fact that copper catalysts based on SiO2 and SiO2 (RH) were prepared by the capillary impregnation of the carrier according to its moisture capacity. Probably, detected by us with the FTIR method, the high hydrophilicity of SiO2 compared with SiO2 (RH) affected the distribution of copper oxide over the entire volume of the SiO2 carrier. Therefore, the XRD profiles of 3 wt.% CuO/SiO2 and 5 wt.% CuO/SiO2 were not found to have clear peaks related to copper oxide [51]. Due to the hydrophobicity of SiO2 (RH), copper oxide concentrated on the surface of the carrier in the form of «crust» [52,53], therefore on the XRD profiles of 3 wt.% CuO/SiO2 (RH) and 5 wt.% CuO/SiO2 (RH), catalysts show diffraction peaks of CuO particles (2θ = 35, 38). The different hydrophilicity and hydrophobicity of SiO2 (RH) and SiO2 silicon oxides led to different distributions of copper oxide on these carriers.
Thermogravimetric analysis and differential thermal analysis (TGA and TG-DTA) of SiO2 (RH) and SiO2 are shown in Figure 5a. Temperature heating for silicon oxides and catalysts ranges from room temperature to 800 °C at 10 °C/min. The weight loss of SiO2 (RH) at a peak temperature of 69.7 °C is 5.2%, which is due to physically adsorbed water and CO2. The SiO2 sample also has a gradual mass loss at a peak temperature of 96.3 °C, which is 8.5%. These data may be indicative of the hydrophobicity of SiO2 (RH) and the hydrophilicity of SiO2 relative to each other [54].
For catalysts on synthetic media of 3 wt.% CuO/SiO2 and 5 wt.% CuO/SiO2, the mass loss line has the same character; the mass loss up to 200 °C is 6.6 and 6.7%, respectively. The weight loss of samples 3 wt.% CuO/SiO2 (RH) and 5 wt.% CuO/SiO2 (RH) are 3.4 and 5.6%, respectively. The temperature peaks of the weight loss of the samples are in the range of 60–105 °C; this interval is associated with the loss of physically adsorbed water and CO2.
The reduction characteristics of the samples were investigated by the TPR-H2 method. Figure 6 and Figure 7 show the TPR-H2 curves for all samples. The TPR profiles of SiO2 and SiO2 (RH) did not show a clear H2 absorption signal. On the TPR profile of the catalyst (Figure 6) 3 wt.% CuO/SiO2, two peaks are observed with maxima T1max = 314 °C and T2max = 475 °C, the amount of adsorbed hydrogen is A1 = 130 μmol/g and A2 = 22 μmol/g. It is known [45] that pure copper oxide not supported on the carrier is reduced at a temperature of 250–260 °C. However, depending on the nature of the carrier and the state of the supported copper oxide, the catalyst reduction temperature can be shifted both to the high-temperature and to the low-temperature region. For a catalyst of 5 wt.% CuO/SiO2, two peaks are observed on the TPR-H2 curves with maxima of hydrogen absorption temperatures T1max = 255 °C, A1 = 269 μmol/g, T2max = 344 °C, and A2 = 152 μmol/g [55]. The existence of two peaks in the TPR profile of 5 wt.% CuO/SiO2 is associated with the reduction in copper oxide with different dispersity. The first peak can be attributed to the reduction in a highly dispersed CuO nanocluster; the second peak refers to the reduction in crystalline CuO. Similar data were obtained in [56,57].
The TPR profile (Figure 7) of a 3 wt.% CuO/SiO2 (RH) sample presents two peaks of different intensity at T1max = 263 °C, A1 = 198 µmol/g and T2max = 433 °C, A2 = 75 µmol/g. The support of 3 wt.% of copper oxide on a SiO2 (RH) carrier leads to an increase in intensity, and also a decrease in the reduction temperature of the peak related to dispersed copper oxide from 314 to 263 °C and the peak related to the reduction in crystalline CuO from 475 to 433 °C. Increasing the copper oxide content to 5 wt.% leads to a change in the TPR profile of the catalyst. On the TPR profile of the sample 5 wt.% CuO/SiO2 (RH) is present an intense peak of T1max = 283 °C, A1 = 863 μmol/g. With an increase in the content of copper oxide from 3 to 5 wt.%, the T1max increases from 263 to 283 °C, which is associated with the consolidation of copper oxide particles. It is known [58] that a decrease in the reduction temperature of copper oxide indicates an increase in the dispersion of its particles.
The acid characteristics of the samples were studied by the TPD-ammonia method (Figure 8 and Figure 9, Table 1). According to the literature [12,59], the ammonia desorption peak at low temperatures (100–200 °C) refers to weak acid sites, the desorption peak at moderate temperatures (200–400 °C) corresponds to medium acid sites, and the desorption peak at high temperatures (>400 °C) corresponds to strong acid sites. It follows from the analysis of the obtained profiles of the samples (SiO2 (RH), 3 wt.% CuO/SiO2 (RH), 5 wt.% CuO/SiO2 (RH)) (Figure 8) that SiO2 (RH) has several weak intensity peaks. Peaks with maxima T1max = 105 °C and T2max = 168 °C in the range of 100–170 °C are associated with the presence of weak acid sites. The peak with a maximum at T3max = 348 °C refers to acid sites with medium strength. The presence of peaks above 400 °C, with maxima at 438, 672, and 734 °C, refers to strong acid centers. A quantitative comparison of the desorbed ammonia shows that medium acid sites prevailed in the composition of SiO2 (RH). The support of copper oxide to the SiO2 (RH) carrier leads to an increase in the concentration of weak and medium acid sites. At the same time, the number of weak acid sites is significantly higher by 5 wt.% CuO/SiO2 (RH) compared to 3 wt.% CuO/SiO2 (RH).
On the TPD profile of samples of SiO2, 3 wt.% CuO/SiO2, and 5 wt.% CuO/SiO2, intense peaks are observed in the region of 100–450 °C and weak intensity peaks in the region of 500–750 °C. Two peaks with maxima at 214 °C and 632 °C are observed on synthetic SiO2, which confirms the presence of weak and strong acid sites. With the support of copper oxide on silicon oxide and with an increase in the content of copper oxide, the total acidity of the samples increases both in the case of catalysts on SiO2 and on SiO2 (RH) (Table 1).
It follows from the results of TPD-ammonia (Table 1) that synthetic silicon oxide and catalysts based on it have weak and strong acid sites. The total acidity of the samples increases from 482 to 968 μmol/g with the support of copper oxide on the carrier and an increase in its concentration on the carrier. In contrast to synthetic silicon oxide and catalysts based on it, the carrier obtained from rice husks and the catalysts supported on it have additionally medium acid sites. As can be seen from Table 1, the highest concentration of average acid sites of 34 μmol/g is observed on a sample of 3 wt.% CuO/SiO2 (RH). The total acidity of the samples increases from 78 to 161 μmol/g also with the support of copper oxide to the carrier and an increase in its concentration.

3.2. Catalytic Performance for Non-Oxidation of Ethanol

SiO2 (RH), SiO2 carriers, and the synthesized catalysts 3–5 wt.% CuO/SiO2 (RH), 3–5 wt.% CuO/SiO2 were studied in the non-oxidative dehydrogenation of ethanol to acetaldehyde in the range of 150–400 °C with a volume rate of ethanol (WHSV) in the range of 0.5–1.5 h−1. The results of comparative tests showed that among the copper-containing catalysts, the most efficient and selective in relation to acetaldehyde is the 3 wt.% CuO/SiO2 (RH) catalyst. On this catalyst, the highest selectivity for acetaldehyde is 47% at 350 °C and an ethanol volumetric flow rate (WHSV) of 0.5 h−1. A further increase in the reaction temperature to 400 °C leads to a decrease in the selectivity for acetaldehyde by 39% due to an increase in the concentration of ethanol decomposition products (CO, CO2, CH4, H2) in the reaction products (Scheme 1).
Among the carriers, SiO2 (RH) is effective, and the selectivity for acetaldehyde is 28%. For further discussion of the results obtained, we selected 3–5 wt.% CuO/SiO2 and 3–5 wt.% CuO/ SiO2 (RH).
The comparative results obtained at the most effective reaction temperature of 350 °C and an ethanol flow rate of 0.5 h−1 are shown in Table 2.
The non-oxidative dehydrogenation of ethanol on SiO2 and SiO2 (RH) carriers leads to the formation of ethylene, acetaldehyde, and gas products such as methane, carbon oxides, and hydrogen, due to the reaction of the dehydration, dehydration, and decomposition of ethanol, respectively [60,61,62] (Scheme 1).
On SiO2 (RH), in addition to the above reactions, ethanol reacts with acetaldehyde to diethoxyethane. Acetaldehyde is further deformed to form butanol [12,63]. The support of copper oxide on the SiO2 and SiO2 (RH) carriers leads to an increase in the selectivity of the dehydrogenation reaction to acetaldehyde and hydrogen, which indicates that copper oxide is an active site for ethanol dehydrogenation. The activity of the samples in ethanol conversion increases symbatically with an increase in the total acidity of the samples. The activity and selectivity of the 3 wt.% CuO/SiO2 (RH) catalyst in the non-oxidative dehydrogenation of ethanol to acetaldehyde is higher than that of 3 wt.% CuO/SiO2, which may be associated with an increase in the dispersion of active sites and the existence of medium acid sites; the data are consistent with the results of SEM, TPR-H2, and TPD-NH3. Ethanol conversion and acetaldehyde selectivity increase with rising copper oxide content on the carrier, regardless of the nature of the support. According to the literature [15,16], when ethanol is dehydrogenated, an equimolar amount of acetaldehyde and hydrogen is formed. However, in our case, the number of acetaldehyde formed is less than the amount of hydrogen. It has to do with the fact that gas reaction products such as methane and carbon oxides are formed not only as a result of the decomposition of ethanol but also from acetaldehyde. In the case of SiO2 (RH) and 3 wt.% CuO/SiO2 (RH), acetaldehyde is deformed before diethoxyethane and butanol.
The highest selectivity for acetaldehyde is observed on a catalyst of 3 wt.% CuO/SiO2 (RH), which has the largest number of medium acid sites. On the catalyst 3 wt.% CuO/SiO2 (RH), the selectivity for acetaldehyde is 47%, which is relatively higher compared to the known catalysts Cu/ZrO2 (SAA = 21%) [27], Cu/Al2O3 (SAA = 32%) [25], Cu/C (SAA = 15%) [64], and Ni/SiO2 (SAA = 1.7%) [65].
According to [12], medium acid sites relate to ammonia adsorbed on strongly acid Lewis sites. Therefore, the existence of strongly acidic Lewis sites has a positive effect on the selectivity of the catalyst for acetaldehyde.

4. Conclusions

In this work, efficient low-percentage catalysts based on copper oxide were established using silicon dioxide SiO2 (RH) as a carrier, synthesized from a renewable raw material—rice husk—to produce acetaldehyde. The synthesized catalysts were first studied in the non-oxidative dehydrogenation of ethanol. According to FTIR and XRD data, the hydrophilicity and hydrophobicity of silicon oxide play a major role in the preparation of catalysts. SiO2 (RH) is more hydrophobic compared to SiO2, which allowed copper oxide to concentrate on its surface in the form of a “crust”, which is very important in the synthesis of low-percentage catalysts. Due to this, the active sites are more available for interaction with the molecules of the reactants. According to SEM, XRD, and TPR-H2, the use of SiO2 (RH) as a carrier leads to an increase in the dispersion of copper oxide particles, which is an active site for ethanol dehydrogenation. The results of TPD-ammonia showed that the support of copper oxide on the SiO2 and SiO2 (RH) carriers lead to an increase in the total acidity of the samples. Compared to SiO2 and 3 wt.% CuO/SiO2, SiO2 (RH), and 3 wt.% CuO/SiO2 (RH) have medium acid sites in addition to weak and strong acid sites. It can be assumed that the activity of low-percentage copper-containing catalysts in the non-oxidative dehydrogenation of ethanol symbatically increases with the rise in the total acidity of the samples, while the selectivity for acetaldehyde depends on the presence of medium acid sites. The highest acetaldehyde selectivity of 47% is observed on the 3 wt.% CuO/SiO2 (RH) catalyst, which has the highest number of medium acid sites.
It follows from the results of the FTIR analysis that silicon oxide obtained from rice husks is stable to the effects of the reaction medium, that is, it does not change its structure compared to synthetic silicon oxide. The obtained results show that copper catalysts supported by silicon oxide from rice husks have good characteristics for the non-oxidative dehydrogenation of ethanol into valuable products.

Author Contributions

Conceptualization, G.Y. and K.D.; methodology, S.A., M.A. and K.A.; software, K.B. and B.B.; validation, K.D., G.Y. and M.M.; formal analysis, M.A. and K.A.; investigation, G.Y., M.M., S.A. and K.A.; resources, M.A., B.B. and S.A.; data curation, K.D.; writing—original draft preparation, G.Y., M.M. and K.A.; writing—review and editing, G.Y., M.M. and K.D.; visualization, S.A. and K.B.; supervision, K.D. and G.Y.; project administration, G.Y. All authors have read and agreed to the published version of the manuscript.

Funding

The work was carried out within the framework of the project of the Ministry of Education and Science of the Republic of Kazakhstan «Scientific aspects of the creation of composite materials with specified catalytic properties for the synthesis of acetaldehyde from renewable raw materials—bioethanol» (Grant No. AP08855936).

Institutional Review Board Statement

Not applicable.

Informed Consent Statement

Not applicable.

Data Availability Statement

Not applicable.

Conflicts of Interest

The authors declare no conflict of interest.

References

  1. Caro, C.; Thirunavukkarasu, K.; Anilkumar, M.; Shiju, N.R.; Rothenberg, G. Selective Autooxidation of Ethanol over Titania-Supported Molybdenum Oxide Catalysts: Structure and Reactivity. Adv. Synth. Catal. 2012, 354, 1327–1336. [Google Scholar] [CrossRef]
  2. Zhang, H.; Tan, H.R.; Jaenicke, S.; Chuah, G.K. Highly efficient and robust Cu catalyst for non-oxidative dehydrogenation of ethanol to acetaldehyde and hydrogen. J. Catal. 2020, 389, 19–28. [Google Scholar] [CrossRef]
  3. Takei, T.; Iguchi, N.; Haruta, M. Synthesis of Acetoaldehyde, Acetic Acid, and Others by the Dehydrogenation and Oxidation of Ethanol. Catal. Surv. Asia 2011, 15, 80–88. [Google Scholar] [CrossRef]
  4. Xu, J.; Xu, X.C.; Yang, X.J.; Han, Y.F. Silver/hydroxyapatite foam as a highly selective catalyst for acetaldehyde production via ethanol oxidation. Catal. Today 2016, 276, 19–27. [Google Scholar] [CrossRef]
  5. Tang, C.; Zhai, Z.; Li, X.; Sun, L.; Bai, W. Sustainable production of acetaldehyde from lactic acid over the magnesium aluminate spinel. J. Taiwan Inst. Chem. Eng. 2016, 58, 97–106. [Google Scholar] [CrossRef]
  6. Liu, P.; Hensen, E.J.M. Highly Efficient and Robust Au/MgCuCr2O4 Catalyst for Gas-Phase Oxidation of Ethanol to Acetaldehyde. J. Am. Chem. Soc. 2013, 135, 14032–14035. [Google Scholar] [CrossRef]
  7. Santacesaria, E.; Carotenuto, G.; Tesser, R.; Di Serio, M. Ethanol Dehydrogenation to Ethyl Acetate by Using Copper and Copper Chromite Catalysts. Chem. Eng. J. 2012, 179, 209–220. [Google Scholar] [CrossRef]
  8. Dossumov, K.; Yergazieva, G.Y.; Churina, D.H.; Tayrabekova, S.Z.; Tulebayev, E.M. Effect of the Method of Preparation of a Supported Cerium Oxide Catalyst on Its Activity in the Conversion of Ethanol to Ethylene. Theor. Exp. Chem. 2016, 52, 123–126. [Google Scholar] [CrossRef]
  9. Dosumov, K.; Ergazieva, G.E.; Churina, D.K.; Tel’baeva, M.M. Cerium-Containing Catalysts for Converting Ethanol into Ethylene. Russ. J. Phys. Chem. A 2014, 88, 1806–1808. [Google Scholar] [CrossRef]
  10. Galbe, M.; Zacchi, G. A Review of the Production of Ethanol from Softwood. Appl. Microbiol. Biotechnol. 2002, 59, 618–628. [Google Scholar] [CrossRef]
  11. Sun, Y.; Cheng, J. Hydrolysis of Lignocellulosic Materials for Ethanol Production: A Review. Bioresour. Technol. 2002, 83, 1–11. [Google Scholar] [CrossRef]
  12. Yergaziyeva, G.Y.; Dossumov, K.; Mambetova, M.M.; Strizhak, P.Y.; Kurokawa, H.; Baizhomartov, B. Effect of Ni, La, and Ce Oxides on a Cu/Al2O3 Catalyst with Low Copper Loading for Ethanol Non-oxidative Dehydrogenation. Chem. Eng. Technol. 2021, 44, 1890–1899. [Google Scholar] [CrossRef]
  13. Pinthong, P.; Praserthdam, P.; Jongsomjit, B. Oxidative Dehydrogenation of Ethanol over Vanadium- and Molybdenum-Modified Mg-Al Mixed Oxide Derived from Hydrotalcite. J. Oleo Sci. 2019, 68, 679–687. [Google Scholar] [CrossRef] [PubMed]
  14. Sushkevich, V.L.; Ivanova, I.I.; Taarning, E. Mechanistic Study of Ethanol Dehydrogenation over Silica-Supported Silver. ChemCatChem 2013, 5, 2367–2373. [Google Scholar] [CrossRef]
  15. Amandusson, H.; Ekedahl, L.-G.; Dannetun, H. Isotopic Study of Ethanol Dehydrogenation over a Palladium Membrane. J. Catal. 2000, 195, 376–382. [Google Scholar] [CrossRef]
  16. Liang, Y.Q.; Cui, Z.D.; Zhu, S.L.; Liu, Y.; Yang, X.J. Silver Nanoparticles Supported on TiO2 Nanotubes as Active Catalysts for Ethanol Oxidation. J. Catal. 2011, 278, 276–287. [Google Scholar] [CrossRef]
  17. Yu, D.; Dai, W.; Wu, G.; Guan, N.; Li, L. Stabilizing copper species using zeolite for ethanol catalytic dehydrogenation to acetaldehyde. Chin. J. Catal. 2019, 9, 1375–1384. [Google Scholar] [CrossRef]
  18. Tonner, S.P.; Trimm, D.L.; Wainwright, M.S.; Cant, N.W. Dehydrogenation of Methanol to Methyl Formate over Copper Catalysts. Ind. Eng. Chem. Prod. Res. Dev. 1984, 23, 384–388. [Google Scholar] [CrossRef]
  19. Guan, Y.; Hensen, E.J.M. Ethanol Dehydrogenation by Gold Catalysts: The Effect of the Gold Particle Size and the Presence of Oxygen. Appl. Catal. Gen. 2009, 361, 49–56. [Google Scholar] [CrossRef]
  20. Sitthisa, S.; Resasco, D.E. Hydrodeoxygenation of Furfural Over Supported Metal Catalysts: A Comparative Study of Cu, Pd and Ni. Catal. Lett. 2011, 141, 784–791. [Google Scholar] [CrossRef]
  21. Tu, Y.J.; Chen, Y.-W. Effects of Alkaline-Earth Oxide Additives on Silica-Supported Copper Catalysts in Ethanol Dehydrogenation. Ind. Eng. Chem. Res. 1998, 37, 2618–2622. [Google Scholar] [CrossRef]
  22. Tu, Y.J.; Chen, Y.-W. Effects of Alkali Metal Oxide Additives on Cu/SiO2 Catalyst in the Dehydrogenation of Ethanol. Ind. Eng. Chem. Res. 2001, 40, 5889–5893. [Google Scholar] [CrossRef]
  23. Wang, C.; Garbarino, G.; Allard, L.F.; Wilson, F.; Busca, G.; Flytzani-Stephanopoulos, M. Low-Temperature Dehydrogenation of Ethanol on Atomically Dispersed Gold Supported on ZnZrOx. ACS Catal. 2016, 6, 210–218. [Google Scholar] [CrossRef]
  24. Shan, J.; Janvelyan, N.; Li, H.; Liu, J.; Egle, T.M.; Ye, J.; Biener, M.M.; Biener, J.; Friend, C.M.; Flytzani-Stephanopoulos, M. Selective Non-Oxidative Dehydrogenation of Ethanol to Acetaldehyde and Hydrogen on Highly Dilute NiCu Alloys. Appl. Catal. B Environ. 2017, 205, 541–550. [Google Scholar] [CrossRef]
  25. Tayrabekova, S.; Mäki-Arvela, P.; Peurla, M.; Paturi, P.; Eränen, K.; Ergazieva, G.E.; Aho, A.; Murzin, D.Y.; Dossumov, K. Catalytic Dehydrogenation of Ethanol into Acetaldehyde and Isobutanol Using Mono- and Multicomponent Copper Catalysts. C. R. Chim. 2018, 21, 194–209. [Google Scholar] [CrossRef]
  26. Witzke, M.E.; Dietrich, J.P.; Ibrahim, M.Y.S.; Al-Bardan, K.; Triezenberg, M.D.; Flaherty, D.W. Spectroscopic evidence for origins of size and support effects on selectivity of Cu nanoparticle dehydrogenation catalysts. Chem. Commun. 2017, 53, 597–600. [Google Scholar] [CrossRef]
  27. Freitas, I.C.; Damyanova, S.; Oliveira, D.C.; Marques, C.M.P.; Bueno, J.M.C. Effect of Cu Content on the Surface and Catalytic Properties of Cu/ZrO2 Catalyst for Ethanol Dehydrogenation. J. Mol. Catal. Chem. 2014, 381, 26–37. [Google Scholar] [CrossRef]
  28. Cassinelli, W.H.; Martins, L.; Passos, A.R.; Pulcinelli, S.H.; Rochet, A.; Briois, V.; Santilli, C.V. Correlation between Structural and Catalytic Properties of Copper Supported on Porous Alumina for the Ethanol Dehydrogenation Reaction. ChemCatChem 2015, 7, 1668–1677. [Google Scholar] [CrossRef]
  29. Cassinelli, W.H.; Martins, L.; Magnani, M.; Pulcinelli, S.H.; Briois, V.; Santilli, C.V. Time-Resolved XAS/MS/Raman Monitoring of Mutual Copper Self-Reduction and Ethanol Dehydrogenation Reactions. RSC Adv. 2016, 6, 20453–20457. [Google Scholar] [CrossRef]
  30. Rossetti, I.; Biffi, C.; Bianchi, C.L.; Nichele, V.; Signoretto, M.; Menegazzo, F.; Finocchio, E.; Ramis, G.; Di Michele, A. Ni/SiO2 and Ni/ZrO2 Catalysts for the Steam Reforming of Ethanol. Appl. Catal. B Environ. 2012, 117–118, 384–396. [Google Scholar] [CrossRef]
  31. Ohira, M.; Liu, H.; He, D.; Hirata, Y.; Sano, M.; Suzuki, T.; Miyake, T. Catalytic Performance and Reaction Pathways of Cu/SiO2 and ZnO/SiO2 for Dehydrogenation of Ethanol to Acetaldehyde. J. Jpn. Pet. Inst. 2018, 61, 205–212. [Google Scholar] [CrossRef]
  32. He, X.; Liu, H. Efficient Synthesis of 1,1-Diethoxyethane via Sequential Ethanol Reactions on Silica-Supported Copper and H-Y Zeolite Catalysts. Catal. Today 2014, 233, 133–139. [Google Scholar] [CrossRef]
  33. Wang, Q.-N.; Shi, L.; Lu, A.-H. Highly Selective Copper Catalyst Supported on Mesoporous Carbon for the Dehydrogenation of Ethanol to Acetaldehyde. ChemCatChem 2015, 7, 2846–2852. [Google Scholar] [CrossRef]
  34. Li, M.; Lu, W.; He, L.; Schüth, F.; Lu, A. Tailoring the Surface Structure of Silicon Carbide Support for Copper Catalyzed Ethanol Dehydrogenation. ChemCatChem 2019, 11, 481–487. [Google Scholar] [CrossRef]
  35. Wang, Q.N.; Shi, L.; Li, W.; Li, W.C.; Si, R.; Schüth, F.; Lu, A.H. Cu supported on thin carbon layer-coated porous SiO2 for efficient ethanol dehydrogenation. Catal. Sci. Technol. 2018, 8, 472–479. [Google Scholar] [CrossRef]
  36. Shukla, S.S.; Chava, R.; Appari, S.; Bahurudeen, A.; Kuncharam, B.V.R. Sustainable use of rice husk for the cleaner production of value-added products. J. Environ. Chem. Eng. 2022, 10, 106899. [Google Scholar] [CrossRef]
  37. Materazzi, M.; Foscolo, P.U. The role of waste and renewable gas to decarbonize the energy sector. In Substitute Natural Gas from Waste: Technical Assessment and Industrial Applications of Biochemical and Thermochemical Processes; Elsevier: Amsterdam, The Netherlands, 2019; pp. 1–19. [Google Scholar] [CrossRef]
  38. Ang, T.N.; Ngoh, G.C.; Chua, A.S.M.; Lee, M.G. Elucidation of the effect of ionic liquid pretreatment on rice husk via structural analyses. Biotechnol. Biofuels 2012, 5, 67. [Google Scholar] [CrossRef]
  39. Materazzi, M. Gasification of Waste Derived Fuels in Fluidized Beds: Fundamental Aspects and Industrial Challenges. In Clean Energy from Wast; Springer: Cham, Switzerland, 2017; pp. 19–63. [Google Scholar] [CrossRef]
  40. Shah, S.A.; Soomar, M.; Hussain, A. Comparative emission analysis of bituminous coal, Sugarcane Bagasse and Rice Husk. Sind. Univ. Res. J. 2016, 48, 685–688. [Google Scholar]
  41. Azat, S.; Sartova, Z.; Bekseitova, K.; Askaruly, K. Extraction of high-purity silica from rice husk via hydrochloric acid leachingtreatment. Turk. J. Chem. 2019, 43, 1258–1269. [Google Scholar] [CrossRef]
  42. Myachina, M.; Gavrilova, N.; Nazarov, V. Formation of Molybdenum Blue Nanoparticles in the Organic Reducing Area. Molecules 2021, 26, 4438. [Google Scholar] [CrossRef]
  43. Llez, L.T.E.; Rubio, J.; Rubio, F.; Morales, E.; Oteo, J.L. Synthesis of Inorganic-Organic Hybrid Materials from TEOS, TBT and PDMS. J. Mater. Sci. 2003, 38, 1773–1780. [Google Scholar]
  44. Bakdash, R.S.; Aljundi, I.H.; Basheer, C.; Abdulazeez, I. Rice Husk Derived Aminated Silica for the Efficient Adsorption of Different Gases. Sci. Rep. 2020, 10, 19526. [Google Scholar] [CrossRef] [PubMed]
  45. Chang, F.-W.; Yang, H.-C.; Roselin, L.S.; Kuo, W.-Y. Ethanol Dehydrogenation over Copper Catalysts on Rice Husk Ash Prepared by Ion Exchange. Appl. Catal. Gen. 2006, 304, 30–39. [Google Scholar] [CrossRef]
  46. Yalçin, N.; Sevinç, V. Studies on Silica Obtained from Rice Husk. Ceram. Int. 2001, 27, 219–224. [Google Scholar] [CrossRef]
  47. Guerreiro, E.D.; Gorriz, O.F.; Rivarola, J.B.; Arrúa, L.A. Characterization of Cu/SiO2 Catalysts Prepared by Ion Exchange for Methanol Dehydrogenation. Appl. Catal. Gen. 1997, 165, 259–271. [Google Scholar] [CrossRef]
  48. Baltes, C.; Vukojevic, S.; Schuth, F. Correlations between Synthesis, Precursor, and Catalyst Structure and Activity of a Large Set of CuO/ZnO/Al2O3 Catalysts for Methanol Synthesis. J. Catal. 2008, 258, 334–344. [Google Scholar] [CrossRef]
  49. Águila, G.; Gracia, F.; Cortés, J.; Araya, P. Effect of Copper Species and the Presence of Reaction Products on the Activity of Methane Oxidation on Supported CuO Catalysts. Appl. Catal. B Environ. 2008, 77, 325–338. [Google Scholar] [CrossRef]
  50. Hao, X.-Y.; Zhang, Y.-Q.; Wang, J.-W.; Zhou, W.; Zhang, C.; Liu, S. A Novel Approach to Prepare MCM-41 Supported CuO Catalyst with High Metal Loading and Dispersion. Microporous Mesoporous Mater. 2006, 88, 38–47. [Google Scholar] [CrossRef]
  51. Ding, J.; Popa, T.; Tang, J.; Gasema, K.A.M.; Fan, M.; Zhong, Q. Highly selective and stable Cu/SiO2 catalysts prepared with a green method for hydrogenation of diethyl oxalate into ethylene glycol. Appl. Catal. B Environ. 2017, 209, 530. [Google Scholar] [CrossRef]
  52. Dossumov, K.; Ergazieva, G.E.; Ermagambet, B.T.; Telbayeva, M.M.; Mambetova, M.M.; Myltykbayeva, L.K.; Kassenova, Z.M. Role of Ceria in Several Energy-Related Catalytic Transformations. Chem. Pap. 2020, 74, 373–388. [Google Scholar] [CrossRef]
  53. Dossumov, K.; Ergazieva, G.E.; Ermagambet, B.T.; Myltykbaeva, L.K.; Telbaeva, M.M.; Mironenko, A.V.; Mambetova, M.M.; Kassenova, Z. Morphology and Catalytic Properties of Cobalt-Containing Catalysts Synthesized by Different Means. Russ. J. Phys. Chem. A 2020, 94, 880–882. [Google Scholar] [CrossRef]
  54. Cavuoto, D.; Zaccheria, A.; Ravasio, N. Some Critical Insights into the Synthesis and Applications of Hydrophobic Solid Catalysts. J. Catal. 2020, 10, 1337. [Google Scholar] [CrossRef]
  55. Selva Roselin, L.; Chiu, H.-W. Production of hydrogen by oxidative steam reforming of methanol over Cu/SiO2 catalysts. J. Saudi Chem. Soc. 2018, 22, 692. [Google Scholar] [CrossRef]
  56. Xi, X.; Ma, S.; Chen, J.-F.; Zhang, Y. Promotional Effects of Ce, Mn and Fe Oxides on CuO/SiO2 Catalysts for CO Oxidation. J. Environ. Chem. Eng. 2014, 2, 1011–1017. [Google Scholar] [CrossRef]
  57. Liu, Z.; Amiridis, M.D.; Chen, Y. Characterization of CuO Supported on Tetragonal ZrO2 Catalysts for N2 O Decomposition to N2. J. Phys. Chem. B 2005, 109, 1251–1255. [Google Scholar] [CrossRef]
  58. Van Der Grift, C.J.G.; Wielers, A.F.H.; Mulder, A.; Geus, J.W. The reduction behaviour of silica-supported copper catalysts prepared by deposition-precipitation. Thermochim. Acta 1990, 171, 95–113. [Google Scholar] [CrossRef]
  59. Zhang, J.; Chen, T.; Jiao, Y.; Cheng, M.; Wang, L.-L.; Wang, J.-L.; Li, X.-Y.; Chen, Y.-Q. Improved Activity of Ni–Mo/SiO2 Bimetallic Catalyst Synthesized via Sol-Gel Method for Methylcyclohexane Cracking. Pet. Sci. 2021, 18, 1530–1542. [Google Scholar] [CrossRef]
  60. Pang, J.; Zheng, M.; He, L.; Li, L.; Pan, X.; Wang, A.; Wang, X.; Zhang, T. Upgrading Ethanol to N-Butanol over Highly Dispersed Ni–MgAlO Catalysts. J. Catal. 2016, 344, 184–193. [Google Scholar] [CrossRef]
  61. Benito, P.; Vaccari, A.; Antonetti, C.; Licursi, D.; Schiarioli, N.; Rodriguez-Castellón, E.; Raspolli Galletti, A.M. Tunable Copper-Hydrotalcite Derived Mixed Oxides for Sustainable Ethanol Condensation to n-Butanol in Liquid Phase. J. Clean. Prod. 2019, 209, 1614–1623. [Google Scholar] [CrossRef]
  62. Larina, O.V.; Valihura, K.V.; Kyriienko, P.I.; Vlasenko, N.V.; Balakin, D.Y.; Khalakhan, I.; Čendak, T.; Soloviev, S.O.; Orlyk, S.M. Successive Vapour Phase Guerbet Condensation of Ethanol and 1-Butanol over Mg-Al Oxide Catalysts in a Flow Reactor. Appl. Catal. Gen. 2019, 588, 117265. [Google Scholar] [CrossRef]
  63. Rechi Siqueira, M.; Micali Perrone, O.; Metzker, G.; de Oliveira Lisboa, D.C.; Thoméo, J.C.; Boscolo, M. Highly Selective 1-Butanol Obtained from Ethanol Catalyzed by Mixed Metal Oxides: Reaction Optimization and Catalyst Structure Behavior. Mol. Catal. 2019, 476, 110516. [Google Scholar] [CrossRef]
  64. Ob-eye, J.; Praserthdam, P.; Jongsomjit, B. Dehydrogenation of Ethanol to Acetaldehyde over Different Metals Supported on Carbon Catalysts. J. Catal. 2019, 9, 66. [Google Scholar] [CrossRef]
  65. Calles, J.; Carrero, A.; Vizcaíno, A.; Lindo, M. Effect of Ce and Zr Addition to Ni/SiO2 Catalysts for Hydrogen Production through Ethanol Steam Reforming. J. Catal. 2015, 5, 58–76. [Google Scholar] [CrossRef] [Green Version]
Figure 1. Flow-through catalytic setup of high pressure. 1—reactor; 2—catalyst; 3—furnace; 4—reactor thermocouple; 5—gas flow regulator; 6—liquid pump; 7—evaporator; 8—commutator; 9—analysis on the GC-1000 chromatograph; 10—separator; 11—collection of liquid fractions.
Chemengineering 06 00074 g001
Figure 2. FTIR spectra of samples (a) fresh samples, (b) samples after the reaction. (1) SiO2 (RH); (2) SiO2.
Chemengineering 06 00074 g002aChemengineering 06 00074 g002b
Figure 3. SEM images of fresh samples. (a) SiO2; (b) SiO2 (RH); (c) 3 wt.% CuO/SiO2; (d) 3 wt.% CuO/SiO2 (RH); (e) 5 wt.% CuO/SiO2; (f) 5 wt.% CuO/SiO2 (RH).
Chemengineering 06 00074 g003
Figure 4. XRD diffractograms of the samples. (1) SiO2; (2) SiO2 (RH); (3) 3 wt.% CuO/SiO2; (4) 5 wt.% CuO/SiO2; (5) 3 wt.% CuO/SiO2 (RH); (6) 5 wt.% CuO/SiO2 (RH).
Chemengineering 06 00074 g004
Figure 5. Derivatogram of samples: (a) SiO2 (RH); (b) SiO2; (c) 3 wt.% CuO/SiO2; (d) 5 wt.% CuO/SiO2; (e) 3 wt.% CuO/SiO2 (RH); (f) 5 wt.% CuO/SiO2 (RH).
Chemengineering 06 00074 g005aChemengineering 06 00074 g005b
Figure 6. TPR-H2 profiles of fresh SiO2 and 3 wt.% CuO/SiO2, 5 wt.% CuO/SiO2 catalysts.
Chemengineering 06 00074 g006
Figure 7. TPR-H2 profiles of fresh SiO2 (RH) and 3 wt.% CuO/SiO2 (RH) and 5 wt.% CuO/SiO2 (RH) catalysts.
Chemengineering 06 00074 g007
Figure 8. TPD profiles of fresh SiO2 (RH) and 3 wt.% CuO/SiO2 (RH) and 5wt.% CuO/SiO2 (RH) catalysts.
Chemengineering 06 00074 g008
Figure 9. TPD profiles of fresh SiO2 and 3 wt.% CuO/SiO2 and 5 wt.% CuO/SiO2 catalysts.
Chemengineering 06 00074 g009
Scheme 1. Transformation of ethanol on CuO/SiO2 (RH) catalyst.
Chemengineering 06 00074 sch001
Table 1. Acid characteristics of samples.
SampleWeak Acid Sites, μmol/gMedium Acid Sites, μmol/gStrong Acid Sites, μmol/gTotal, μmol/g
SiO2 (RH)11155278
3 wt.% CuO/SiO2 (RH)1073412153
5 wt.% CuO/SiO2 (RH)121634161
SiO2400-82482
3 wt.% CuO/SiO2802-46848
5 wt.% CuO/SiO2934-34968
Table 2. Conversion of ethanol and selectivity of reaction products at a reaction temperature of 350 °C, WHSV = 0.5 h−1.
SamplesXEtOH, %C2H4, C2H6AACH4COCO2H2H2OOther Products (Dietoxyethane, n-Butanol)
SiO230142253011172-
SiO2 (RH)420.328131210304.32.0 (DEE), 0.4 (But)
3 wt.% CuO/SiO263622132210252-
3 wt.% CuO/SiO2 (RH)700.4470.20.10.150-2.2 (DEE)
5 wt.% CuO/SiO2741318109383-
5 wt.% CuO/SiO2 (RH)85-420.20.20.151-5.5(DEE), 1(But)
Publisher’s Note: MDPI stays neutral with regard to jurisdictional claims in published maps and institutional affiliations.

