Article

Process Optimization and Biotransformation of Ferulic Acid to Vanillin in a Low-Cost Nitrogen Source

by
Abiola Ezekiel Taiwo
1,*,
Tafirenyika Nyamayaro Madzimbamuto
2 and
Tunde Victor Ojumu
2
1
Faculty of Engineering, Mangosuthu University of Technology, Durban 4031, South Africa
2
Department of Chemical Engineering, Cape Peninsula University of Technology, Bellville Campus, Symphony Way, Cape Town 7535, South Africa
*
Author to whom correspondence should be addressed.
ChemEngineering 2024, 8(4), 68; https://doi.org/10.3390/chemengineering8040068
Submission received: 23 April 2024 / Revised: 20 June 2024 / Accepted: 1 July 2024 / Published: 4 July 2024

Abstract

:
Consumers’ growing knowledge of healthy, environmentally friendly flavors and scents drives the demand for vanillin bioproduction. To save costs on nitrogen during the bioproduction of vanillin, this study investigated the feasibility of using corn steep as a substitute. Using the response surface methodology (RSM) model, the synergistic effects of three variables on vanillin yield were evaluated using Box–Behnken design (BBD). When corn steep liquid, ferulic acid concentration, and pH were 7.72 g/L, 2.33 g/L, and 9.34, respectively, the highest vanillin production of 386 mg/L was achieved. The findings indicated that a maximum overall desirability (D) of 1.0 and a significant (p < 0.05) quadratic model with a regression coefficient (R2) of 0.995 can be used to establish ideal circumstances for the bioproduction of vanillin. This study demonstrated the effectiveness of using corn steep liquor as a low-cost nitrogen source in the medium formulation for the extraction and production of vanillin.

1. Introduction

A significant ingredient in vanilla extract is vanillin, which is widely utilized as a flavoring in food, medicine, cosmetics, and the fine chemical industry [1]. Vanilla planifolia is a naturally occurring source of vanillin; however, growing, harvesting, and processing vanilla plants can take a long time [2]. Even though guaiacol and glyoxylic acid can be used as starting materials for the chemical synthesis of vanillin, the substrate’s petrochemical origin has proven to be a significant drawback [3]. Furthermore, bioprocessing can address the health benefits, the considerable price difference between natural and synthetic vanillin, and the challenge of meeting market demand with vanilla pods. Therefore, bioprocessing could be the building block for developing flavoring industries that synthesize vanillin using renewable resources [4]. Vanillin, which develops when bacteria biotransform ferulic acid, is classified as a natural substance since it is extracted from enzymatic processes and microbes.
Vanillin bioproduction has drawn ongoing research interest in various ways, including reactor specifications and design [1], choice of substrates or precursors [5], the separation and the selection of microbes [6], the genetic engineering process [7], the separation and extraction of the broth’s products [8] and the influence on the media [9]. A concentrated effort has been undertaken to extract vanillin from renewable resources and common agricultural waste, including groundnut shells, coconut husk, eugenol, isoeugenol, sugars, ferulic acid, sugar beet pulp, wheat straw, aromatic amino acid, and vanillic acid [4,10]. Among these, ferulic acid (FA) has been identified to have the ability to serve as a substrate for the synthesis of vanillin [11,12]. When extracted from lignocellulose waste from biomass, FA is an inexpensive feedstock for producing highly sought-after bioactive chemicals. This phenolic molecule is present in the cell walls of lignocellulosic materials. It is covalently connected to a range of carbohydrates, including amides, glycoside conjugates, and ester bonds, and it has the natural capacity to release ferulic acid following pretreatment [3].
Several operational factors affect vanillin biosynthesis, including temperature, duration of incubation, pH, nature and size of the substrate, sources of nitrogen-containing compounds, selection of microorganisms, percentage of dissolved oxygen, and modification of the medium used [1,13]. Even though nitrogen sources may significantly impact the cost of producing vanillin, only a few studies have been conducted about lowering their costs. Using corn steep liquor as the only nitrogen source for vanillin production, Bacillus amyloliquefaciens subsp. CICC 10025 was employed in the current work to biotransform ferulic acid. The present work emphasizes the development of low-cost microbial media to support and meet the nutritional needs of the biosynthesis of ferulic acid into vanillin. This approach aims to determine the ideal conditions that may be pertinent for the bioprocess scale-up of vanillin production.

2. Materials and Methods

2.1. Materials

The following products were acquired from Sigma-Aldrich: yeast extract, beef extract, corn steep liquor (CSL), vanillin (≥97% natural), vanillic acid, sodium carbonate (BioXtra ≥99%), and ferulic acid (≥99%). The remaining chemicals were all analytical grade and purchased from Sigma-Aldrich in St. Louis, MO, USA.

2.2. Microorganism and Inoculum Preparation

For this investigation, Bacillus amyloliquefaciens subsp. CICC 10025 was obtained from the Chinese Industrial Culture Collection Center. The substance was stored on agar slants with the following medium composition (g/L): pH 7.0, glucose 10, beef extract 10, peptone 10, sodium chloride 5, and agar 16 [14]. The following media were used to prepare the seed culture media (S1): 50 mL of glucose (5 g/L), 0.5 g/L of ferulic acid (FA), 10 g/L of peptone, 3 g/L of yeast extract, and 5 g/L of sodium chloride at pH 8.0 in a 250 mL shake flask for 24 h at a temperature of 35 °C and an agitation speed of 150 rpm [10]. Yan et al.’s seed culture media [10] were altered to develop media (S2), in which 13 g/L of CSL was used instead of peptone and yeast extract.

2.3. Medium Composition for Vanillin Production

The composition of the bioconversion medium (M1) was as follows (g/L): 2 FA, 3 yeast extract powder, 5 NaCl, and 10 peptone [10]. After the medium was adjusted to pH 9.0, it was autoclaved for 15 min at 121 °C for sterilizing. For 72 h, the flasks were agitated at 150 rpm in an orbital incubation chamber set at 37 °C. CSL (13 g/L) was added to the fermentation medium of the modified bioconversion media (M2) in place of peptone and yeast extract.

2.4. Batch Fermentation Study

Based on several authors’ optimal media, ranges were chosen in preliminary investigations that evaluated the controlling parameters of vanillin bioproduction [1,10,15]. The study examined the impact of various concentrations of FA (0.5, 1.0, 1.5, 2.0, 2.5), CSL (3, 6, 9, 12, 15), pH (5, 8, 8.5, 9.0, 9.5), and media type (M1 and M2). The pH of the medium was adjusted during the fermentation processes using buffer solutions (5 M NaOH and 10 M HCl). Then, in a sterile setting, the inoculum size (5% volume fraction) was introduced to the shaking flask. The fermentation process was run for 72 h at 150 rpm and 35 °C in an incubator shaker (model: FSIM SP016).

2.5. Vanillin Production Experimental Design by Box–Behnken Using DOE

The Box–Behnken design (BBD) approach was used in this study to determine relationships between the bioconversion variables selected in vanillin production. BBD generated 17 experiments based on CSL, FA, and pH values to investigate the effects of different variables in the fermentation process. Table 1 shows the selected ranges and levels of the independent variables used in the experiment. Each variable had three levels: the lower, middle, and upper.
The quadratic equation shown below was used to predict the response of vanillin concentration in fermentation processes (1):
Y = b 0 + i = 1 k b i X i   + i = 1 k b i i X i 2 + i < j k b i j X i X j + ε    
where b0 denotes the intercept or constant value, bi (i = 1, 2…k) is referred to as the first-order model coefficient, bij is used to measure the correlation of the variables, bii symbolizes the quadratic coefficients of Xi, Xi and Xj are the input variables that influence the response variable, and ε depicts the random error.

2.6. Statistical Analysis

The experimental data was subjected to multiple regression analysis. To estimate the coefficients of the given Equation (1), Stat Ease Inc., Minneapolis, MN, USA, employed Design Expert version 10.0. Using the F-value and p-value (probability) from the analysis of variance, a measure of the model’s significance was evaluated. To determine the regression equation’s level of fit, R2 and modified R2 were computed. A graphical depiction was shown to demonstrate the study’s model behavior.

2.7. Colorimetric Evaluation of Ferulic and Vanillic Acid

The fundamental concept of the Folin–Ciocalteu reagent’s reaction was used to evaluate the concentration of FA. After adding 2 mL of 15 weight per cent Na2CO3 solution and 0.5 mL of Folin–Ciocalteu reagent to 1 millilitre of the supernatant, mixing well with a vortex, cooling, and diluting the mixture as needed, the absorbance reading was taken at 718 nm using a UV–Visible Spectrometer (GBC. Cintra 2020) against a blank solution [16]. Except for utilizing vanillic acid as a calibration standard, an identical methodology was used to measure vanillic acid.

2.8. Measurement of Vanillin Colorimetric Method

To make up 10 mL in a colorimetric tube, 5 mL of a 24 weight percent HCl solution, 2 mL of a 1 weight percent thiobarbituric acid solution, and 0.5 mL of sample were added to distilled water. The solution was held at room temperature for 20 min after being submerged in a water bath at 55 °C for 10 min [13]. Using the GBC Cintra 2020 Spectrophotometer, the UV absorbance was then measured to a blank solution wavelength of 434 nm. With the aid of Cintra software, a standard graph was created in the spectrophotometer at a wavelength of 438 nm to determine the concentration of vanillin in the liquid broth [17,18].

3. Results

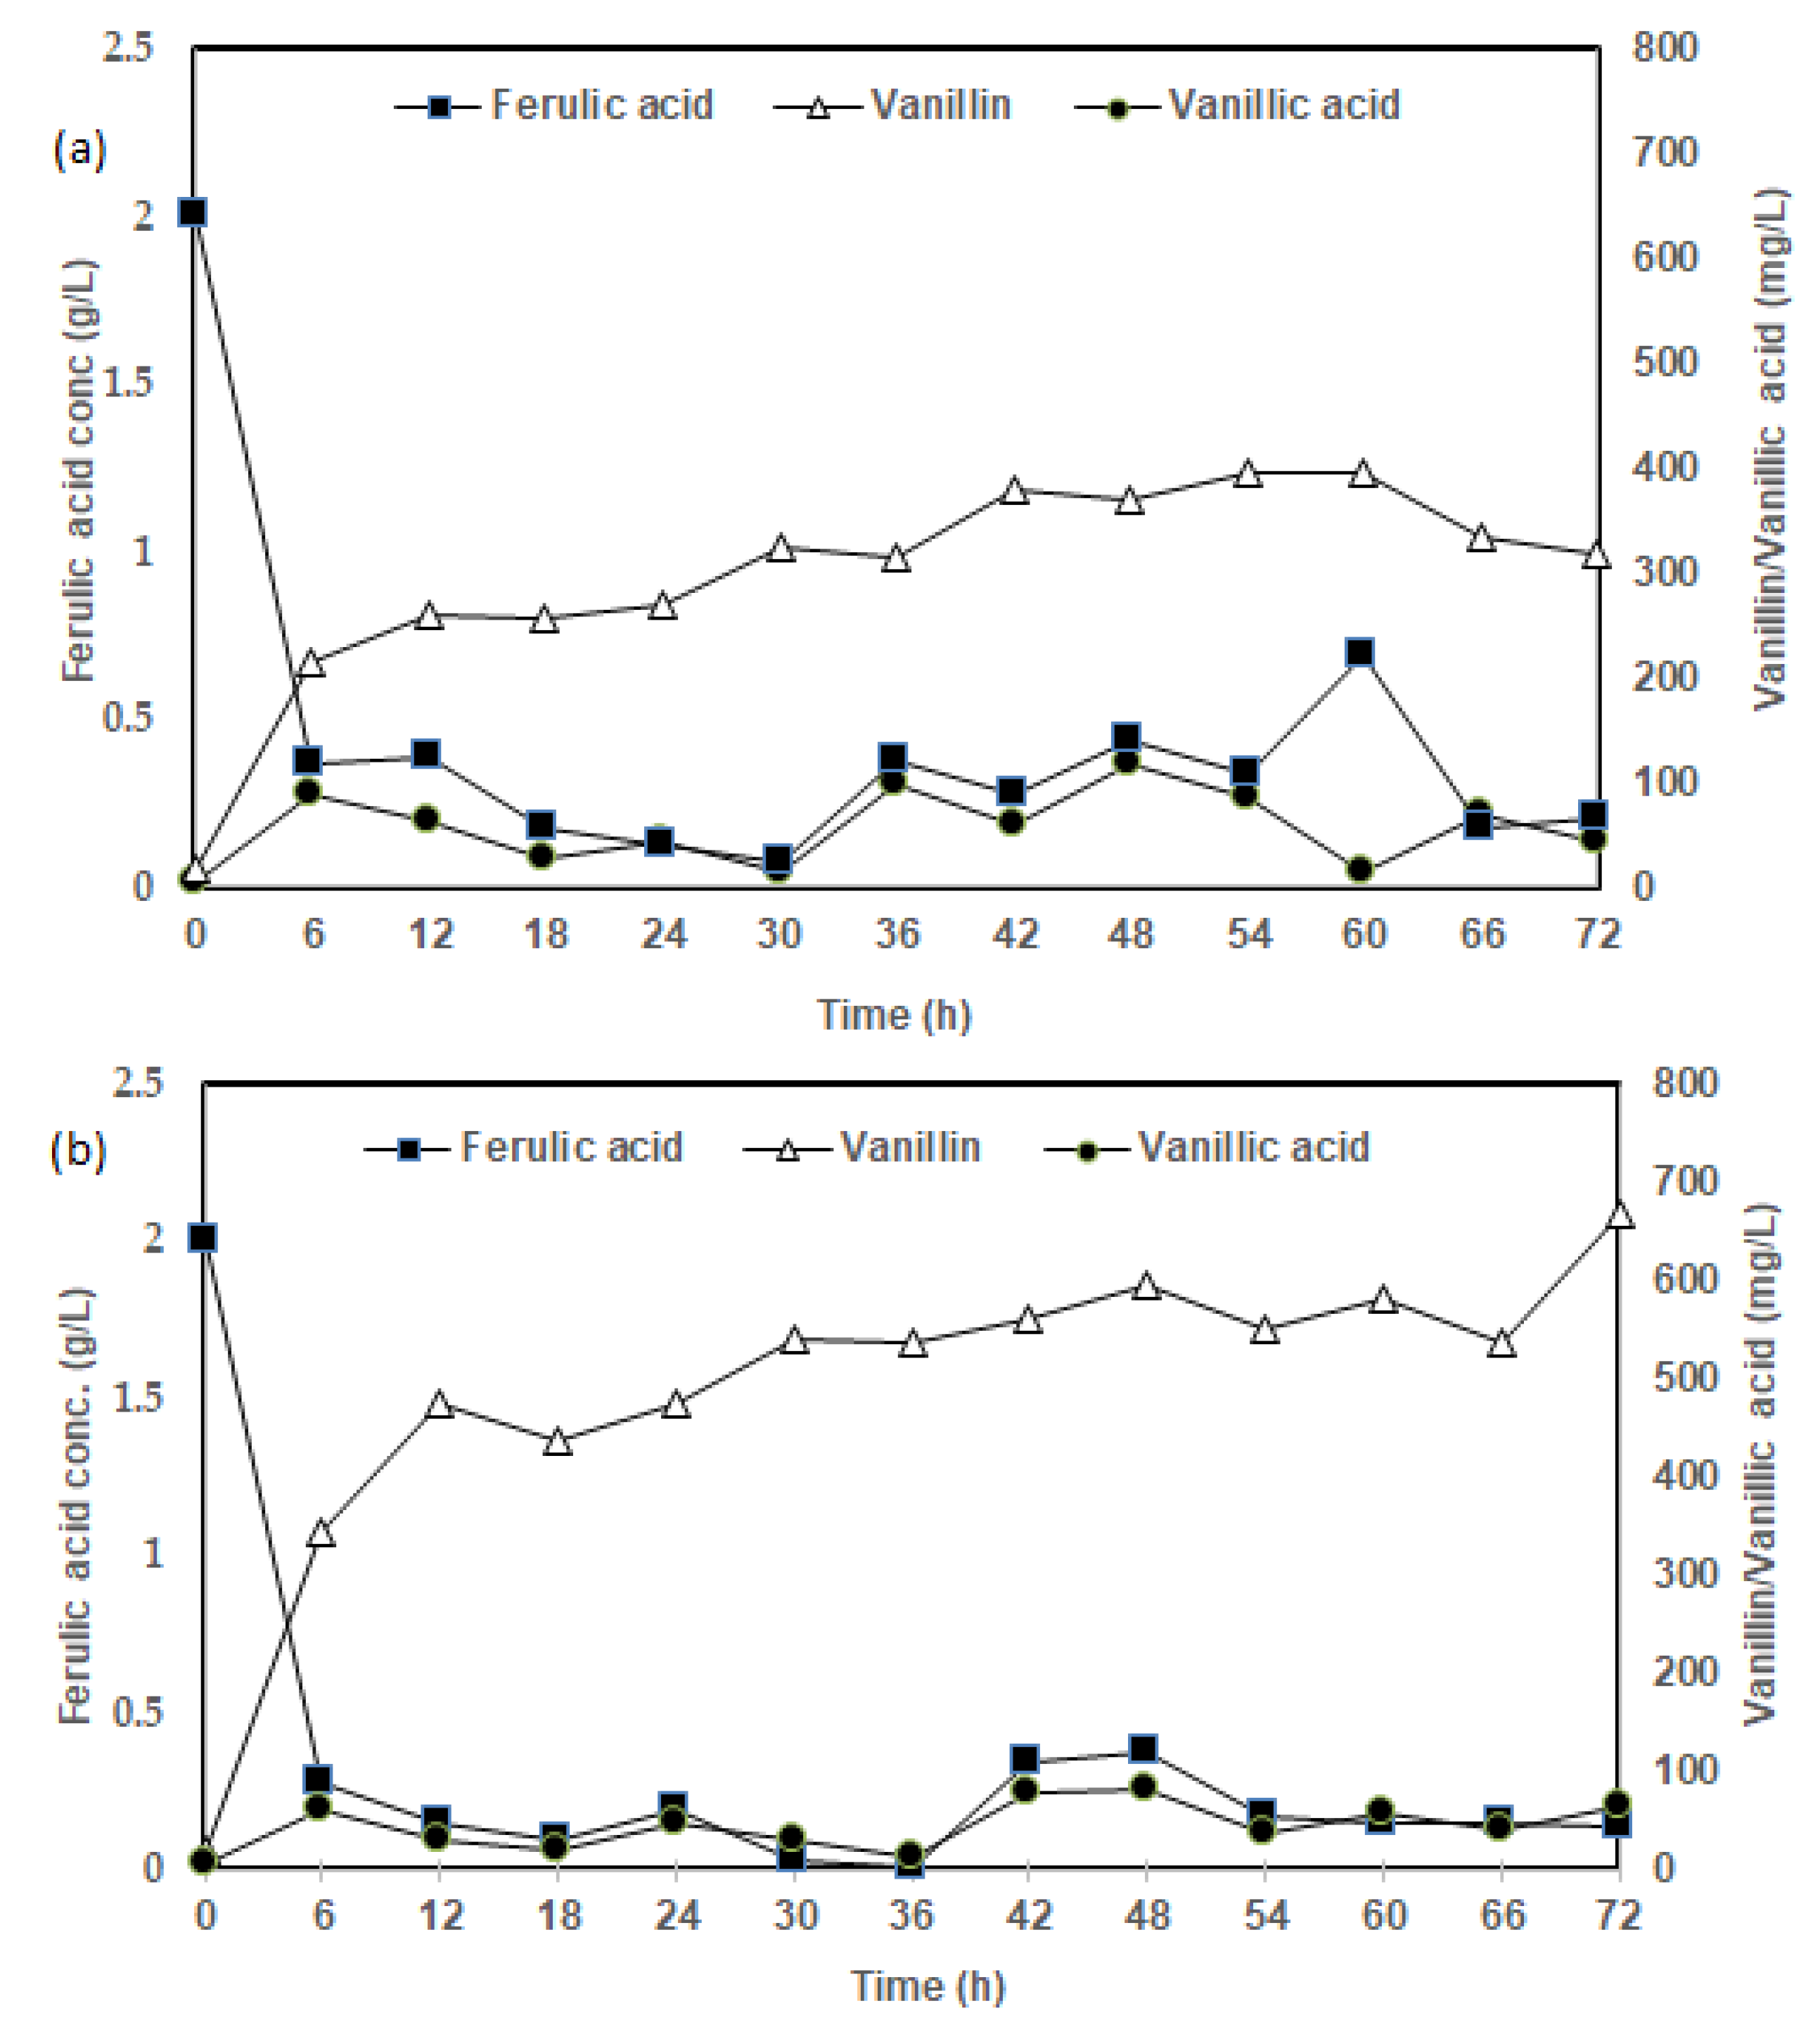
3.1. Influence of Media Formulation on FA Bioconversion to Vanillin

Two media were used to assess the bioconversion to compare and examine the synthesis of vanillin. The nutritional compositions (M1 and M2) were mentioned in the materials and techniques section that was previously discussed. Figure 1a,b show the time course of vanillin accumulation, intermediate (vanillic acid), and FA utilization from the two media. The data showed a considerable rise in vanillin and vanillic acid, respectively, and a quick depletion of FA. M1, which included peptone and yeast extract, had the highest amount of vanillin at 396 mg/L. On the other hand, M2, which contains CSL, outperformed FA in the bioconversion process, yielding a significant amount of vanillin (668.39 mg/L). Figure 1b shows that, in comparison to Figure 1a, less vanillic acid, a byproduct, was produced. It is likely that certain nutrients that were missing from the other formulation contributed to the higher yield in the CSL media [19,20]. According to Chen et al. [15], the medium’s composition and type significantly impacted bioconversion because they can give microorganisms energy and promote growth at the substrate concentration for a high yield of the desired product. Consequently, M2, which contains CSL, was employed in subsequent investigations.

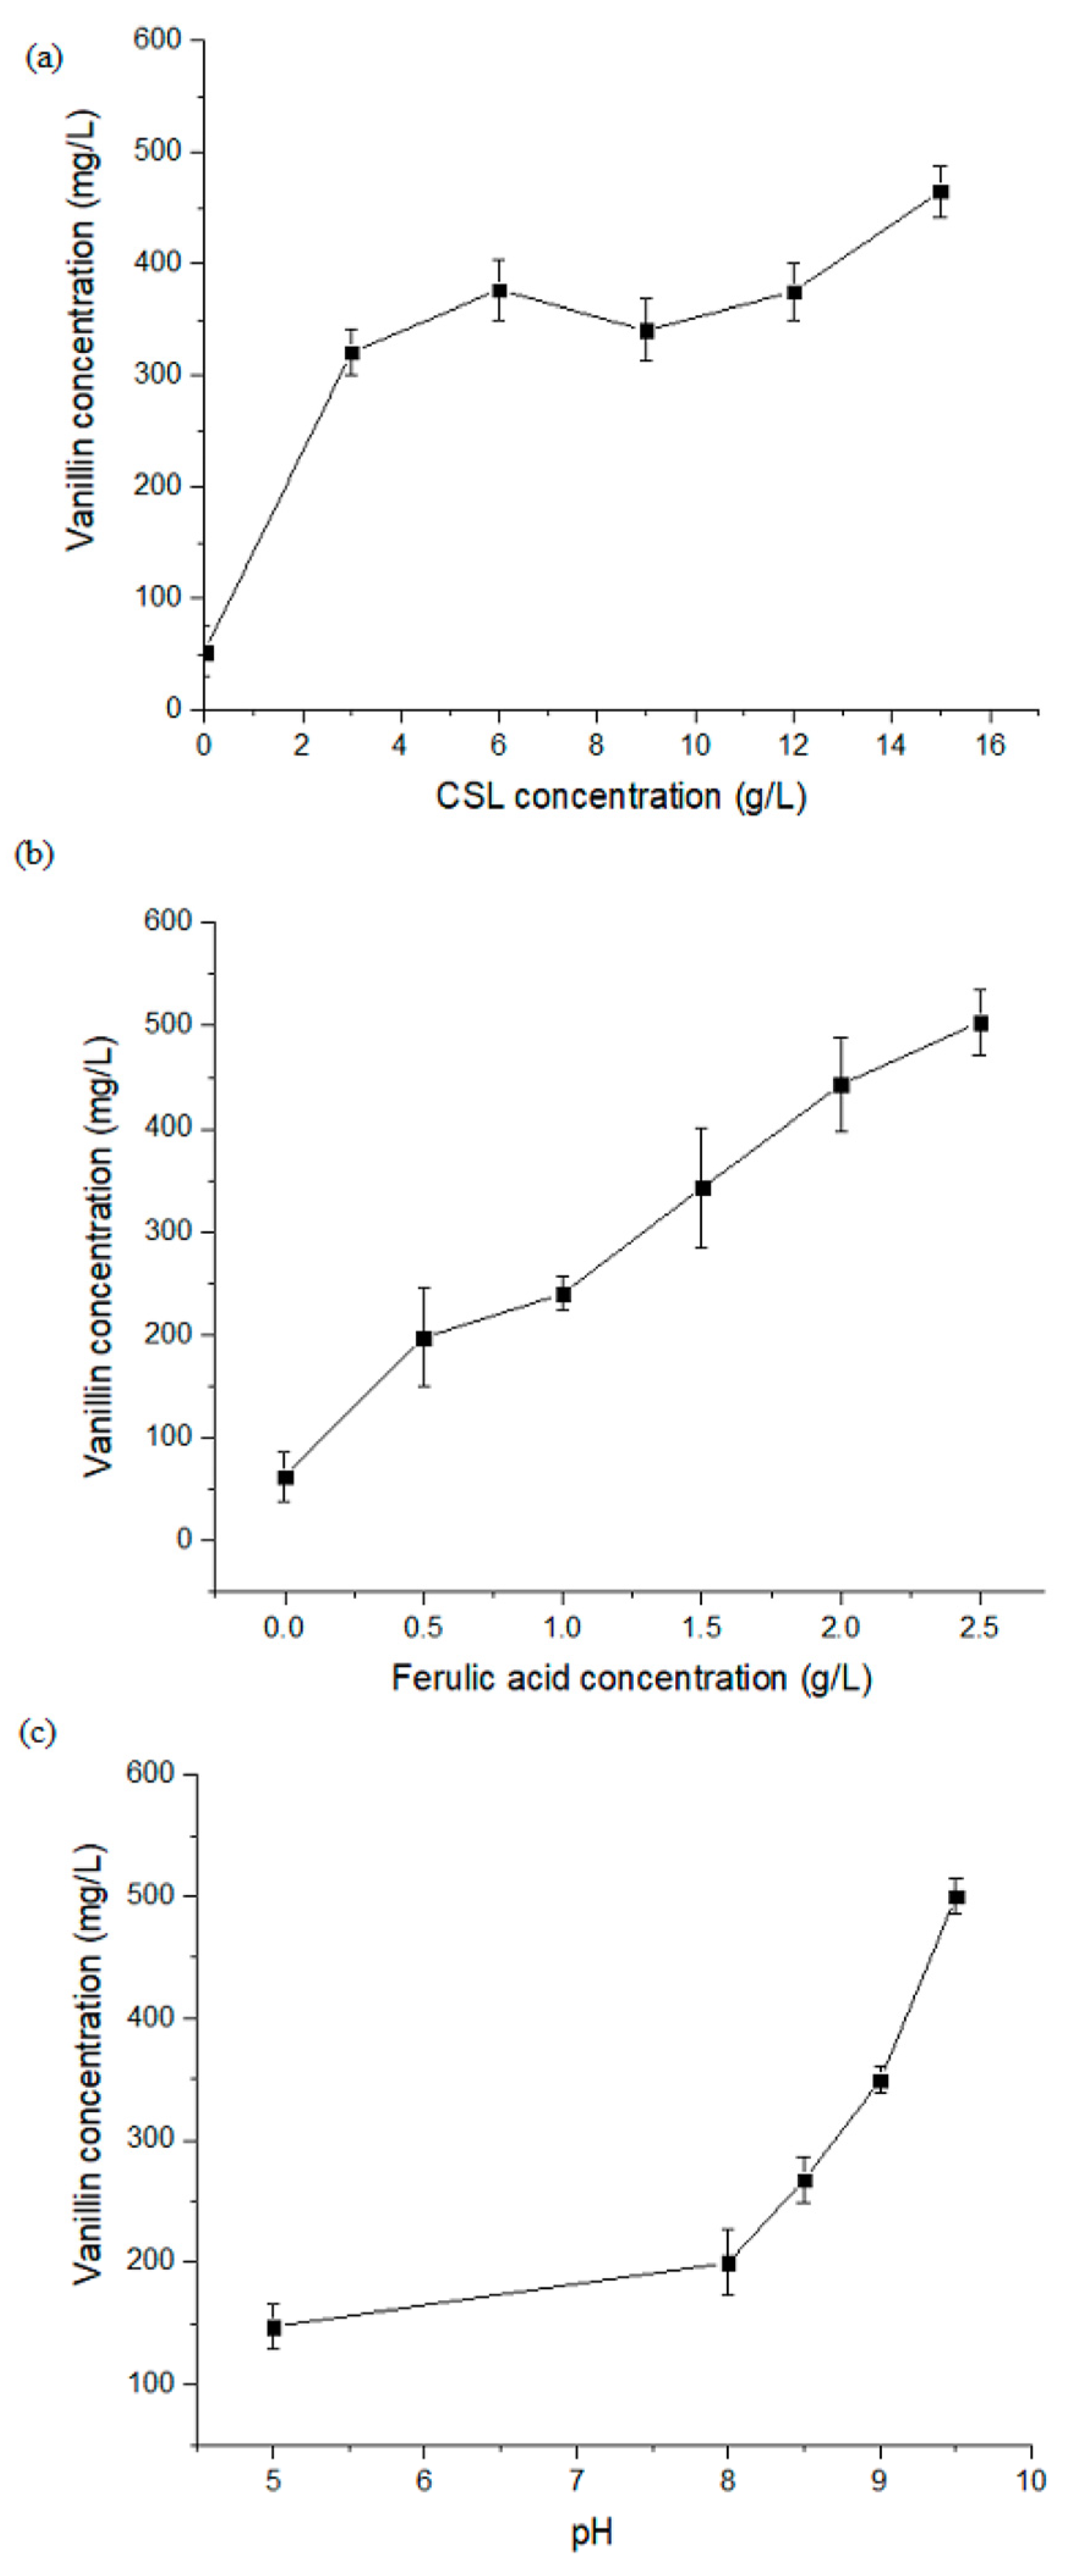
3.2. Influence of CSL Concentration on FA Bioconversion to Vanillin

Investigations were conducted on the effects of various CSL concentrations (3, 6, 9, 12, and 15) in g/L on the bioconversion of FA into vanillin. Other parameters (FA 2.0 g/L, pH 9.0, temperature 35 °C, agitation 150 rpm, period 72 h) were kept constant, as Figure 2a reveals. The highest level of vanillin concentration was shown to occur when the concentration of CSL increased. At 15 g/L of CSL, vanillin’s highest concentration (464.96 mg/L) was obtained. When the bioconversion process was carried out without CSL, very little vanillin was generated (52.47 mg/L). These results were corroborated by Tilay et al. [5], who found that CSL was more supportive of maximum vanillin production (30% molar yield) than other nitrogen sources, such as peptone, yeast extract, and beef extract.

3.3. Influence of FA Concentration on Vanillin Production

Studies were conducted to assess the extent to which initial FA concentration affected its bioconversion into vanillin. As indicated in Figure 2b, the tests were conducted with FA concentrations of 0.5, 1.0, 1.5, 2.0, and 2.5 g/L, at pH 9.0, temperature 35 °C, agitation 150 rpm, time 72 h, and CSL 13 g/L. The experiment’s control was also established without adding FA to the fermentation. Figure 2b shows that the concentration of vanillin rises in proportion to the initial FA amount. On the other hand, FA has been shown in previous research to be potentially harmful to microbial cells and to limit their growth beyond a specific amount [7]. On the other hand, with higher FA concentrations, the media formulation improved biological transformation.

3.4. Influence of pH on FA Bioconversion to Vanillin

Figure 2c illustrates the influence of pH (5, 8, 8.5, 9.0, 9.5) on the bioconversion of FA to vanillin at 35 °C, 150 rpm of agitation, 13 g/L of CSL, 2.0 g/L of FA concentration, and 72 h of fermentation. It was discovered that the vanillin concentration reached its peak (499 mg/L) at an ideal pH of 9.5. This supports earlier research [10,11], which found that the highest vanillin concentration was favored in the pH range of 8.0–9.5 and that acidic media did not promote the synthesis of FA into vanillin. Since variations in pH can impact both the ionic state of the substrate and the enzymes active in biological transformation, it is essential to understand the ideal pH for the activity of a selected microorganism for a given biochemical process [10,21].

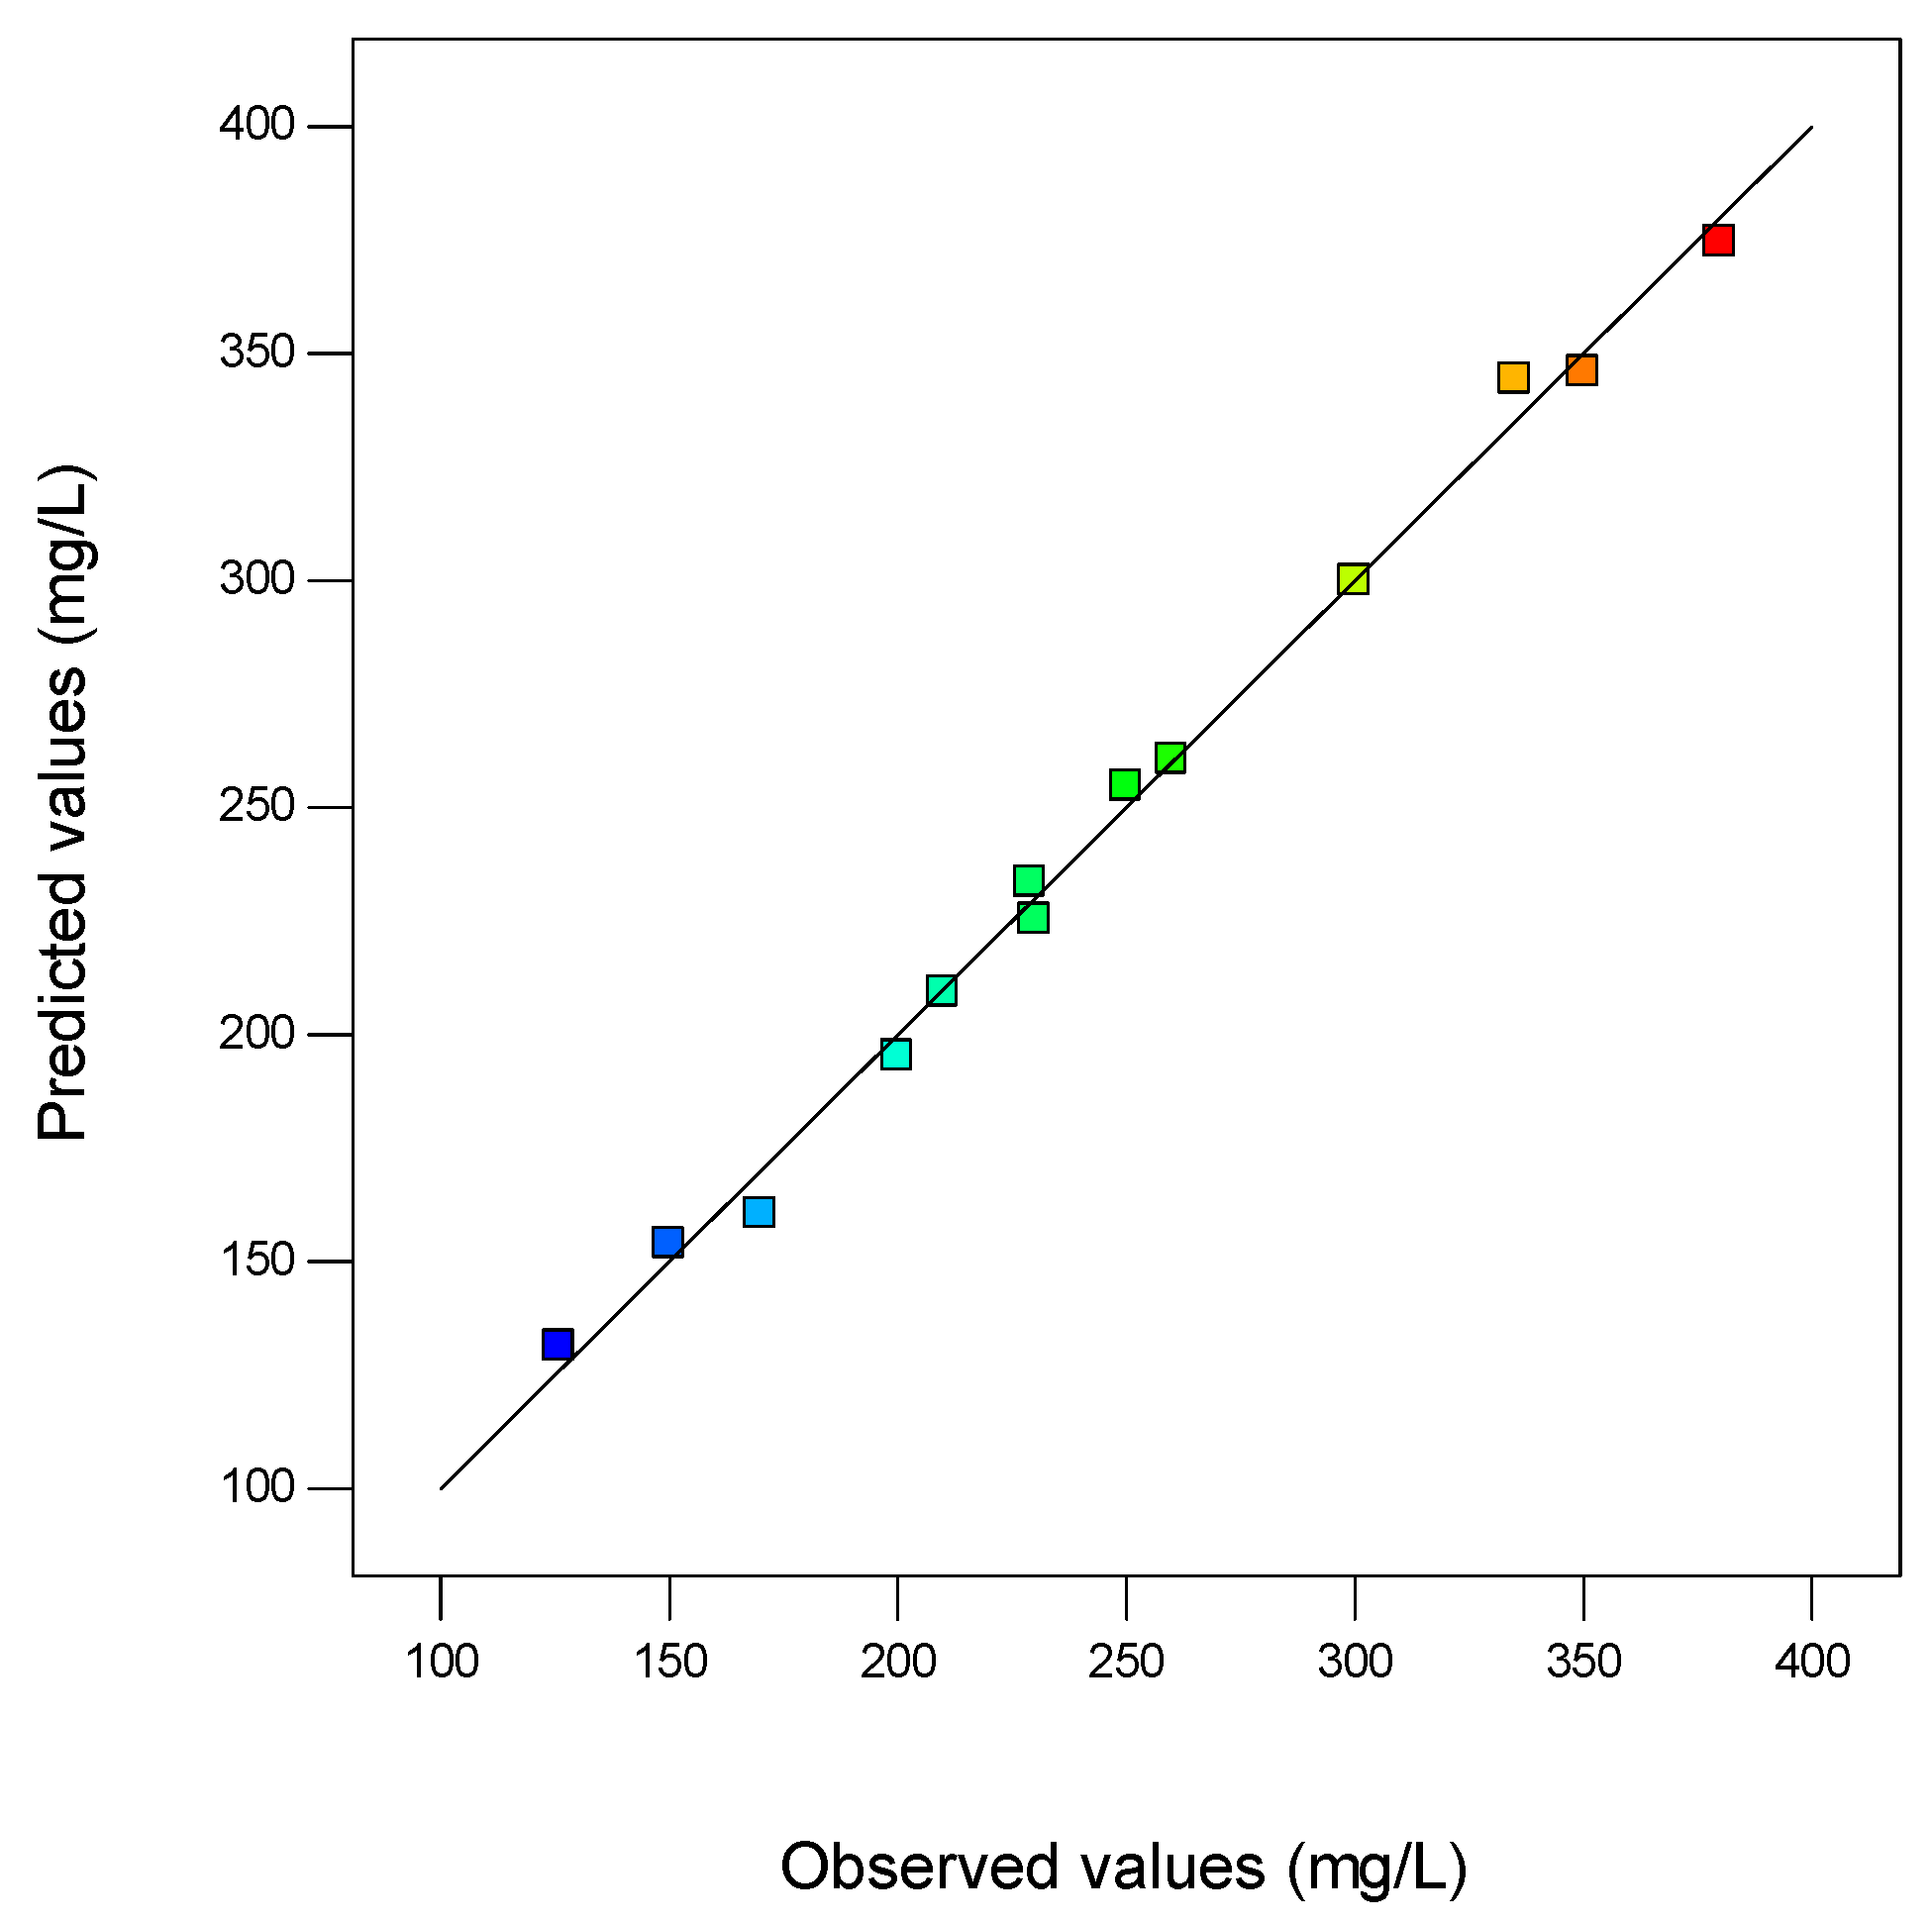
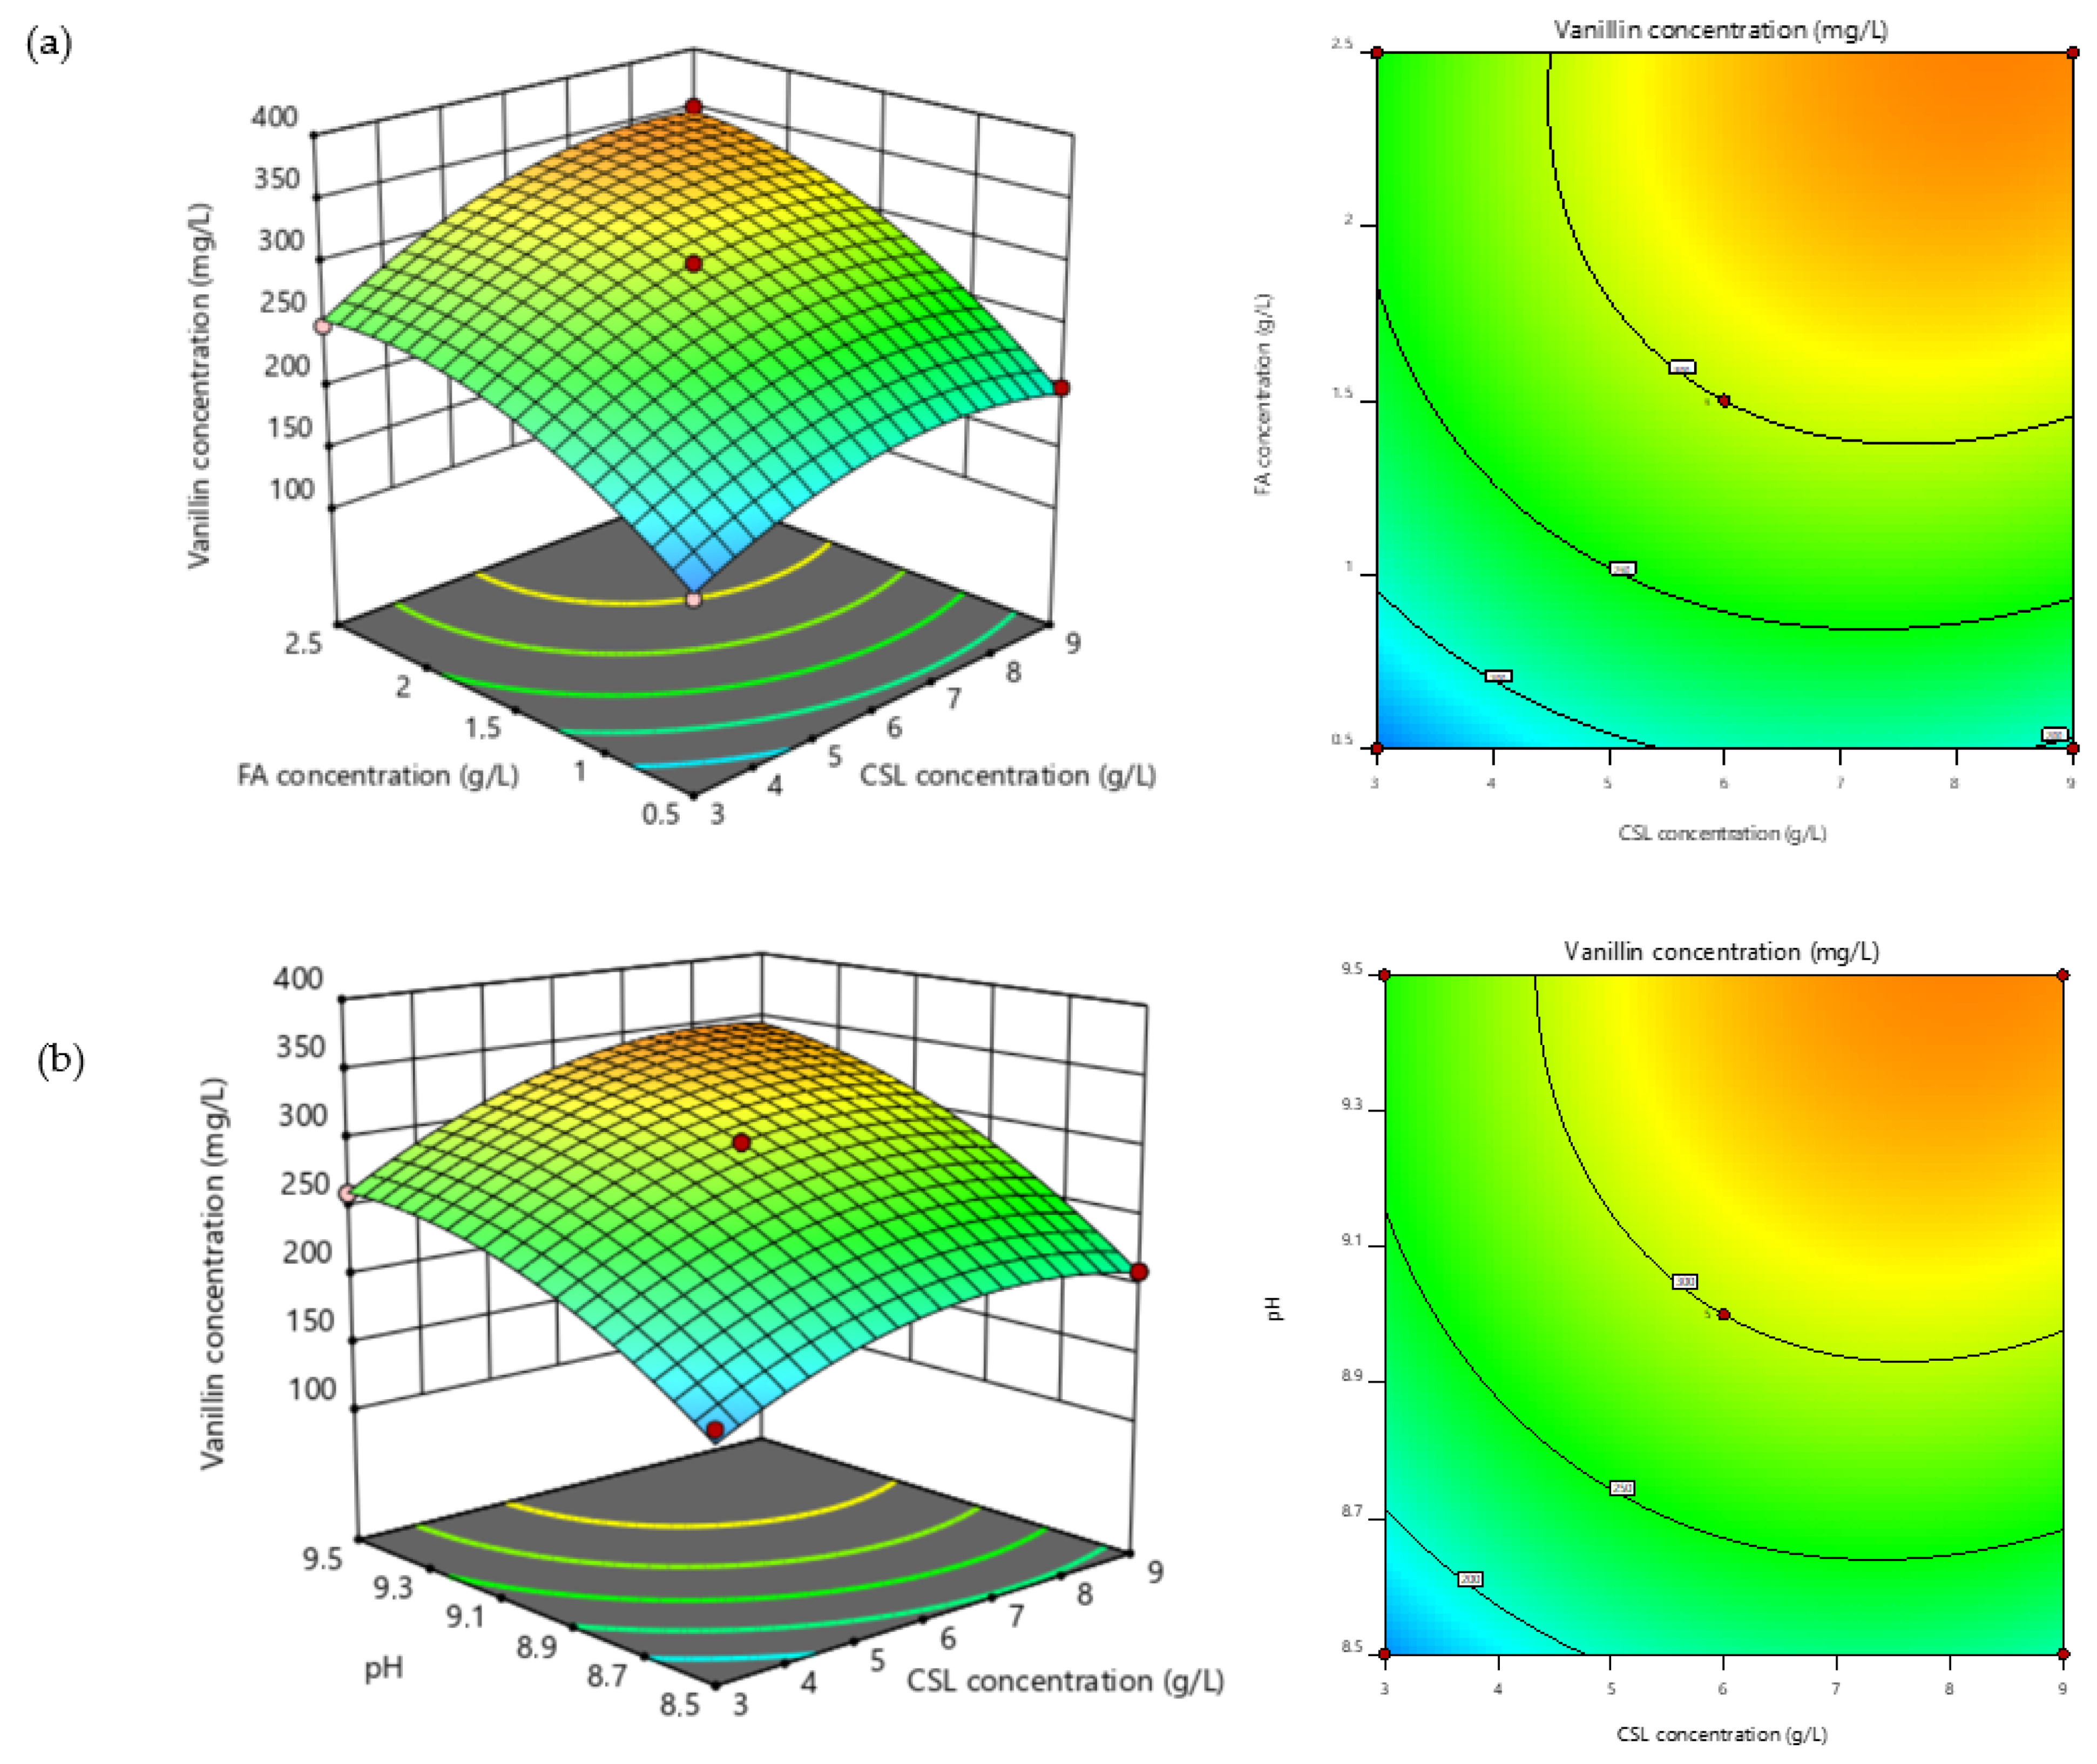
3.5. Modeling and Optimization of Vanillin Production

The bioconversion study was statistically and mathematically modeled using response surface methodology (RSM) and a Box–Behnken design (BBD) to determine a relationship between the selected factors for vanillin production. Table 2 lists the different combinations of experimental conditions and the corresponding response values. To assess the impact of these parameters on vanillin production, an ANOVA was performed on the observed data (Table 2), which were then fitted using Equation (1). The following quadratic polynomial regression Equation (2) was obtained:
Vanillin concentration = −8946.44 − 7.71X1 − 76.13X2 + 1937.25X3 − 3.33X12 − 32.50X22 − 105X32 + 4.17X1X2 + 5.83X1X3 + 23.50X2X3
As shown in Table 3, several variables assessed the suitability of the model, including model significance (F- and p-value), coefficient of determination (R2), coefficient of variation (CV), and suitable accuracy [1]. The regression model’s F-value, or the signal response-to-noise ratio, was 179.89, indicating a very significant (p < 0.0001) model. For a model F-value, there was only a 0.01% likelihood that this magnitude could happen because of noise. The percentage of response variance that the model can account for is called R2. A value of 0.90 indicates an ideal fit for a predictive model. It ranges from 0 to 1. The second-order polynomial could be employed for prediction with an acceptable degree of accuracy; in this study, an R2 value of 0.995% was obtained, and only 0.5 percent of the variability in the model was estimated. Another indicator of goodness of fit is adjusted-R2, which is calculated based on the sample size and the number of terms in the model. Previous studies have reported that adjusted-R2 is a better-fit metric for evaluating multiple regression models than the R2 model [22,23]. Adj-R2 may be notably smaller than R2 if the sample size is small and the model has many terms [1]. This investigation’s adj-R2 score (0.990) showed the model’s high level of importance. To assess how effectively the model predicts responses for new observations, one can utilize predicted R2 (pred-R2). Additionally, an established relationship between the expected and observed results is shown in the pred-R2 score of 0.931. Furthermore, the difference between adj-R2 and pred-R2 values was less than 0.2, suggesting no significant block effect or potential issue with the model, data, or both [24].
The ratio of the standard error of the estimated data to the average value of the observed response is known as the coefficient of variance or CV. A CV score of less than 10% indicates greater experiment dependability [25]. Its low CV value of 2.75% showed the developed model’s consistent reaction. The range of the anticipated response to the associated inaccuracy is known as adequate precision. With a score of 44.58, higher than 4, it was shown to have a sufficient signal, meaning that the anticipated model may be utilized to navigate the design space.
Moreover, a standard deviation (S.D.) of 7.11 demonstrated that the model complied with the anticipated outcome. Table 3 and Equation (2) show that the quadratic terms X1X2, X1X3, and X2X3 and the linear terms X1, X2, and X3 significantly increased the concentration of vanillin. This suggested that certain variables positively impacted the yield of vanillin. These quadratic terms were found to have a considerable beneficial effect, indicating that they tend to boost vanillin yield significantly at high values. This investigation demonstrates that the chosen variable ranges are well suited for optimizing vanillin production. Table 3 indicates that the relationship between terms X1X2, X1X3, and X2X3 were significant (p > 0.05), suggesting that they contributed to vanillin yield. Thus, the maximum synthesis of vanillin is determined by the effects of CSL concentration (X1), initial ferulic acid concentration (X2), and pH (X3). Contour plots of the RSM were developed as functions of two variables at a time, holding every other variable at zero, to illustrate the interactive influence of the variables further and optimize each one for vanillin maximization.
The correlation plot of expected values versus the actual values in Figure 3 demonstrates the precision of the model because the data align on a straight line with slight divergence from the parity line.
For the responses, a total of three response plots and three comparable contour plots were generated (Figure 4). The multidimensional graph and contour interactive influence of CSL and initial FA on vanillin yield for a fixed pH of 9 is displayed in Figure 4a. When CSL increased correspondingly from 3 to 9 g/L, vanillin yield increased (150–350 mg/L) as the baseline concentration of FA increased from 0.5 to 2.5 g/L. Nevertheless, the vanillin yield declined to 250 mg/L when the CSL concentration decreased to 3 g/L, and the FA peaked at 2.5 g/L. This suggests that the rich components contained in CSL facilitate FA bioconversion into the targeted vanillin [26]. At a given FA concentration of 1.5 g/L, Figure 4b shows a 3D surface map of the contour-responsive influence between CSL concentration and pH. A rise in vanillin yield was found parallel with increases in pH and CSL concentrations. Even with an increase in pH, the yield of vanillin fell as the concentration of CSL increased, while it had increased from 170 to 335 mg/L. Therefore, it can be confirmed that raising the CSL concentration while maintaining the medium’s basic pH increased the vanillin yield [11]. At a constant concentration of 6 g/L CSL, Figure 4c shows the correlation between FA and pH. Vanillin levels rose together with increases in FA and pH. Vanillin production was not enhanced by a small amount of FA (0.5 g/L) at pH 8.5; however, a maximum yield of 380 mg/L was obtained when FA rose from 0.5 to 2.5 g/L, and the pH peaked at 9.5. To optimize vanillin yield, both pH and FA must be regulated. Chen et al. [1] observed that elevated initial FA can cause microbial growth inhibition, ultimately reducing substrate use.

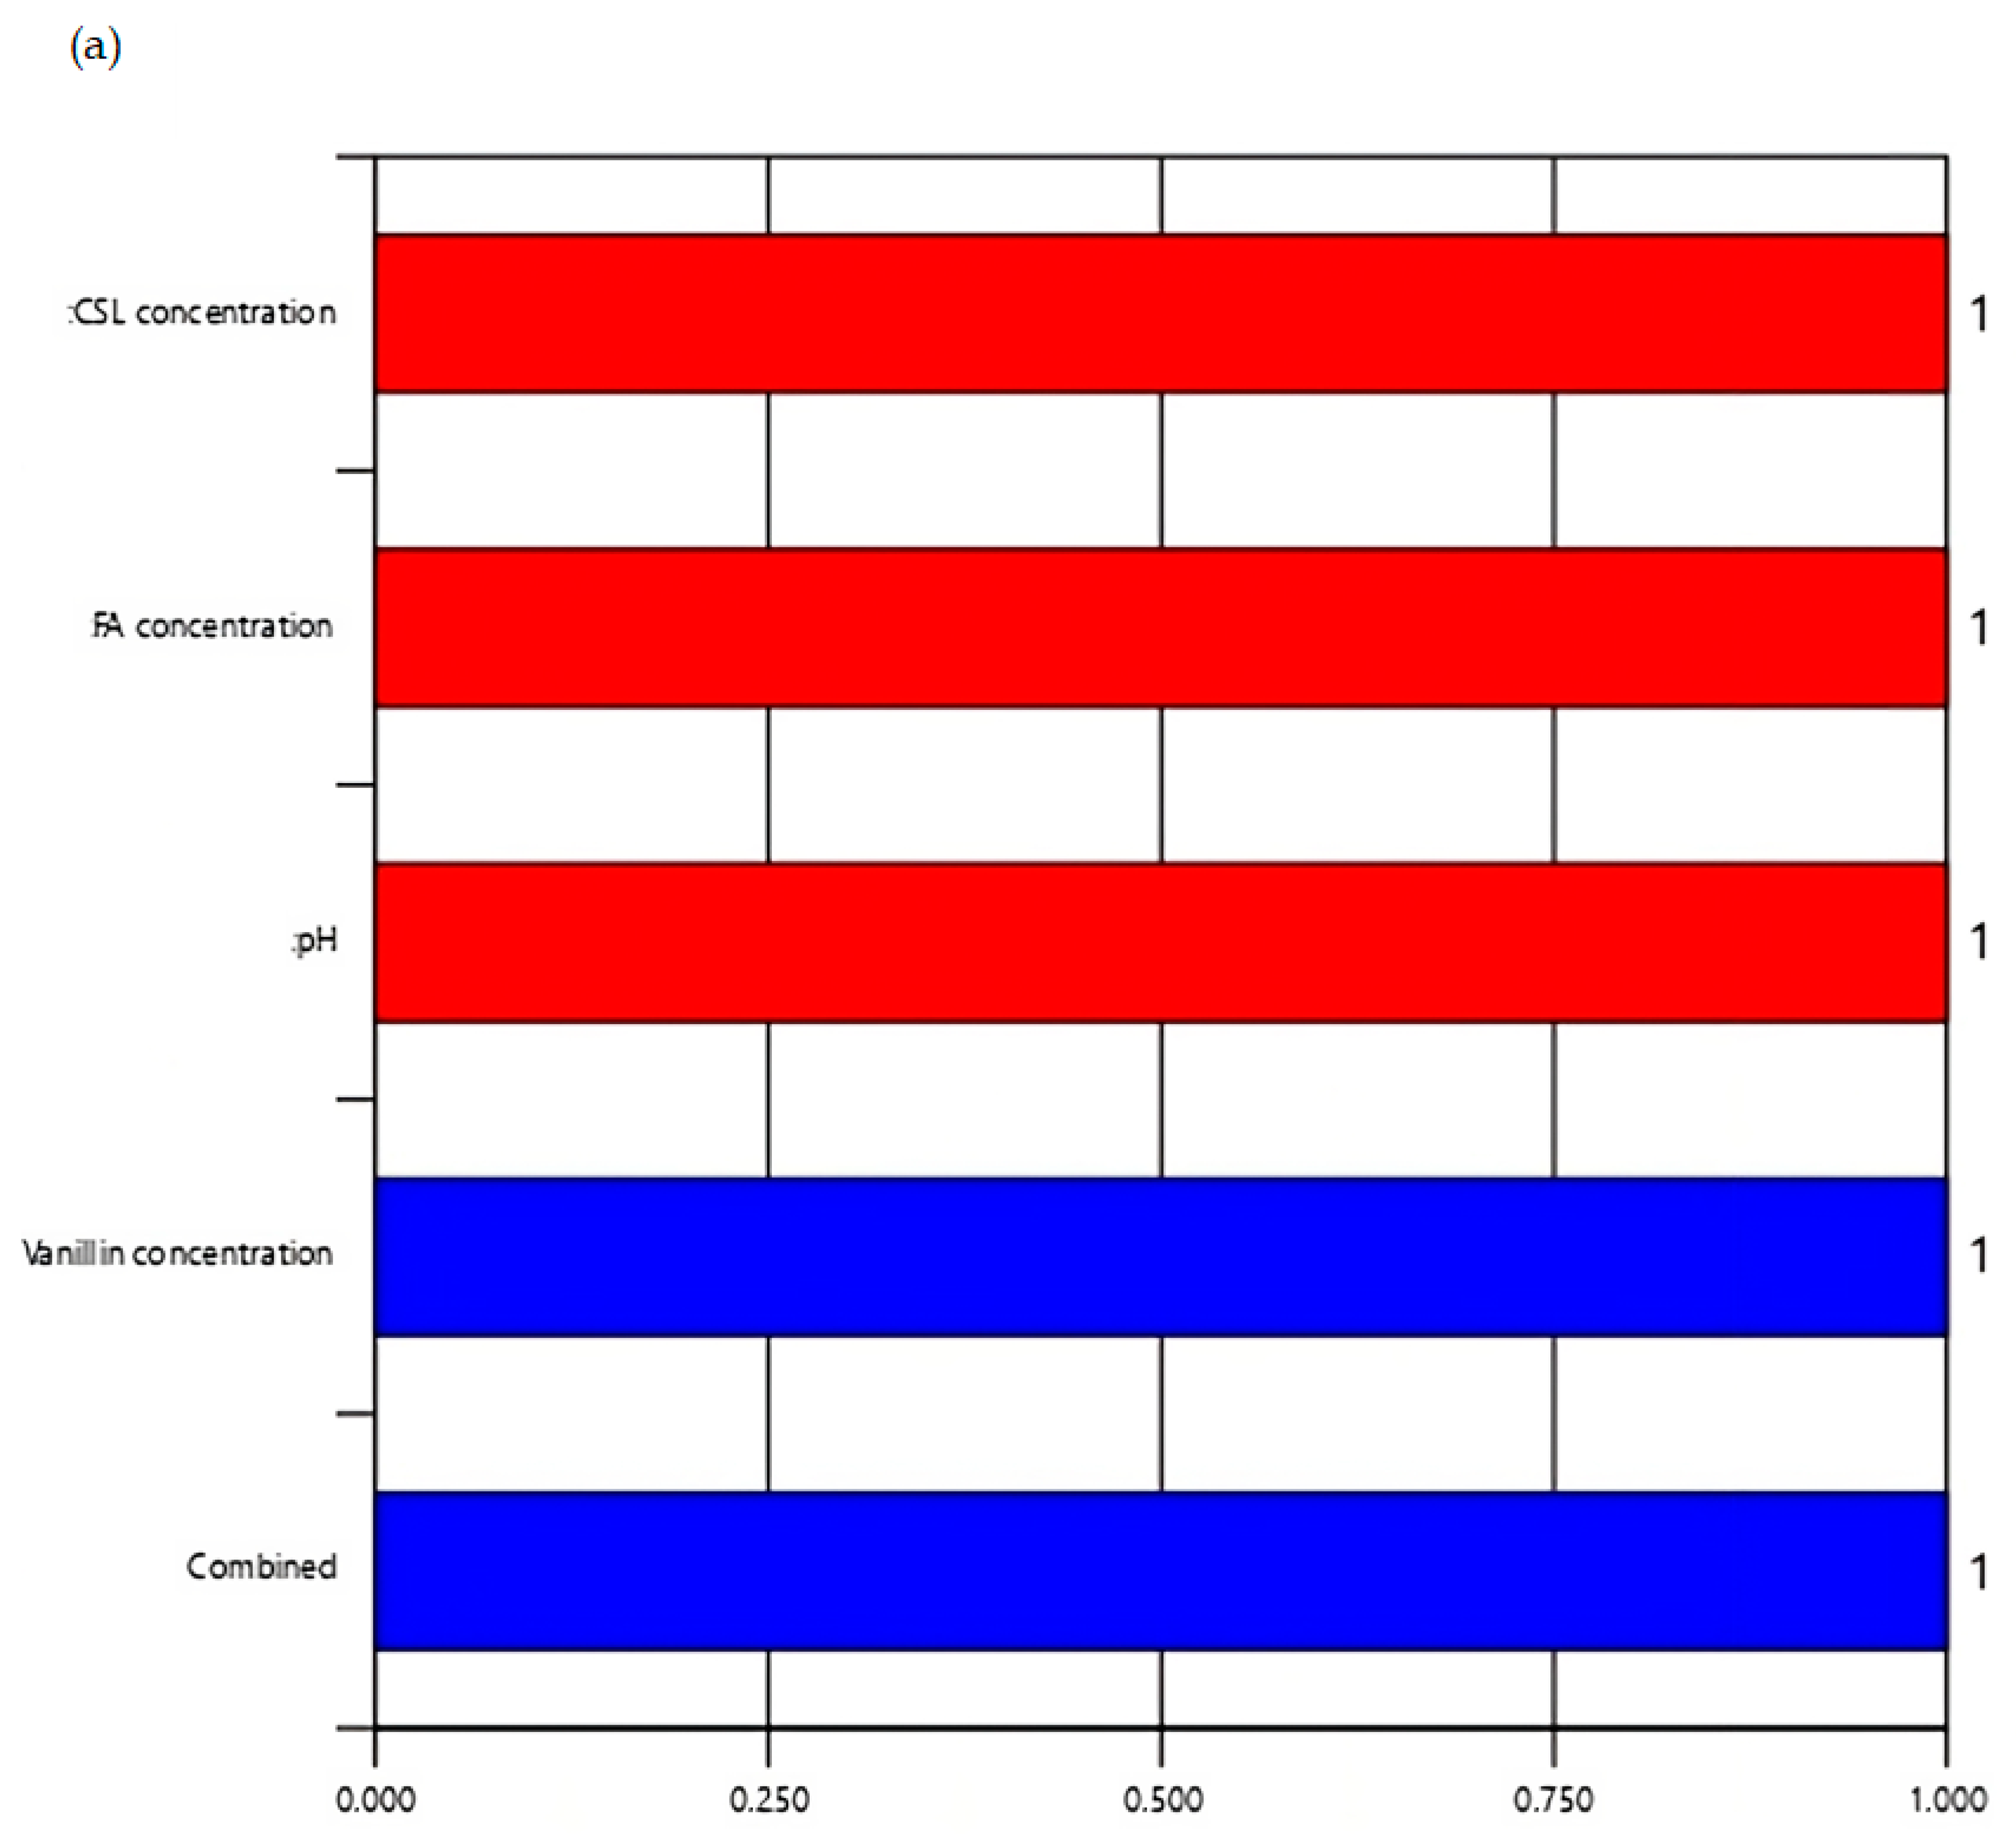
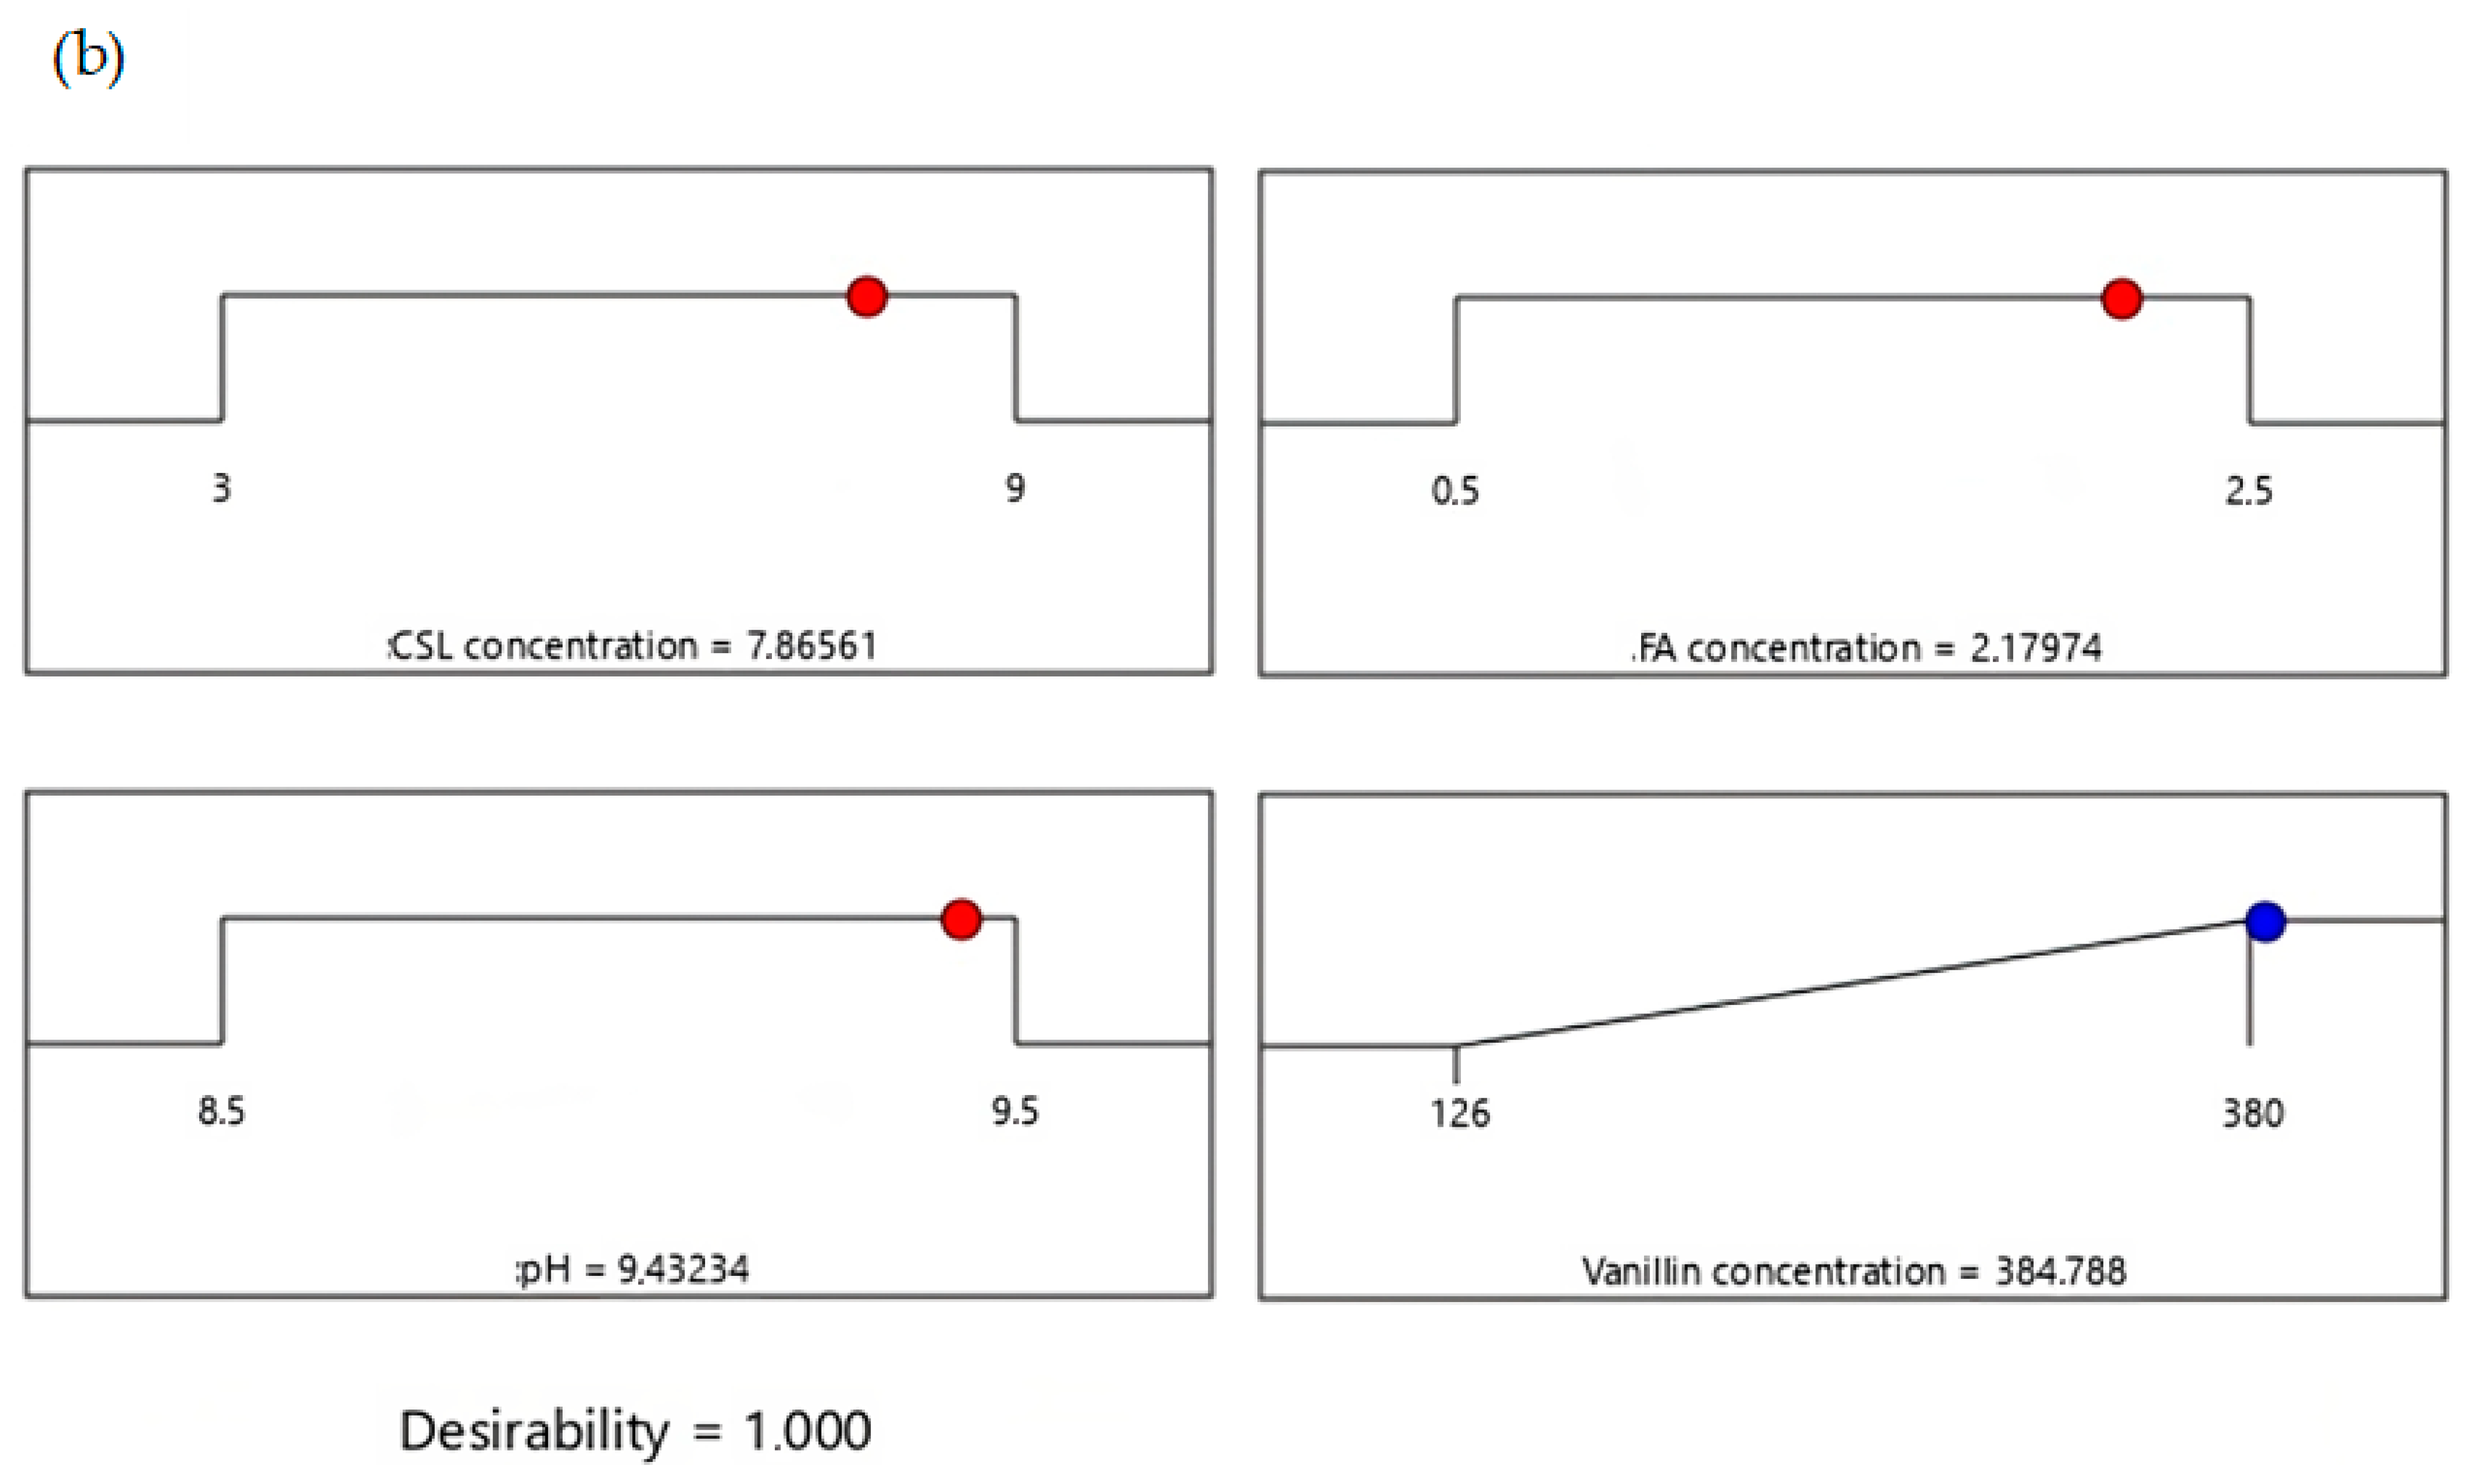
3.6. Numerical Optimization of Vanillin Using Desirability Function

The desirability function is a practical approach for simultaneously determining the optimal performance levels of input variables [27,28]. Every response has a desirability rating between zero and one, where one denotes the best scenario and zero one or more responses that fall outside of the desirable range. Equation (3) computes the geometric mean of each response desirability value to determine the total response desirability value.
D = d 1 × d 2 × d 3 × × d n 1 n = i = 1 n d i 1 n
In this case, n is the number of responses in the measure (i = 1… n), and di is the ith response’s individual desirability value. In other words, when every response meets the desired outcome, the overall desirability, or D value, equals 1. Derringer’s desired function methodology was applied to numerical optimization to identify the ideal parameters for maximum vanillin synthesis. The amount of vanillin was adjusted in Design Expert software to optimize yield, whereas the CSL, initial FA, and pH were chosen to be “in range”. Every factor was weighted 1, and the response was selected up to the point where it maximized the desirability function [29]. Figure 5a shows each response’s geometric mean (D = 1) and the unique desirability function (di). A desirability ramp for the computational optimization of the three chosen variables is displayed in Figure 5b. The optimal operating parameters for the maximum vanillin production were 7.72 g/L for CSL, 2.33 g/L for FA, and pH of 9.36, with an overall desirability of 1. These values were obtained by recalculating all response factors using the desirability function to achieve the optimum vanillin yield.

3.7. Validation Test

The optimal factors determined using response surface methodology analysis were expected to yield 384.78 mg/L vanillin. The confirmed yield was 386 mg/L, and the verification assays were run in triplicate. The bioconversion of FA to vanillin might theoretically be carried out under ideal conditions, as indicated by the 0.32% discrepancy between the validated and expected values. Equation (2) was solved using the Design Expert Software package (version 10.0) to determine the optimal values of all three chosen variables. The optimal vanillin yield from this investigation is comparable to the results of previous studies that described the bioconversion process for vanillin from FA using various microorganisms and inorganic nitrogen sources (Table 4). Applying Bacillus subtilis B7-S as the bioconversion microbe, Chen et al. [15] obtained 0.16 mg/L of vanillin, while Karmakar et al. [30] decarboxylated ferulic acid to 4-vinyl guaiacol, which was then converted to 16.8 mg/L of vanillin using Bacillus coagulans. Bacillus aryabhattai BA03 was suggested by Paz et al. [11] to have decarboxylated ferulic acid to a maximum vanillin concentration of 147.1 mg/L. The only other work that used corn steep liquor as an inorganic nitrogen source for Pycnoporus cinnabarinus-based vanillin synthesis is that by Tilay et al. [5]. The authors statistically optimized a vanillin concentration of 126 mg/L. The cost of raw materials in commercial fermentation is closely linked with the sources of nitrogen, and the cost of synthesizing vanillin may be significantly impacted by the use of less expensive sources of nitrogen [31]. This study highlights the importance of replacing yeast and beef extracts with less expensive nitrogen sources, such as corn steep liquor (Table 4).

4. Conclusions

Corn steep liquor may be a suitable alternative for bioconverting ferulic acid to vanillin compared to other expensive nitrogen nutrients. The results demonstrated significant differences in the concentration of vanillin between ferulic acid, CSL, and pH. A second-order mathematical model with an R2 of 0.995 can be used to predict the vanillin concentration using the response surface method (p < 0.05). Vanillin can be obtained from the bioconversion of ferulic acid under optimal conditions with 7.72 g/L of CSL, 2.33 g/L of ferulic acid, and pH 9.34. The concentration of vanillin was validated experimentally to an accuracy of 0.32%

Author Contributions

A.E.T. conducted the fermentation experiments and drafted the paper; T.N.M., T.V.O., and A.E.T. conceived the experiment. T.V.O. and T.N.M. served as study advisors and provided essential input for the manuscripts reviewing in addition to research materials. The completed work was read and approved by every author. All authors have read and agreed to the published version of the manuscript.

Funding

The National Research Foundation of South Africa and The World Academy of Sciences (NRF-TWAS) provided support under grant numbers 99988 and 116562 for the doctorate studies of A.E.

Data Availability Statement

This article contains all the data collected or analyzed during this study.

Acknowledgments

The authors acknowledge the Bioprocess Laboratory at Cape Peninsula University of Technology for providing a suitable workspace for A.E.’s doctoral research. A.E. acknowledge Mangosuthu University for providing an environment for revising this manuscript.

Conflicts of Interest

The authors have no competing interests.

References

  1. Chen, P.; Yan, L.; Zhang, S.; Wu, Z.; Li, S.; Yan, X.; Wang, N.; Liang, N.; Li, H. Optimizing bioconversion of ferulic acid to vanillin by Bacillus subtilis in the stirred packed reactor using Box-Behnken design and desirability function. Food Sci. Biotechnol. 2017, 26, 143–152. [Google Scholar] [CrossRef]
  2. D’Arrigo, P.; Rossato, L.A.; Strini, A.; Serra, S. From Waste to Value: Recent Insights into Producing Vanillin from Lignin. Molecules 2024, 29, 442. [Google Scholar] [CrossRef] [PubMed]
  3. Nayak, J.; Basu, A.; Dey, P.; Kumar, R.; Upadhaya, A.; Ghosh, S.; Bishayee, B.; Mishra, S.R.; Tripathy, S.K.; Banerjee, S.; et al. Transformation of agro-biomass into vanillin through novel membrane integrated value-addition process: A state-of-art review. Biomass Convers. Biorefinery 2023, 13, 14317–14340. [Google Scholar] [CrossRef]
  4. Mehmood, T.; Saeed, S.; Hussain, N.; Waseem, R. Biotransformation of wheat straw into biovanillin by solid-state fermentation and optimization of conditions parameters through response surface methodology. Biomass Convers. Biorefinery 2024, 14, 7569–7578. [Google Scholar] [CrossRef]
  5. Tilay, A.; Bule, M.; Annapure, U. Production of biovanillin by one-step biotransformation using fungus Pycnoporous cinnabarinus. J. Agric. Food Chem. 2010, 58, 4401–4405. [Google Scholar] [CrossRef] [PubMed]
  6. Ma, Q.; Liu, L.; Zhao, S.; Huang, Z.; Li, C.; Jiang, S.; Li, Q.; Gu, P. Biosynthesis of vanillin by different microorganisms: A review. World J. Microbiol. Biotechnol. 2022, 38, 40. [Google Scholar] [CrossRef]
  7. Di Gioia, D.; Luziatelli, F.; Negroni, A.; Ficca, A.G.; Fava, F.; Ruzzi, M. Metabolic engineering of Pseudomonas fluorescens for the production of vanillin from ferulic acid. J. Biotechnol. 2011, 156, 309–316. [Google Scholar] [CrossRef] [PubMed]
  8. Mota, M.I.F.; Rodrigues Pinto, P.C.; Loureiro, J.M.; Rodrigues, A.E. Recovery of vanillin and syringaldehyde from lignin oxidation: A review of separation and purification processes. Sep. Purif. Rev. 2016, 45, 227–259. [Google Scholar] [CrossRef]
  9. Melini, F.; Melini, V. Role of Microbial Fermentation in the Bio-Production of Food Aroma Compounds from Vegetable Waste. Fermentation 2024, 10, 132. [Google Scholar] [CrossRef]
  10. Yan, L.; Chen, P.; Zhang, S.; Li, S.; Yan, X.; Wang, N.; Liang, N.; Li, H. Biotransformation of ferulic acid to vanillin in the packed bed-stirred fermentors. Sci. Rep. 2016, 6, 34644. [Google Scholar] [CrossRef]
  11. Paz, A.; Outeiriño, D.; Pinheiro de Souza Oliveira, R.; Domínguez, J.M. Fed-batch production of vanillin by Bacillus aryabhattai BA03. New Biotechnol. 2018, 40, 186–191. [Google Scholar] [CrossRef] [PubMed]
  12. Prasath, C.S.; Sivadas, C.A.; Chandran, C.H.; Suchithra, T. Precision fermentation of sustainable products in the food industry. In Entrepreneurship with Microorganisms; Elsevier: Amsterdam, The Netherlands, 2024; pp. 163–177. [Google Scholar]
  13. Kaur, B.; Chakraborty, D. Statistical media and process optimization for biotransformation of rice bran to vanillin using Pediococcus acidilactici. Indian J. Exp. Biol. 2013, 51, 935–943. [Google Scholar] [PubMed]
  14. Xiao, Z.; Liu, P.; Qin, J.Y.; Xu, P. Statistical optimization of medium components for enhanced acetoin production from molasses and soybean meal hydrolysate. Appl. Microbiol. Biotechnol. 2007, 74, 61–68. [Google Scholar] [CrossRef] [PubMed]
  15. Chen, P.; Yan, L.; Wu, Z.; Li, S.; Bai, Z.; Yan, X.; Wang, N.; Liang, N.; Li, H. A microbial transformation using Bacillus subtilis B7-S to produce natural vanillin from ferulic acid. Sci. Rep. 2016, 6, 20400. [Google Scholar] [CrossRef] [PubMed]
  16. Jadhav, A.; Kareparamban, J.; Nikam, P.; Kadam, V. Spectrophotometric estimation of ferulic acid from Ferula asafoetida by Folin-ciocalteu’s reagent. Pharm. Sin. 2012, 3, 680–684. [Google Scholar]
  17. Wu, Y.-T.; Feng, M.; Ding, W.-W.; Tang, X.-Y.; Zhong, Y.-H.; Xiao, Z.-Y. Preparation of vanillin by bioconversion in a silicon rubber membrane bioreactor. Biochem. Eng. J. 2008, 41, 193–197. [Google Scholar] [CrossRef]
  18. Rana, R.; Mathur, A.; Jain, C.; Sharma, S.; Mathur, G. Microbial production of vanillin. Int. J. Biotechnol. Bioeng. Res. 2013, 4, 227–234. [Google Scholar]
  19. Wahjudi, S.M.W.; Petrzik, T.; Oudenne, F.; Lera Calvo, C.; Büchs, J. Unraveling the potential and constraints associated with corn steep liquor as a nutrient source for industrial fermentations. Biotechnol. Prog. 2023, 39, e3386. [Google Scholar] [CrossRef] [PubMed]
  20. Taiwo, A.E.; Musonge, P. Valorization of Corn Steep Liquor for Improved Value-added Products: A Review. Recent Innov. Chem. Eng. Former. Recent Pat. Chem. Eng. 2024, 17, 26–43. [Google Scholar] [CrossRef]
  21. Taiwo, A.; Madzimbamuto, T.; Ojumu, T. Optimization of Corn Steep Liquor Dosage and Other Fermentation Parameters for Ethanol Production by Saccharomyces cerevisiae Type 1 and Anchor Instant Yeast. Energies 2018, 11, 1740. [Google Scholar] [CrossRef]
  22. Daneshi, A.; Younesi, H.; Ghasempouri, S.M.; Sharifzadeh, M. Production of poly-3-hydroxybutyrate by Cupriavidus necator from corn syrup: Statistical modeling and optimization of biomass yield and volumetric productivity. J. Chem. Technol. Biotechnol. 2010, 85, 1528–1539. [Google Scholar] [CrossRef]
  23. Taiwo, A.E.; Musonge, P. Comparative evaluation of bioethanol fermentation process parameters using RSM, ANN and ANFIS. Biofuels Bioprod. Biorefining 2023, 17, 961–975. [Google Scholar] [CrossRef]
  24. Mourabet, M.; El Rhilassi, A.; El Boujaady, H.; Bennani-Ziatni, M.; El Hamri, R.; Taitai, A. Removal of fluoride from aqueous solution by adsorption on Apatitic tricalcium phosphate using Box–Behnken design and desirability function. Appl. Surf. Sci. 2012, 258, 4402–4410. [Google Scholar] [CrossRef]
  25. Betiku, E.; Odude, V.O.; Ishola, N.B.; Bamimore, A.; Osunleke, A.S.; Okeleye, A.A. Predictive capability evaluation of RSM, ANFIS and ANN: A case of reduction of high free fatty acid of palm kernel oil via esterification process. Energy Convers. Manag. 2016, 124, 219–230. [Google Scholar] [CrossRef]
  26. Rodríguez-López, L.; Vecino, X.; Barbosa-Pereira, L.; Moldes, A.; Cruz, J. A multifunctional extract from corn steep liquor: Antioxidant and surfactant activities. Food Funct. 2016, 7, 3724–3732. [Google Scholar] [CrossRef]
  27. Boateng, I.D. Application of graphical optimization, desirability, and multiple response functions in the extraction of food bioactive compounds. Food Eng. Rev. 2023, 15, 309–328. [Google Scholar] [CrossRef]
  28. Jimidar, M.; Bourguignon, B.; Massart, D. Application of Derringer’s desirability function for the selection of optimum separation conditions in capillary zone electrophoresis. J. Chromatogr. A 1996, 740, 109–117. [Google Scholar] [CrossRef]
  29. Derringer, G.; Suich, R. Simultaneous optimization of several response variables. J. Qual. Technol. 1980, 12, 214–219. [Google Scholar] [CrossRef]
  30. Karmakar, B.; Vohra, R.; Nandanwar, H.; Sharma, P.; Gupta, K.; Sobti, R. Rapid degradation of ferulic acid via 4-vinylguaiacol and vanillin by a newly isolated strain of Bacillus coagulans. J. Biotechnol. 2000, 80, 195–202. [Google Scholar] [CrossRef]
  31. Tan, J.; Jahim, J.; Wu, T.; Harun, S.; Mumtaz, T. Use of corn steep liquor as an economical nitrogen source for biosuccinic acid production by Actinobacillus succinogenes. In IOP Conference Series: Earth and Environmental Science; IOP Publishing: Bristol, UK, 2016; Volume 36, p. 012058. [Google Scholar]
Figure 1. Effect of media influence manipulations on FA bioconversion to vanillin. (a) Media 1 without CSL. (b) Media 2 with CSL.
Chemengineering 08 00068 g001
Figure 2. Plots showing the influence of (a) CSL concentration, (b) FA concentration, (c) and pH on vanillin bioconversion.
Chemengineering 08 00068 g002
Figure 3. Plot of predicted value versus observed values.
Chemengineering 08 00068 g003
Figure 4. Plots of surface regression models with accompanying contours showing the interactions between (a) FA and CSL, (b) pH and CSL, and (c) pH and FA to vanillin yield.
Chemengineering 08 00068 g004aChemengineering 08 00068 g004b
Figure 5. (a) Bar graph of desirability on numerical optimization of vanillin; (b) graph of the ramp function.
Chemengineering 08 00068 g005aChemengineering 08 00068 g005b
Table 1. Factors and their levels of Box–Behnken design.
ParametersNotationRange of Values Coded
−101
Corn steep liquor (g/L)X1369
Ferulic acid (g/L)X20.51.52.5
pHX38.59.09.5
Table 2. RSM Box–Behnken design experimental setup and results.
Experiment OrderCSLFApHObserved
Vanillin
Predicted
Vanillin
Residual
(g/L)(g/L)(mg/L)(mg/L)
131.59.5260.00260.62−0.62
261.59300.00300.000.00
330.59150.00154.00−4.00
460.59.5230.00225.374.63
531.58.5170.00160.629.38
661.59300.00300.000.00
762.59.5380.00374.635.38
892.59350.00346.004.00
961.59300.00300.000.00
1091.58.5210.00209.370.63
1132.59250.00254.75−4.75
1290.59200.00195.254.75
1360.58.5126.00131.37−5.37
1462.58.5229.00233.63−4.63
1591.59.5335.00344.37−9.37
1661.59300.00300.000.00
1761.59300.00300.000.00
Table 3. Analysis of variance table for vanillin production.
SourceSum of SquaresdfMean SquareF-Valuep-Value
Model81,934.899103.9179.9<0.0001
X1-CSL8778.118778.1173.5<0.0001
X2-FA31,626.1131,626.1624.9<0.0001
X3-pH27,612.5127,612.5545.6<0.0001
CSL.FA625.01625.012.40.0098
CSL.pH306.31306.36.10.0435
FA.pH552.31552.310.90.0131
CSL23789.513789.574.9<0.0001
FA24447.414447.487.9<0.0001
pH22901.312901.357.30.0001
Residual354.3750.6
Lack of Fit354.33118.1
Pure Error0.040.0Pred-R20.931
Cor Total82,289.0616 Adeq precision44.583
SD7.11R20.995
% CV2.75Adjusted-R20.990
Table 4. Biotransformation of vanillin from ferulic acid using nitrogen sources.
FA
(g/L)
OrganismVanillin
(mg/L)
Percentage Molar YieldNitrogen SourceAuthor
0.6B. subtilis B7–S0.160.03Peptone and yeast extract[15]
1.0Bacillus coagulans16.82.14Yeast extract[30]
1.0B. aryabhattai BA03147.118.81Yeast and beef extract[11]
1.0Pycnoporous cinnabarinus12616.08Corn steep liquor[5]
2.33Bacillus amyloliquefaciens subsp.38621.14Corn steep liquorThis study
Disclaimer/Publisher’s Note: The statements, opinions and data contained in all publications are solely those of the individual author(s) and contributor(s) and not of MDPI and/or the editor(s). MDPI and/or the editor(s) disclaim responsibility for any injury to people or property resulting from any ideas, methods, instructions or products referred to in the content.

