Article

Enhanced Oxygen Vacancy Formation in CeO2-Based Materials and the Water–Gas Shift Performance

by
Sangaroon Kaewtong
1,
Thanathon Sesuk
2 and
Pannipa Tepamatr
3,*
1
Faculty of Education, Chulalongkorn University, Bangkok 10330, Thailand
2
National Energy Technology Center, NSTDA, Pathumthani 12120, Thailand
3
Department of Chemistry, Faculty of Science and Technology, Thammasat University, Pathumthani 12120, Thailand
*
Author to whom correspondence should be addressed.
ChemEngineering 2024, 8(4), 79; https://doi.org/10.3390/chemengineering8040079
Submission received: 12 March 2024 / Revised: 19 July 2024 / Accepted: 29 July 2024 / Published: 2 August 2024

Abstract

:
The role of dopants (Sm, Tb and Pr) on the water–gas shift performance of CeO2-based materials was studied. Modification of CeO2 with Sm significantly improved the water–gas shift performance. The catalytic activities of doped CeO2 were increased when compared with the catalytic activities of pure ceria (65% conversion at 600 °C for Ce5%SmO and 50% conversion at 600 °C for CeO2). The key factors driving the water–gas shift performance were reduction behavior and oxygen vacancy concentration. In the redox mechanism of the WGS reaction, CeO2 plays a crucial role in transferring oxygen to CO through changes in the oxidation state. Therefore, Sm is effective in catalyzing the water–gas shift activity because the addition of Sm into CeO2 decreases the surface reduction temperature and alters the oxygen transportation ability through the redox mechanism. XRD results suggested that Mn+ (M = Sm, Tb and Pr) incorporate into ceria lattice to form a solid solution resulting in unit cell enlargement. The defect structure inside the CeO2 lattice generates a strain on the oxide lattice and facilitates the generation of oxygen vacancies. XANES analysis revealed that Sm reduced CeO2 easily by transporting its electron into the d-orbitals of Ce, thus giving rise to more Ce3+ at the CeO2 surface. The presence of Ce3+ is a result of oxygen vacancy. Therefore, the high content of Ce3+ provides more oxygen vacancies. The oxygen vacancy formation results in easy oxygen exchange. Thus, reactive oxygen species can be generated and easily reduced by CO reactant, which enhances the WGS activity.

1. Introduction

Generally, the most feasible way to produce H2 from hydrocarbon fuels includes a reforming step to create a mixture of syngas, CO2 and H2O followed by a water–gas shift reaction and CO clean-up steps. Water–gas shift reaction (WGS) is a crucial step for preliminary CO removal and additional H2 formation prior to the final CO removal stage. This process can reduce CO levels to <1% [1,2]. The presence of carbon monoxide in a PEM fuel cell causes anode catalyst poisoning and then performance loss. The redox mechanism for the water–gas shift reaction by transfer of oxygen from CeO2 to the metal interface and re-oxidation of CeO2 is still under discussion [3,4]. This mechanism requires a redox species on the catalyst. CeO2 material is a good choice for the water–gas shift reaction since it may exist in several oxidation states, stabilizing the surface area and improving the metal dispersion. In this sense, metal-doped CeO2 materials have been interesting for a long time in view of their greater oxygen storage capacity and better reducibility than pure CeO2. Furthermore, the addition of some metals with valences lower than +4 into CeO2 can increase the concentration of oxygen vacancies and improve the thermal stability. The presence of promoters can improve the water–gas shift activity of CeO2 by increasing reducibility, resistance to sintering and oxygen storage capacity [5,6,7].
In a previous study [8], it was found that the water–gas shift activity of CeO2-based materials depends on the nature of the dopant. The Yb-promoted catalyst is more active than other catalysts. The oxygen mobility and reducibility of the CeO2 materials affects the enhancement of the water–gas shift activity. Ce–Sm–O mixed oxide promoted by Pt is an active catalyst for methane-selective oxidation to produce syngas. This result is due to the high mobility and reactivity in redox cycles. The structural characteristics of CeO2-based materials depends upon the Sm content due to the rearrangement in the lattice. The highest performance is dominated by surface oxygen vacancies [9]. In addition, the enhancement of water–gas shift performance of Sm- and Zn-doped CuO/CeO2 catalysts is due to enhanced BET surface area, decreased CeO2 particle size and increased reducibility. The addition of Sm and Zn preserves high Cu dispersion during catalytic reaction [10].
The choice of the catalyst support material is another important aspect influencing the catalytic activity. Generally, metal oxides with high specific surface area (such as CeO2, Al2O3 and ZrO2) are used for the water–gas shift reaction to provide high dispersion of active sites [11]. The Ce rare earth metal has also received great attention due to its high oxygen storage capacity. Moreover, cerium abundance, as well as its lower costs compared to precious metals, makes it highly competitive. CeO2-based catalysts are widely used in commercial applications such as the three-way catalyst for CO oxidation and NOx reduction and a dehydrogenation catalyst in styrene formation [12]. In past decades, a CeO2/Al2O3 catalyst was employed to investigate the oxidation of in situ-produced coke during C2H2 pyrolysis. CeO2/Al2O3 exhibited greater resistance to coking compared to unsupported ceria. In addition, it could oxidize coke at a much lower temperature [13]. In another study, ceria synthesized by different methods (hard template, complex and precipitation) was investigated for CO2 reduction. It was found that all catalysts had 100% CO selectivity, while CeO2 synthesized by the hard template method exhibited the highest CO2 conversion with 16% at 580 °C. Furthermore, CeO2 synthesized by reverse microemulsion was studied for reverse water–gas shift reaction, demonstrating 100% CO selectivity and maximum 66% conversion at 600 °C [14]. The reverse microemulsion synthesis resulted in the generation of smaller sized CeO2 particles and also hindered the growth and agglomeration of nanoparticles.
Although the water–gas shift reaction has been extensively investigated, there are limited papers on the water–gas shift performance of doped CeO2 catalysts. Therefore, in this study, the role of Sm, Tb and Pr on the catalytic properties of the active (CeO2) phase for the water–gas shift reaction was observed. CeO2 doped with trivalent rare earth oxides (Sm, Pr and Tb) were synthesized using the urea gelation method. The results show that enhanced water–gas shift activity of the ceria catalyst could be achieved by the modification of certain rare earth oxides, which relates well with the information (such as specific surface area, particle size, oxygen vacancy, reducibility) from BET surface area, X-ray diffraction, H2-TPR, Raman spectroscopy and XANES analysis.

2. Experimental Procedure

2.1. Preparation of Catalysts

CeO2 and Ce–M–O (M = Sm, Pr and Tb) were prepared using the urea gelation method. An appropriate amount of metal salt (Ce(NO3)3.6H2O, and Tb(NO3)3.6H2O or Pr(NO3)3.6H2O or Sm(NO3)3.6H2O) was dissolved in deionized water. The mixture was stirred and heated at ~120 °C. The urea (H2NCONH2, 98%, Sigma-Aldrich, Pte. Ltd., Singapore) was dissolved in DI water and then added to the metal salt solution. To obtain precipitate, ammonium hydroxide was added at the rate of 1 mL/min. The suspension was further stirred and heated for 4 h to eliminate NH3 and age the support. Then, the sample was dried at ~105 °C for 12 h in an oven and followed by calcination at 450 °C for 4 h.

2.2. Catalyst Characterization

A PerkinElmer inductive coupled plasma optical emission spectrometer (optima 2100 DV) was used for measurement of the real composition of CeO2-based materials. The spectrometer is equipped with a 40 MHz free-running oscillator for driving the radial plasma, an echelle grating for wavelength separation and grid nebulizer for sample aspiration.
SEM image analysis was used to study the surface morphology of CeO2-based materials. Samples were placed by spreading them on a carbon tape. Then, the powder was sputter-coated with gold at 30 kV and examined with an FE-SEM (HITACHI SU-8030). Energy dispersive X-ray spectroscopy (EDX) was used together with an SEM to obtain elemental and structural details.
The BET surface area was determined by N2 adsorption–desorption isotherms at 77.3 K on a catalyst analyzer BELSORP-MAX instrument (ITS Co. Ltd., Bangkok, Thailand).
The reduction behaviors were determined by H2-temperature programmed reduction on a BELCAT–B instrument (ITS Co. Ltd., Bangkok, Thailand).. The sample (about 0.20 g) was loaded into the reactor and then purged with high purity He at 120 °C for 30 min. The analysis was performed using reducing gas (5% H2/95% N2) at a rate of 10 °C/min in the range of 50–1000 °C.
The crystalline structure was examined by power X-ray diffraction on an Advance Series 2 diffractometer with CuKα radiation (0.15406 nm), operating at 20 kV and 5 mA. The analysis was performed at 0.02° per step and 0.5 s per step over a 2θ range of 20–80°. The crystallite size was calculated using Scherrer’s equation.
D = 0.9λ/βcosθ
where D is the crystallite size, λ is the CuKα radiation wavelength, β is full-width at half maximum and θ is the diffraction angle.
The Raman spectra of CeO2-based materials were investigated by PerkinElmer System 2000 FT–IR/FT–Raman and collected from 100 to 1400 cm−1. The samples were irradiated with Ar ion laser at the wavelength of 532 nm and an output power of 10 mW.
The Ce oxidation states in each sample were investigated using the XANES technique. The transmission mode was used for Ce L3 absorption edge measurement. The Kapton window was used to place the sample. The ion chambers contained a mixture of He and Ar. The incident (I0) and transmitted (I1) X-ray beams were detected by installing ion chambers in front of and behind the sample.

2.3. Water–Gas Shift Activity

About 0.1 g of the sample was loaded into a Pyrex fixed bed flow reactor. Preliminary studies were conducted to determine suitable conditions from which internal and external mass transfer effects are not predominant. When determining the effect of external mass transfer, the total flow rate was maintained at 100 mL min−1 in all experiments. In addition, the particle size diameter of the catalyst was 100–200 µm in all tests. The feed gas contained 5% CO, 10% H2O and balance helium. The reactants and products were identified by on-line gas chromatography with thermal conductivity detector and a Hayesap D column. The %CO conversion was measured in the range of 100–600 °C under atmospheric pressure and calculated by the following equation:
% C O conversion = C O in C O out C O in × 100
where COin and COout are the inlet and outlet CO molar flow rate, respectively.

3. Results and Discussion

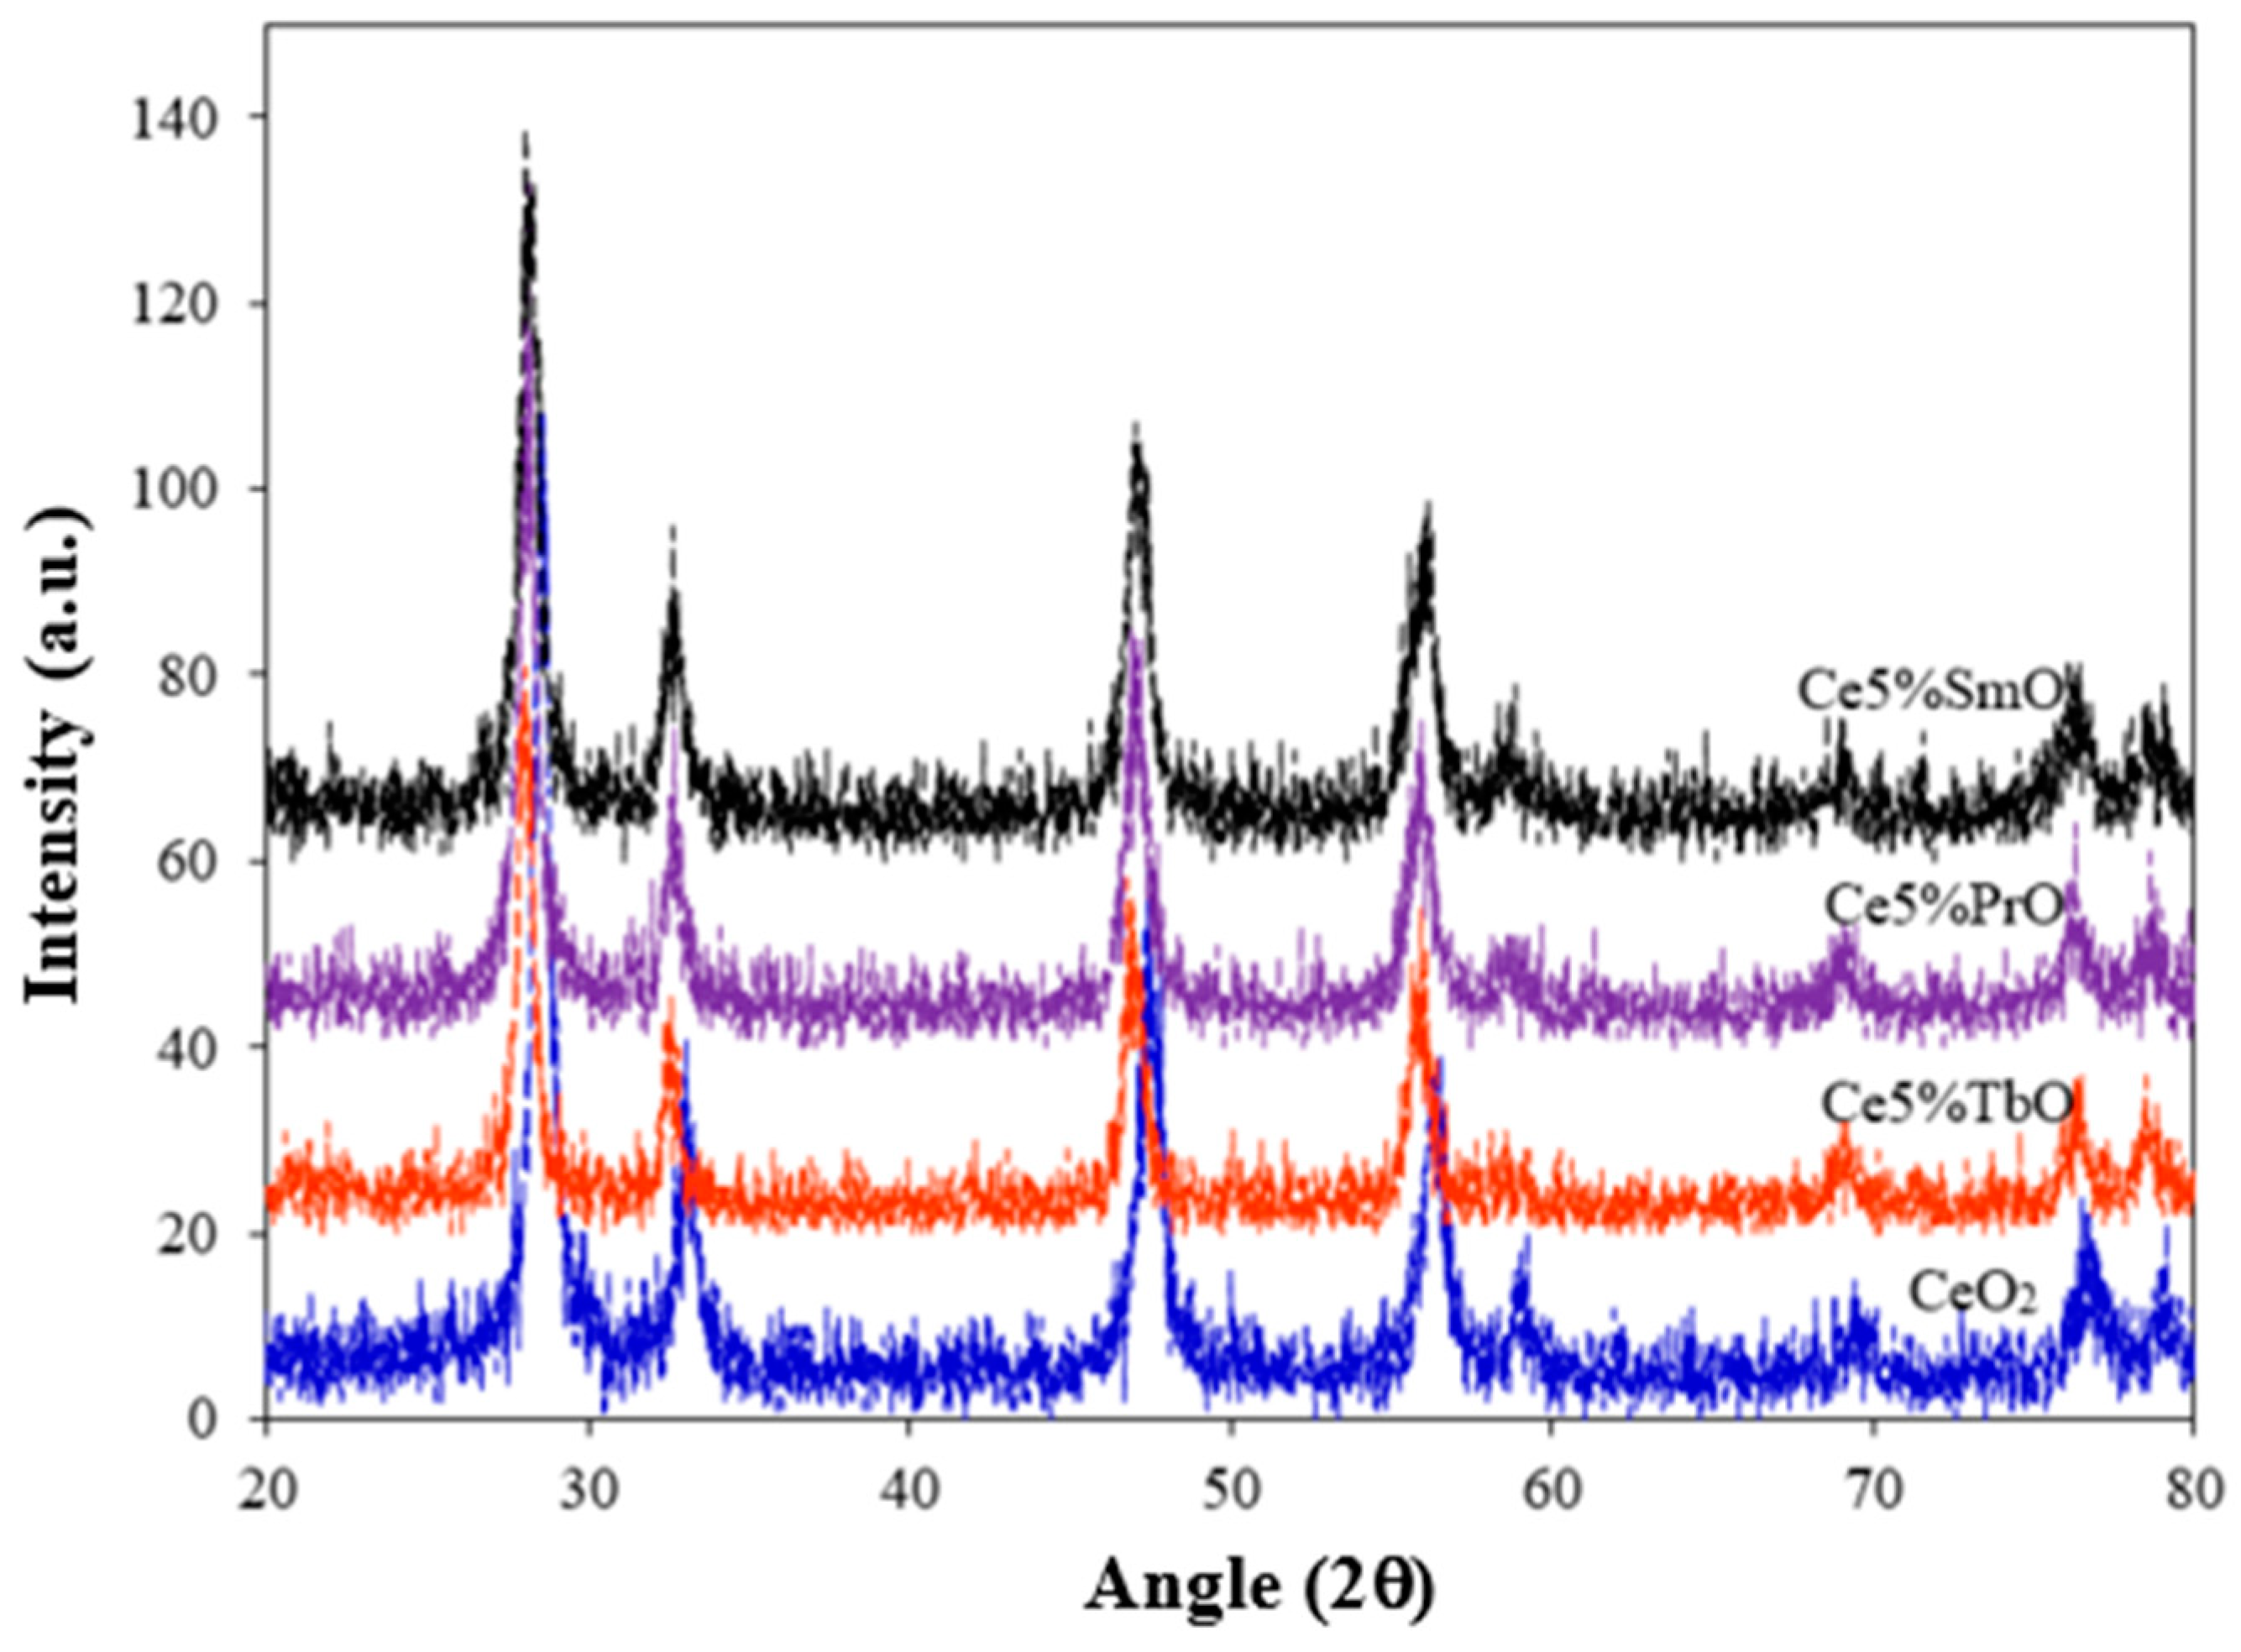
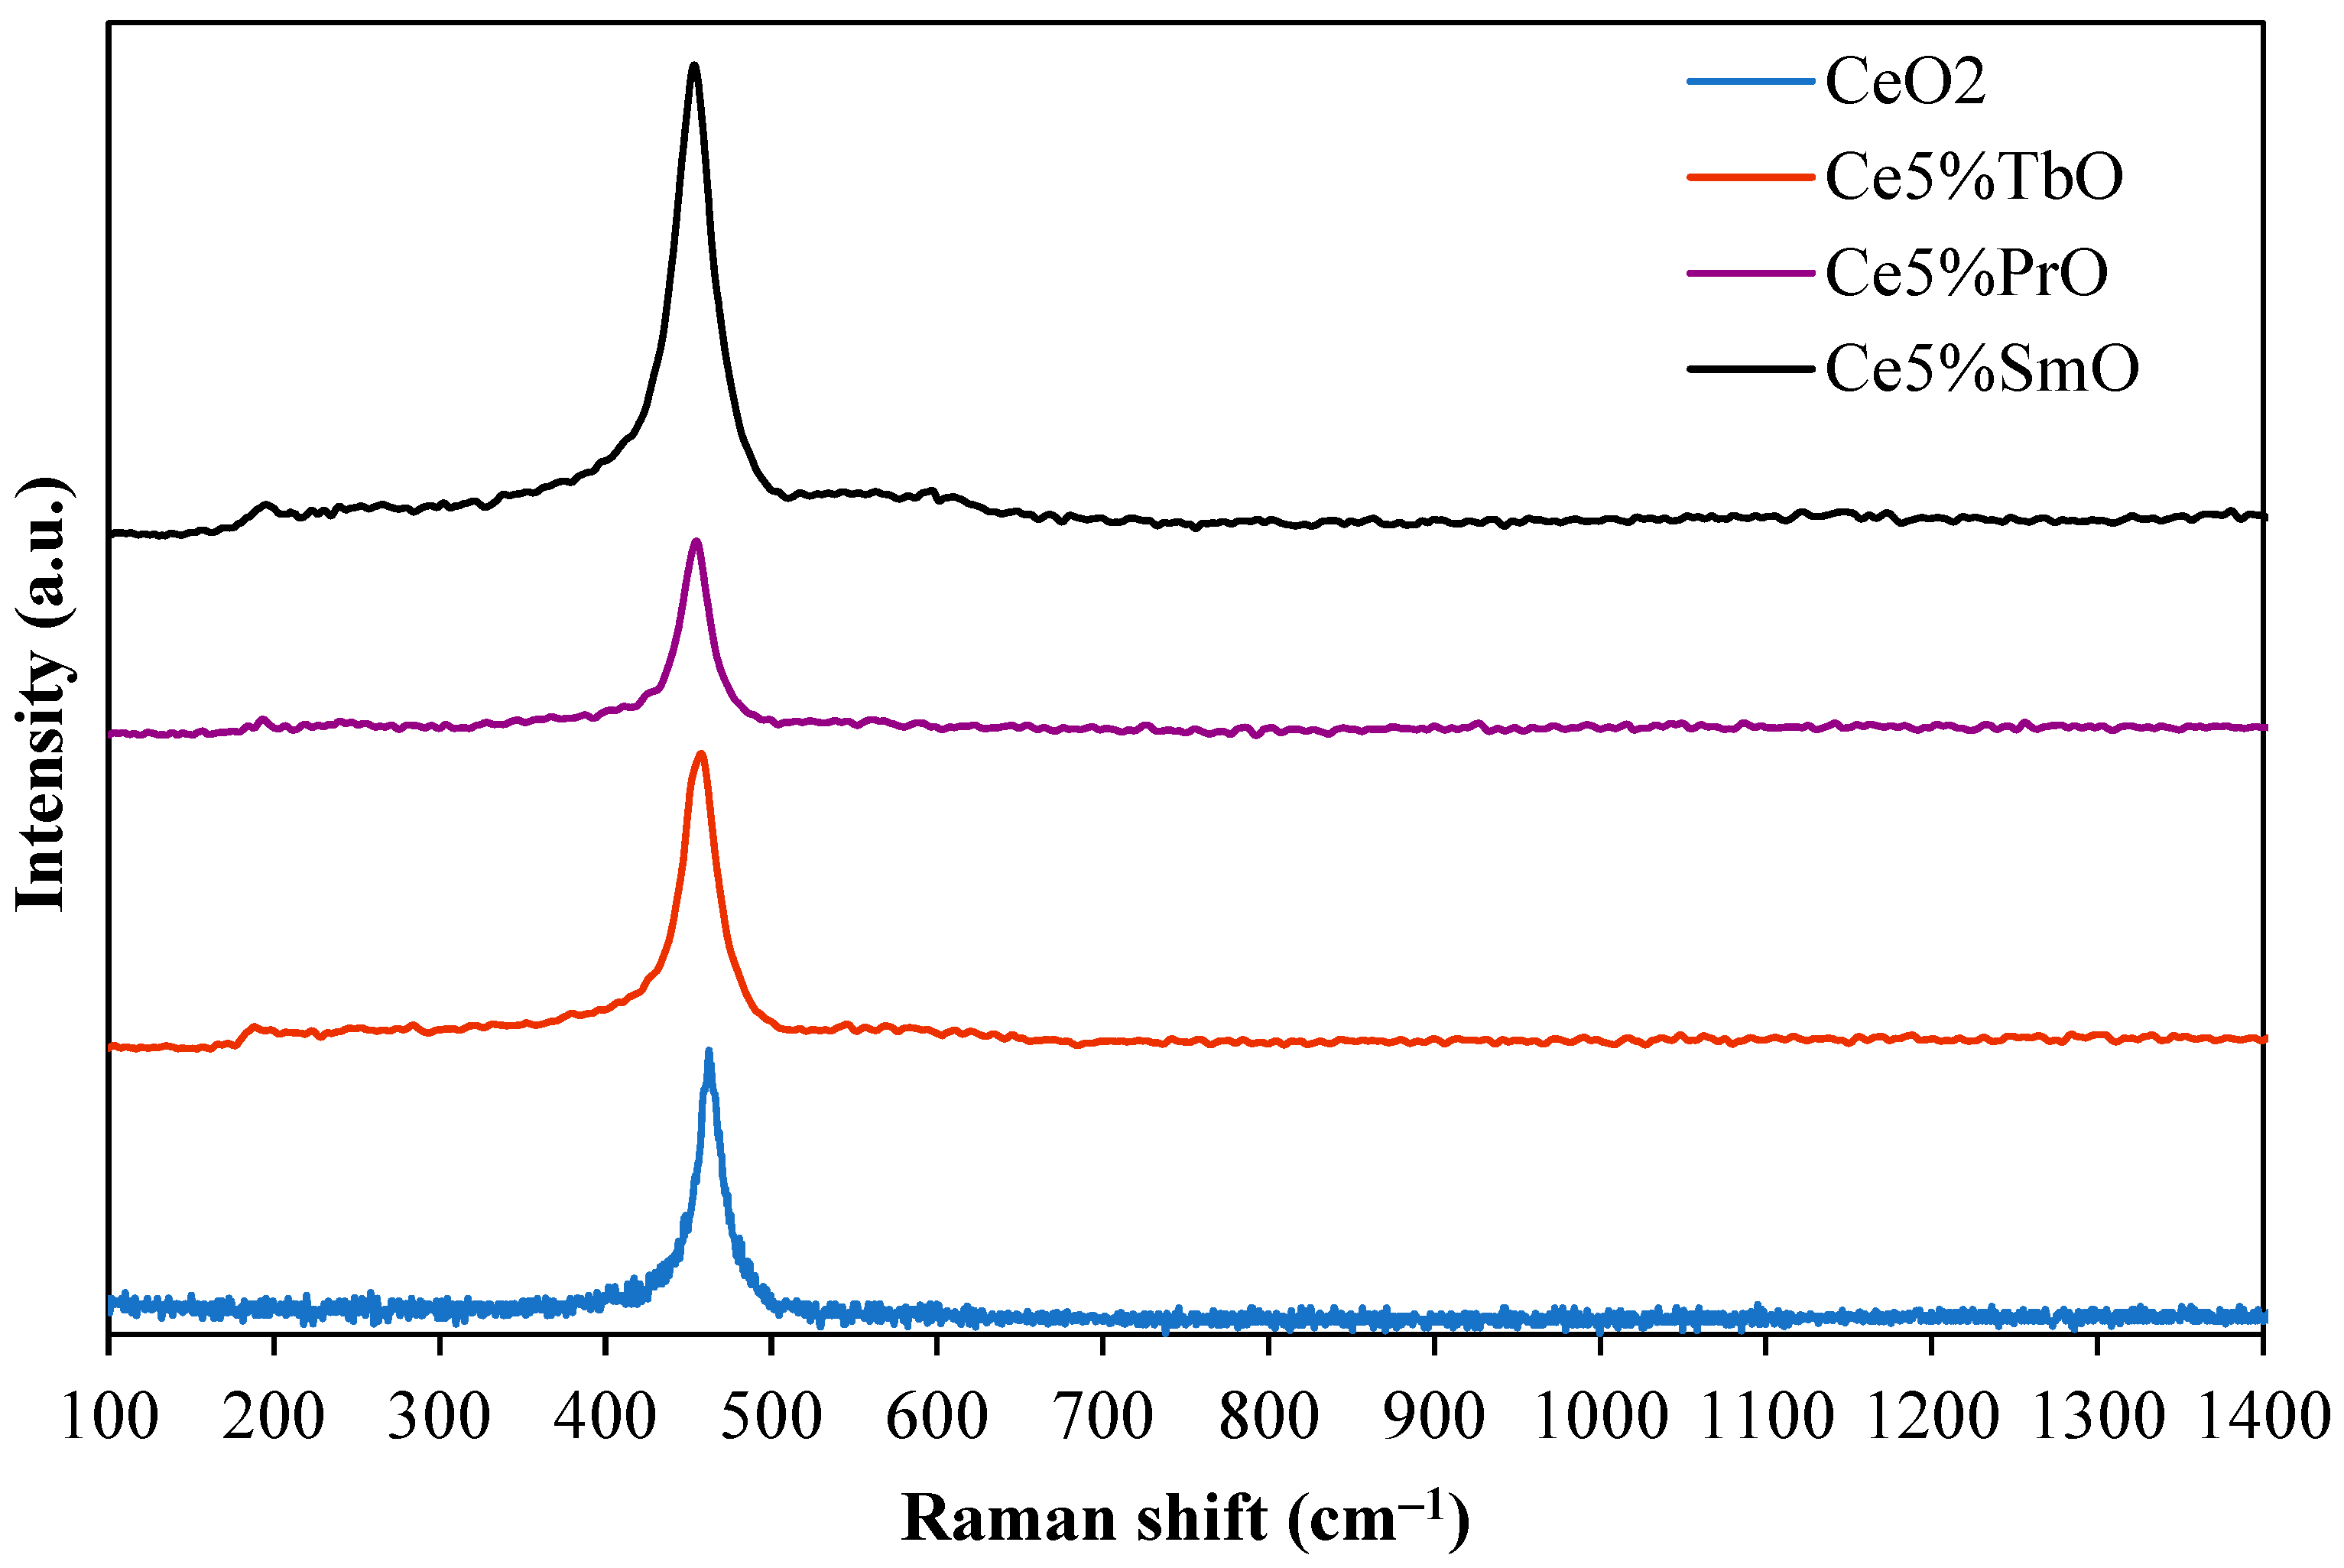
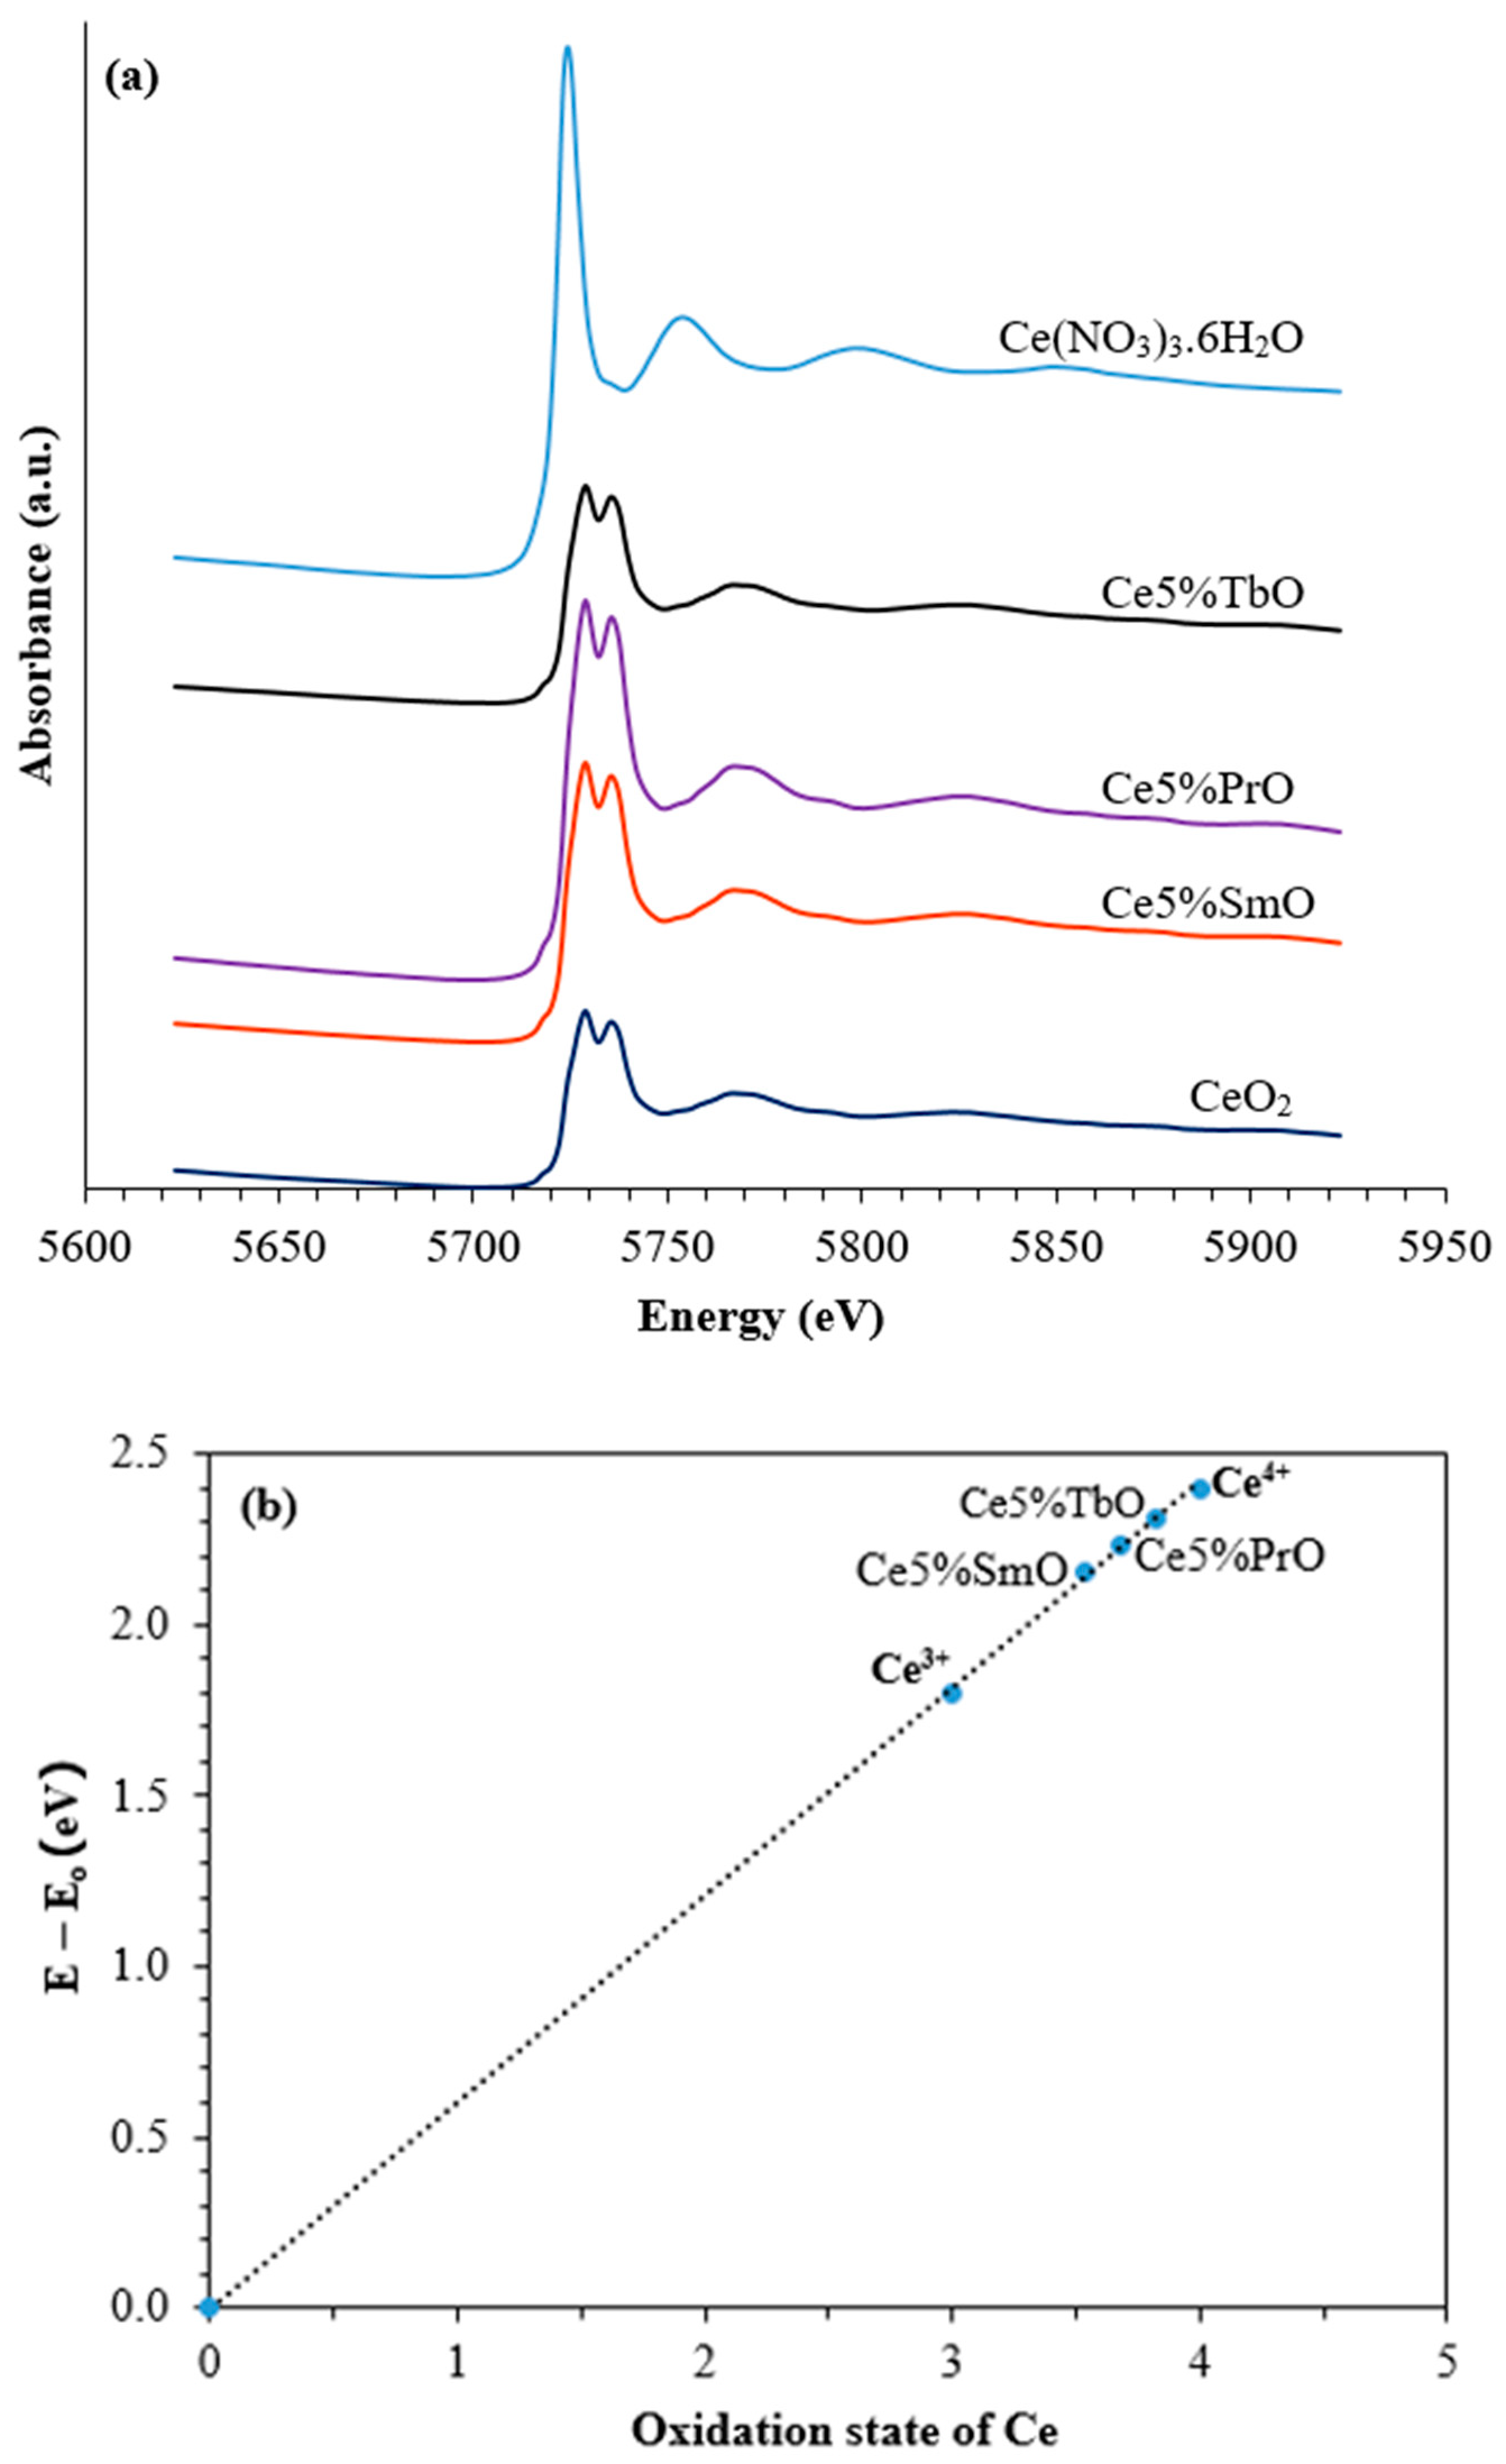
3.1. Characterization of Catalysts

The XRD patterns of CeO2 and doped ceria are presented in Figure 1. Ceria appears to be phase-pure with the cubic crystal structure. The diffraction peaks of all samples correspond to the cubic ceria fluorite type. The absence of other oxide reflections in M-doped ceria (M = Sm, Tb and Pr) indicates that these metals incorporate into the subsurface region of CeO2 lattice to form a solid solution. The lattice parameter (Table 1) is calculated from an X-ray line broadening at ~28°. The result reveals that the lattice constant of CeO2 (0.5412 nm) is smaller than that of doped CeO2. The diffraction peaks of M-doped ceria (M = Sm, Tb and Pr) are slightly shifted to lower angles due to the substitution of Ce4+ by larger cations. The shift effect to lower angles suggests unit cell enlargement. The increase in lattice parameters indicates that Ce4+ ions are replaced by larger cations. Comparison of ionic radii of Ce4+ (0.097 nm), Sm2+ (0.111 nm) and Sm3+ (0.108 nm) indicated that the dopant ions exhibited in the CeO2 lattice should be either Sm2+ or Sm3+ or a combination of both. The oxidation state of Sm can be investigated using another advanced analytical technique such as XAS. However, samarium oxidation state should be Sm3+ under calcination temperature. It should be mentioned that Sm ions incorporation in CeO2 lattice generates a strain and unbalanced charges, thereby, oxygen vacancies are produced.
Tb, Pr, and Sm content in catalysts are determined using ICP-OES technique and the results are shown in Table 1. The actual content of metal quoted in Table 1 is close to the design for each catalyst. The CeO2 crystallite sizes are calculated from (111) crystallographic plan using Scherrer’s equation which is summarized in Table 1. Doping CeO2 with 5 wt.% samarium results in a decrease in crystallite size and pore diameter. The result suggests that Sm3+ addition inhibits the crystal growth of CeO2. A smaller crystallite size is associated with an increase in the specific surface area.
Scanning Electron Microscope (SEM) micrographs of the fresh CeO2 and Ce5%SmO catalysts with the corresponding elemental mapping of Ce and Sm are shown in Figure 2. The elemental mapping reveals that the Ce and Sm species homogeneously distributed. In the image of the Sm-doped CeO2 sample, fewer large particles can be observed compared to the image of the CeO2 sample.
Raman spectra of CeO2 and Ce–M–O mixed oxides (M = Sm, Tb and Pr) are presented in Figure 3. The Raman spectrum of ceria appears as a single sharp band at 462 cm−1 which is assigned to the Raman active triply degenerate F2g mode [15]. A fluorite structure of ceria exhibits symmetrical stretching vibrations of oxygen atoms surrounding the cerium cation. In Ce–M–O (M = Sm, Tb and Pr) mixed oxide materials, F2g mode shifts to lower energies due to the incorporation of large cations in the CeO2 lattice. In addition, the Raman bands at ~550 cm−1 can be seen with the addition of Sm, Tb or Pr to CeO2. This mode is ascribed to the extrinsic oxygen vacancies induced by the replacement of Ce4+ ions with Mn+ ions (M = Sm, Tb and Pr) in order to maintain charge neutrality [16]. Furthermore, the intensity of this mode increases when Sm is added into CeO2. Therefore, the incorporation of Sm into CeO2 lattice leads to an increase in oxygen vacancies and Ce3+ sites.
Figure 4 illustrates the TPR profiles of CeO2-based materials. For CeO2, there are two small reduction peaks at 506 °C and 780 °C which are contributed by the reduction in the surface region and bulk CeO2, respectively. For Ce–Pr–O and Ce–Sm–O mixed oxides, the presence of Sm or Pr increases H2 consumption and shifts the surface reduction to lower temperatures. Ce–Sm–O mixed oxides sample exhibits the lowest surface reduction temperature. Normally, the oxygen vacancy formation results in easy oxygen exchange. Thus, reactive oxygen species can be generated and easily reduced by hydrogen at low temperature. The combination of Raman and TPR results found that Sm addition improves the oxygen vacancies and the reduction of solid solutions.
From the comparison of H2 consumption between CeO2 (0.88 mmol/g) and doped CeO2 (0.77–0.92 mmol/g) catalysts, it was found that the addition of Sm and Pr enhanced H2 consumption (Table 2), suggesting an increase in reducibility of ceria catalyst. This result implies that Sm and Pr assist in reducing CeO2 and lead to the enrichment of Ce3+ at the CeO2 surface, which gives rise to oxygen vacancies. This simplifies the movement of electron at the surface, thus increasing easier surface reduction.
The electron movement within CeO2-based materials was studied using the X-ray absorption near edge structure (XANES) technique to explain the role of Sm, Tb and Pr in increasing the water–gas shift activity of ceria. XANES spectra and the edge energy shift of Ce5%SmO, Ce5%TbO, Ce5%PrO, Ce(NO3)3.6H2O and CeO2 relative to the Ce0 edge energy are presented in Figure 5. XANES spectra of standard Ce(NO3)3.6H2O (Figure 5a) presents a single white line at 5725.4 eV. The edge energy is the energy required to raise electrons up from their core level to the unoccupied valence band. The edge energy of standard Ce0, Ce3+ and Ce4+ is plotted against its oxidation states (Figure 5b). The edge energy shifts of Ce5%SmO, Ce5%TbO, Ce5%PrO relative to standard Ce0 are placed on this straight line. The Ce oxidation states in these samples lay between +3 and +4. Moreover, the Ce oxidation state in Ce5%SmO compound is the lowest. The results suggest that Sm reduced CeO2 easily by transporting its electron into d-orbitals of Ce and giving rise to more Ce3+ at the CeO2 surface.

3.2. Water–Gas Shift Performance

Figure 6a compares the activity of CeO2 and Ce-M-O mixed oxides (M = Sm, Tb and Pr). It appears that CeO2 has weak water–gas shift activity. The addition of Sm and Pr to CeO2 shows a sharp increase in %CO conversion at 300–600 °C. The water–gas shift activity of Sm-doped CeO2 is slightly higher than that of pure CeO2. The CO conversion starts above 300 °C and rises quickly to 65% conversion at about 600 °C. The effectiveness of samarium in increasing the water–gas shift performance can be explained by H2–TPR. In this redox mechanism, CeO2 plays a crucial role in transferring of oxygen to CO through changes in oxidation state. H2–TPR of CeO2 indicates that the oxygen transferring process occurs at 506 °C. However, the surface reduction decreases to 366 and 475 °C when Sm was anchored into CeO2. Therefore, Sm is effective in catalyzing the water–gas shift activity because the addition of Sm into CeO2 decreases the surface reduction temperature and alters the oxygen transportation ability through redox mechanism.
Figure 6b exhibits the effect of reaction time on CO conversion of Ce5%SmO catalyst in the period of 10 h at 500 °C and catalyst weight of 100 mg. The result presents that CO conversion increased slightly from 46.1% to 49.4% when the reaction time increased from 1 to 4 h. Further increases in reaction time slightly decreases the CO conversion. Thus, the reactant can cross the energy barrier to convert the CO to CO2 in 4 h with a maximum CO conversion of 49.4%.
The Ce5%SmO catalyst was recycled in batch mode experiments under similar reaction conditions (temperature = 500 °C; reaction time = 4 h; catalyst weight = 100 mg, a feed gas composition of 5%CO, 10%H2O and balance He) to study the stability of H2 production system (Figure 6c). The Ce5%SmO catalyst exhibits excellent stability (between 48.6 and 46.8% for five catalytic cycles) without significant loss of CO conversion. Therefore, WGS performance of this catalyst was unaffected in recycling tests with the total reaction duration of 20 h.

4. Conclusions

A modification of structural and catalytic properties of CeO2 with Sm, Tb and Pr was studied. The incorporation of large Sm3+ cations into CeO2 lattice leads to unit cell enlargement, crystallite size reduction and surface area enhancement. Unbalanced changes inside the lattice induce oxygen mobility. In WGS redox mechanism, CeO2 plays a crucial role in transferring of oxygen to CO reactant through changes in oxidation state. It is believed that oxygen transferring is an important step in the water–gas shift mechanism. The presence of oxygen vacancies is the main reason for the improvement in the reduction and re-oxidation behavior in CeO2-based materials. The water–gas shift activity of Sm-doped CeO2 (65% conversion at 600 °C) is higher than other catalysts and retains high activity and stability in recycling tests with the total reaction duration of 20 h. Sm is effective in catalyzing the water–gas shift reaction because the addition of Sm into CeO2 decreases the surface reduction temperature and alters the oxygen transportation ability through the redox mechanism. XANES analysis revealed that Sm reduced the CeO2 easily by transporting its electron into d-orbitals of Ce resulting in an increase in Ce3+ content at the CeO2 surface. The presence of Ce3+ is a result of oxygen vacancy. Therefore, reactive oxygen species can be generated and easily reduced by CO reactant, which enhances the WGS activity.

Author Contributions

Conceptualization, P.T.; methodology, S.K., T.S. and P.T.; validation, T.S. and P.T.; formal analysis, T.S. and P.T.; investigation, S.K., T.S. and P.T.; resources, T.S. and P.T.; data curation, P.T.; writing—original draft preparation, P.T.; writing—review and editing, P.T.; visualization, S.K. and P.T.; funding acquisition, P.T. All authors have read and agreed to the published version of the manuscript.

Funding

The author gratefully acknowledges the financial support provided by Faculty of Science and Technology, Thammasat University, Contract No. SciGR 25/2566 and Thammasat University Research Unit in smart materials from biomass, Thailand.

Data Availability Statement

Data are contained within the article.

Conflicts of Interest

The authors declare no conflict of interest.

References

  1. Mendes, D.; Mendes, A.; Madeira, L.M.; Iulianelli, A.; Sousa, J.M.; Basile, A. The water-gas shift reaction: From conventional catalytic systems to Pd-based membrane reactors—A review. Asia-Pac. J. Chem. Eng. 2010, 5, 111–137. [Google Scholar] [CrossRef]
  2. Zhou, F.; Andreasen, S.J.; Kær, S.K.; Park, J.O. Experimental investigation of carbon monoxide poisoning effect on a PBI/H3PO4 high temperature polymer electrolyte membrane fuel cell: Influence of anode humidification and carbon dioxide. Int. J. Hydrogen Energy 2015, 40, 14932–14941. [Google Scholar] [CrossRef]
  3. Gokhale, A.A.; Dumesic, J.A.; Mavrikakis, M. On the Mechanism of Low-Temperature Water Gas Shift Reaction on Copper. J. Am. Chem. Soc. 2008, 130, 1402–1414. [Google Scholar] [CrossRef]
  4. Grabow, L.C.; Gokhale, A.A.; Evans, S.T.; Dumesic, J.A.; Mavrikakis, M. Mechanism of the water gas shift reaction on Pt: First principles, experiments, and microkinetic modeling. J. Phys. Chem. C 2008, 112, 4608–4617. [Google Scholar] [CrossRef]
  5. Lomonaco, J.G.; Sesuk, T.; Charojrochkul, S.; Tepamatr, P. Effect of Re addition on the water–gas shift activity of Ni catalyst supported by mixed oxide materials for H2 production. Catalysts 2023, 13, 959. [Google Scholar] [CrossRef]
  6. Tojira, O.; Tepamatr, P. Catalytic activity of Ni based materials prepared by different methods for hydrogen production via the water gas shift reaction. Catalysts 2023, 13, 176. [Google Scholar] [CrossRef]
  7. Tepamatr, P.; Buarod, E.; Laosiripojana, N.; Charojrochkul, S. Study of water gas shift reaction over ceria based catalysts in solid oxide fuel cells. ECS Trans. 2015, 68, 1207–1217. [Google Scholar] [CrossRef]
  8. Panagiotopoulou, P.; Papavasiliou, J.; Avgouropoulos, G.; Ioannides, T.; Kondarides, D.I. Water–gas shift activity of doped Pt/CeO2 catalysts. Chem. Eng. J. 2007, 134, 16–22. [Google Scholar] [CrossRef]
  9. Sadykov, V.A.; Kuznetsova, T.G.; Alikina, G.M.; Frolova, Y.V.; Lukashevich, A.I.; Potapova, Y.V.; Muzykantov, V.S.; Rogov, V.A.; Kriventsov, V.V.; Kochubei, D.I.; et al. Ceria-based fluorite-like oxide solid solutions as catalysts of methane selective oxidation into syngas by the lattice oxygen: Synthesis, characterization and performance. Catal. Today 2004, 93–95, 43–53. [Google Scholar] [CrossRef]
  10. Tabakova, T.; Idakiev, V.; Papavasiliou, J.; Avgouropoulos, G.; Ioannides, T. Effect of additives on the WGS activity of combustion synthesized CuO/CeO2 catalysts. Catal. Commun. 2007, 8, 101–106. [Google Scholar] [CrossRef]
  11. Yang, S.C.; Pang, S.H.; Sulmonetti, T.P.; Su, W.N.; Lee, J.F.; Hwang, B.J.; Jones, C.W. Synergy between ceria oxygen vacancies and Cu nanoparticles facilitates the catalytic conversion of CO2 to CO under mild conditions. ACS Catal. 2018, 8, 12056–12066. [Google Scholar] [CrossRef]
  12. Trovarelli, A. Catalysis by ceria and related materials. In Catalytic Science Series: Volume 2; World Scientific Publishing: Singapore, 2002. [Google Scholar] [CrossRef]
  13. Mahamulkar, S.; Yin, K.; Claure, M.T.; Davis, R.J.; Li, L.; Shibata, H.; Malek, A.; Jones, C.W.; Agrawal, P.K. Thermally stable α-alumina supported ceria for coking resistance and oxidation of radical coke generated in-situ. Fuel 2018, 218, 357–365. [Google Scholar] [CrossRef]
  14. Dai, B.; Cao, S.; Xie, H.; Zhou, G.; Chen, S. Reduction of CO2 to CO via reverse water-gas shift reaction over CeO2 catalyst. Korean J. Chem. Eng. 2017, 35, 421–427. [Google Scholar] [CrossRef]
  15. Vinodkumar, T.; Rao, B.G.; Reddy, B.M. Influence of isovalent and aliovalent dopants on the reactivity of cerium oxide for catalytic applications. Catal. Today 2015, 253, 57–64. [Google Scholar] [CrossRef]
  16. Mukherjee, D.; Rao, B.G.; Reddy, B.M. Characterization of ceria–based nano–oxide catalysts by Raman spectroscopy. Top. Catal. 2017, 60, 1673–1681. [Google Scholar] [CrossRef]
Figure 1. X-ray diffraction patterns of CeO2-based materials.
Chemengineering 08 00079 g001
Figure 2. Scanning Electron Microscope (SEM) image and elemental mapping of CeO2 and Ce5%SmO.
Chemengineering 08 00079 g002
Figure 3. Raman spectra of CeO2-based materials.
Chemengineering 08 00079 g003
Figure 4. H2–TPR profiles of CeO2-based materials.
Chemengineering 08 00079 g004
Figure 5. (a) XANES spectra of the Ce L3 absorption edge, and (b) the relationship between edge energy shift of Ce compounds and the oxidation states.
Chemengineering 08 00079 g005
Figure 6. Effect of reaction temperature (a) and reaction time (b) on %CO conversion of CeO2-based materials and stability test by recycling the catalyst in five consecutive batch mode reactions over Ce5%SmO catalyst (c).
Chemengineering 08 00079 g006
Table 1. Structural parameters of CeO2 and doped ceria.
CatalystsElementFound Metal Content a
(wt.%)
BET Surface Area b (m2/g)Average Pore
Diameter b (nm)
Crystallite Size c (nm)Lattice
Parameter c (nm)
CeO2 6413.4813.590.5412
Ce5%TbOTb4.95346813.3213.550.5483
Ce5%PrOPr4.88226414.1216.130.5504
Ce5%SmOSm4.9248959.5413.430.5505
a Estimated from ICP-OES analysis, b estimated from N2 adsorption at –196 °C, c calculated from the 111 diffraction peak broadening.
Table 2. H2 consumption of ceria-based catalysts.
CatalystsH2–TPR Peak Position (°C)H2 Consumption (mmol/g)
CeO25060.88
Ce5%TbO5100.77
Ce5%PrO4800.90
Ce5%SmO366, 4750.92
Disclaimer/Publisher’s Note: The statements, opinions and data contained in all publications are solely those of the individual author(s) and contributor(s) and not of MDPI and/or the editor(s). MDPI and/or the editor(s) disclaim responsibility for any injury to people or property resulting from any ideas, methods, instructions or products referred to in the content.

