Article

Assessing the Spatiotemporal Patterns and Impacts of Droughts in the Orinoco River Basin Using Earth Observations Data and Surface Observations

by
Franklin Paredes-Trejo
1,
Barlin O. Olivares
2,*,
Yair Movil-Fuentes
3,
Juan Arevalo-Groening
4 and
Alfredo Gil
4
1
National Observatory of the Climate Crisis, San Carlos Campus, University of the Western Plains Ezequiel Zamora, Cojedes 2201, Venezuela
2
Biodiversity Management Research Group (GESBIO-UCO), Rabanales Campus, University of Cordoba (UCO), Carretera Nacional IV, km 396, 14014 Cordoba, Spain
3
Department of Environmental Engineering, University of La Guajira, Riohacha, 440003 Guajira, Colombia
4
Department of Hydrometeorological Engineering, Central University of Venezuela, 1050 Caracas, Venezuela
*
Author to whom correspondence should be addressed.
Hydrology 2023, 10(10), 195; https://doi.org/10.3390/hydrology10100195
Submission received: 5 September 2023 / Revised: 30 September 2023 / Accepted: 2 October 2023 / Published: 4 October 2023
(This article belongs to the Special Issue Eco-Hydrological Process Response under Extreme Climatic Conditions)

Abstract

:
Droughts impact the water cycle, ecological balance, and socio-economic development in various regions around the world. The Orinoco River Basin is a region highly susceptible to droughts. The basin supports diverse ecosystems and supplies valuable resources to local communities. We assess the spatiotemporal patterns and impacts of droughts in the basin using remote sensing data and surface observations. We use monthly precipitation (P), air temperature near the surface (T2M), enhanced vegetation index (EVI) derived from Earth observations, and average daily flow (Q) data to quantify drought characteristics and impacts. We also investigated the association between drought and global warming by correlating the drought intensity and the percentage of dry area with sea surface temperature (SST) anomalies in the Pacific (Niño 3.4 index), Atlantic (North Atlantic Index [NATL]), and South Atlantic Index [SATL]) oceans. We evaluate the modulating effect of droughts on the hydrological regime of the most relevant tributaries by calculating the trend and significance of the regional standardized precipitation index (SPI) and percentage area affected by dry conditions. El Niño events worsen the region’s drought conditions (SPI vs. Niño 3.4 index, r = −0.221), while Atlantic SST variability has less influence on the basin’s precipitation regime (SPI vs. NATL and SATL, r = 0.117 and −0.045, respectively). We also found that long-term surface warming trends aggravate drought conditions (SPI vs. T2M anomalies, r = −0.473), but vegetation greenness increases despite high surface temperatures (SPI vs. EVI anomalies, r = 0.284). We emphasize the irregular spatial-temporal patterns of droughts in the region and their profound effects on the ecological flow of rivers during prolonged hydrological droughts. This approach provides crucial insights into potential implications for water availability, agricultural productivity, and overall ecosystem health. Our study underlines the urgent need for adaptive management strategies to mitigate the adverse effects of droughts on ecosystems and human populations. The insights derived from our study have practical implications for developing strategies to address the impacts of droughts and ensure the protection of this ecologically significant region.

1. Introduction

Among extreme weather events, drought stands out above the others for its difficult early arrest and dramatic impacts on natural and human systems [1]. Impacts usually manifest themselves beyond the end of the dry episode [2]. Dry periods in Cuba in March 2020, Paraguay in October 2020, Venezuela in March 2018 [3], Chile in August 2019 [4], and Colombia in September 2015 [5] are some examples of recent droughts with unprecedented impacts on different social, economic, and environmental sectors, revealing the lack of response capacity and adaptation to recurrent droughts that global climate models predict for the near future [6].
As a dry episode evolves, it usually affects different hydroclimatic variables (for example, precipitation, temperature, soil moisture, the greenness of the vegetation, and flow, among others), so its assessment and monitoring are usually carried out with quantitative indices, whose formulations take into account one or more of these variables to identify, on one hand, the start and end times of the event, and on the other, estimate its duration, intensity, and severity [7,8]. In this sense, each drought index requires a threshold that allows discrimination between a dry condition and a non-dry condition [9,10].
Due to its multiscale nature, the Standardized Precipitation Index (SPI) makes it possible to assess meteorological, agricultural, and hydrological droughts [11]. At this point, it should be noted that the reliability of the drought characteristics (duration, intensity, and severity) derived from a drought index depends to a large extent on the quality of the hydroclimatic information used and the density of the spatial coverage of the measuring equipment (e.g., rain gauges). This last requirement is key to monitoring the spatial extension of the dry event and, in turn, developing effective contingency plans [12]. Most developing countries (e.g., Venezuela and Colombia) have meteorological observation networks with deficient spatial coverage [13]. This limitation is being overcome with the use of hydroclimatic information derived from Earth observations, reanalysis, climate models, and multisource products, which in most cases have global coverage, moderate spatial and temporal resolution, and rigorous protocols of calibration and validation during their generation [14].
Venezuela has many hydrographic basins [15]; however, the Orinoco River is the largest, characterized by its transboundary nature (shared with Colombia), containing the second largest river in South America, an enormous wealth of fish, and large amounts of fishery [16,17]. The scientific literature reports that river ecosystems are particularly vulnerable to drought due to their negative effect on some species’ flow, migration cycles, and reproductive events [18]. Although some studies have evaluated the characteristics of droughts over some areas of the Orinoco River basin, both on the Colombian [19] and Venezuelan [20,21,22] sides, analysis of the entire Orinoco River basin, to the best of our knowledge, has not been previously addressed.
This study hypothesizes that intensifying droughts in the Orinoco River basin are negatively impacting river biodiversity and water resources, leading to ecological disturbances and challenges for conservation efforts. The objective of this study is to show the most relevant results of the assessment of droughts in the Orinoco River basin using the SPI based on information provided by earth observations together with other indices derived from reanalysis and global models and in situ hydrometric records from different sections of rivers located in both Colombia and Venezuela. Thus, it is expected to contribute to closing the knowledge gaps regarding (i) the association between the phenomenon of drought and global warming; (ii) the modulating effect of droughts on the hydrological regime of the most relevant tributaries; and (iii) the influence of dry conditions on different subsystems of the hydrological cycle in the basin.

2. Materials and Methods

2.1. Study Area

The Orinoco River basin covers a total area of 994,368 km2 (0.65° to 10.35° N; −60.33° to −74.92° W), of which 35.56% belong to Colombia and 64.44% to Venezuela (Figure 1a). The Guaviare and Meta rivers are the most relevant on the Colombian side, while the Apure, Caura, and Caroní are on the Venezuelan counterpart [16]. The elevation of the land varies from sea level in the Orinoco delta to 5380 m.a.s.l in Alto de Ritacuba in the Sierra Nevada del Cocuy of the Colombian Andes, with the average elevation being 358 m.a.s.l. (Figure 1b). The basin presents a wide variety of tropical climates, with classes Aw (tropical savannah) and Am (tropical monsoon) being predominant in the Köppen–Geiger climate classification system [23]. The precipitation regime is mostly unimodal and influenced by the intertropical convergence zone in synergy with different modes of oceanic–atmospheric variability, such as El Niño–Southern Oscillation (ENSO) [24]; however, local, orography and convective processes exert significant control over the spatial distribution of precipitation [25].
The main types of cover/land use in 2019 were forests and grasslands, which occupied 49% and 34% of the total area of the basin [26,27,28] (Figure 1c). The annual precipitation average is 2283 mm (Figure 1d); concentrated rains are observed between June and August, and a dry period from January to March. An isothermal temperature regime is dominant, with an average annual temperature equal to 24.88 °C [26]; February, March, and April are the warmest months. For the year 2020, a total population of 13,015,608 inhabitants was estimated, equivalent to 13.03 inhabitants per square kilometer [27].
Figure 1. The Orinoco River basin with the spatial distribution of (a) the main rivers of the hydrographic network; (b) the elevation of the terrain in meters above sea level; (c) the main land cover/uses; and (d) the average annual precipitation in mm/year for the period 2000–2019. The information displayed on the panes (a), (b), (c), and (d), respectively, were derived from the HydroSHEDS [29], Shuttle Radar Topography Mission (SRTM) images [30], the Copernicus Global Land Service Land Cover at 100 m (CGLS-LC100) [28], and Climate Hazards Group InfraRed Precipitation with Station data (CHIRPS) [31] data sets, respectively.
Hydrology 10 00195 g001

2.2. Observational Data and Data Based on Remote Sensing and Reanalysis

Monthly precipitation was extracted from the CHIRPS v2.0 precipitation product (Climate Hazards Group InfraRed Precipitation with Station, [31], available at https://www.chc.ucsb.edu/data (accessed on 5 April 2023), from which the SPI was derived, as explained in McKee et al. [32], at a monthly time scale and spatial resolution of 1/20° from January 1981 to September 2020. CHIRPS has been validated in Venezuela and Colombia, showing good performance in capturing the spatial and temporal variability of precipitation [33,34], which motivated its selection as a precipitation product.
The air temperature near the surface (T2M) was extracted from the fifth-generation global reanalysis ERA5-ECMWF (European Center for Medium-Range Weather Forecasts [35], available at https://cds.climate.copernicus.eu (accessed on 4 August 2023), which uses modeled and observational data as inputs in the processing route. The ERA5-ECMWF T2M has been used in recent large-scale climate change studies [36]. In this study, the mean monthly T2M is expressed in degrees Celsius, and its standardized anomalies (T2Ma) were used at a spatial resolution of 0.25°, covering from January 1981 to September 2020.
We obtained the soil surface moisture (SSM) data from the Global Land Data Assimilation System v2.1 (GLDAS), which assimilates satellite- and ground-based observational data into land surface models. GLDAS data are publicly available at https://ldas.gsfc.nasa.gov/gldas (accessed on 5 April 2023). We used the mean monthly SSM values in kg/m2 and their standardized anomalies (SSMa) for the period from January 2002 to September 2020, at a spatial resolution of 0.25°.
The greenness vigor of the vegetation was derived from the Enhanced Vegetation Index (EVI) contained in the product MOD13C2 [37], available at https://modis.gsfc.nasa.gov/ (accessed on 5 April 2023). This index is the output of a processing chain that uses the spectral data captured by the MODIS sensor (Moderate Resolution Imaging Spectroradiometer) onboard the Terra satellite, as explained in Huete et al. [38]. The EVI is dimensionless and varies between zero and one, with values close to one indicative of healthy vegetation without water stress, making it a reliable indicator to assess vegetative drought [39]. The maximum monthly EVI at 0.05° spatial resolution and its standardized anomaly (EVIa) during the period 02/2002–08/2020 were used in this study. We used SSMa and EVIa as proxies of agricultural drought conditions [11].
Records of average daily flow expressed in cubic meters per second [m3/s] at nine hydrometric measurement stations located in the main tributaries of the Orinoco River were used as reference data in this study. We used the standardized departure of monthly streamflow based on its long-term mean and standard deviation as a proxy of hydrological drought conditions [11]. These stations were chosen because their time series met the criteria of having high-quality serial data. The Institute of Hydrology, Meteorology, and Environmental Studies (IDEAM) provided the records for the Colombian portion of the basin, while INAMEH (National Institute of Meteorology and Hydrology) did so for the Venezuelan territory.
The time series of the Niño 3.4 Index (5° N–5° S, 170–120° W), North Atlantic Index (NATL, 5–20° N, 60–30° W), and South Atlantic Index (SATL, 0–20° S, 30° W −10° E) for the period January 1982 to September 2020 were used in this study. These indices are derived from the Extended Reconstructed Sea Surface Temperature (ERSSTv5) global product and distributed by the NOAA Center for Weather and Climate Prediction—Climate Prediction Center [40], available at https://www.cpc.ncep.noaa.gov (accessed on 5 April 2023). The three indices express the sea surface temperature (SST) as an average monthly anomaly over the geographical space indicated in parentheses. The base period for calculating anomalies is January 1982–September 2020. The Niño 3.4 region is important because it is where the ocean and the atmosphere interact most strongly during El Niño–Southern Oscillation (ENSO) events, and where the feedback mechanism that sustains the ENSO is most effective. The North Atlantic and South Atlantic regions are also relevant for climate studies because they are influenced by El Niño through various mechanisms. For example, El Niño can affect the strength and position of the Atlantic Intertropical Convergence Zone (ITCZ), which in turn can modulate the precipitation over Venezuela and Colombia [8,41,42].

2.3. Analysis of the Trends in the Intensity and Area Affected by Dry Conditions

For this study, the SPI consists of 476 GeoTIFF files adjusted to the Orinoco River basin. These files were organized in a collection (i.e., Raster Stack), which was converted into a matrix with rows linked to the pixel centers (i.e., gridpoints), while the months (i.e., 02/1981 to September 2020) correspond to the columns. Therefore, each pixel in the collection is associated with a time series of SPI values. The prevailing environmental condition over the area covered by a pixel and in any month depends on the SPI value: wet (SPI ≥ 1.00), normal (0.99 ≥ SPI > −1.00), moderately dry (−1.00 ≥ SPI > −1.50), severely dry (−1.50 ≥ SPI > −2.00), or extremely dry (SPI ≤ −2.00) [32]. To characterize the drought, it was assumed that a dry episode starts when SPI ≤ −1.00 and ends when SPI > −1.00. Duration (D) is the number of consecutive months where SPI ≤ −1.00; an event with D ≤ 2 months was not considered dry. The severity (S) is the absolute value of the sum of the SPI values during the dry episode. The mean intensity (I) is the ratio between S and D. The monthly percentage of area affected by dry conditions was estimated by dividing the number of pixels where SPI ≤ −1.00 by the total number of pixels contained in the study area. When the area affected by dry conditions equaled or exceeded 15% of the total area of the basin for at least three consecutive months, the event was categorized as extreme drought. The combination of these criteria and methods provides a reliable measure of the drought’s overall severity and impact. Similar criteria have been applied in previous studies to determine the drought’s severity, spatial extent, and persistence [3,8,10]. These studies have demonstrated that the drought’s spatial extent and persistence are significant factors to consider when evaluating its severity and impact.
To further analyze extreme drought events, we identified regions wherein dryness was particularly persistent and explored the spatial distribution of intensity during these events. Persistence in a pixel refers to the percentage of months where the SPI was less than or equal to −1.00. For example, the persistence of 100% indicates that the area covered by the SPI pixel experienced dry conditions for the entire duration of the drought event.
To assess the precipitation trend in the study area, the regional SPI was calculated, averaging the SPI of all pixels month by month. In the resulting series, the Theil–Sen slope was calculated, and the Kendall Tau non-parametric statistical test [43] was applied to detect the presence of a monotonic trend. The Theil–Sen slope is a method for robustly fitting a line to a set of sample points in the plane by choosing the median of the slopes of all lines through pairs of points. It is insensitive to outliers and does not require any assumptions on the probability distribution of the data. The Kendall Tau test is a measure of rank correlation between two variables, based on the number of concordant and discordant pairs in the data. It can detect any kind of monotonic relationship, not just linear, and does not require any assumptions on the probability distribution of the data [44]. The same approach was applied to the time series of the percentage area affected by dry conditions.

2.4. Analysis of the Relationship between the Spatial Extent of Droughts, ENSO, and Atlantic SST

The relationship between ENSO, Atlantic SST, and drought characteristics has been evaluated over different regions of Colombia [5] and Venezuela [33]. However, as far as is known, the entire Orinoco River basin has not been explored. To make a first approximation on this topic, a linear correlation analysis and a lagged correlation analysis were applied between the SPI averaged over the basin and the percentage area affected by dry conditions against the Niño 3.4, NATL and SATL indices, respectively. The linear correlation analysis and lagged correlation analysis are statistical methods for measuring the strength and direction of the linear relationship between two variables. In both cases, Pearson’s correlation coefficient (r) is used as a measure of association, which ranges from −1 to 1. A value of r close to 1 indicates a strong positive linear relationship, a value of r close to −1 indicates a strong negative linear relationship, and a value of r close to 0 indicates no linear relationship. A lagged correlation analysis is based on the cross-correlation function (CCF), which measures the correlation between two-time series at different lags; therefore, it can be used to determine how well they match up with each other over time, and at what lag the best match occurs [44]. Nevertheless, one should be cognizant of the limitations of these methods, such as their susceptibility to outliers and their incapacity to infer causality, as well as their assumptions such as the normality of the variables [22]. To examine the normality assumption, we applied the Kolmogorov–Smirnov test from the stats package in R. We also assessed the presence of outliers by inspecting the boxplots of the data [3]. The variables were expressed as anomalies in both analyses because this form satisfied the normality assumptions.

2.5. Analysis of the Recurrence and Environmental Effects of Extreme Drought Events

In each extreme drought event, the start and end times were determined along with the regionally averaged values for duration, intensity, and severity. From a visual inspection of these features, the presence of an underlying trend was explored. On the other hand, to identify the regions with the greatest exposure to dry conditions in the basin, the temporal persistence of the dry condition and intensity during the incidence of each extreme dry event was estimated at the level of each pixel. Likewise, the spatial distribution of T2Ma, SSMa, and EVIa was used to analyze the concomitant response of air temperature, soil moisture, and vegetation to environmental dryness. Anomalies were used instead of the native unit of measure for each covariate to facilitate comparison against the SPI. The period available for each covariate (i.e., T2M, SSM, and EVI) was used as a basis for calculating the anomaly at the level of each pixel (e.g., February 2002–August 2020 for EVI), using the arithmetic average and the monthly standard deviation as measures of central tendency and dispersion, respectively [44]. The same processing from GeoTIFF to matrix format applied to SPI was applied to T2M, SSM, and EVI.

2.6. Analysis of the Effect of Droughts on River Runoff

The study period was set to 2000–2020 because it allowed for observations for all datasets used. The average daily flow records provided by IDEAM and INAMEH were aggregated monthly using arithmetic averaging, and filtered to select locations with less than or equal to 10% missing data per month. This resulted in the selection of six locations in Colombia and three locations in Venezuela (Figure 2). The time series were then transformed into anomalies using the monthly average and standard deviation during the base period of 2000–2020, which provided a lower proportion of missing data compared to other longer periods evaluated. Finally, the time series of hydrometric anomalies were compared between 2000 and 2020, with a focus on the incidence of extreme dry events.

3. Results

3.1. Temporal Evolution of the Intensity of Droughts and the Area Affected by Dry Conditions

During the period 1981/01–2020/09, the average SPI over the basin varied between −1.724 and 2.132, with a median of 0.031 (Figure 3a). The most negative values (i.e., SPI < −1.00) occurred in 1988, 2015, and 2020. The opposite occurred in 1981 and 2012 (i.e., SPI > 1.00). The most extensive droughts in terms of percentage of area affected (>35% of the total area of the basin) were recorded in 1988, 1989, 1997, 2015, and 2020 (Figure 3c). A statistically significant negative trend was evidenced in the time series of the averaged SPI (Theil–Sen slope: −3.6 × 10⁻⁴; p < 0.05; Figure 3b). In contrast, the area affected by dry conditions remained stationary (no trend; Figure 3d). The previous suggests that since 1981, the Orinoco River basin has experienced a slow transition towards more intense droughts and dry spells (Figure 3b). However, in principle, it does not seem to be generalizable to the entire basin (Figure 3d). Attention was then focused on the association between average intensity, dry area coverage, and SST over the Pacific and Atlantic.

3.2. Relationship between the Spatial Extent of Droughts, ENSO, and SST in the Atlantic

Our analysis revealed a statistically significant negative correlation between the Standardized Precipitation Index (SPI) averaged over the Orinoco River basin and the percentage area of the basin affected by dry conditions (r = −0.857, p ≤ 0.05). This indicates that as the SPI decreases, the percentage area of the basin affected by dry conditions increases. In contrast, we found weak correlations between the percentage area of the basin affected by dry conditions and SST anomalies in the North Atlantic (r = 0.117, p > 0.05) and South Atlantic (r = −0.045, p > 0.05) regions. Only the correlation with SST anomalies in the Niño 3.4 region was statistically significant (r = −0.221, p ≤ 0.05). See more details in Table A1 in Appendix A.
To deepen this analysis, we applied a lagged correlation analysis between the spatial extent of droughts, ENSO, and SST in the Atlantic (see Table A2). The maximum negative correlations occurred when the SST anomalies lagged by −6 and −7 months for the NATL and SATL regions, implying that the SST anomalies precede the drought conditions by about half a year. When ENSO was considered, the maximum positive correlation occurred when the SST anomaly was lagged by −2 months, implying that the SST anomaly precedes the drought conditions by about two months. The magnitudes of the correlations suggest that the SST anomaly in the Niño 3.4 region has a stronger influence on the drought variability in the basin than the SST anomalies in the NATL and SATL regions. The maximum correlation coefficient between the percentage of dry area and the SST anomaly in the Niño 3.4 region is 0.194, which is higher than the maximum correlation coefficients between the percentage of dry area and the SST anomalies in the NATL and SATL regions, which are −0.146 and −0.118, respectively.

3.3. Recurrence and Environmental Effects of Extreme Drought Events

We identified the extreme drought events in the Orinoco River basin between January 1981 and September 2020, based on the criteria of having a dry area greater than or equal to 15% and a duration of at least three months (Table 1). The most persistent event, with a duration of 7 months, and the most severe event, with a severity of 11.74, both occurred between April and October 2015. The most extensive event, with a maximum coverage of 49.65%, occurred between March and May 1988. Our analysis also revealed that the mean intensity of extreme drought events exhibited a slight decreasing trend (slope: −0.0051) over the study period, while their maximum severity, duration, and extent remained broadly stable. These findings support the hypothesis of a general trend towards more intense dry conditions (Figure 3b), but do not necessarily imply that extreme drought events are becoming more extensive (Figure 3d).
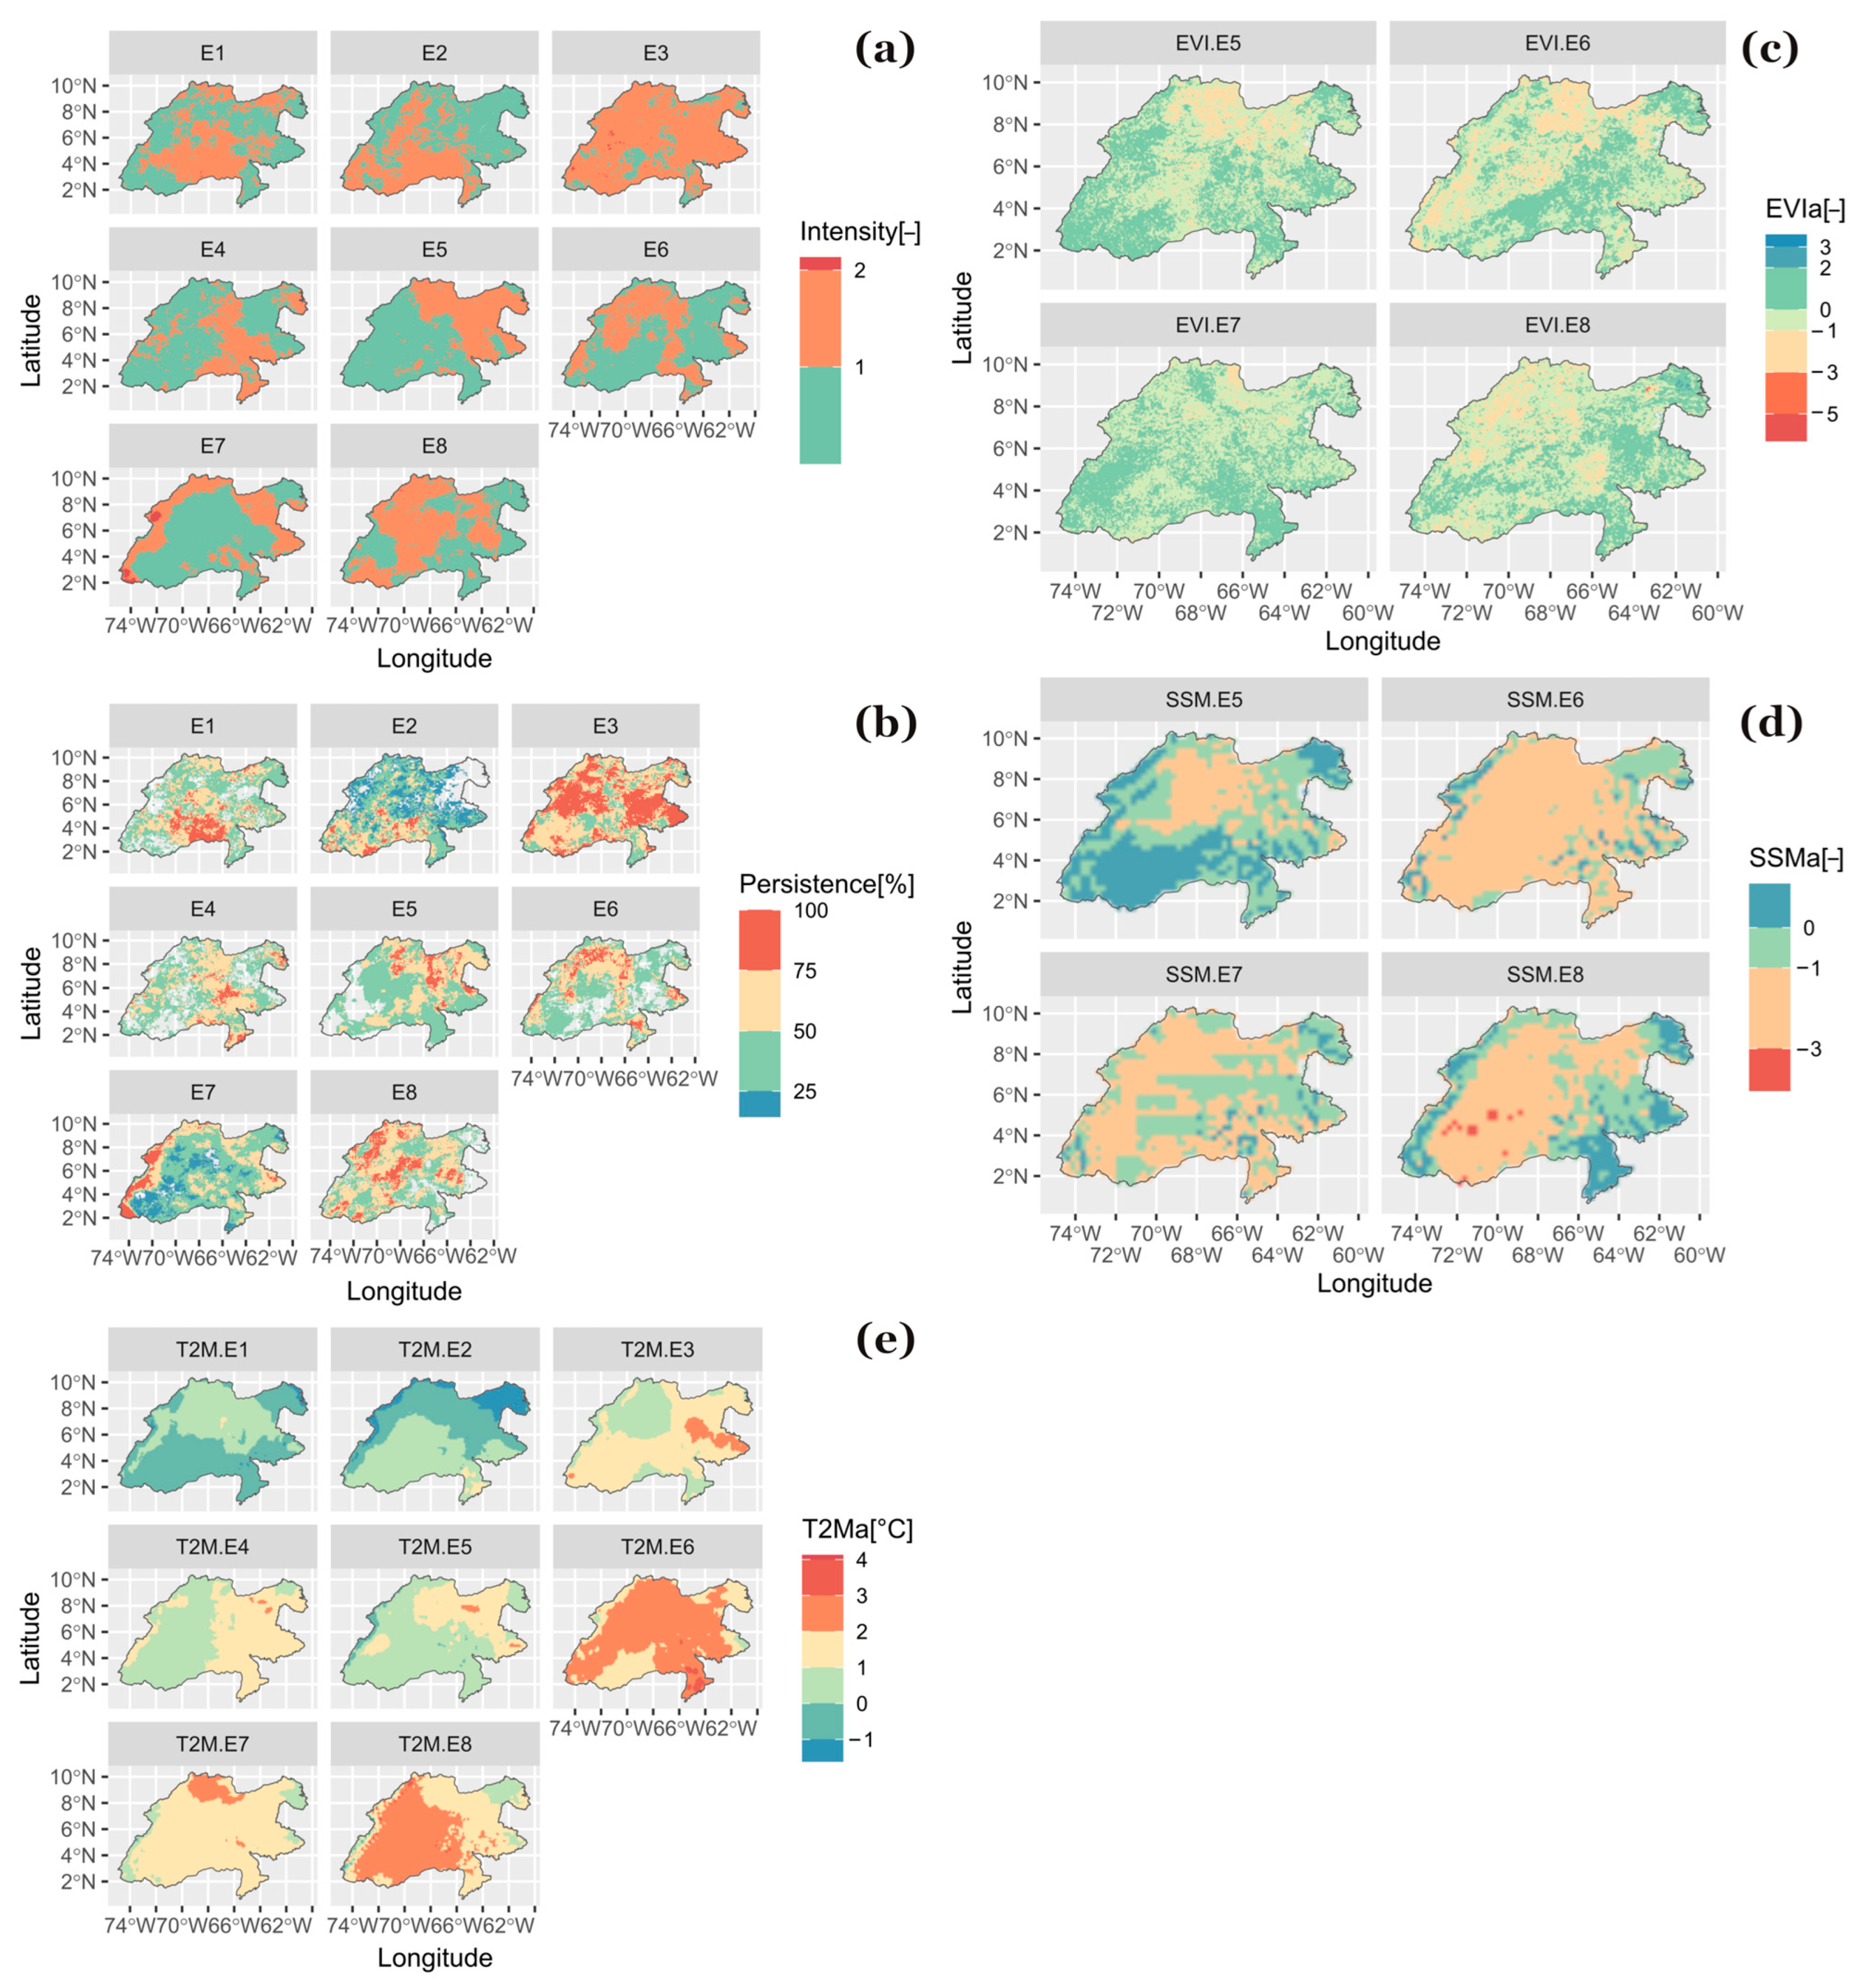
We performed an analysis of the intensity and persistence of the extreme drought events that we identified in Table 1. In terms of intensity, large portions of the basin located in the states of Guárico and Anzoátegui in Venezuela and the departments of Casanare and Meta in Colombia experienced very intense dry conditions (I ≥ 2.00). A closer examination of the results revealed that since the occurrence of event E5 (April–June 2009), regions exposed to very intense dry conditions exhibited an increasingly fragmented spatial pattern (Figure 4a).
When evaluating the temporal persistence of dry conditions (Figure 4b), we observed similar behavior. However, event E7 stood out from the other drought events due to its high persistence on the eastern slope of the Andes, covering a large region between Tinigua National Park in Colombia and Sierra Nevada National Park in Venezuela, including almost all Canaima National Park in Venezuela.
The extreme drought significantly impacted the surface biophysical components, as the results confirmed. For example, water stress affected most of the herbaceous vegetation (Figure 1c), as shown by the signs in Figure 4c. This was likely due to the soil moisture depletion in the root zone (Figure 4d) and the increased evapotranspiration demand from high surface temperatures (Figure 4e).
Our results also showed a moderate correlation between the variability in precipitation (expressed by the SPI), surface air temperature, soil moisture, and vegetation vigor (Figure 5). In general, below-average values of soil moisture (r: 0.573 for SPI vs. SSMa) and vegetation vigor (r: 0.284 for SPI vs. EVIa) accompanied a condition of intense drought, as well as above-average values of surface air temperature (r: −0.473 for SPI vs. T2Ma).

3.4. Modulation of the Hydrological Regime by Droughts and Possible Implications on the Ichthyofauna

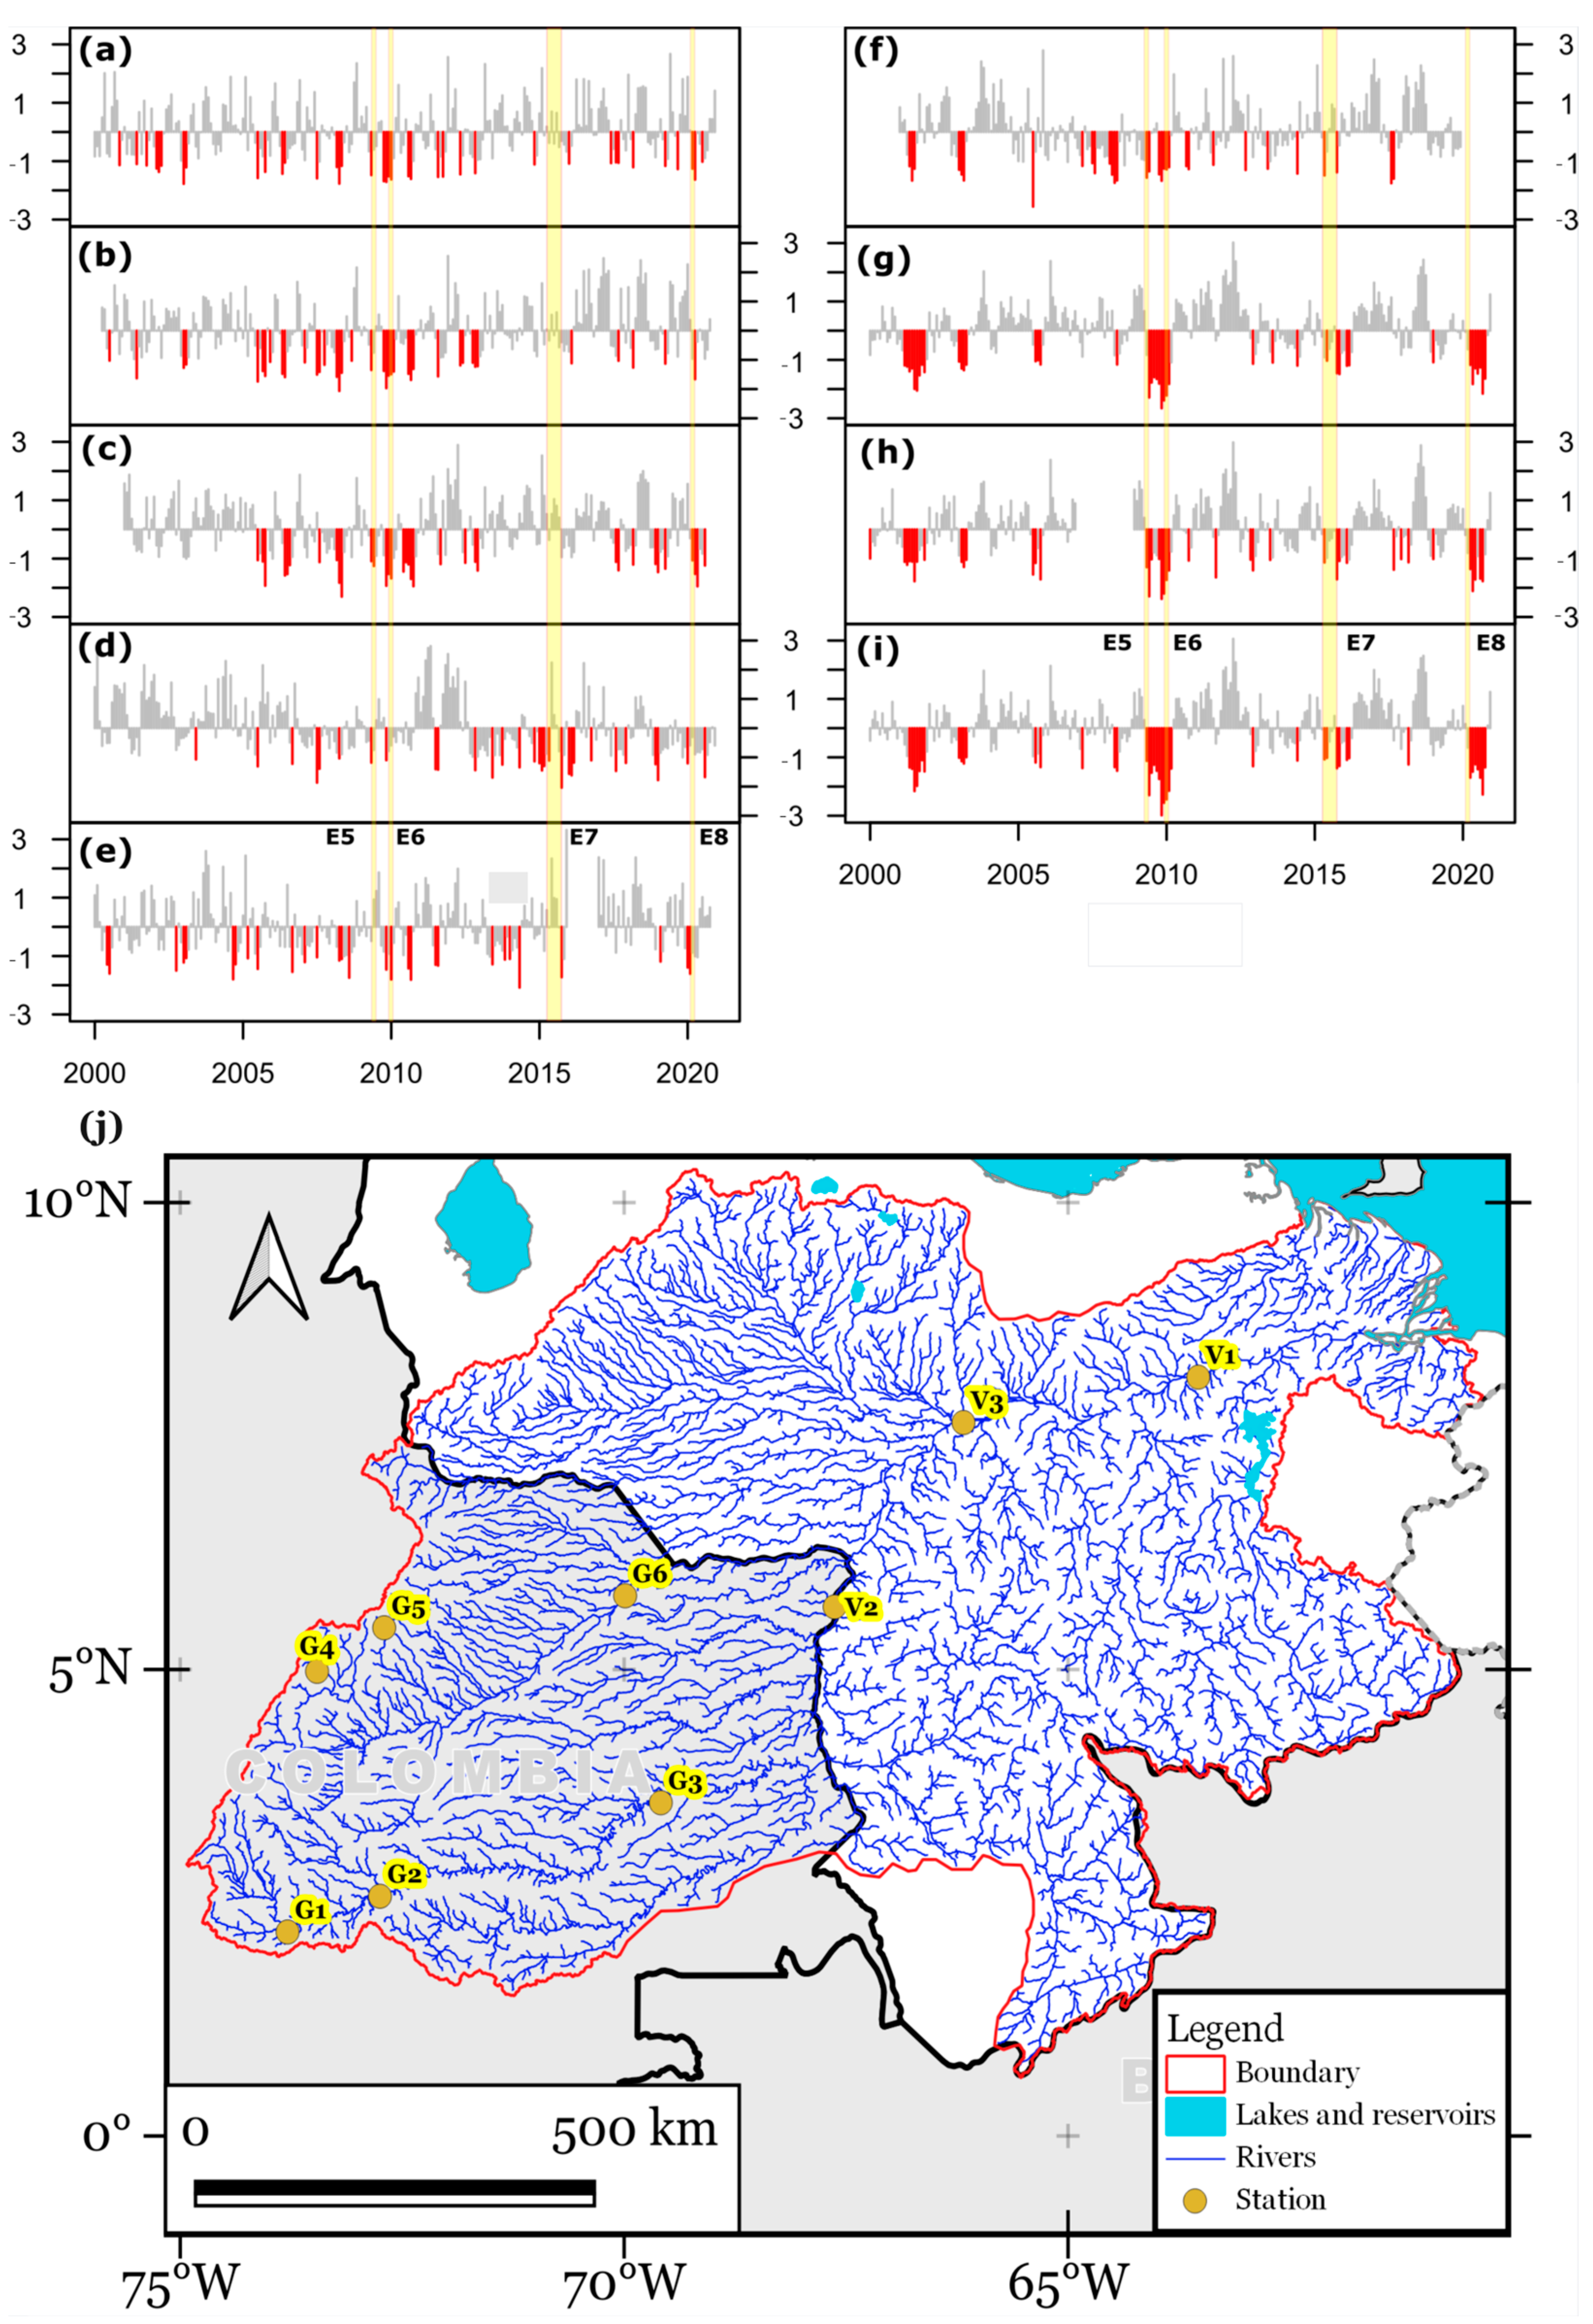
The standardized anomalies of the average monthly flow in some sections of the Guaviare, Meta, and Orinoco rivers from January 2000 to December 2020 are presented in Figure 6. The figure illustrates how the tributary areas to the hydrometric stations, which were directly affected by extreme drought events, experienced negative anomalies in their river flows. For instance, during event E5, all the sub-basins that drained to G1, G2, G3, G4, and G6 showed persistent and spatially extensive dry conditions (Figure 4b), which resulted in reduced flows in the downstream channels (Figure 6a–d,f–i). In contrast, upstream of G5, only a moderately small region faced dry conditions, and therefore the flow anomaly at this gauge was slightly negative (Figure 6e). Similarly, events E6, E7, and E8 demonstrate that spatially extensive droughts can affect the water regime of rivers over large regions of the Orinoco River basin (Table 2).

4. Discussion

Our findings underline a clear positive correlation between the drought severity and dry area within the Orinoco River basin and the SST anomalies within the central Pacific, underscoring the role of El Niño events in intensifying drought conditions within this region. The SST anomalies in the Atlantic Ocean have a weaker and longer-term effect on drought than the SST anomalies in the Pacific Ocean (Table A1 and Table A2), which have a stronger and shorter-term effect. In general, when the SST is high in the Atlantic Ocean, the drought coverage is low in the basin, and vice versa. When the SST is high in the Pacific Ocean, the drought coverage is high in the basin, and vice versa. Our findings are consistent with previous research, which has documented the prevalence of broad-scale droughts within the basin during numerous El Niño episodes [20,21,41].
To improve our understanding of the complex relationships between SST anomalies and drought variability in the Orinoco River basin, further research is needed using more sophisticated methods, such as wavelet coherence analysis, spectral analysis, and detrended fluctuation analysis to detect the non-linear periodicity and long-range persistence of the time series data sets [8]. This would allow us to explore possible non-linear associations between droughts and SST anomalies in different ocean regions. Previous studies have demonstrated that the thermal dynamics of the SST in these oceanic regions affect the precipitation regime in a non-linear manner in parts of this basin [19,45,46]. This is especially important in the context of climate change, which is expected to increase the frequency and intensity of drought events in many parts of the basin [15,34,41,45].
Rising surface temperatures tend to increase evapotranspiration demand and aggravate drought conditions within the basin (Figure 4). This effect is concomitant with the long-term surface warming trend observed over northern South America, attributed to a teleconnection triggered by the combined influence of ENSO and the anomalous surface warming within a large oceanic region over the North Atlantic [42].
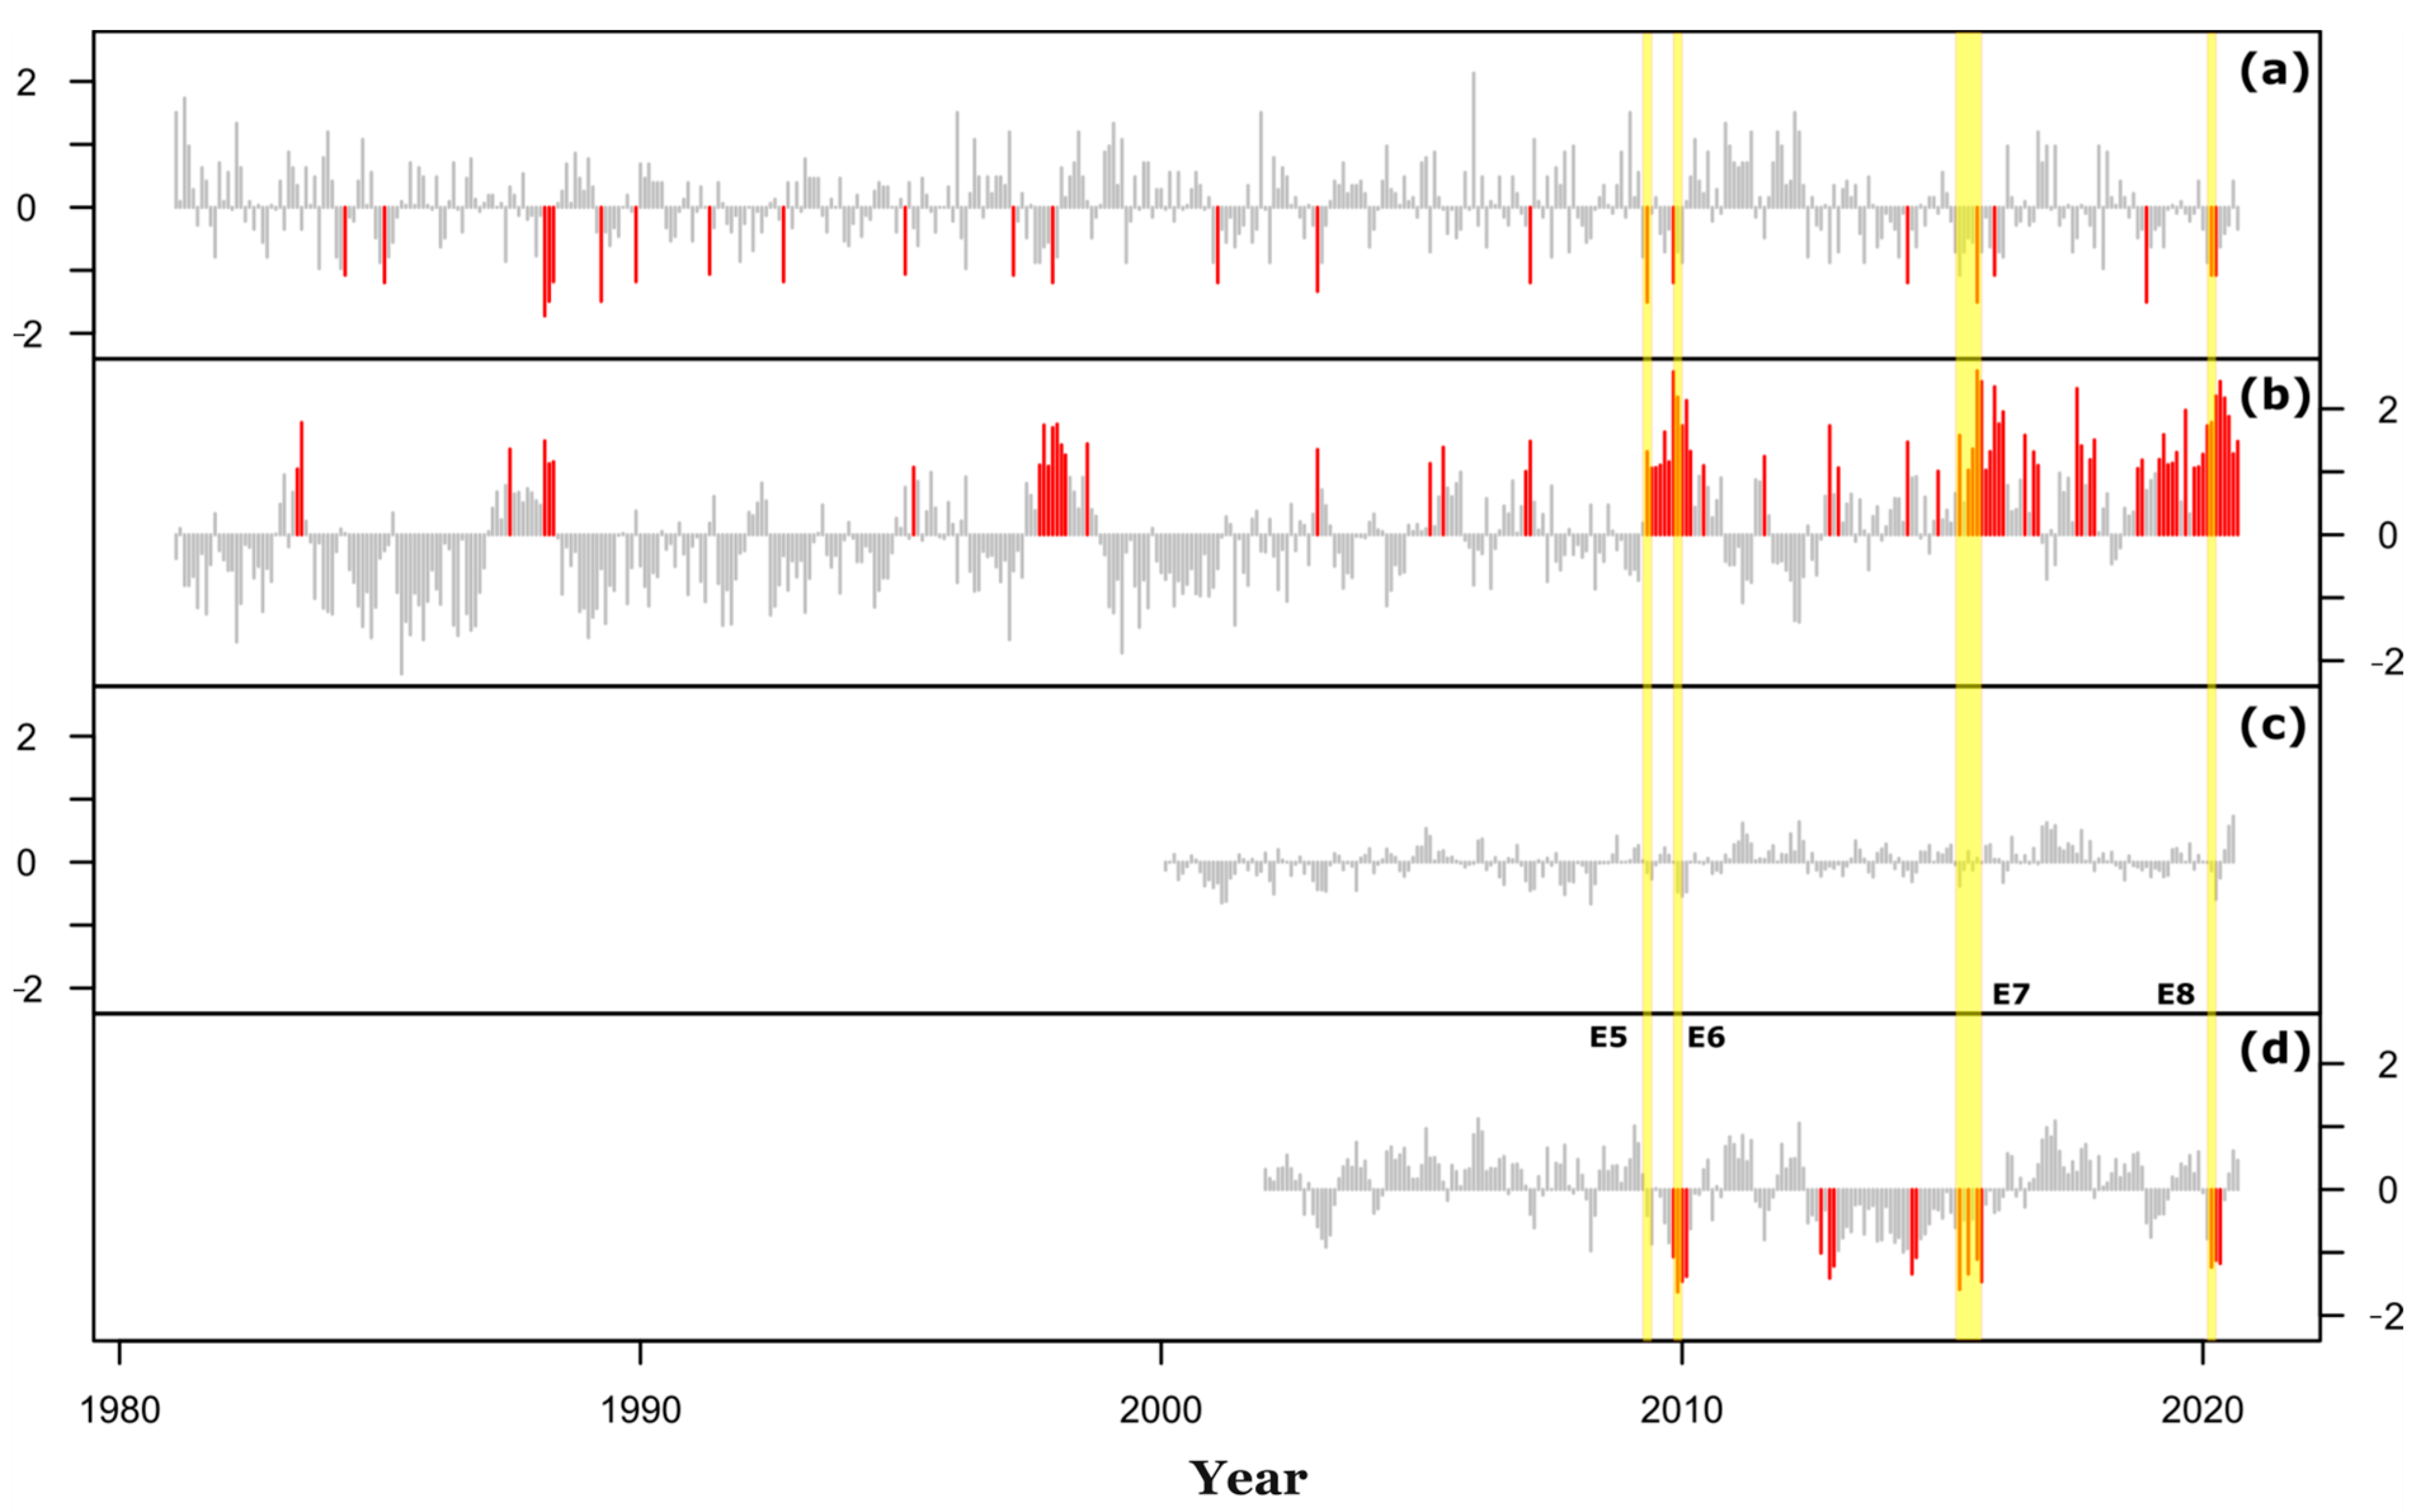
Two significant phenomena are evident in Figure 5: the dominance of hot months after 2000 [red bars in Figure 5b] and a surprising increase in vegetation greenness between events E7 and E8 [positive anomalies in Figure 4a], despite high surface temperatures. The former phenomenon can be attributed to global warming [42], while the latter phenomenon can be accounted for by sufficient soil moisture [positive anomalies in Figure 5d] resulting from rainfall events during this period. These observations indicate that temperature alone does not affect vegetation phenology and the root zone water reserves significantly. A prolonged rainfall deficit is required to cause observable changes in the vegetation and soil conditions from space (Figure 4) [47], reflecting the complex bidirectional feedback between climatic variables and the landscape’s biotic and abiotic components [41,48].
Droughts can reduce or stop the infiltration–percolation process, affecting the long-term recharge rate of aquifers and their contributions to the ecological flow [49,50], as shown in Figure 4 and Figure 5. The spatiotemporal variability of droughts within the Orinoco River basin also requires attention [20,21,41]. Previous studies using observational and satellite-derived data have confirmed that the most extreme drought events are associated with complex interactions between large-scale modes of climate variability (e.g., ENSO) [51,52]. Prolonged hydrological droughts can affect the ecological quality of rivers [53] and cause severe damage to fish communities sensitive to seasonal flow variations in some Orinoco tributaries [54]. Therefore, drought must be considered a complex phenomenon that impacts both the biotic and abiotic components of river environments, rather than a simple lack of rain.
Our study showed that droughts can cause various environmental impacts, many of which can only be detected from space [14] (Figure 4). Although we did not find enough evidence of increasing extreme drought frequency (Figure 3d), the sudden increase in surface air temperature after mid-2010 is concerning (Figure 5b) [55,56,57].
The Orinoco River basin is an ecologically vital resource for local communities. Therefore, understanding how droughts affect this region is essential for informing water management and conservation policies that can protect the river’s biodiversity and the people who depend on it [58,59]. Our study provides a timely assessment of the situation, as drought occurrence and severity have increased in recent years (Figure 3), and suggests appropriate responses. We show how combining orbital remote sensing data and surface observations can effectively study large river basin droughts, offering a holistic assessment of drought impacts using climatic and biophysical indicators. Remote sensing data enable us to analyze large-scale drought patterns and their effects on the Orinoco River basin’s ecology and hydrology. This approach can be applied to other basins globally, providing valuable insights for developing strategies to mitigate drought impacts.
As droughts become more intense and localized, adaptive management practices are crucial to preserving the region’s water resources and biodiversity [60,61]. Identifying the recurring unusually hot months is important for implementing measures to reduce adverse effects on ecosystems and human populations. The detection of specific hydrological regime changes can inform policymakers about potential changes in river dynamics, thereby guiding sustainable water management practices. Finally, our research contributes to the theoretical understanding of climate change’s impacts on large river ecosystems. The identification of drought occurrence trends and their impacts on the river’s ecological health provide valuable insights for future research on climate-related ecological disruptions and ecosystem resilience.

5. Conclusions

Our study assessed the impacts of climate variables and droughts in the Orinoco River Basin using a combination of Earth observation data and surface observations. Our key findings include the following:
i.
El Niño events worsen the region’s drought conditions, while Atlantic SST variability has less influence.
ii.
Long-term surface warming trends increase the evapotranspiration demand, aggravating drought conditions. However, vegetation greenness remains high despite high surface temperatures, suggesting that temperature alone does not significantly affect vegetation phenology and root zone water reserves. A sustained rainfall deficit is necessary to cause observable changes in the vegetation and soil conditions.
iii.
Droughts severely impact the infiltration–percolation process, affecting the long-term recharge rate of aquifers and their ecological flow contributions.
Our study demonstrates the value of using a combination of Earth observation data and surface observations for a broad-scale, comprehensive assessment of drought impacts. This approach enables a deep understanding of drought dynamics over large geographical areas, providing crucial insights into potential implications for water availability, agricultural productivity, and overall ecosystem health.
Given the increasing occurrence and intensity of droughts, our study underlines the urgent need for proactive, adaptive management strategies. It highlights the importance of recognizing and understanding the impacts of anomalously hot months and potential changes in hydrological regimes to mitigate adverse effects on ecosystems and human populations. This research also urges policymakers to use this knowledge to make informed decisions regarding sustainable water management practices in the face of the mounting challenges posed by climate change.
However, our study also has some limitations that need to be addressed in future research. For instance, we did not analyze the couplings between atmospheric and oceanic modes of variability and the changes that occur at different time scales in the biophysical variables of the basin during the presence of dry conditions. Moreover, we did not consider other drought indices that could provide complementary information on different aspects of drought severity and duration. Therefore, more research is needed, using more sophisticated methods to explore these aspects and to improve our understanding of the complex interactions between climate variability and drought impacts in the Orinoco River Basin.

Author Contributions

Conceptualization, F.P.-T., Y.M.-F. and A.G.; methodology, F.P.-T., Y.M.-F. and A.G.; software, F.P.-T.; validation, F.P.-T., Y.M.-F. and A.G; formal analysis, J.A.-G. and B.O.O.; investigation, F.P.-T., Y.M.-F., A.G., J.A.-G. and B.O.O.; resources, F.P.-T. and B.O.O.; data curation, F.P.-T.; writing—original draft preparation, F.P.-T., Y.M.-F., J.A.-G. and A.G.; writing—review and editing, F.P.-T. and B.O.O.; visualization, F.P.-T. and B.O.O.; supervision, F.P.-T. and B.O.O. All authors have read and agreed to the published version of the manuscript.

Funding

This research received no external funding.

Data Availability Statement

No new data were created in this study.

Acknowledgments

The authors thank IDEAM and INAMEH for providing observational records, as well as the different international agencies that provided the products derived from satellites and reanalysis used in this study (as detailed in the Materials and Methods section). They also thank Eng. José Rafael Córdova for contributing the flow curve of the Orinoco River from the Ciudad Bolívar station.

Conflicts of Interest

The authors declare no conflict of interest.

Appendix A

Table A1. Linear correlation coefficients between drought-affected area in the Orinoco River Basin, ENSO, and Atlantic Ocean SST. Bold values indicate statistically significant correlations at the 95% level.
BasinSPIBasinDryAreaPctNATLSATLNiño 3.4
BasinSPI1.000−0.8570.117−0.045−0.221
BasinDryAreaPct−0.8571.000−0.0820.0470.187
NATL0.117−0.0821.0000.2150.042
SATL−0.0450.0470.2151.000−0.135
Niño 3.4−0.2210.1870.042−0.1351.000
Note: ‘BasinSPI’ represents the Standardized Precipitation Index (SPI) averaged over the Orinoco River basin, while ‘BasinDryAreaPct’ represents the percentage area of the basin affected by dry conditions. NATL, SATL, and Niño 3.4 represent SST anomalies in NATL, SATL, and Niño 3.4 Regions.
Table A2. Maximum correlation coefficients between the drought-affected area in the Orinoco River Basin and ENSO, and Atlantic Ocean SST. The SST anomalies are lagged by k months, where k ranges from 0 to 12. Bold values indicate statistically significant correlations at the 95% level.
BasinDryAreaPctk
NATL−0.146−6
SATL−0.118−7
Niño 3.40.194−2
Note: The cross-correlation function (x, y) returns the lag k value that measures the correlation between the SST anomalies in the North Atlantic (NATL), South Atlantic (SATL), and Niño 3.4 regions at time t + k, and the percentage of dry area in the Orinoco River Basin at time t. The SST anomalies are x(t + k), and the percentage of dry area is y(t). The lag k value ranges from 0 to 12 months.

References

  1. Blauhut, V. The triple complexity of drought risk analysis and its visualization via mapping: A review across scales and sectors. Earth-Sci. Rev. 2020, 210, 103345. [Google Scholar] [CrossRef]
  2. Haile, G.; Tang, Q.; Sun, S.; Huang, Z.; Zhang, X.; Liu, X. Droughts in East Africa: Causes, impacts and resilience. Earth-Sci. Rev. 2019, 193, 146–161. [Google Scholar] [CrossRef]
  3. Olivares, B.O.; Zingaretti, M.L. Application of multivariate methods for the characterization of periods of meteorological drought in Venezuela. Rev. Luna Azul 2019, 48, 172–192. [Google Scholar] [CrossRef]
  4. Balocchi, F.; Rivera, D.; Arumi, J.L.; Morgenstern, U.; White, D.A.; Silberstein, R.P.; Ramírez de Arellano, P. An Analysis of the Effects of Large Wildfires on the Hydrology of Three Small Catchments in Central Chile Using Tritium-Based Measurements and Hydrological Metrics. Hydrology 2022, 9, 45. [Google Scholar] [CrossRef]
  5. Loaiza Cerón, W.; Carvajal-Escobar, Y.; Andreoli de Souza, R.V.; Toshie Kayano, M.; González López, N. Spatio-temporal analysis of the droughts in Cali, Colombia and their primary relationships with the El Niño-Southern Oscillation (ENSO) between 1971 and 2011. Atmosfera 2020, 33, 51–69. [Google Scholar] [CrossRef]
  6. Kreibich, H.; Van Loon, A.F.; Schröter, K.; Ward, P.J.; Mazzoleni, M.; Sairam, N.; Di Baldassarre, G. The challenge of unprecedented floods and droughts in risk management. Nature 2022, 608, 80–86. [Google Scholar] [CrossRef]
  7. Cavus, Y.; Aksoy, H. Critical drought severity/intensity-duration-frequency curves based on precipitation deficit. J. Hydrol. 2020, 584, 124312. [Google Scholar] [CrossRef]
  8. Paredes-Trejo, F.; Barbosa, H.A.; Giovannettone, J.; Lakshmi Kumar, T.V.; Thakur, M.K.; de Oliveira Buriti, C. Long-Term Spatiotemporal Variation of Droughts in the Amazon River Basin. Water 2021, 13, 351. [Google Scholar] [CrossRef]
  9. Cortez, A.; Orlando Olivares, B.; Mayela Parra, R.; Lobo, D.; Rey, B.J.C.; Rodriguez, M.F. Systematization of the calculation of the standardized precipitation index as a methodology to generate meteorological drought information. Rev. Fac. Agron. 2019, 36, 209–223. [Google Scholar]
  10. Barbosa, H.A.; Kumar, T.L.; Paredes, F.; Elliott, S.; Ayuga, J.G. Assessment of Caatinga response to drought using Meteosat-SEVIRI normalized difference vegetation index (2008–2016). ISPRS J. Photogramm. Remote Sens. 2019, 148, 235–252. [Google Scholar] [CrossRef]
  11. Hayes, M.; Svoboda, M.; Wall, N.; Widhalm, M. The Lincoln declaration on drought indices: Universal meteorological drought index recommended. Bull. Am. Meteorol. Soc. 2011, 92, 485–488. [Google Scholar] [CrossRef]
  12. Paredes-Trejo, F.; Olivares, B. El desafio de la sequía en Venezuela. In Atlas de Sequía de América Latina y el Caribe; Cobo, J.N., Verbist, K., Eds.; UNESCO: Paris, France, 2018; pp. 127–136. [Google Scholar]
  13. Olivares, B.; Cortez, A.; Parra, R.; Rodríguez, M.F.; Guevara, E. Application of statistics procedures for the quality control of the monthly rainfall series in the Venezuelan Oriental Plains. Rev. Fac. Agron. 2013, 30, 367–391. [Google Scholar]
  14. Golian, S.; Javadian, M.; Behrangi, A. On the use of satellite, gauge, and reanalysis precipitation products for drought studies. Environ. Res. Lett. 2019, 14, 075005. [Google Scholar] [CrossRef]
  15. Viloria, J.A.; Olivares, B.O.; García, P.; Paredes-Trejo, F.; Rosales, A. Mapping Projected Variations of Temperature and Precipitation Due to Climate Change in Venezuela. Hydrology 2023, 10, 96. [Google Scholar] [CrossRef]
  16. León, G. La cuenca del río Orinoco: Visión hidrográfica y balance hídrico. Rev. Geogr. Venez. 2005, 46, 75–108. [Google Scholar]
  17. Montoya, J.; Osío, A.; Pérez, M.; Pineda, V. Los ríos de los llanos de Apure. In Ríos en Riesgo de Venezuela; Rodríguez-Olarte, D., Ed.; Colección Recursos Hidrobiológicos de Venezuela; Universidad Centroccidental Lisandro Alvarado (UCLA): Barquisimeto, Venezuela, 2017; Volume 1, pp. 75–107. [Google Scholar]
  18. Rodríguez-Olarte, D.; Barrios, M.; Marrero, C.; Marcó, L. Río Turbio: Un síndrome urbano en la vertiente andina del Orinoco. Capítulo 3. In Ríos en Riesgo de Venezuela; Rodríguez-Olarte, D., Ed.; Colección Recursos Hidrobiológicos de Venezuela; Universidad Centroccidental Lisandro Alvarado (UCLA): Barquisimeto, Venezuela, 2017; Volume 1, pp. 59–74. [Google Scholar]
  19. Bedoya-Soto, J.; Poveda, G.; Trenberth, K.; Vélez-Upegui, J. Interannual hydroclimatic variability and the 2009–2011 extreme ENSO phases in Colombia: From Andean glaciers to Caribbean lowlands. Theor. Appl. Climatol. 2019, 135, 1531–1544. [Google Scholar] [CrossRef]
  20. Mendoza, N.; Puche, M. Evaluación de la ocurrencia de sequía en localidades de Venezuela. Rev. Fac. Agron. 2007, 24, 661–678. [Google Scholar]
  21. Olivares, B.; Cortez, A.; Lobo, D.; Parra, R.; Rey, B.; Juan, C.; Rodríguez, M. Estudio de la Sequía Meteorológica en Localidades de los Llanos de Venezuela Mediante el Índice de Precipitación Estandarizado. Acta Nova 2016, 7, 266–283. [Google Scholar]
  22. Olivares, B.; Zingaretti, M.L. Analysis of the meteorological drought in four agricultural locations of Venezuela by the combination of multivariate methods. UNED Res. J. 2018, 10, 181–192. [Google Scholar] [CrossRef]
  23. Beck, H.; Zimmermann, N.; McVicar, T.; Vergopolan, N.; Berg, A.; Wood, E. Present and future Köppen-Geiger climate classification maps at 1-km resolution. Sci. Data 2018, 5, 180214. [Google Scholar] [CrossRef]
  24. Builes-Jaramillo, A.; Yepes, J.; Salas, H.D. The Orinoco low-level jet during El Niño–Southern Oscillation. Int. J. Climatol. 2022, 42, 7863–7877. [Google Scholar] [CrossRef]
  25. Rodríguez-Yzquierdo, G.; Olivares, B.O.; Silva-Escobar, O.; González-Ulloa, A.; Soto-Suarez, M.; Betancourt-Vásquez, M. Mapping of the Susceptibility of Colombian Musaceae Lands to a Deadly Disease: Fusarium oxysporum f. sp. cubense Tropical Race 4. Horticulturae . Horticulturae 2023, 9, 757. [Google Scholar] [CrossRef]
  26. Torres Rojas, L.P.; Díaz-Granados, M. The Construction and Comparison of Regional Drought Severity-Duration-Frequency Curves in Two Colombian River Basins—Study of the Sumapaz and Lebrija Basins. Water 2018, 10, 1453. [Google Scholar] [CrossRef]
  27. Doxsey-Whitfield, E.; MacManus, K.; Adamo, S.; Pistolesi, L.; Squires, J.; Borkovska, O.; Baptista, S. Taking advantage of the improved availability of census data: A first look at the gridded population of the world, version 4. Pap. Appl. Geogr. 2015, 1, 226–234. [Google Scholar] [CrossRef]
  28. Buchhorn, M.; Lesiv, M.; Tsendbazar, N.-E.; Herold, M.; Bertels, L.; Smets, B. Copernicus Global Land Cover Layers—Collection 2. Remote Sens. 2020, 12, 1044. [Google Scholar] [CrossRef]
  29. Lehner, B.; Verdin, K.; Jarvis, A. HydroSHEDS Technical Documentation, Version 1.0; World Wildlife Fund: Washington, DC, USA, 2006; pp. 1–27. [Google Scholar]
  30. Jarvis, A.; Reuter, H.; Nelson, A.; Guevara, E. 2008. Hole-Filled SRTM for the Globe Version 4. Available from the CGIAR-CSI SRTM 90m Database. Volume 15, pp. 25–54. Available online: http://srtm.csi.cgiar.org (accessed on 11 May 2023).
  31. Funk, C.; Peterson, P.; Landsfeld, M.; Pedreros, D.; Verdin, J.; Shukla, S.; Michaelsen, J. The climate hazards infrared precipitation with stations—A new environmental record for monitoring extremes. Sci. Data 2015, 2, 150066. [Google Scholar] [CrossRef]
  32. McKee, T.B.; Doesken, N.J.; Kleist, J. The relationship of drought frequency and duration to time scales. In Proceedings of the 8th Conference on Applied Climatology, Anaheim, CA, USA, 17–22 January 1993; American Meteorological Society: Boston, MA, USA, 1993; Volume 17, Nº. 22. pp. 179–183. [Google Scholar]
  33. Trejo, F.; Barbosa, H.; Peñaloza-Murillo, M.; Moreno, M.; Farías, A. Intercomparison of improved satellite rainfall estimation with CHIRPS gridded product and rain gauge data over Venezuela. Atmósfera 2016, 29, 323–342. [Google Scholar]
  34. Urrea, V.; Ochoa, A.; Mesa, O. Seasonality of Rainfall in Colombia. Water Resour. Res. 2019, 55, 4149–4162. [Google Scholar] [CrossRef]
  35. Hersbach, H.; Bell, B.; Berrisford, P.; Hirahara, S.; Horányi, A.; Muñoz-Sabater, J.; Thépaut, J. The ERA5 global reanalysis. Q. J. R. Meteorol. 2020, 146, 1999–2049. [Google Scholar] [CrossRef]
  36. Tarek, M.; Brissette, F.; Arsenault, R. Evaluation of the ERA5 reanalysis as a potential reference dataset for hydrological modelling over North America. Hydrol. Earth Syst. Sci. 2020, 24, 2527–2544. [Google Scholar] [CrossRef]
  37. Didan, K.; Muñoz, A.B.; Solano, R.; Huete, A. MODIS Vegetation Index User’s Guide; MOD13 Series; University of Arizona, Vegetation Index and Phenology Lab: Tucson, AZ, USA, 2015; pp. 2–33. [Google Scholar]
  38. Huete, A.; Didan, K.; Miura, T.; Rodríguez, E.; Gao, X.; Ferreira, L. Overview of the radiometric and biophysical performance of the MODIS vegetation indices. Remote Sens. Environ. 2002, 83, 195–213. [Google Scholar] [CrossRef]
  39. Baek, S.; Jang, H.; Kim, J.; Lee, J. Agricultural drought monitoring using the satellite-based vegetation index. J. Korea Water Resour. Assoc. 2016, 49, 305–314. [Google Scholar] [CrossRef]
  40. Huang, B.; Thorne, P.; Banzon, V.; Boyer, T.; Chepurin, G.; Lawrimore, J.; Zhang, H. Extended reconstructed sea surface temperature, version 5 (ERSSTv5): Upgrades, validations, and intercomparisons. J. Clim. 2017, 30, 8179–8205. [Google Scholar] [CrossRef]
  41. Poveda, G.; Jaramillo, A.; Gil, M.; Quiceno, N.; Mantilla, R. Seasonally in ENSO-related precipitation, river discharges, soil moisture, and vegetation index in Colombia. Water Resour. Res. 2001, 37, 2169–2178. [Google Scholar] [CrossRef]
  42. Glenn, E.; Comarazamy, D.; González, J.; Smith, T. Detection of recent regional sea surface temperature warming in the Caribbean and surrounding region. Geophys. Res. Lett. 2015, 42, 6785–6792. [Google Scholar] [CrossRef]
  43. Yue, S.; Wang, C. Applicability of prewhitening to eliminate the influence of serial correlation on the Mann-Kendall test. Water Resour. Res. 2002, 38, 4-1. [Google Scholar] [CrossRef]
  44. Mudelsee, M. Climate time series analysis. In Classical Statistical and Bootstrap Methods, 2nd ed.; Springer: Cham, Switzerland, 2014; 454p. [Google Scholar] [CrossRef]
  45. Tim, N.; De Guenni, L. Oceanic influence on the precipitation in Venezuela under current and future climate. Clim. Dyn. 2016, 47, 211–234. [Google Scholar] [CrossRef]
  46. Arias, P.A.; Garreaud, R.; Poveda, G.; Espinoza, J.C.; Molina-Carpio, J.; Masiokas, M.; Viale, M.; Scaff, L.; Van Oevelen, P.J. Hydroclimate of the Andes part II: Hydroclimate variability and sub-continental patterns. Front. Earth Sci. 2021, 8, 666. [Google Scholar] [CrossRef]
  47. López-Beltrán, M.; Olivares, B.; Lobo-Luján, D. Changes in land use and vegetation in the agrarian community Kashaama, Anzoátegui, Venezuela: 2001–2013. Rev. Geogr. Am. Cent. 2019, 2, 269–291. [Google Scholar] [CrossRef]
  48. Olivares, B.; López, M. Normalized Difference Vegetation Index (NDVI) applied to the agricultural indigenous territory of Kashaama, Venezuela. UNED Res. J. 2019, 11, 112–121. [Google Scholar] [CrossRef]
  49. Van Loon, A.F. Hydrological drought explained. Wiley Interdiscip. Rev. Water 2015, 2, 359–392. [Google Scholar] [CrossRef]
  50. Van Loon, A.F.; Laaha, G.J. Hydrological drought severity explained by climate and catchment characteristics. J. Hydrol. 2015, 526, 3–14. [Google Scholar] [CrossRef]
  51. Rojas, M.; Alfaro, E. Influencia del océano Atlántico tropical sobre el comportamiento de la primera parte de la estación lluviosa en Venezuela. Top. Meteor. Oceanogr. 2000, 7, 88–92. [Google Scholar]
  52. Poveda, G.; Waylen, P.; Pulwarty, R. Annual and inter-annual variability of the present climate in northern South America and southern Mesoamerica. Palaeogeogr. Palaeoclimatol. Palaeoecol. 2006, 234, 3–27. [Google Scholar] [CrossRef]
  53. Correa, I.; Segnini, S.; Chacón, M.; Bianchi, G.; Casado, R.; Romero, R. Condición ecológica en ríos de los páramos andinos de Venezuela. In Ríos en Riesgo de Venezuela; Rodríguez-Olarte, D., Ed.; Recursos Hidrobiológicos de Venezuela; Universidad Centroccidental Lisandro Alvarado (UCLA): Barquisimeto, Venezuela, 2020; Volume 3, pp. 111–134. [Google Scholar]
  54. Machado-Allison, A.; Chernoff, B. El río Caura: Desde la pristinidad a su destrucción. In Ríos en Riesgo de Venezuela; Rodríguez-Olarte, D., Ed.; Recursos Hidrobiológicos de Venezuela; Universidad Centroccidental Lisandro Alvarado (UCLA): Barquisimeto, Venezuela, 2020; Volume 3, pp. 39–56. [Google Scholar]
  55. Russell, A.M.; Gnanadesikan, A.; Zaitchik, B. Are the Central Andes mountains a warming hot spot? J. Clim. 2017, 30, 3589–3608. [Google Scholar] [CrossRef]
  56. Saavedra, F.; Kampf, S.; Fassnacht, S.; Sibold, J.S. Changes in Andes snow cover from MODIS data, 2000–2016. Cryosphere 2018, 12, 1027–1046. [Google Scholar] [CrossRef]
  57. Aguilar-Lome, J.; Espinoza-Villar, R.; Espinoza, J.; Rojas-Acuña, J.; Willems, B.; Leyva-Molina, W. Elevation-dependent warming of land surface temperatures in the Andes assessed using MODIS LST time series (2000–2017). Int. J. Appl. Earth Obs. Geoinf. 2019, 77, 119–128. [Google Scholar] [CrossRef]
  58. Olivares, B.; Parra, R.; Cortez, A. Characterization of precipitation patterns in Anzoátegui state, Venezuela. Ería 2017, 3, 353–365. [Google Scholar] [CrossRef]
  59. Olivares, B.; Hernández, R. Regional analysis of homogeneous precipitation areas in Carabobo, Venezuela. Rev. Lasallista Investig. 2019, 16, 90–105. [Google Scholar] [CrossRef]
  60. Pahl-Wostl, C. Transitions towards adaptive management of water facing climate and global change. Water Resour. Impact 2007, 21, 49–62. [Google Scholar] [CrossRef]
  61. Trejo, F.; Barbosa, H.; Ruiz, I.; Peñaloza-Murillo, M. Meso-scale oceanic atmospheric circulation patterns linked with severe and extensive droughts in Venezuela. Rev. Bras. Meteorol. 2016, 31, 468–489. [Google Scholar] [CrossRef]
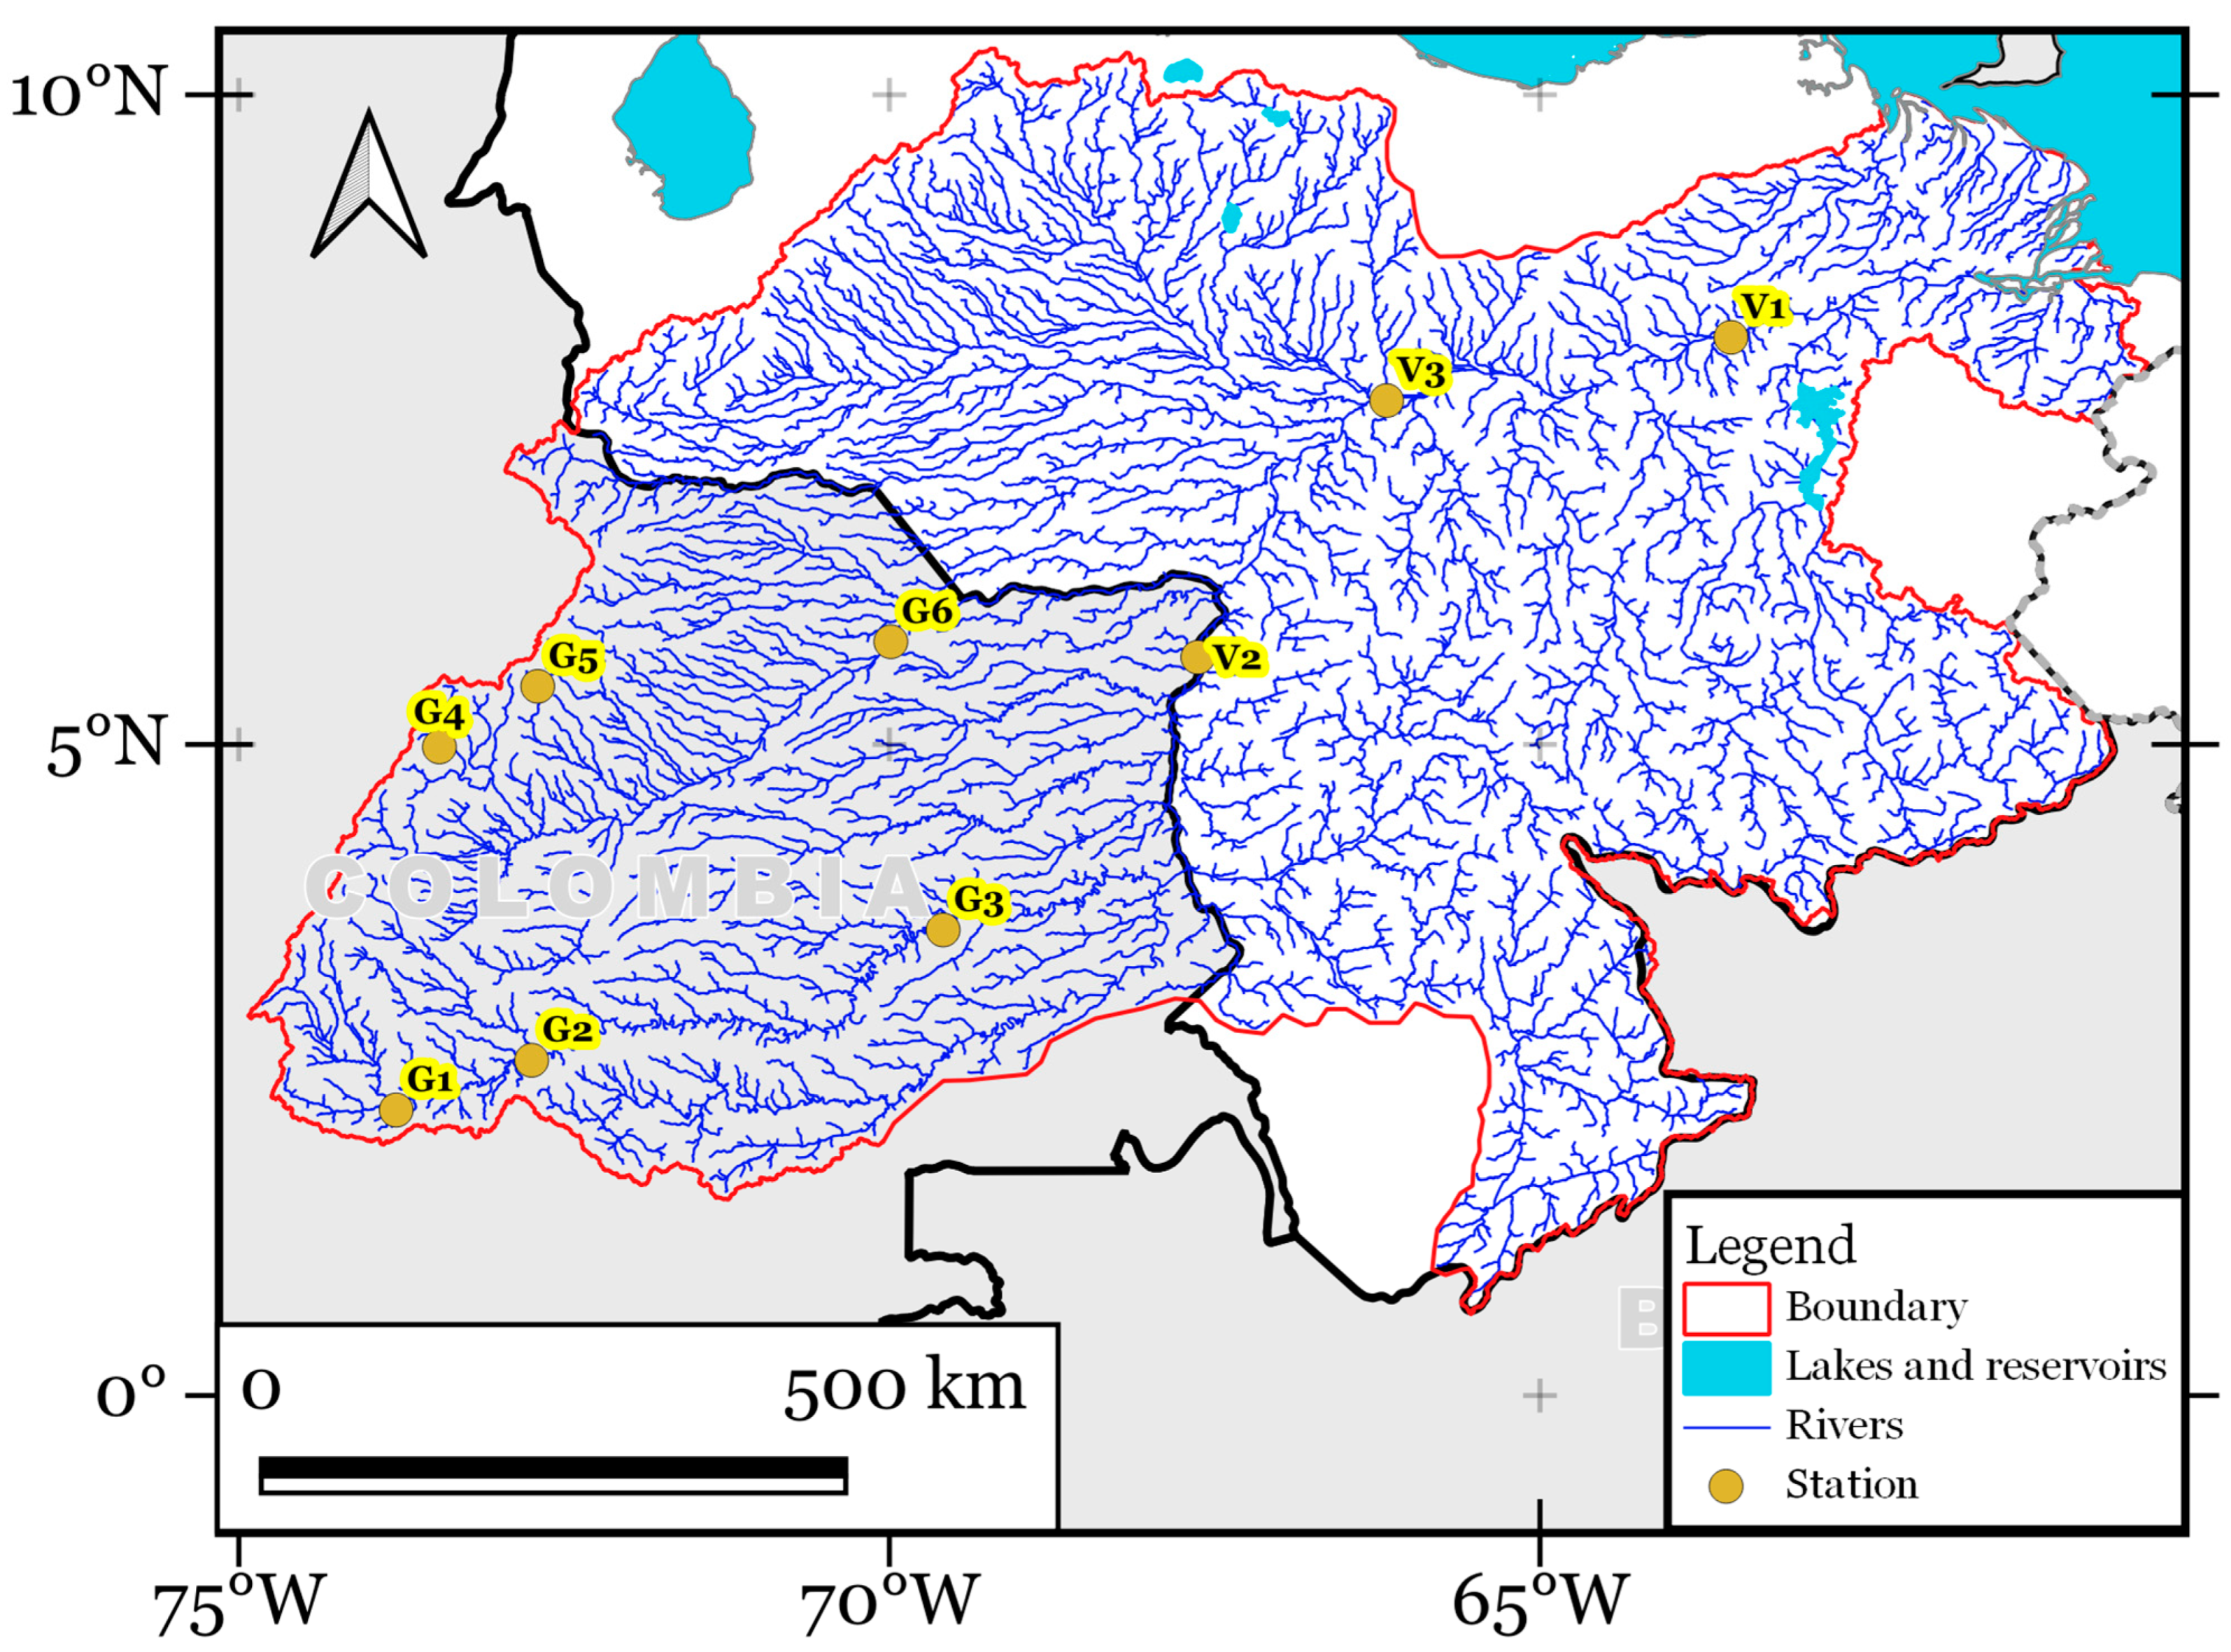
Figure 2. Spatial distribution of fluviometric stations in the Orinoco River Basin. The stations are located in Colombia (G) and Venezuela (V).
Hydrology 10 00195 g002
Figure 3. Average values of (a,b) the Standardized Precipitation Index (SPI) and (c,d) the percentage of surface area affected by dry conditions in the Orinoco River basin from January 1981–September 2020. The black dashed lines in panel c show the months in which the rainy season occurs. The red line in panels b and d corresponds to a fitted regression line.
Hydrology 10 00195 g003
Figure 4. Spatial distribution of (a) average intensity [−]; (b) temporal persistence [%]; (c) EVIa [−]; (d) SSMa [−]; and (e) T2Ma during the occurrence of the extreme dry events listed in Table 1. The base period used in the calculation of EVIa, SSMa, and T2Ma is October 2000–August 2000, January 2002–September 2020, and February 1981–September 2020, respectively. The intensity and temporal persistence of the drought conditions at the pixel level are based on CHIRPS-derived SPI.
Hydrology 10 00195 g004
Figure 5. Temporal evolution of the averaged values in the Orinoco River basin for (a) SPI [−]; (b) T2Ma [−]; (c) EVIa [−]; (d) SSMa [−] during the period January 1981–September 2020. The base periods used in the calculation of EVIa, SSMa, and T2Ma are October 2000–August 2000, January 2002–September 2020, and February 1981–September 2020, respectively. Only periods with available estimates are shown. The red bars in panels (a,d) represent anomalies ≤ −1.00, while in panel (b), they represent anomalies ≥ 1.00. The yellow bands indicate the events E5, E6, E7, and E8 listed in Table 1.
Hydrology 10 00195 g005
Figure 6. The standardized anomaly of the flow or the monthly level registered in the following hydrometric stations: (ac) La Macarena [G1], Puerto Arturo [G2], and Barranco Murciélago [G3] in the Guaviare River; (df) Puente Fierro [G4], Ranchería [G5] and Agua Verde [G6] on the Meta River; (gi) Ciudad Bolívar [V1], Puerto Ayacucho [V2] and Caicara del Orinoco [V3] on the Orinoco River. Panel (j) shows the spatial location of stations G1 through V3. The base period used to calculate the anomalies was January 2000–December 2020. The red bars in panels (af) show anomalies ≤ −1.00. The yellow bands indicate the events E5, E6, E7, and E8, as listed in Table 1.
Hydrology 10 00195 g006
Table 1. Main characteristics of the extreme drought events identified through the SPI in the Orinoco River basin during the period January 1981–September 2020.
EventsStarting
(Month/Year)
Ending
(Month/Year)
Duration
(n)
Max. Coverage (%)Severity
(−)
Average Intensity
(−)
E1Mar. 84May. 84330.074.991.66
E2Jan. 85Abril 85433.366.521.63
E3Mar. 88May. 88349.655.171.72
E4Aug. 97Oct. 97325.284.991.66
E5Apr. 09Jun. 09340.854.991.66
E6Nov. 09Jan. 10333.644.841.61
E7Apr. 15Oct. 15743.4211.741.68
E8Feb. 20Apr. 20333.454.841.61
Table 2. Pearson’s correlation coefficients between the standardized anomalies of the flow or the monthly level registered in the hydrometric stations during the period January 2000–December 2020 are shown in Figure 5j.
G1G2G3G4G5G6V1V2V3
G1
G20.867 **
G30.618 **0.748 **
G40.279 **0.366 **0.321 **
G50.370 **0.431 **0.334 **0.560 **
G60.471 **0.571 **0.556 **0.460 **0.493 **
V10.315 **0.372 **0.522 **0.253 **0.176 n.s.0.441 **
V20.485 **0.556 **0.706 **0.310 **0.243 **0.536 **0.903 **
V30.386 **0.482 **0.616 **0.279 **0.229 **0.535 **0.970 **0.921 **
Note: ** p ≤ 0.05; n.s. = statistically not significant at the 0.05 level.
Disclaimer/Publisher’s Note: The statements, opinions and data contained in all publications are solely those of the individual author(s) and contributor(s) and not of MDPI and/or the editor(s). MDPI and/or the editor(s) disclaim responsibility for any injury to people or property resulting from any ideas, methods, instructions or products referred to in the content.