Article

Thermally Enhanced Spreading of Miscible Plumes in Porous Media

Department of Civil Engineering, University of Colorado Denver, Denver, CO 80217-3364, USA
*
Author to whom correspondence should be addressed.
Hydrology 2023, 10(4), 98; https://doi.org/10.3390/hydrology10040098
Submission received: 26 March 2023 / Revised: 13 April 2023 / Accepted: 17 April 2023 / Published: 21 April 2023
(This article belongs to the Special Issue Novel Approaches in Contaminant Hydrology and Groundwater Remediation)

Abstract

:
In situ groundwater remediation often calls for a chemical or biological amendment to be injected as an aqueous solution into a contaminated groundwater aquifer. Accordingly, remediation depends on mixing the amendment into the contaminated groundwater, which, in turn, depends on spreading the plume of the injected amendment effectively. Here, we present proof-of-principle results from a laboratory study showing that amendment plume spreading can be enhanced by heating the injected water, which is consistent with the mechanism of miscible viscous fingering. The heated water has a lower viscosity, rendering a mobility ratio (i.e., log viscosity ratio) of 1.2 that generates elongated plume perimeters for essentially consistent plume areas. Using a quasi-two-dimensional apparatus and recording photographs after each increment of the injection volume, two image analysis techniques were employed to measure the area and perimeter of the injected plume, and the results are compared to isothermal controls, showing that the plume perimeter increased by 47% when determined by binary image analysis or 56% when determined by morphological image analysis. Accordingly, this study offers evidence that heating the injected water enhances miscible plume spreading in porous media.

1. Introduction

Reactive transport in porous media is important for a number of natural and engineering processes, including geochemical cycling, in situ mining, and groundwater remediation. In any of these applications, a plume of the reagent is introduced—either naturally or deliberately—into the resident groundwater. The reaction depends on mixing the reagent with the groundwater, which fundamentally depends on molecular diffusion, but practically depends on a process called plume spreading. Plume spreading transforms the reagent plume into a fractal-like network of lamella that is thin enough for molecular diffusion to bring reagents together. Because flows in porous media are typically laminar, which precludes the turbulence that provides mixing in other engineered reactors, reactions in porous media are transport-limited. Accordingly, the transport of reagents in porous media is governed by the process of plume spreading.
Plume spreading can be classified as passive or active. Passive spreading results from the heterogeneity that is inherent in essentially any natural porous media. Finding the paths of least resistance, the fluid establishes channels of preferential flow, and the resulting velocity contrasts enhanced plume spreading compared to a hypothetical baseline of homogeneous media. In this context, mass transport by transverse dispersion is known to be an important process [1]. By contrast, active spreading results from the deliberate manipulation of the velocity field through an approach called engineered injection and extraction, for example, through vertically separated segments of the well screen [2] through a manifold of wells [3,4] confirmed by laboratory testing [5,6], or through a rotated dipole mixer [7] confirmed by field testing [8]. The present study proposes a new approach to active plume spreading by heating the injected water. Rather than imposing an engineered velocity field, this approach seeks to enhance plume spreading through the fundamental physics of fluid displacement.
Fluid displacement is the process by which a certain fluid, called the defending fluid, is replaced by a different fluid, called the invading fluid. This process can be classified as stable or unstable. Stable displacement causes the complete replacement of the defending fluid by the invading fluid, for example, when a more viscous fluid displaces a less viscous fluid of equal density or when a dense fluid displaces a light fluid from below. Neglecting hydrodynamic dispersion, stable displacement manifests itself as the plug flow, which is the default conceptual model for many environmental treatment unit operations and for groundwater remediation hydraulics, including pump-and-treat and engineered injection and extraction. By contrast, unstable displacement causes an unstable interface between the defending and invading fluids, causing incomplete replacement (Figure 1). In the context of engineered reactive transport, this unstable interface generates the additional plume spreading of the invading fluid into the defending fluid, called fingering, which provides an opportunity for enhanced mixing by molecular diffusion, and, consequently, a more complete reaction.
Unstable displacement results from various combinations of interfacial tension, density difference, or viscosity difference. When the interfacial tension is nonzero, the displacement is called immiscible, examples of which include enhanced oil recovery and the removal of non-aqueous phase liquids (NAPLs). When the interfacial tension is zero, the displacement is called miscible, for example, when an aqueous chemical or biological amendment is injected into a contaminated groundwater aquifer, which is the focus of the present study. When miscible fluids have an unequal density, a lighter invading fluid fingers into a denser defending fluid during the upward flow, and a denser invading fluid fingers into a lighter defending fluid during the downward flow through a process called gravity fingering [10]. In contrast, for constant-density fluids, gravity fingering is prevented. While it is certainly possible to imagine a groundwater remediation application where the injected aqueous amendment has a significant density difference from the defending groundwater, the focus of the present study is on the viscous fingering of miscible fluids with a constant density.
Viscous fingering results when a less viscous fluid breaks through the miscible interface and creates a new pathway into the more viscous fluid [11,12]; viscous fingering always occurs when a less viscous fluid displaces a more viscous one, regardless of miscibility [13]. Viscous fingering can result from the native viscosity difference of the fluids [14,15] or from varying the injection rate over several orders of magnitude to create new flow regimes [16]. Here, we considered the viscous fingering caused by an imposed temperature that renders a viscosity difference between otherwise identical defending and invading fluids.
Viscous fingering between miscible fluids (Figure 1) depends on two dimensionless numbers: the mobility ratio R, and the Péclet number, Pe [15,17]. The mobility ratio, also called the log-viscosity ratio [17], quantified the viscosity difference between two miscible fluids, where R > 0 was required for viscous fingering, and larger values of R indicated that viscous fingering was more likely. The mobility ratio can be defined as:
R = l n μ 1 μ 2 ,
where μ1 is the dynamic viscosity of the defending fluid and μ2 is the dynamic viscosity of the invading fluid. The Péclet number is a dimensionless ratio of advection to diffusion, which quantifies the general pattern of advection, imposing fine structure on plumes, while diffusion smooths out fine structure. The Péclet number is defined as:
P e = v L D ,
where v is the fluid velocity, L is a characteristic length, and D is the fluid’s self-diffusion constant.
There have been several studies involving temperature as a factor in groundwater remediation. Kaslusky and Udell [18] injected steam to enhance the removal of volatile organic compounds (VOCs), especially dense non-aqueous phase liquids (DNAPLs), from groundwater but did not specifically address mixing, spreading, or fingering. Kosegi et al. [19] found that increasing the temperature across the entire system in an aquifer remediation simulation resulted in faster cleanup times, but their study only noted changes in viscosity without considering changes in plume morphology. Similarly, Payne et al. [20] identified thermal effects in groundwater remediation hydraulics but did not consider plume morphology. Jackson et al. [21] modeled temperature difference between two immiscible fluids that already had a difference in viscosity, and they found that increasing the temperature difference increased the interfacial area, echoing similar results achieved by a model by Islam and Azaiez [22] that assumed the fluids were miscible. Both of these studies graphically analyzed the interfacial length between the invading plume and the defending fluid. However, a review of the literature has yet to identify research in terms of which enhanced plume spreading can be achieved by heating the invading fluid, thus lowering its viscosity. Accordingly, the novel aspect of the present study was to explore plume spreading by injecting a hot invading fluid into a cold defending fluid.

2. Materials and Methods

Thermally enhanced plume spreading was investigated by injecting a yellow-dyed hot invading fluid over a range of injection rates and into a quasi-2D apparatus packed with porous media and saturated with a blue-dyed cold-defending fluid. Photographs were recorded after each 10 mL of injection, and images were analyzed using k-means clustering with both binary and morphological analysis. The results were reported as an increased plume perimeter compared to an isothermal control. Details on each of these points are presented below, and additional information is provided elsewhere [23].

2.1. Apparatus

A quasi-2D porous media apparatus was constructed by etching a 305 mm × 305 mm square into a clear acrylic sheet to a depth of 12 mm. The resulting chamber was filled with glass beads of a diameter of 1 mm, rendering a porosity of n = 0.36 and assuming close random packing [24]. To provide a watertight seal for the acrylic lid, two parallel channels were carved outside the perimeter of the etched square for inner and outer rubber gaskets with circular cross-sections. The lid was secured by 24 round washer head screws (six on each side). Three ports were drilled along a diagonal between opposite corners of the square chamber (one in each corner and one in the center) and were tapped with threads to accommodate them, nominally as a ¼, in PVC plastic barbs.
The chamber was filled with saturated media by temporarily mounting the apparatus on a vertical jig, sealing the lower barb with Parafilm, removing the middle and upper barbs, and adding a slurry of beads and blue-dyed water through a tube inserted first into the middle port, and then into the upper port. A piece of stainless-steel mesh was added to each port before reinstalling the middle and top barbs to prevent the beads from being extracted during experiments. Once the barbed tube connection was tight, the cell was slowly lowered to a horizontal position for testing.
Once the cell was placed horizontally, a tripod was used to mount a 20.4-megapixel camera (Sony DSC-HX300, Tokyo, Japan) set to a high-resolution automatic portrait mode, with pictures were taken using a remote shutter to avoid movement. A consistent photograph orientation was provided by the middle barb and a mark placed on the apparatus lid that appeared in the upper-right of each image.

2.2. Experiments

Four experiments were performed over a range of decreasing injection rates (Table 1). In each experiment, the defending fluid was tap water dyed with 10 drops of blue dye (Standard Blue 106002, Kingscote Chemicals, Miamisburg, OH, USA) per 100 mL, and the invading fluid was tap water dyed with 10 drops of yellow dye (Yellow Color 53–140, Honeyville Grain, Ogden, UT, USA) per 100 mL. Identical dye concentrations were chosen to avoid density-driven flows.
In the control experiments, both fluids were maintained at room temperature at approximately 22 °C. The invading fluid was injected through the center port (Figure 2), while the defending fluid was simultaneously removed from the right port, as required by continuity, to prevent over-pressurizing the apparatus. Close to the center port, the flow was approximately radial; farther from the center port, the flow approximated a dipole (disturbed by the boundary of the square chamber). In each experiment, a 60 mL syringe was filled with invading fluid and placed in the syringe pump, while an empty syringe was placed at the other side of the syringe pump to receive the defending fluid. Injection rates (Table 1) corresponded to 60 mL injected over 1, 2, 4, and 8 min. Photographs were recorded after each 10 mL of injection up to 60 mL. Once the invading fluid was injected and the defending fluid was extracted, to prepare for the next experiment, the pump was reversed to re-inject the blue defending fluid and extract the yellow invading fluid (some of which will have mixed to green) to waste. The receiving vessel was elevated to maintain a positive gauge pressure in the apparatus in order to avoid introducing air bubbles.
In thermally enhanced experiments, the steps above were followed with several modifications. The defending fluid was cooled to a temperature of 11 °C, somewhat below the average groundwater temperature of approximately 15 °C in Colorado, USA [25]. A total of 60 mL of cold blue fluid from this chilled reservoir was then injected by the syringe pump through the left port, while room-temperature blue fluid was extracted through the right port into a vessel placed above the flow chamber. This process of injecting 60 mL batches of cold blue fluid was repeated six times to ensure the entire cell was isothermal. Meanwhile, the invading fluid was boiled on a hot plate and then, after the fluid handling described below, was injected at 73 °C. The injection fluid was assumed to have the same density as the defending fluid because the slight density decrease (2.4% from 11 °C to 72 °C) from heating was assumed to compensate for the slight density increase from the evaporative concentration of the yellow dye. The syringe was filled with hot water first, then the tube from the syringe to the four-way valve (Figure 2), and then the tube from the four-way valve to the flow chamber. The tube from the syringe to the four-way valve was fitted with insulation, but the tube from the four-way valve to the chamber was not insulated to minimize blocking the plume from the camera.

2.3. Analysis

The viscosity of water as a function of temperature was estimated using the correlation of Sharqawy et al. [26]:
μ = 4.2844 × 10 5 + 1 0.157 T + 64.993 2 91.296
where μ is the dynamic viscosity of water [kg m−1 s−1], and T is the temperature [°C] in the range of 0 ≤ T ≤ 100 °C at sea level with an atmospheric pressure of 0.1 MPa. Equation (3) is assumed to be valid at Denver’s atmospheric pressure of approximately 84 kPa. For the defending fluid at 11 °C and the invading fluid at 73 °C, this equation gives μ1 = 1.3 × 10⁻³ kg m−1 s−1 and μ2 = 3.9 × 10⁻⁴ kg m−1 s−1, respectively, rendering the mobility ratio R = 1.2.
Because the injection flow is approximately radial, velocity declines with the distance from the center port, so it is necessary to define a characteristic radius at which to evaluate the velocity. This characteristic radius was chosen to be 54 mm, corresponding to the radius of a theoretical circular cylinder 12 mm tall with a porosity of 0.36 after an injection volume of 40 mL, after which thermally enhanced plume spreading was observed, as presented below. The characteristic length L = 0.1 cm was taken as the diameter of the glass beads, and the self-diffusion coefficient D = 2.14 × 10⁻⁵ cm2/s was taken for the water at 22 °C [27]. These assumptions define a characteristic Péclet number for each of the experiments (Table 1).
Photographs were analyzed to quantify the plume geometry as the area and perimeter of the invading plume, where thermally enhanced experiments were compared to isothermal controls. These geometric results were determined using the Image Region Analyzer in Matlab R2019b [28] for images generated by each of the two methods. Both methods began with color segmentation using k-means clustering and were implemented with the L*a*b* color space and cluster command in Matlab R2019b. This command separated the k = 3 colors of blue (defending), yellow (invading), and green (mixed) in the raw photograph into clusters. In the first image analysis method, the cluster representing the yellow invading plume was converted to a binary image and used to quantify plume geometry. The second image analysis method was morphological structuring, which was implemented with the command strel in Matlab R2019b. This command is specific to shapes and assigns a value to each pixel in relation to the other pixels in its vicinity. Once the image was flattened with the strel command, the imfill command was used to fill the holes within the image to create a continuous shape, accounting for the space occupied by the invading fluid supply tube and the barb fitting.

3. Results

The invading plume after the final injection volume of 60 mL is shown for each experiment 1–4 in Figure 3, and complete results are provided in the Supplementary Information (Figures S1–S4). By construction, the volume of the invading fluid was constant across experiments; the quasi-2D nature of the flow was confirmed by noting that areas, determined by both the image analysis methods, are consistent at approximately 6300 ± 200 mm2 (plus or minus one standard error) for all thermally enhanced experiments and isothermal controls (Table 2). No significant differences were observed in the plume areas between the image analysis methods or between the tests and controls (p < 0.05). The consistently measured plume area was approximately half that of a theoretical circular cylinder 12 mm tall with a porosity of 0.36 after an injection volume of 60 mL, reflecting certain imperfections that render the flow quasi-2D rather than strictly 2D. In contrast, the differences in the invading plume perimeter reflect increases with the decreasing Péclet number. Relative to the control, the plume perimeters were lower, comparable, and lower for Runs 1, 2, and 3, respectively, which could be attributed to experimental variation. For Run 4, at the lowest Péclet number, the plume perimeter increased up to 47% for the binary image analysis and up to 56% for the morphological image analysis.

3.1. Binary Image Analysis

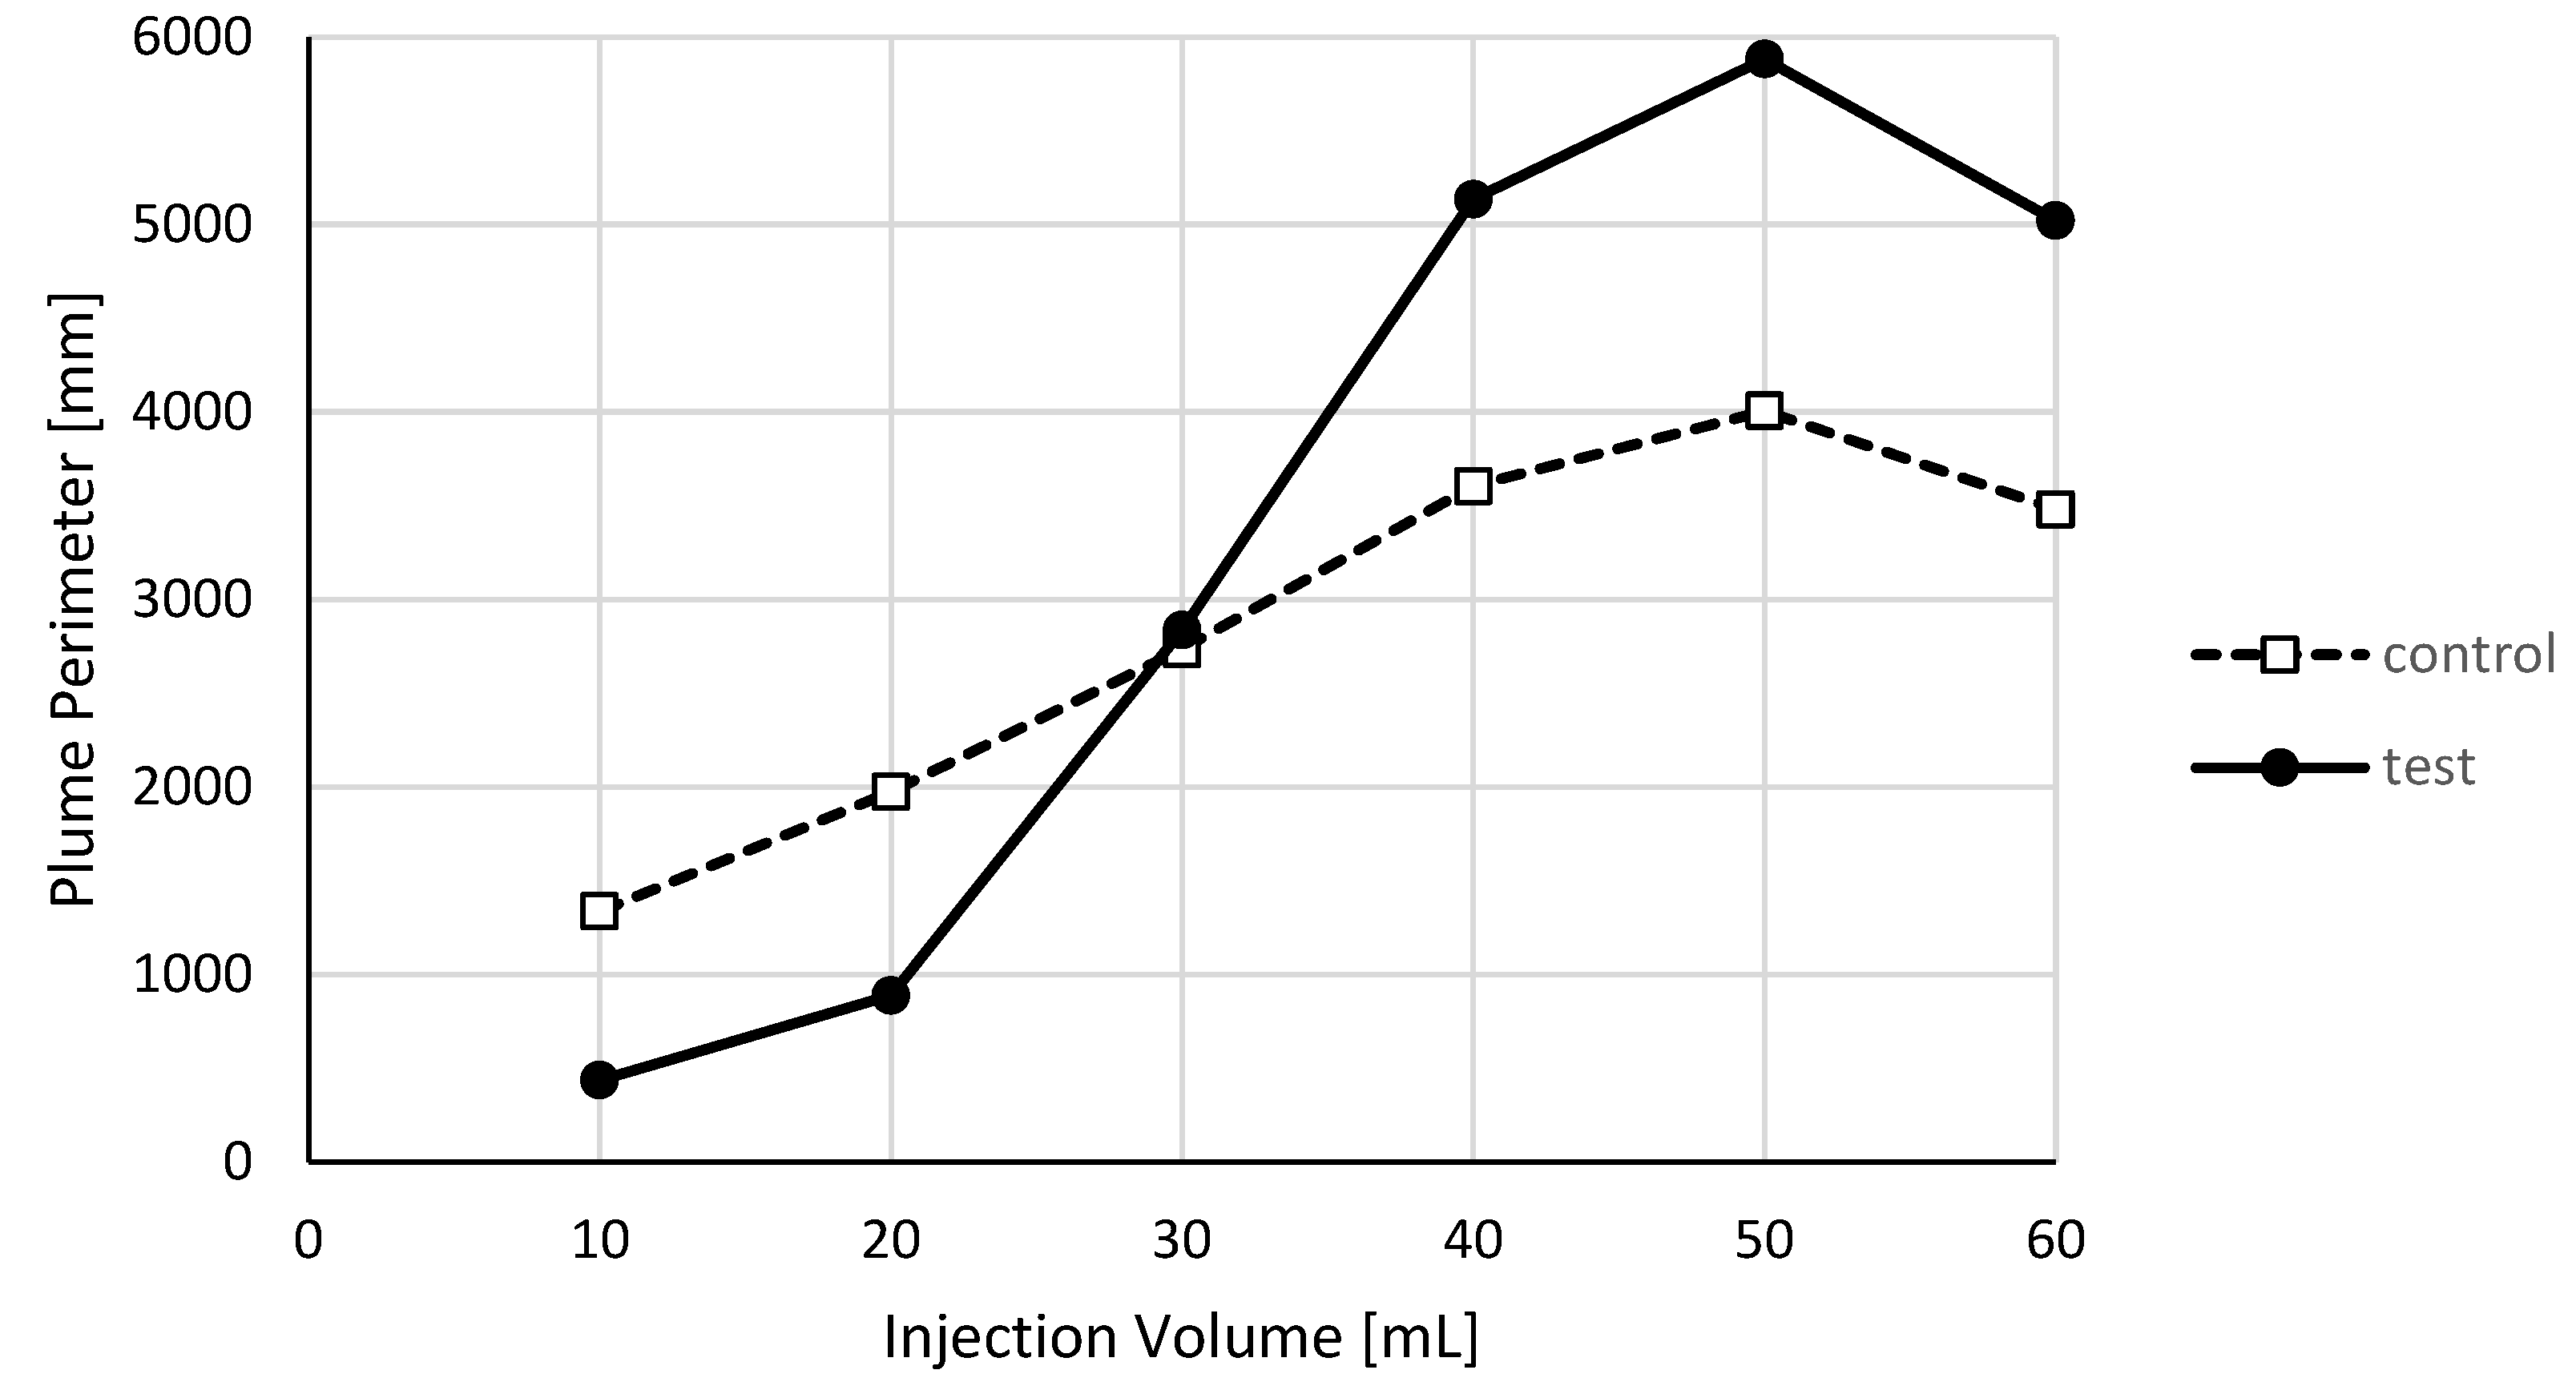
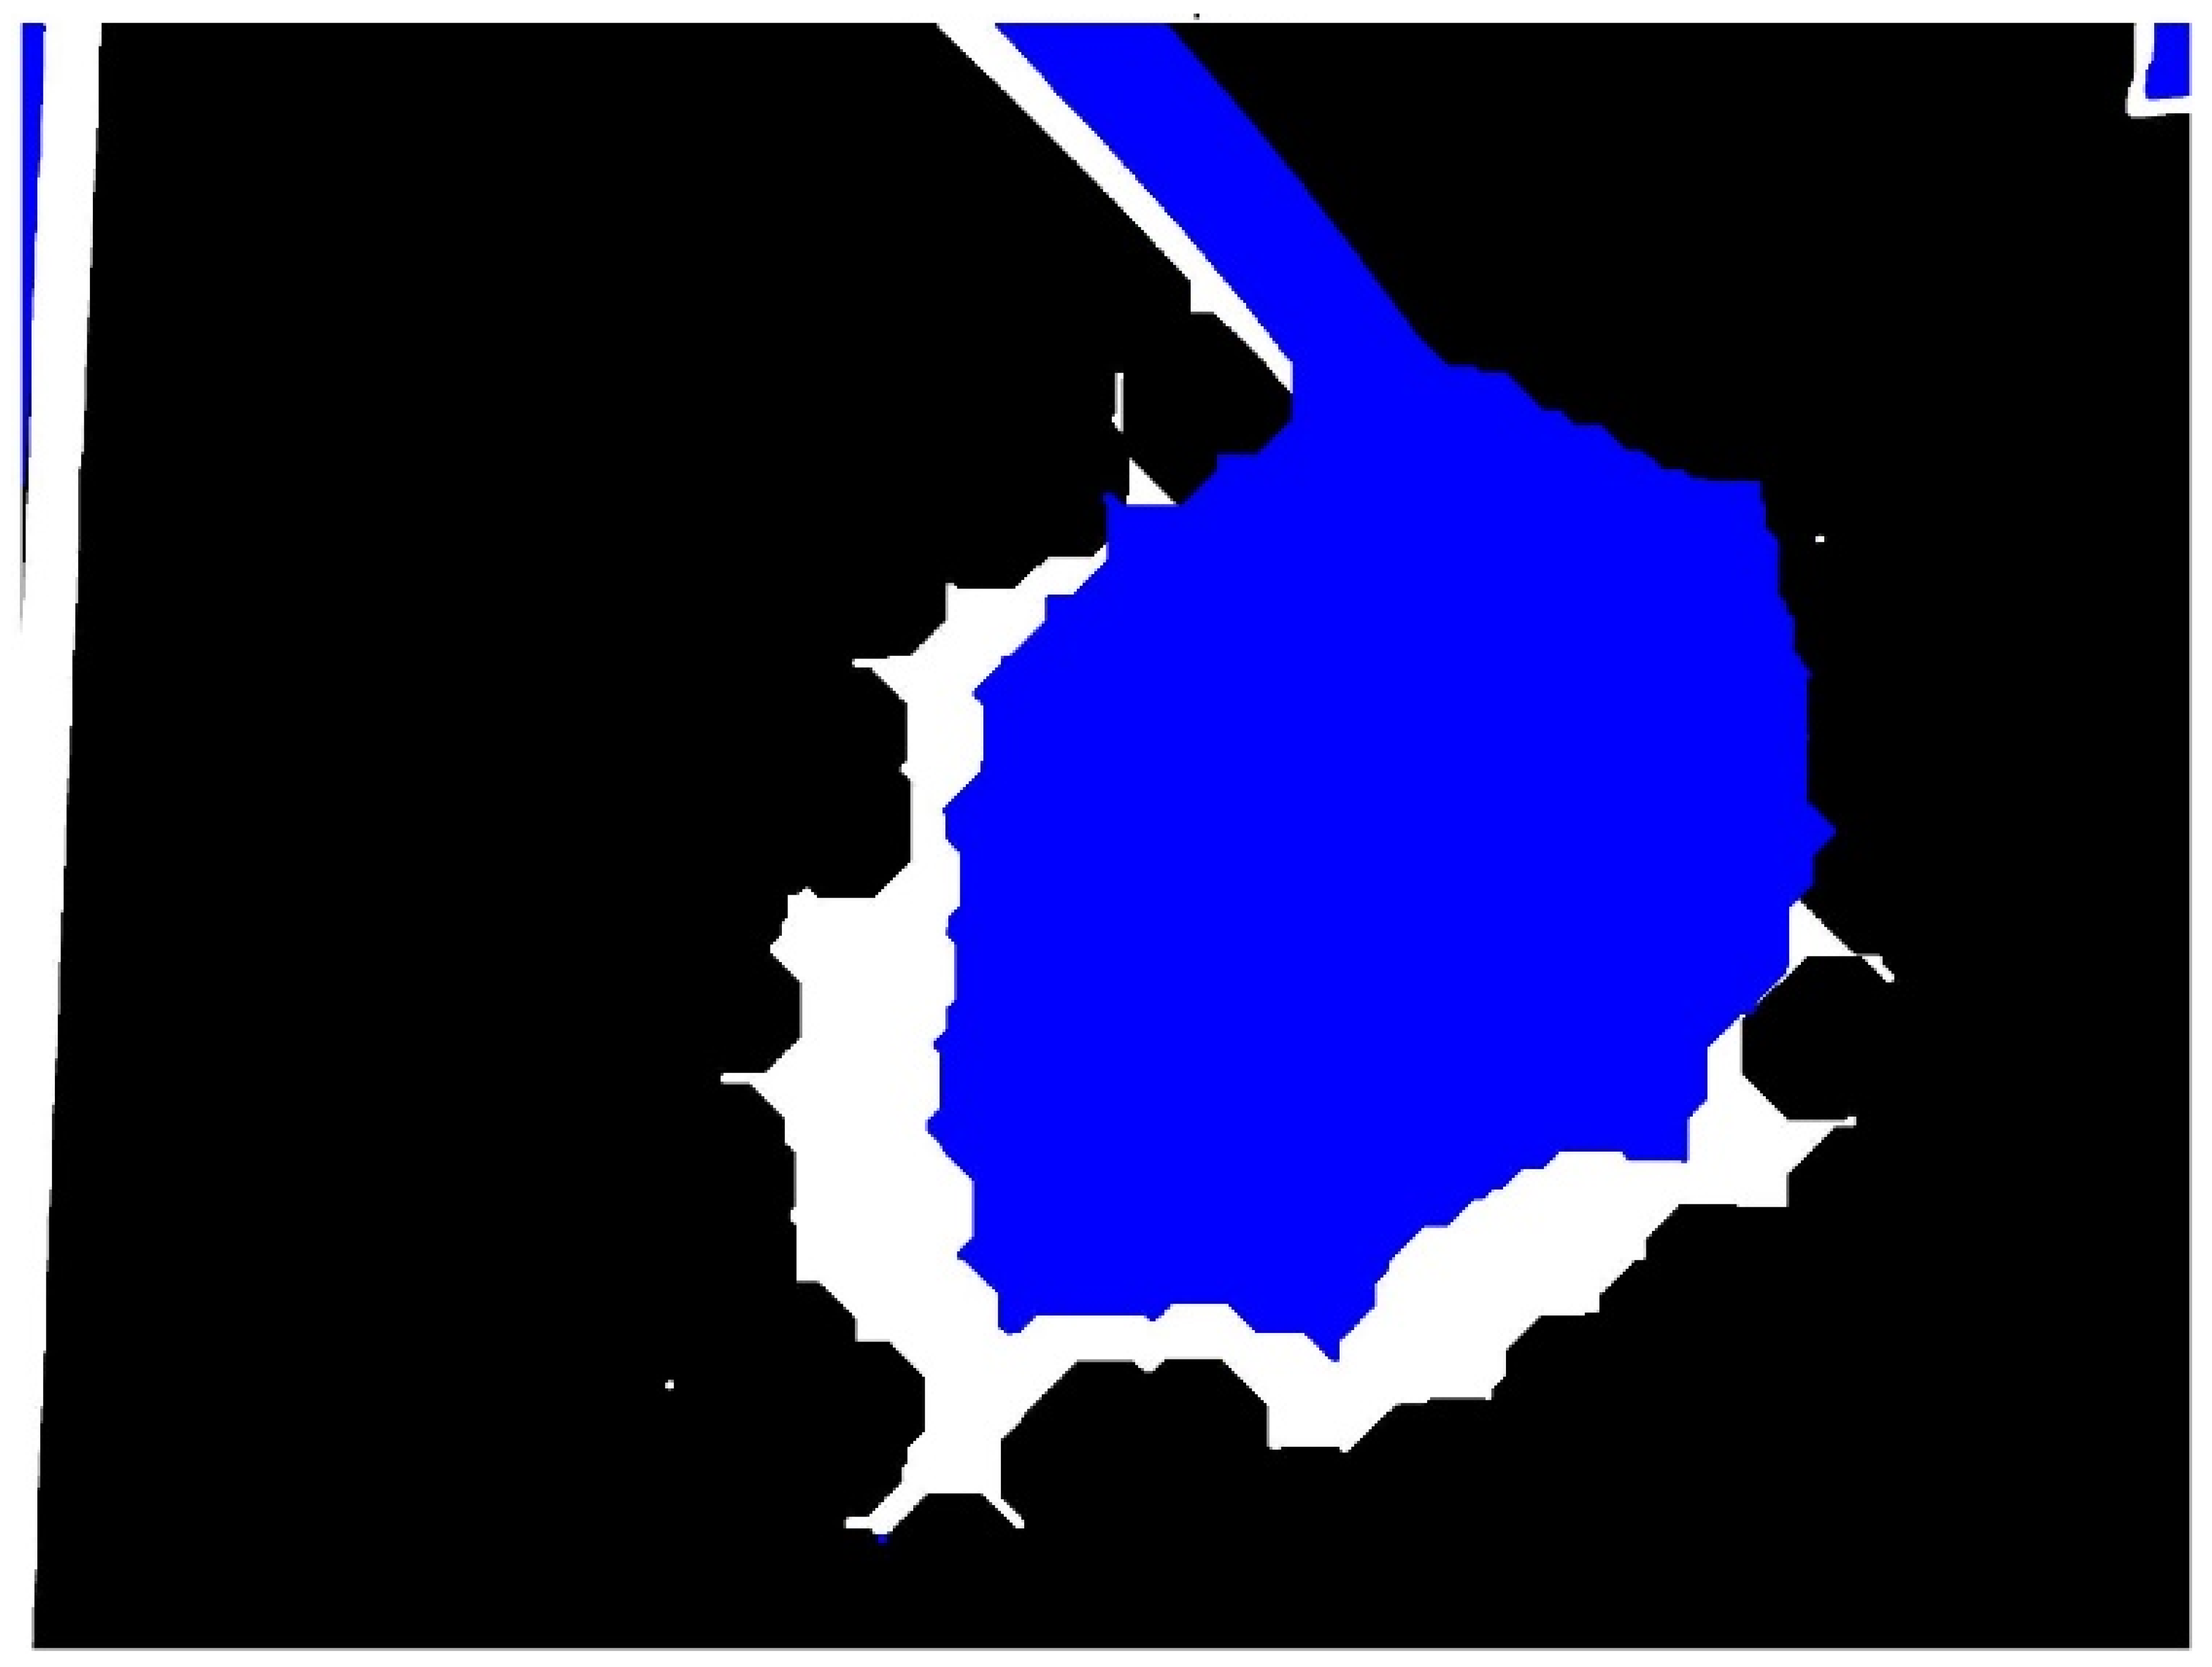
To illustrate the first image analysis method, Figure 4 shows the binary image of plumes for experiment 4 after the injection of 60 mL with the isothermal control plume (in blue) superimposed on the thermally enhanced plume (in white). The elongation of the plume toward the lower-left corner of the image reflects the approximate dipole flow to the extraction port, which is not shown in order to discern more detail in the vicinity of the injection port. Figure 5 shows how the perimeter of the invading plume in the thermally enhanced experiment evolved with time in comparison to the isothermal control. We speculate that the slight reduction in perimeter between 50 and 60 mL of the injection results from the dispersive blurring of the interface with time. The perimeter measured by binary image analysis was approximately ten times that measured by the morphological image analysis, as discussed below. This difference reflects the pixel-by-pixel nature of binary image analysis, which renders a much rougher perimeter. Nevertheless, in experiment 4, the perimeters were similar for injection volumes up to 30 mL, after which the thermally enhanced perimeter was up to 47% greater than the isothermal control.

3.2. Morphological Image Analysis

To illustrate the second image analysis method, Figure 6 shows the isothermal control plume (in blue) superimposed on the thermally enhanced plume (in white), and Figure 7 shows how the perimeter of the invading plume in the thermally enhanced experiment evolved with time in comparison to the isothermal control. Again, we speculate that the slight reduction in perimeter between 50 and 60 mL of the injection resulted from dispersive blurring. The perimeter of the isothermal control was slightly larger than that of a theoretical circular cylinder, appearing 12 mm tall with a porosity of 0.36, which is consistent with the flow approximating a dipole, which has a larger perimeter per area than a circular cylinder. The much smaller perimeter compared to binary image analysis reflects the feature of morphological image analysis that seeks to create contiguous regions, for example, by filling holes. However, the qualitative results matched the binary image analysis, with similar perimeters for injection volumes up to 30 mL, after which the thermally enhanced perimeter was up to 56% greater than the isothermal control.

4. Discussion

The proof-of-principle experiments presented here show the potential for the thermally enhanced spreading of injected plumes of miscible fluids in porous media. Elongated plume perimeters occur with a mobility ratio of R = 1.2 and a Péclet number (as defined in Table 1) of Pe = 40, and this observation is independent of the image analysis method chosen, since both binary and morphological analysis result in similar results. The binary image analysis (Figure 4 and Figure 5) renders a fractal-like plume geometry with increases in perimeter compared to the isothermal control. The complementary morphological image analysis (Figure 6 and Figure 7) renders a solid-like plume geometry also with increases in the perimeter. The combination of these methods provides a more in-depth understanding of the thermally enhanced plume spreading of miscible plumes in porous media.
It is notable that elongated plume perimeters can be generated even within the limited temperature range of liquid water that constrains the maximum possible mobility ratio. Using Equations (1) and (3), the maximum temperature range of 0 °C to 100 °C corresponds to a maximum viscosity range of μ1 = 1.8 × 10⁻³ kg m−1 s−1 to μ2 = 2.8 × 10⁻⁴ kg m−1 s−1, which corresponds to a maximum theoretical mobility ratio of R = 1.9. Practically, the lower temperature is more or less fixed, perhaps reflecting some seasonal variation, but seldom comes close to freezing. The temperature T1 = 11 °C used here is probably a reasonable figure for temperate climates. Similarly, although the injection fluid can be heated to boiling, its temperature upon injection is limited by heat loss during fluid handling. If the tubes used in a field application are larger than the 6.4 mm (1/4 in) diameter tubes used here, the smaller area-to-volume ratio limits heat loss; if the delivery time t = V/Q in a field application is smaller, this could also limit heat loss. Practically, the higher temperature may be higher than the T2 = 73 °C used here but seldom comes close to boiling. This limitation contrasts the present study with prior work by others, where higher temperatures generated steam and, consequently, introduced the immiscible displacement of water by steam. Such higher temperatures have been used in the remediation of NAPLs [18]. In contrast, the present study demonstrates the ability to elongate plume interfaces within a temperature range that one might expect in real aquifers and allows strictly miscible displacement.
The experiments reported here show more plume spreading with a decreasing Péclet number opposite the expectation for miscible plume spreading by viscous fingering [29,30], but is at least qualitatively consistent with the results of Videbæk and Nagel [9], as shown in Figure 1, where the left panels show the suppression of 3D fingers and the right panels show the development of 2D fingers with a decreasing Péclet number. The present study differs from these three in at least two respects. First, the present study measures plume spreading in porous media rather than Hele–Shaw cells. Second, the present study generated plume spreading thermally, so the viscosity difference, and therefore, mobility ratio, depends on both fluid mixing and thermodynamics. That is, given enough time, the two fluids would reach thermal equilibrium with an equal viscosity and mobility ratio R = 0. Accordingly, the results presented here may be somewhat counterintuitive because lower Péclet numbers imply lower velocities and correspondingly more time for the two fluids to reach thermal equilibrium, which drives the mobility ratio back toward zero. The observation of increased plume perimeter suggests that the time scale for elongating plume interfaces is shorter than the time scale for the thermal equilibrium, at least in the experiments reported here.
Another manifestation of the Péclet number effects could be observed in both the binary image analysis (Figure 5) and the morphological image analysis (Figure 7). In both figures, the perimeter of the thermally enhanced invading plume began to exceed that of the isothermal control after 40 mL of the cumulative injection volume. This transition was observed only in experiment 4 with the smallest Péclet number Pe = 40; it was not observed in other experiments with larger Péclet numbers (Table 1). This observation suggests that there is a critical Péclet number above which little thermally enhanced plume spreading occurs. In experiment 4, when the cumulative injection volume was 30 mL or less, the Péclet number was too high; when the cumulative injection volume was 40 mL or more, the Péclet number was low enough. In experiment 3, when the cumulative injection volume was 60 mL or less, the Péclet number was too high, which was similar to experiments 2 and 1, which had even higher injection rates. Accordingly, experiment 4 suggests a critical Péclet number in the range of 40–46, while experiment 3 suggests that the critical Péclet number is less than 65. Taken together, these results suggest that thermally enhanced plume spreading might have been expected in experiment 3 at a cumulative injection volume of 160 mL (although this larger volume would correspond to a longer injection time which could allow thermodynamics to eliminate the mobility ratio as discussed above).
Further experiments are required to address the limitations of this proof-of-principle study. First, the assumption of the equal density of invading and defending fluids should be tested. Second, a modified apparatus could prevent the inlet fitting and supply tubing from appearing in the plume images and using a deeper chamber could determine whether a fully 3D apparatus might reveal experimental artifacts in our quasi-2D apparatus. Third, additional experiments are required to further constrain the critical Péclet number and to determine whether enhanced plume spreading at lower injection rates (i.e., lower Péclet number) could be suppressed by the thermal equilibrium resulting from the additional injection time. Fourth, additional experiments are required to extend these results to 3D flows and reactive transport. For example, delivering hot amendments could accelerate reactions not only by improving plume spreading but also by hastening reaction kinetics. On the other hand, boiling (or nearly boiling) the injection fluid could preclude injecting amendments that are volatile, thermally unstable, or biologically active. Having stated these limitations, the observation of elongated plume interfaces in this experiment suggests that heating the injection fluid may increase the size and extent of the reactive interface between the injected plume and the native groundwater, which, in turn, may result in a larger volume of remediated groundwater. The results of the present study are the first steps toward quantifying the effectiveness of thermally enhanced plume spreading as a tool for in situ groundwater remediation.

Supplementary Materials

The following supporting information can be downloaded at https://www.mdpi.com/article/10.3390/hydrology10040098/s1: A portable document format (PDF) file containing Figures S1–S4. A Microsoft Excel workbook containing experimental data.

Author Contributions

All authors contributed to the study conception and design. Material preparation, data collection and analysis were performed by W.L.B. in 2017–2018 and by R.G.T. in 2018–2020, both supervised by D.C.M. The first draft of the manuscript was written by R.G.T. All authors have read and agreed to the published version of the manuscript.

Funding

The authors declare that no funds, grants, or other support were received during the preparation of this manuscript.

Data Availability Statement

The Supplementary Information provides (1) photographs of control and test plumes after each 10 mL of injection in experiments 1–4 and (2) a spreadsheet with details on geometry, mobility ratio, Reynolds number, Péclet number, and image analysis.

Acknowledgments

The authors thank Jac Corless for fabricating the apparatus and three anonymous referees for their constructive feedback.

Conflicts of Interest

The authors have no relevant financial or non-financial interests to disclose.

References

  1. Cirpka, O.A. Effects of sorption on transverse mixing in transient flows. J. Contam. Hydrol. 2005, 78, 207–229. [Google Scholar] [CrossRef]
  2. Sposito, G. Chaotic solute advection by unsteady groundwater flow. Water Resour. Res. 2006, 42, W06D03. [Google Scholar] [CrossRef]
  3. Bagtzoglou, A.C.; Oates, P.M. Chaotic advection and enhanced groundwater remediation. J. Mater. Civ. Eng. 2007, 19, 75–82. [Google Scholar] [CrossRef]
  4. Mays, D.C.; Neupauer, R.M. Plume spreading in groundwater by stretching and folding. Water Resour. Res. 2012, 48, W07501. [Google Scholar] [CrossRef]
  5. Zhang, P.F.; DeVries, S.L.; Dathe, A.; Bagtzoglou, A.C. Enhanced mixing and plume containment in porous media under time-dependent oscillatory flow. Environ. Sci. Technol. 2009, 43, 6283–6288. [Google Scholar] [CrossRef]
  6. Sather, L.J.; Roth, E.J.; Neupauer, R.M.; Crimaldi, J.P.; Mays, D.C. Experiments and simulations on plume spreading by engineered injection and extraction in refractive index matched porous media. Water Resour. Res. 2023, 59, e2022WR032943. [Google Scholar] [CrossRef]
  7. Lester, D.; Metcalfe, G.; Trefry, M.G.; Ord, A.; Hobbs, B.; Rudman, M. Lagrangian topology of a periodically reoriented potential flows Symmetry, optimization, and mixing. Phys. Rev. E 2009, 80, 036298. [Google Scholar] [CrossRef]
  8. Cho, M.S.; Solano, F.; Thomson, N.R.; Trefry, M.G.; Lester, D.R.; Metcalfe, G. Field trials of chaotic advection to enhance reagent delivery. Ground Water Monit. Remediat. 2019, 39, 23–39. [Google Scholar] [CrossRef]
  9. Videbæk, T.E.; Nagel, S.R. Diffusion-driven transition between two regimes of viscous fingering. Phys. Rev. Fluids 2019, 4, 033902. [Google Scholar] [CrossRef]
  10. Flowers, T.C.; Hunt, J.R. Viscous and gravitational contributions to mixing during vertical brine transport in water-saturated porous media. Water Resour. Res. 2007, 43, W01407. [Google Scholar] [CrossRef]
  11. Saffman, P.C. Viscous fingering in Hele-Shaw cells. J. Fluid Mech. 1986, 173, 73–94. [Google Scholar] [CrossRef]
  12. Chen, J.-D. Radial viscous fingering patterns in Hele-Shaw cells. Exp. Fluids 1987, 5, 363–371. [Google Scholar] [CrossRef]
  13. Homsy, G.M. Viscous fingering in porous media. Annu. Rev. Fluid Mech. 1987, 19, 271–311. [Google Scholar] [CrossRef]
  14. Saghir, M.Z.; Chaalal, O.; Islam, M.R. Numerical and experimental modeling of viscous fingering during liquid–liquid miscible displacement. J. Pet. Sci. Eng. 2000, 26, 253–262. [Google Scholar] [CrossRef]
  15. Jha, B.; Cueto-Felgueroso, L.; Juanes, R. Fluid mixing from viscous fingering. Phys. Rev. Lett. 2011, 106, 194502. [Google Scholar] [CrossRef]
  16. Sandnes, B.; Flekkøy, E.G.; Knudsen, H.A.; Måløy, K.J.; See, H. Patterns and flow in frictional fluid dynamics. Nat. Commun. 2011, 2, 288. [Google Scholar] [CrossRef]
  17. Afshari, S.; Hejazi, S.H.; Kantzas, A. Role of medium heterogeneity and viscosity contrast in miscible flow regimes and mixing zone growth: A computational pore-scale approach. Phys. Rev. Fluids 2018, 3, 054501. [Google Scholar] [CrossRef]
  18. Kaslusky, S.F.; Udell, K.S. Co-Injection of air and steam for the prevention of the downward migration of DNAPLs during steam enhanced extraction: An experimental evaluation of optimum injection ratio predictions. J. Contam. Hydrol. 2005, 77, 325–347. [Google Scholar] [CrossRef]
  19. Kosegi, J.M.; Minsker, B.S.; Dougherty, D.E. Feasibility study of thermal in situ bioremediation. J. Environ. Eng. 2000, 126, 601–610. [Google Scholar] [CrossRef]
  20. Payne, F.C.; Quinnan, J.A.; Potter, S.T. Remediation Hydraulics; CRC Press: New York, NY, USA, 2008. [Google Scholar]
  21. Jackson, S.J.; Power, H.; Giddings, D. Immiscible thermo-viscous fingering in Hele-Shaw cells. Comput. Fluids 2017, 156, 621–641. [Google Scholar] [CrossRef]
  22. Islam, M.N.; Azaiez, J. Thermo-viscous fingering in quarter five-spot miscible displacements. Eur. J. Mech. B/Fluids 2011, 30, 107–119. [Google Scholar] [CrossRef]
  23. Tigera, R.G. Temperature Dependent Viscosity Driven Mixing in a Quasi-2D Porous Media Apparatus. Master’s Thesis, Department of Civil Engineering, University of Colorado Denver, Denver, CO, USA, 2020. [Google Scholar]
  24. Dullien, F.A.L. Porous Media: Fluid Transport and Pore Structure, 2nd ed.; Academic Press: Cambridge, MA, USA, 1992. [Google Scholar]
  25. Repplier, F.N.; Rell, M.M.; Columbia, R.K. MS-21 Groundwater Temperatures Map of Colorado. In Colorado Geological Survey; Department of Natural Resources: Denver, CO, USA, 1981; Available online: https://coloradogeologicalsurvey.org/publications/groundwater-temperatures-map-colorado (accessed on 30 September 2022).
  26. Sharqawy, M.H.; Lienhard, V.J.H.; Zubair, S.M. The thermophysical properties of seawater: A review of existing correlations and data. Desalination Water Treat. 2010, 16, 354–380. [Google Scholar] [CrossRef]
  27. Dahal, U.; Adhikari, N.P. Molecular dynamics study of diffusion of heavy water in normal water at different temperatures. J. Mol. Liq. 2012, 167, 34–39. [Google Scholar] [CrossRef]
  28. MathWorks; Matlab 9.7.0.1319299 (R2019b) Update 5; MathWorks: Natick, MA, USA, 2020.
  29. Sharma, V.; Nand, S.; Pramanik, S.; Chen, C.-Y.; Mishra, M. Control of radial miscible viscous fingering. J. Fluid Mech. 2020, 884, A16. [Google Scholar] [CrossRef]
  30. An, B.; Solorzano, D.; Yuan, Q. Viscous fingering dynamics and flow regimes of miscible displacements in a sealed Hele-Shaw cell. Energies 2022, 15, 5798. [Google Scholar] [CrossRef]
Figure 1. Viscous fingering for miscible fluids with mobility ratio R = 1.6 in a Hele–Shaw cell (a) with an aperture width of b = 205 μm. As the injection rate decreases from 10 mL/min in the left-most panel to 1 μL/min in the right-most panel (b), the viscous fingers become more pronounced. Reproduced from Videbæk and Nagel [9] with permission from the American Physical Society.
Hydrology 10 00098 g001
Figure 2. Schematic of experimental apparatus, where the cold defending fluid is blue, the hot invading fluid is yellow, and the mixed fluid is green. Red arrows are injections; blue arrows are extraction. Syringe pump 1 connects via a four-way valve to the reservoir of hot invading fluid, the center injection port, and the waste line; syringe pump 2 connects via a three-way valve to the reservoir of cold defending fluid and the right extraction port.
Hydrology 10 00098 g002
Figure 3. Thermally enhanced plumes after injection of 60 mL for (a) Experiment 1 at Pe = 320, (b) Experiment 2 at Pe = 160, (c) Experiment 3 at Pe = 80, and (d) Experiment 4 at Pe = 40.
Hydrology 10 00098 g003
Figure 4. Binary image of the control plume (blue) superimposed on the thermally enhanced plume (white) for experiment 4 with Pe = 40 after injection of 60 mL.
Hydrology 10 00098 g004
Figure 5. Plume perimeter determined by binary image analysis versus injection volume for experiment 4 with Pe = 40. The thermally enhanced test plume had a maximum perimeter of 5883 mm, which is 47% more than the corresponding control perimeter plume length of 4005 mm.
Hydrology 10 00098 g005
Figure 6. Morphological image of the control plume (blue) superimposed on the thermally enhanced plume (white) for experiment 4 with Pe = 40 after injection of 60 mL.
Hydrology 10 00098 g006
Figure 7. Plume perimeter determined by morphological image analysis versus injection volume for experiment 4 with Pe = 40. The thermally enhanced test plume had a maximum perimeter of 649 mm, which is 56% more than the corresponding control perimeter plume length of 416 mm. For comparison, the dotted line is the perimeter of a theoretical circular cylinder that is 12 mm tall with a porosity of 0.36.
Hydrology 10 00098 g007
Table 1. Overview of plume spreading experiments.
ExperimentDischarge [mL/min]Péclet NumberFigure
160320S1
230160S2
31580S3
47.540S4
Table 2. Mean areas of invading plumes [mm2] after 60 mL of injection.
Image Analysis Method *
BinaryMorphological
control6610 ± 1506540 ± 202
test6108 ± 6546025 ± 728
* Results shown plus or minus one standard error.
Disclaimer/Publisher’s Note: The statements, opinions and data contained in all publications are solely those of the individual author(s) and contributor(s) and not of MDPI and/or the editor(s). MDPI and/or the editor(s) disclaim responsibility for any injury to people or property resulting from any ideas, methods, instructions or products referred to in the content.