Article

Assessment and Mitigation of Fecal Bacteria Exports from a Coastal North Carolina Watershed

1
Department of Health Education and Promotion, East Carolina University, Greenville, NC 27858, USA
2
US Food and Drug Administration, Raleigh, NC 27601, USA
3
NC Department of Environmental Quality, Winston-Salem, NC 27105, USA
4
Agricultural and Biological Engineering Department, University of Florida, Gainesville, FL 32611, USA
5
Department of Coastal Studies, East Carolina University, Greenville, NC 27858, USA
*
Author to whom correspondence should be addressed.
Hydrology 2023, 10(7), 156; https://doi.org/10.3390/hydrology10070156
Submission received: 27 June 2023 / Revised: 20 July 2023 / Accepted: 20 July 2023 / Published: 23 July 2023

Abstract

:
Urban runoff from the Boat House Creek watershed was suspected as a main delivery mechanism for fecal indicator bacteria (FIB) to the lower White Oak River Estuary in coastal North Carolina, but the dominant source of waste (animal or human) was unknown. Water samples from eight locations within the watershed were collected approximately monthly for two years for enumeration of Escherichia coli (E. coli), enterococci, physicochemical characterization, and microbial source tracking analyses. Concentrations and loadings of E. coli and enterococci were typically elevated during stormflow relative to baseflow conditions, and most samples (66% of enterococci and 75% of E. coli) exceeded the US EPA statistical threshold values. Concentrations of FIB were significantly higher during warm relative to colder months. Human sources of FIB were not observed in the samples, and FIB concentrations increased in locations with wider buffers, thus wildlife was the suspected main FIB source. Stormwater control measures including a rain garden, water control structures, swale modifications, and check dams were implemented to reduce runoff and FIB loadings to the estuary. Stormflow reductions of >5700 m3 year−1 are estimated from the installation of the practices. More work will be needed to improve/maintain water quality as watershed development continues.

1. Introduction

When land is converted from forestry or grasslands to urban development, soil and infiltrative surfaces are covered with pavement, rooftops, and other structures that effectively reduce the capacity of rainwater to enter the soil [1,2]. Runoff from these surfaces is generated and piped to drainageways, often resulting in flash flooding [3] and erosion of the banks and beds of streams because of the velocity of the runoff [4]. Additionally, stormwater has been shown to contribute to the inundation of groundwater within the surficial aquifer, compounding the issue of flooding in coastal areas [5]. Flooding of streams in urban watersheds can lead to damage or loss of property and may create unhealthy living conditions due to mold [6] and loss of structural integrity of buildings [7]. Urban runoff is a commonly cited source of water use impairment via the mobilization and transport of pollutants such as animal waste, trash, and sediment that collect on hard surfaces prior to rain events [8]. In some coastal communities, shellfish harvesting waters are temporarily closed after storm events to reduce the risk of illness from the consumption of contaminated shellfish associated with polluted runoff [9].
Stormwater control measures including bioretention, constructed wetlands, and/or detention basins are now required in many larger cities to slow the delivery of runoff and pollutants to streams [10,11,12]. However, many communities were developed prior to the required implementation of the control measures and thus the streams draining these watersheds may exhibit erosion, frequent flooding, and other characteristics symptomatic of “urban stream syndrome” [13]. Implementation of retrofit stormwater control practices is needed in these previously developed watersheds to reduce problems associated with excess runoff [14,15]. Managing stormwater runoff is of growing concern in coastal regions where water-based recreation and tourism are economic drivers. Approximately 39% of the U.S. population lives within coastal shoreline counties, and 52% lived within coastal watershed counties [16]. Population density among coastal regions greatly exceeds the population density of the nation as a whole [16]. Thus, as more people move to coastal areas, managing runoff from existing and new development becomes even more important to prevent public and environmental health issues related to flooding and exposure to contaminants in floodwaters.
The State of North Carolina, USA has implemented a watershed planning program that includes the periodic assessment of surface waters for various intended uses including recreation, aquatic habitat, and water supply [17]. The program identifies any potential stressors that may be responsible for the impairment of the waters and provides suggestions for improving water quality. One such plan was developed for the White Oak River watershed, which includes the Town of Cedar Point [18]. This coastal area, following a national trend, has had a human population increase of over 30% since 1990 [18]. With the increase in population, there was a corresponding increase in the construction of housing, roads, and impervious surfaces and a related decrease in natural areas and buffers to filter stormwater (supplemental). Boathouse Creek within the Lower White Oak River watershed of North Carolina was listed as impaired in the early 2000’s due to elevated fecal indicator bacteria (FIB) concentrations [18]. Research has documented that the dominant sources of FIB in water resources may include livestock, pets, wildlife, and humans, and the major sources of FIB are influenced by land-use characteristics of the watershed [19]. For example, using microbial source tracking techniques, researchers [20] determined that livestock were the main source of FIB in the Eighteen Mile River Watershed of Ontario, which has mostly agricultural land use. Another study [21] reported that dogs contributed the highest load of FIB to a beach site in Virginia Key, Florida, USA where pet owners were not required to pick up pet waste deposited on the beach. Birds were identified by researchers [22] as the main source of FIB in a Florida watershed that was managed for wildlife conservation. Human markers associated with FIB were the most abundant downstream from wastewater treatment plant outfalls within the Rio Grande de Arecibo watershed of Puerto Rico [23]. Therefore, land use and land management can have a controlling influence on the microbial quality of water.
The Boathouse Creek watershed in coastal NC has experienced significant land use conversion over the past two decades, mostly related to residential development (supplemental materials). Wastewater in this watershed is managed via onsite wastewater systems (OWS) sometimes called septic systems. Prior research has shown that high densities (typically > 1 system ha1) of OWS have been associated with elevated concentrations of FIB in adjacent surface waters [9,24,25,26], likely due to malfunction and/or discharge of insufficiently treated wastewater. Other studies have shown that as the percent imperviousness of a watershed increases, FIB concentrations in adjacent surface waters also increase especially after rainfall [27,28]. Increases in watershed impervious surface and the number of OWS have occurred in the Boat House Creek watershed, and thus one or both may be contributing to the issues with excess FIB concentrations in waters. The Boathouse Creek watershed includes portions of the Croatan National Forest, home to various wildlife including black bears, turkeys, deer, and various wading birds [29]. Thus, wildlife may also be a significant source of FIB in the watershed. These potential sources of FIB in waters discharged from the Boathouse Creek watershed are outlined in the watershed plan [18]. A better understanding of the major sources of FIB and delivery mechanisms to the estuary is needed to help address the issues with water impairment.
The goals of this project were to assess the concentrations and exports of fecal indicator bacteria (E. coli and enterococci) within the Boathouse Creek watershed and implement measures to help improve water quality by reducing the delivery of FIB to the estuary.

2. Materials and Methods
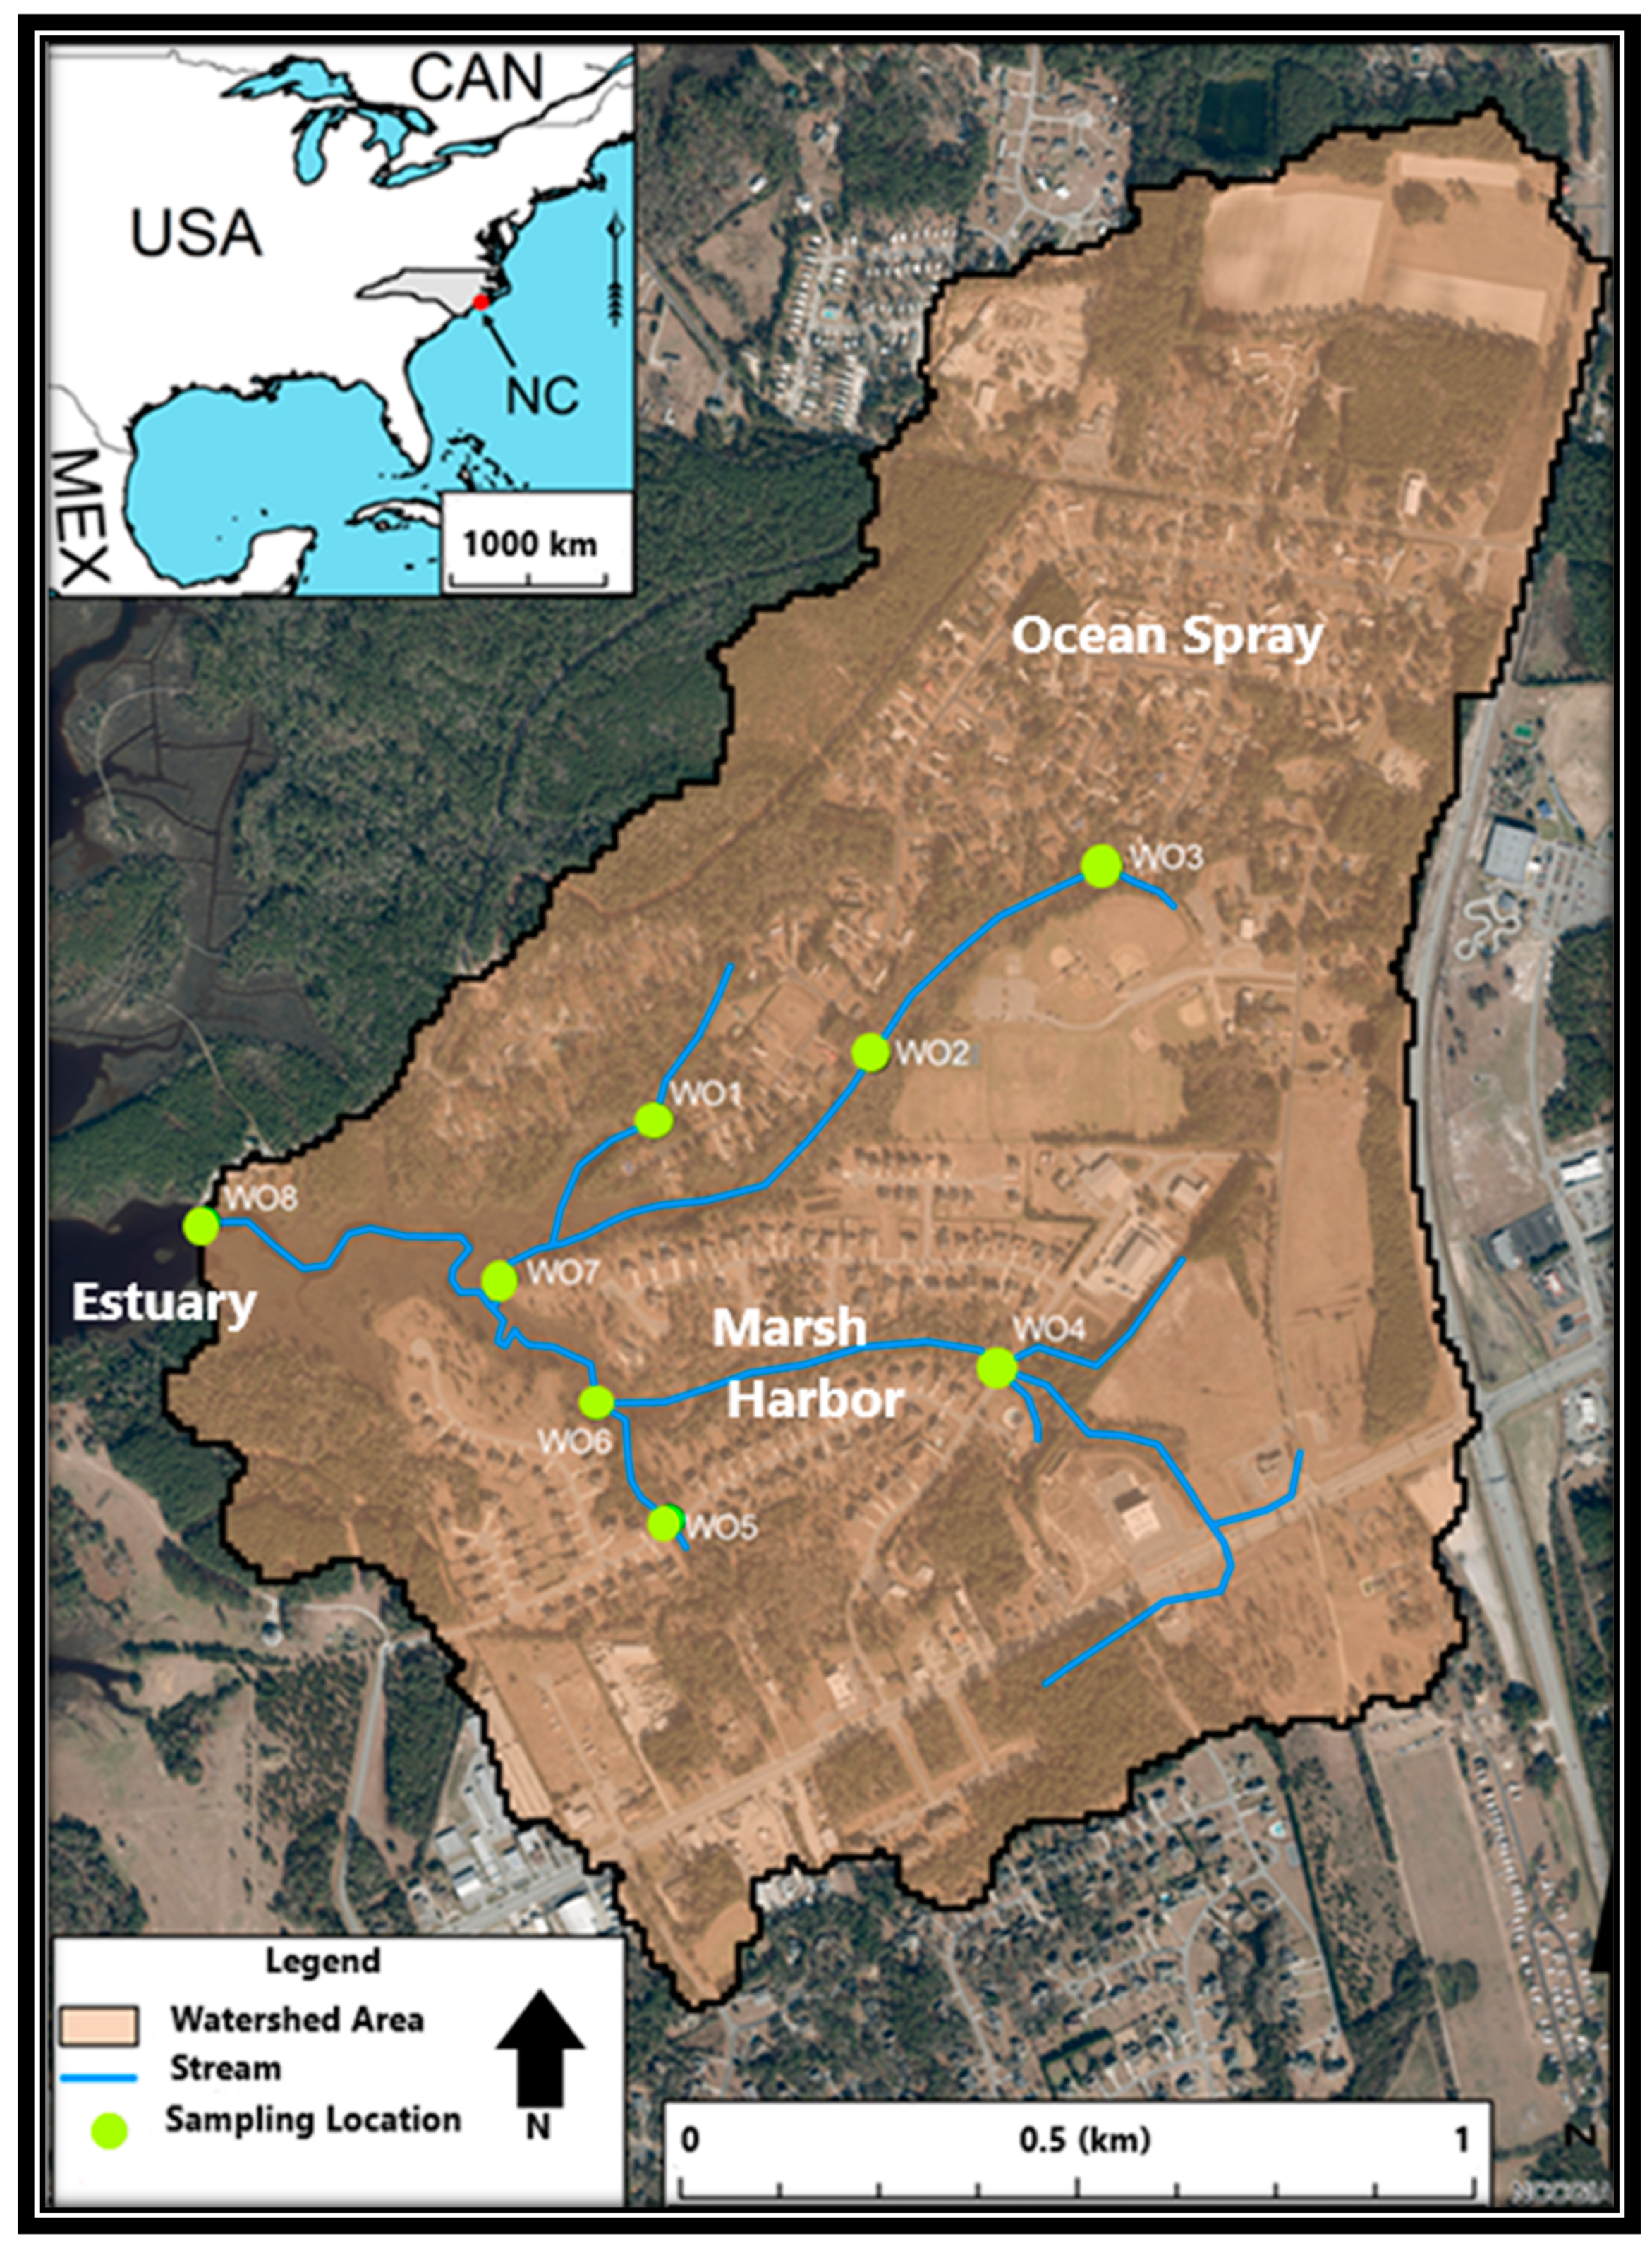
2.1. Site Selection

Boathouse Creek is a low-order stream that empties into the lower estuarine portion of the White Oak River of coastal North Carolina, USA (Figure 1). The watershed not only encompasses approximately 2.5 km2 of land and is largely made up of the Ocean Spray and Marsh Harbor residential communities but also includes portions of the Croatan National Forest, a boat landing, and a park operated by the Town of Cedar Point. The population in Cedar Point increased from 823 people in the year 2000 to 1763 in 2020 [30], and with the growth, land development also increased. The Ocean Spray community on the northern half of the watershed was developed in the 1980s while Marsh Harbor on the southern half was developed over the last 15 years and contributed to much of the recent population growth. Marsh Harbor was completely forested prior to development, meaning approximately 30 ha of natural woodland was converted to residential land use Soils within the watershed largely consist of well-drained sands to sandy loams (Table 1); thus, prior to development, there was relatively little runoff during and after rain events. The development of Marsh Harbor has decreased the abundance of natural vegetation and increased the amount of impervious surface coverage in the watershed, contributing more stormwater runoff to Boathouse Creek and exacerbating the water-quality issues [18]. The area averages about 125 cm of annual rainfall with the summer months of July-September typically receiving 45 cm of cumulative rainfall on average [31]. This timeframe coincides with peak water-sport-related activities in the estuary, and thus exposure (to FIB) risks may be heightened during the summer due to runoff.

2.2. Sampling Locations

Eight locations were selected for routine monitoring and sampling of the Boathouse Creek watershed (Figure 1). Sites WO-1 to WO-3 and WO-7 are located along the northern tributaries and drain the Ocean Spray neighborhood that was developed during the 1980s and the Cedar Point Campground, which is part of the Croatan National Forest. Sites WO-4 to WO-6 receive drainage from the Marsh Harbor neighborhood, which is being actively developed, and a Park operated by the Town of Cedar Point. Site WO-8 is near a boat ramp and at the mouth of Boathouse Creek. The specific sampling locations were chosen to provide water-quality information for the two main tributaries and to assess portions of the watershed that were already mostly developed and portions of the watershed that were actively being converted to residential housing. Permission from property owners had to be obtained for access to the stream sampling sites.

2.3. Physicochemical Characteristics of Waters

Stream depth and width were measured at sites WO-1 to WO-5 using a grade rod, and stream velocity was measured using a Global Water Flow Probe. Discharge was calculated by multiplying the active cross-sectional area by the average velocity. Discharge for WO-7 was estimated as the sum of flow from WO-1 and WO-2, and discharge for WO-6 was estimated as the sum of flow from WO-4 and WO-5. However, if significant evapotranspiration occurred within the channels, then discharge estimates would have been overestimated. Conversely, if there were significant groundwater inputs to the stream channels just before WO-7 and WO-6, then discharge estimates may have been underestimated. Total discharge to the estuary was the sum of discharge from WO-6 and WO-7. Physical and chemical characteristics of water including pH, temperature, and dissolved oxygen were measured at each of the eight monitoring sites using a calibrated YSI 556 Multiprobe System meter.

2.4. Fecal Indicator Bacteria Enumeration and Exports

The FIB enterococci and E. coli were analyzed for collected water samples approximately monthly over the two-year study period (2015–2017). During each sampling event (n = 24), two 100-mL grab samples were collected using sterile bottles from each site: one for E. coli and one for enterococci to ensure enough volume to allow for multiple dilutions. Samples were collected during baseflow (n = 18) and stormflow (n = 6) conditions. The samples were kept on ice in coolers for transport to the East Carolina University (ECU) Environmental Health Sciences Water Lab. Samples were prepared within 6 h of collection. Dilution factors between 2.5 and 10 were often used for samples so the maximum undiluted most probable number (MPN) of 2419 was not exceeded. IDEXX Colilert™ and Enterolert™ with Quanti-tray 2000™ methods were used to enumerate E. coli and enterococci, respectively. The media were added to the appropriately diluted samples and then shaken vigorously to ensure proper mixing and dissolution. After each sample was mixed thoroughly in the bottle, the sample was poured into a Quanti-tray. The Quanti-trays were labeled with time, sample identification number, the dilution factor, and the bacteria being tested (E. coli or enterococci). The trays were heat-sealed and then placed into incubators for 24 h. The trays tested for E. coli were incubated at 37 °C, and the trays tested for enterococci were incubated at 41 °C. In a dark room, a black light was used to determine the number of wells that luminesced for each E. coli and enterococci tray. A chart provided by IDEXX was used to determine the MPN of E. coli and enterococci that corresponded to the number of large and small wells that illuminated the trays. The MPN for the samples was then multiplied by the dilution factor to determine the actual MPN. Concentrations of E. coli and enterococci were compared to US EPA [32] standards for recreational waters to determine the frequency of exceedance and thereby gain a better understanding of the environmental health risks associated with these waters. The EPA [32] suggested statistical threshold values (STV) for E. coli and enterococci are 410 MPN 100 mL−1 and 130 MPN 100 mL−1, respectively. Thus, no more than 10% of samples should exceed those values. Maximum suggested concentration levels for the geometric mean of E. coli and enterococci in recreational waters are also listed by the EPA [32], but their sampling frequency was more intense than what was conducted in this study. However, geometric mean values of E. coli and enterococci were reported for general comparisons.
Watershed exports of FIB to the estuary were calculated. The discharge in liters per second was multiplied by the concentrations of E. coli and enterococci (MPN L−1) to determine the MPN per second of FIB exported from the watershed. These analyses were conducted to provide insight into stream segments that were contributing the most FIB to estuarine waters.

2.5. Determination of FIB Source

Qualitative Taqman™ polymerase chain reaction (PCR) was used as a genotypic source-tracking tool to determine if human waste was a contributing source of bacteria. This method utilized fluorescent dye to amplify the DNA. The analyses were performed using the Qiagen™ (Hilden, Germany) and UNEX protocols to extract DNA from the samples. Testing of the samples was performed using Lightcycler® 480 II instrument (Roche, Mannheim, Germany) and Superscript III One-Step qRT-PCR kit (Invitrogen, Carlsbad, CA, USA). The instrument utilized the following program: 50 °C for 2 min at a ramp rate of 4.4 °C, 95 °C for 10 min at a ramp rate of 4.4 °C, 45 cycles at 95 °C for 15 s at a ramp rate of 4.4 °C., 60 °C for 1 min at a ramp rate of 2.2 °C. Primers and Probes for bacterial general indicator Bacteriodales detection were: BacGen Rev 5′-CAC GCT ACT TGG CTG GTT CAG-3′, BacGen Fwd 5′- CTG AGA GGA AGG TCC CCC AC-3′, BacGenLNA probe 5′-/56-FAM/AG+C A+GT +G+A+G +GAA TAT T/3IABkFQ/-3′. Primers and probes for bacterial human indicator detection were: BacHum Rev 5′-CGC TAC ACC ACG AAT TCC G-3′, BacHum Fwd 5′-CGC GGT AAT ACG GAG GAT CC-3′, BacHum LNA Probe 5′-/56-FAM/AAG TTT +GC+G G+C+T +CAA C/3IABkFQ/-3′ (IDTDNA, Coralville, IA, USA). Similar methods have been used in prior research [22] to help identify sources of FIB.
The samples (n = 34) were first compared against general indicator Bacteriodales. If the general indicator Bacteriodales was detected, then the sample was run against the human-specific Bacteroides fragilis (ATCC Manassas, VA, USA). A positive human control was used, which was a waste sample from a septic tank, and a negative human control was used, which was a dog waste sample.

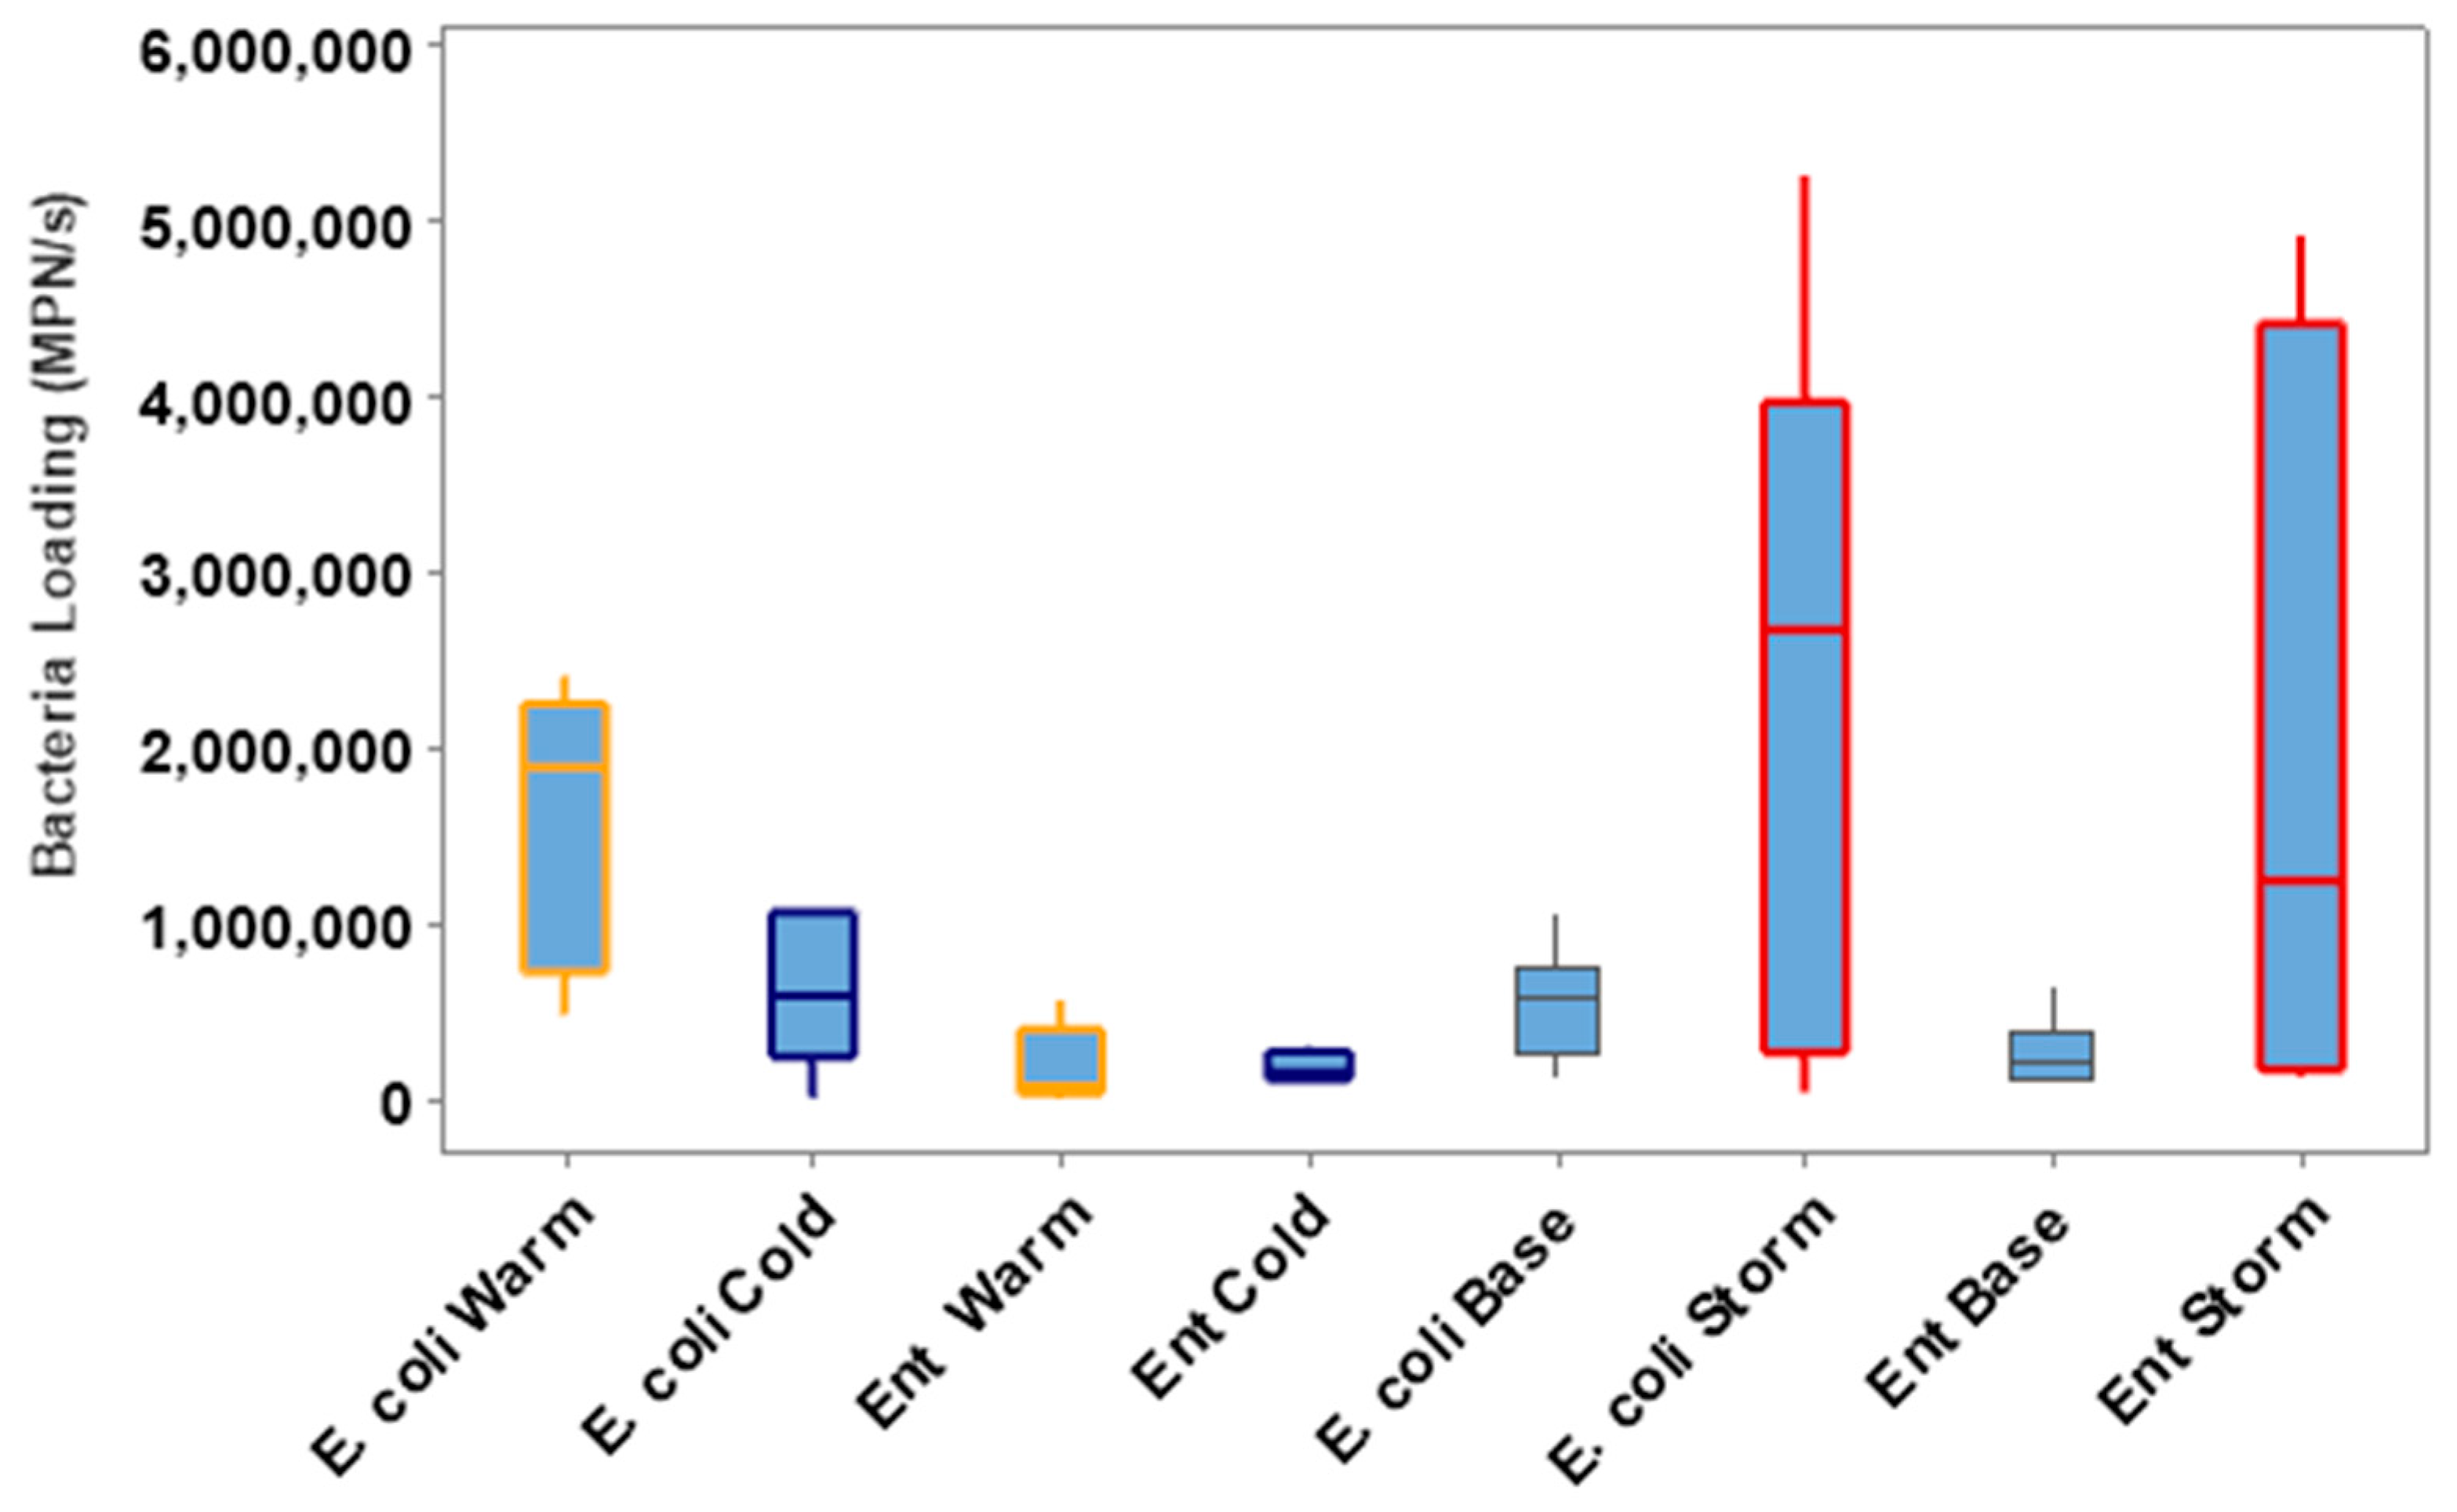
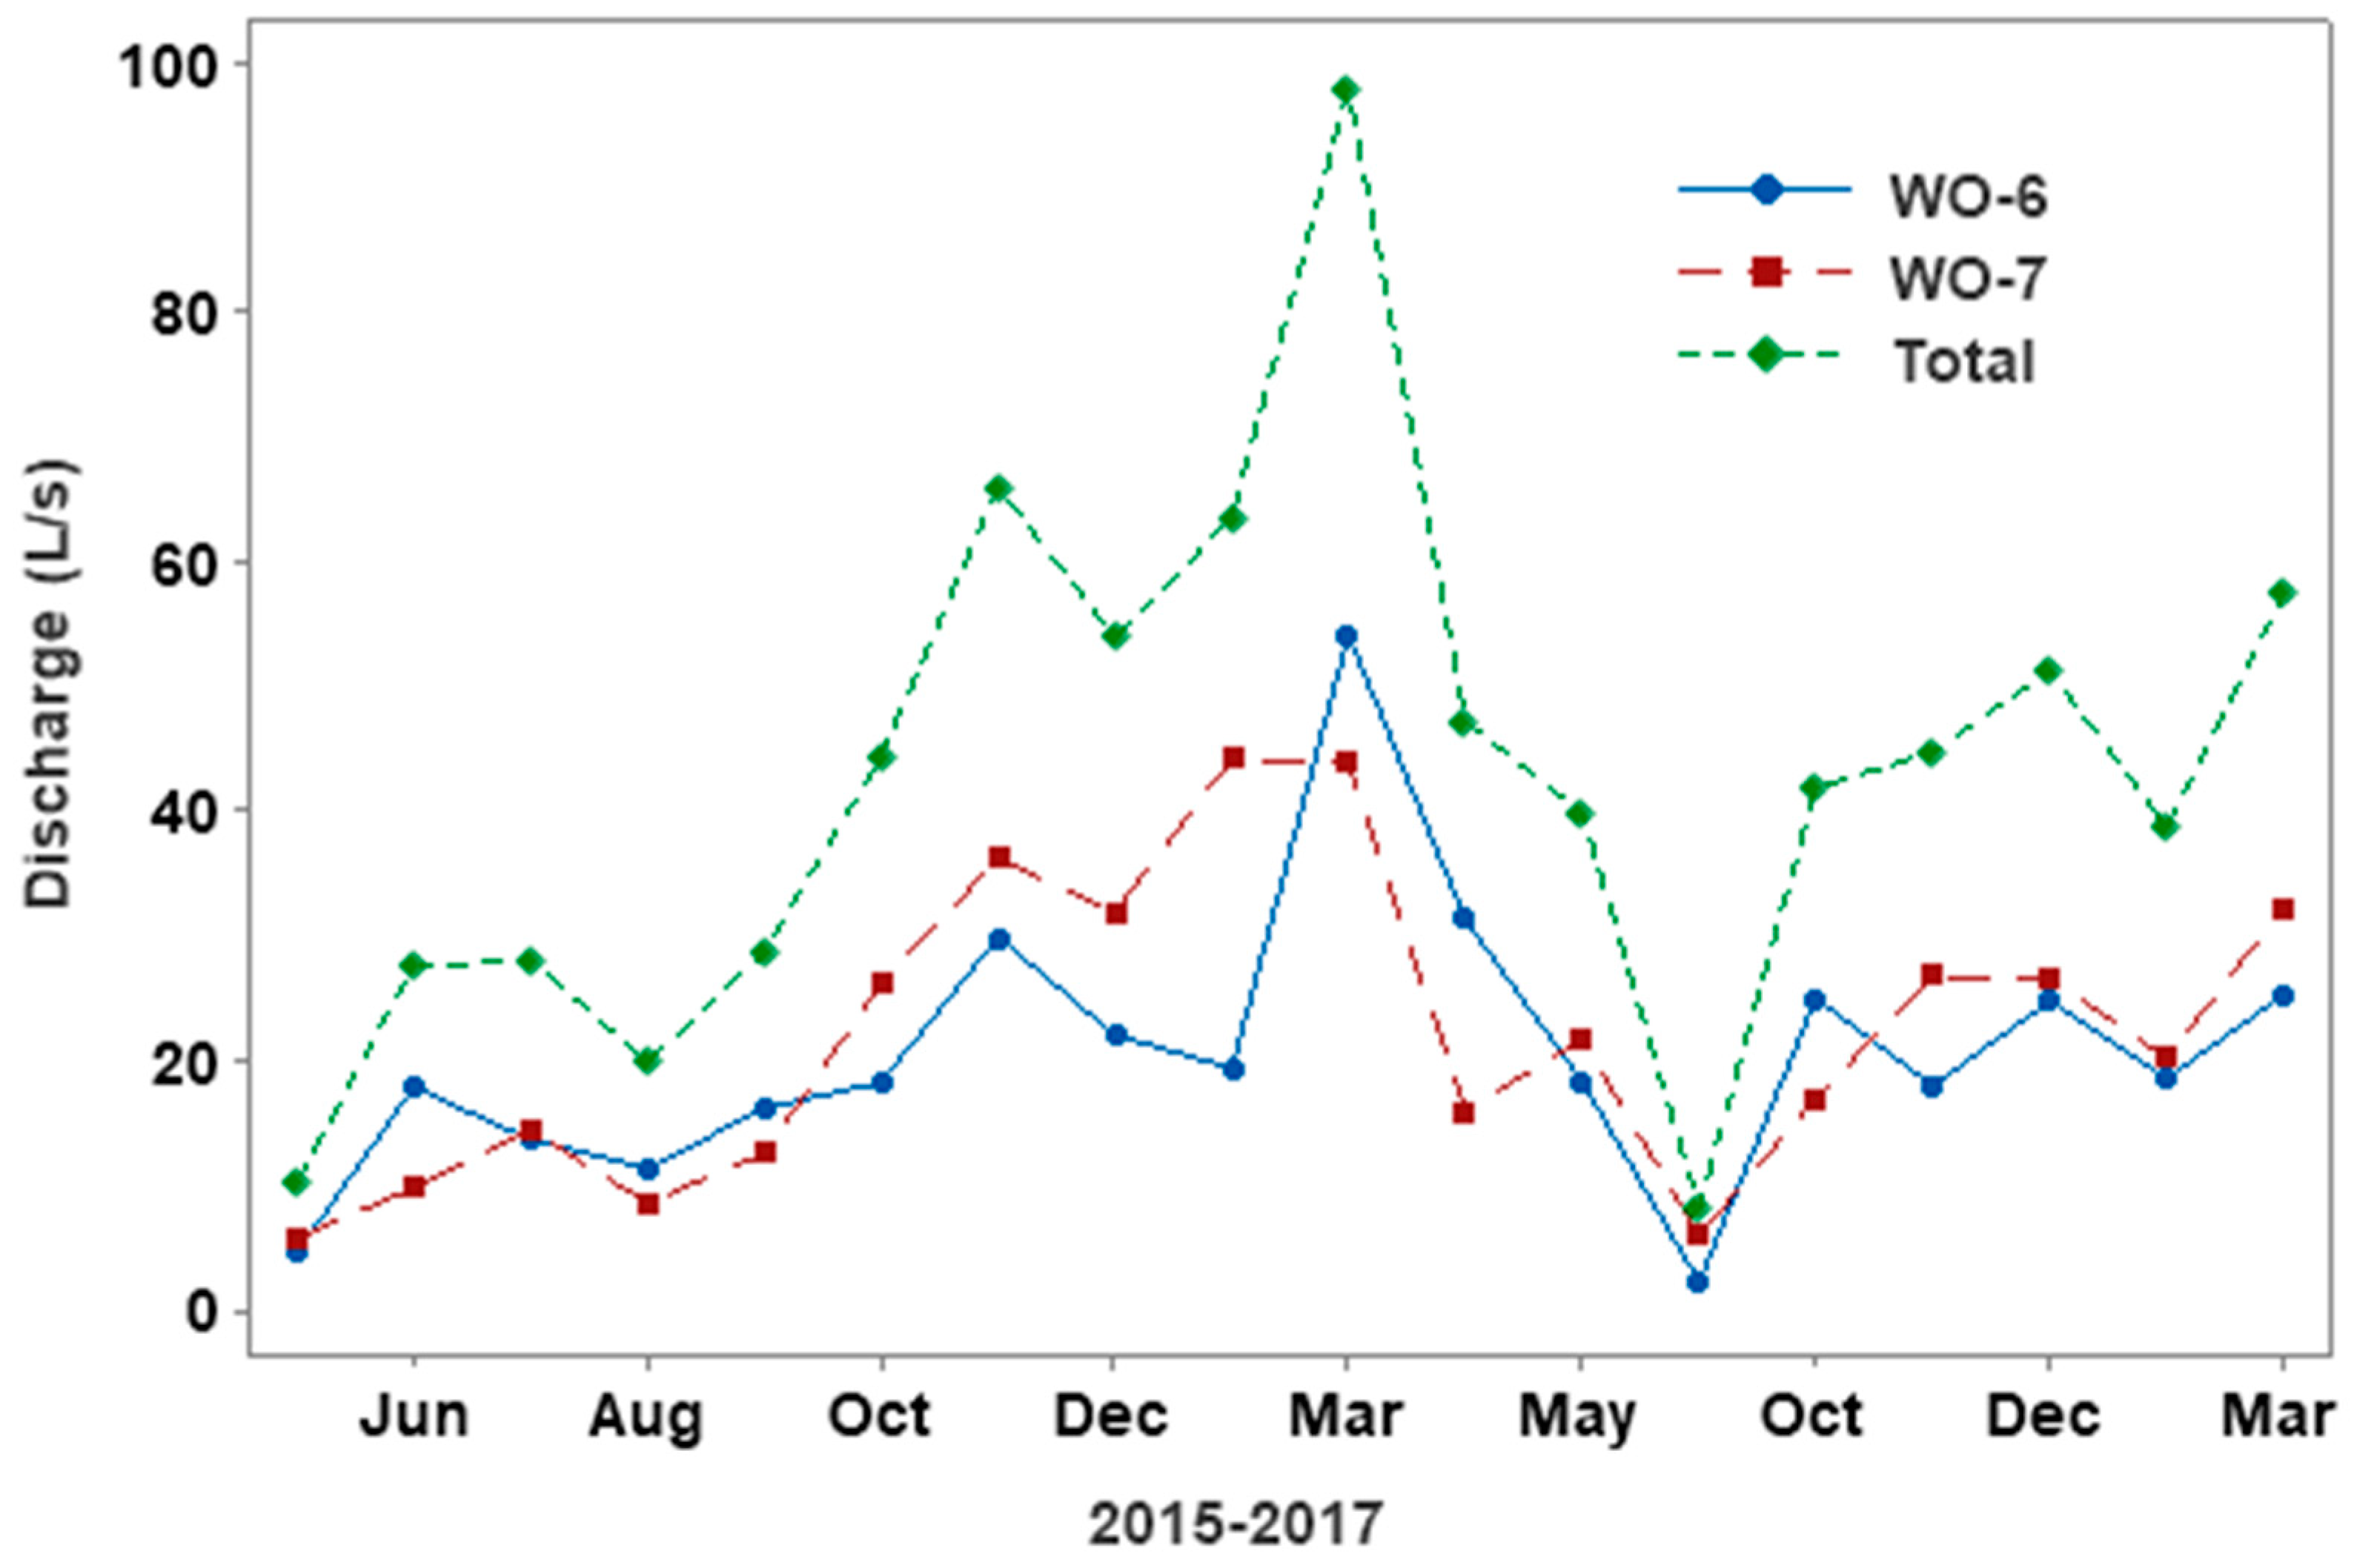
2.6. Stormflow and Baseflow FIB Concentrations and Exports

Concentrations and exports of FIB during baseflow and stormflow conditions were compared to determine if differences were statistically significant. Most of the data generated during the study did not follow a normal distribution, so non-parametric Mann-Whitney tests were used to determine if the differences (baseflow and stormflow) were statistically significant (p < 0.05). These comparisons were made to determine if stormwater runoff or baseflow discharge from septic systems was a major contributor of FIB to surface waters.

2.7. FIB Concentrations during Warm and Cold Months

Data from each location for the warm months and cool months were displayed and summarized using line plots, box plots, and/or tables. Warm months were identified as June (mean 26.3 °C) July (mean 27.2 °C), August (mean 26.4 °C), and September (mean 24.1 °C) with a mean temperature of 26 °C. The cold months were identified as December (mean 9.4 °C), January (mean 7.6 °C), February (mean 8.7 °C), and March (13 °C) with a mean temperature of 9.7 °C. Spearman’s correlations were used to determine if statistically significant relationships were observed between FIB concentrations and temperature. Mann–Whitney tests (non-parametric) were used to determine if statistically significant differences in concentrations, and exports of FIB were observed between warm relative to cold months. p-values of less than or equal to 0.05 were considered statistically significant. The statistical software program Minitab was used for the analyses.

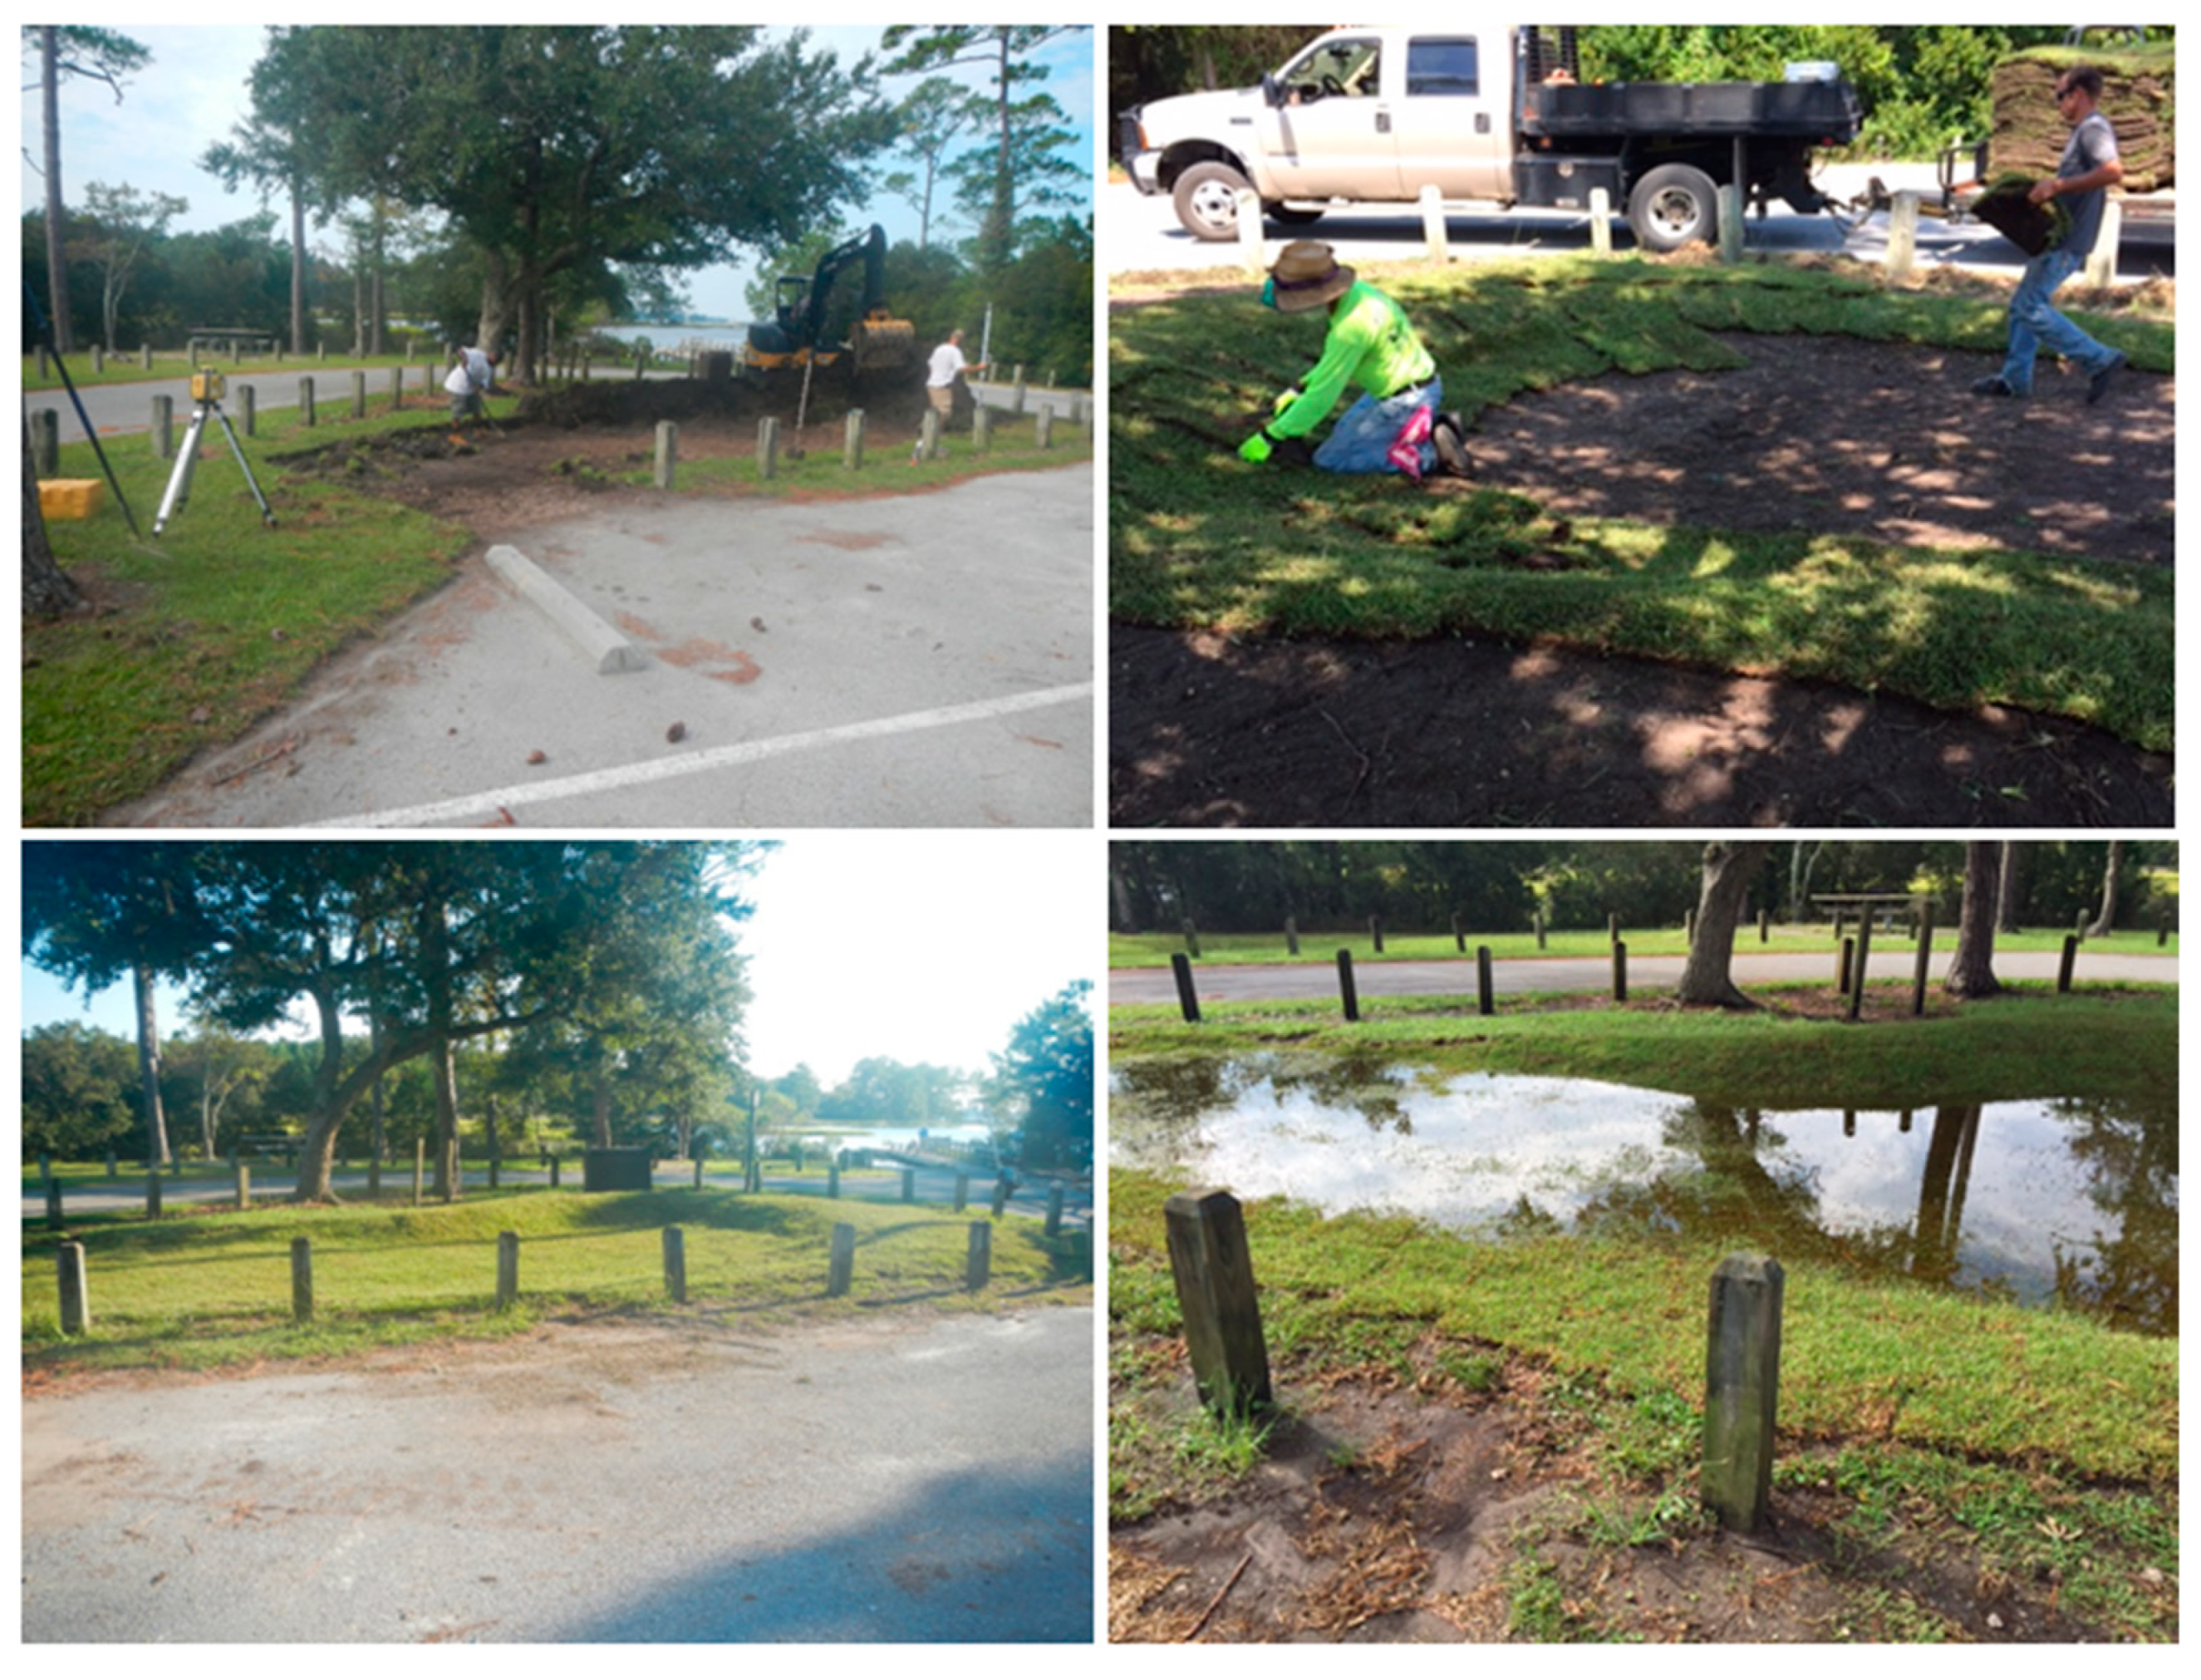
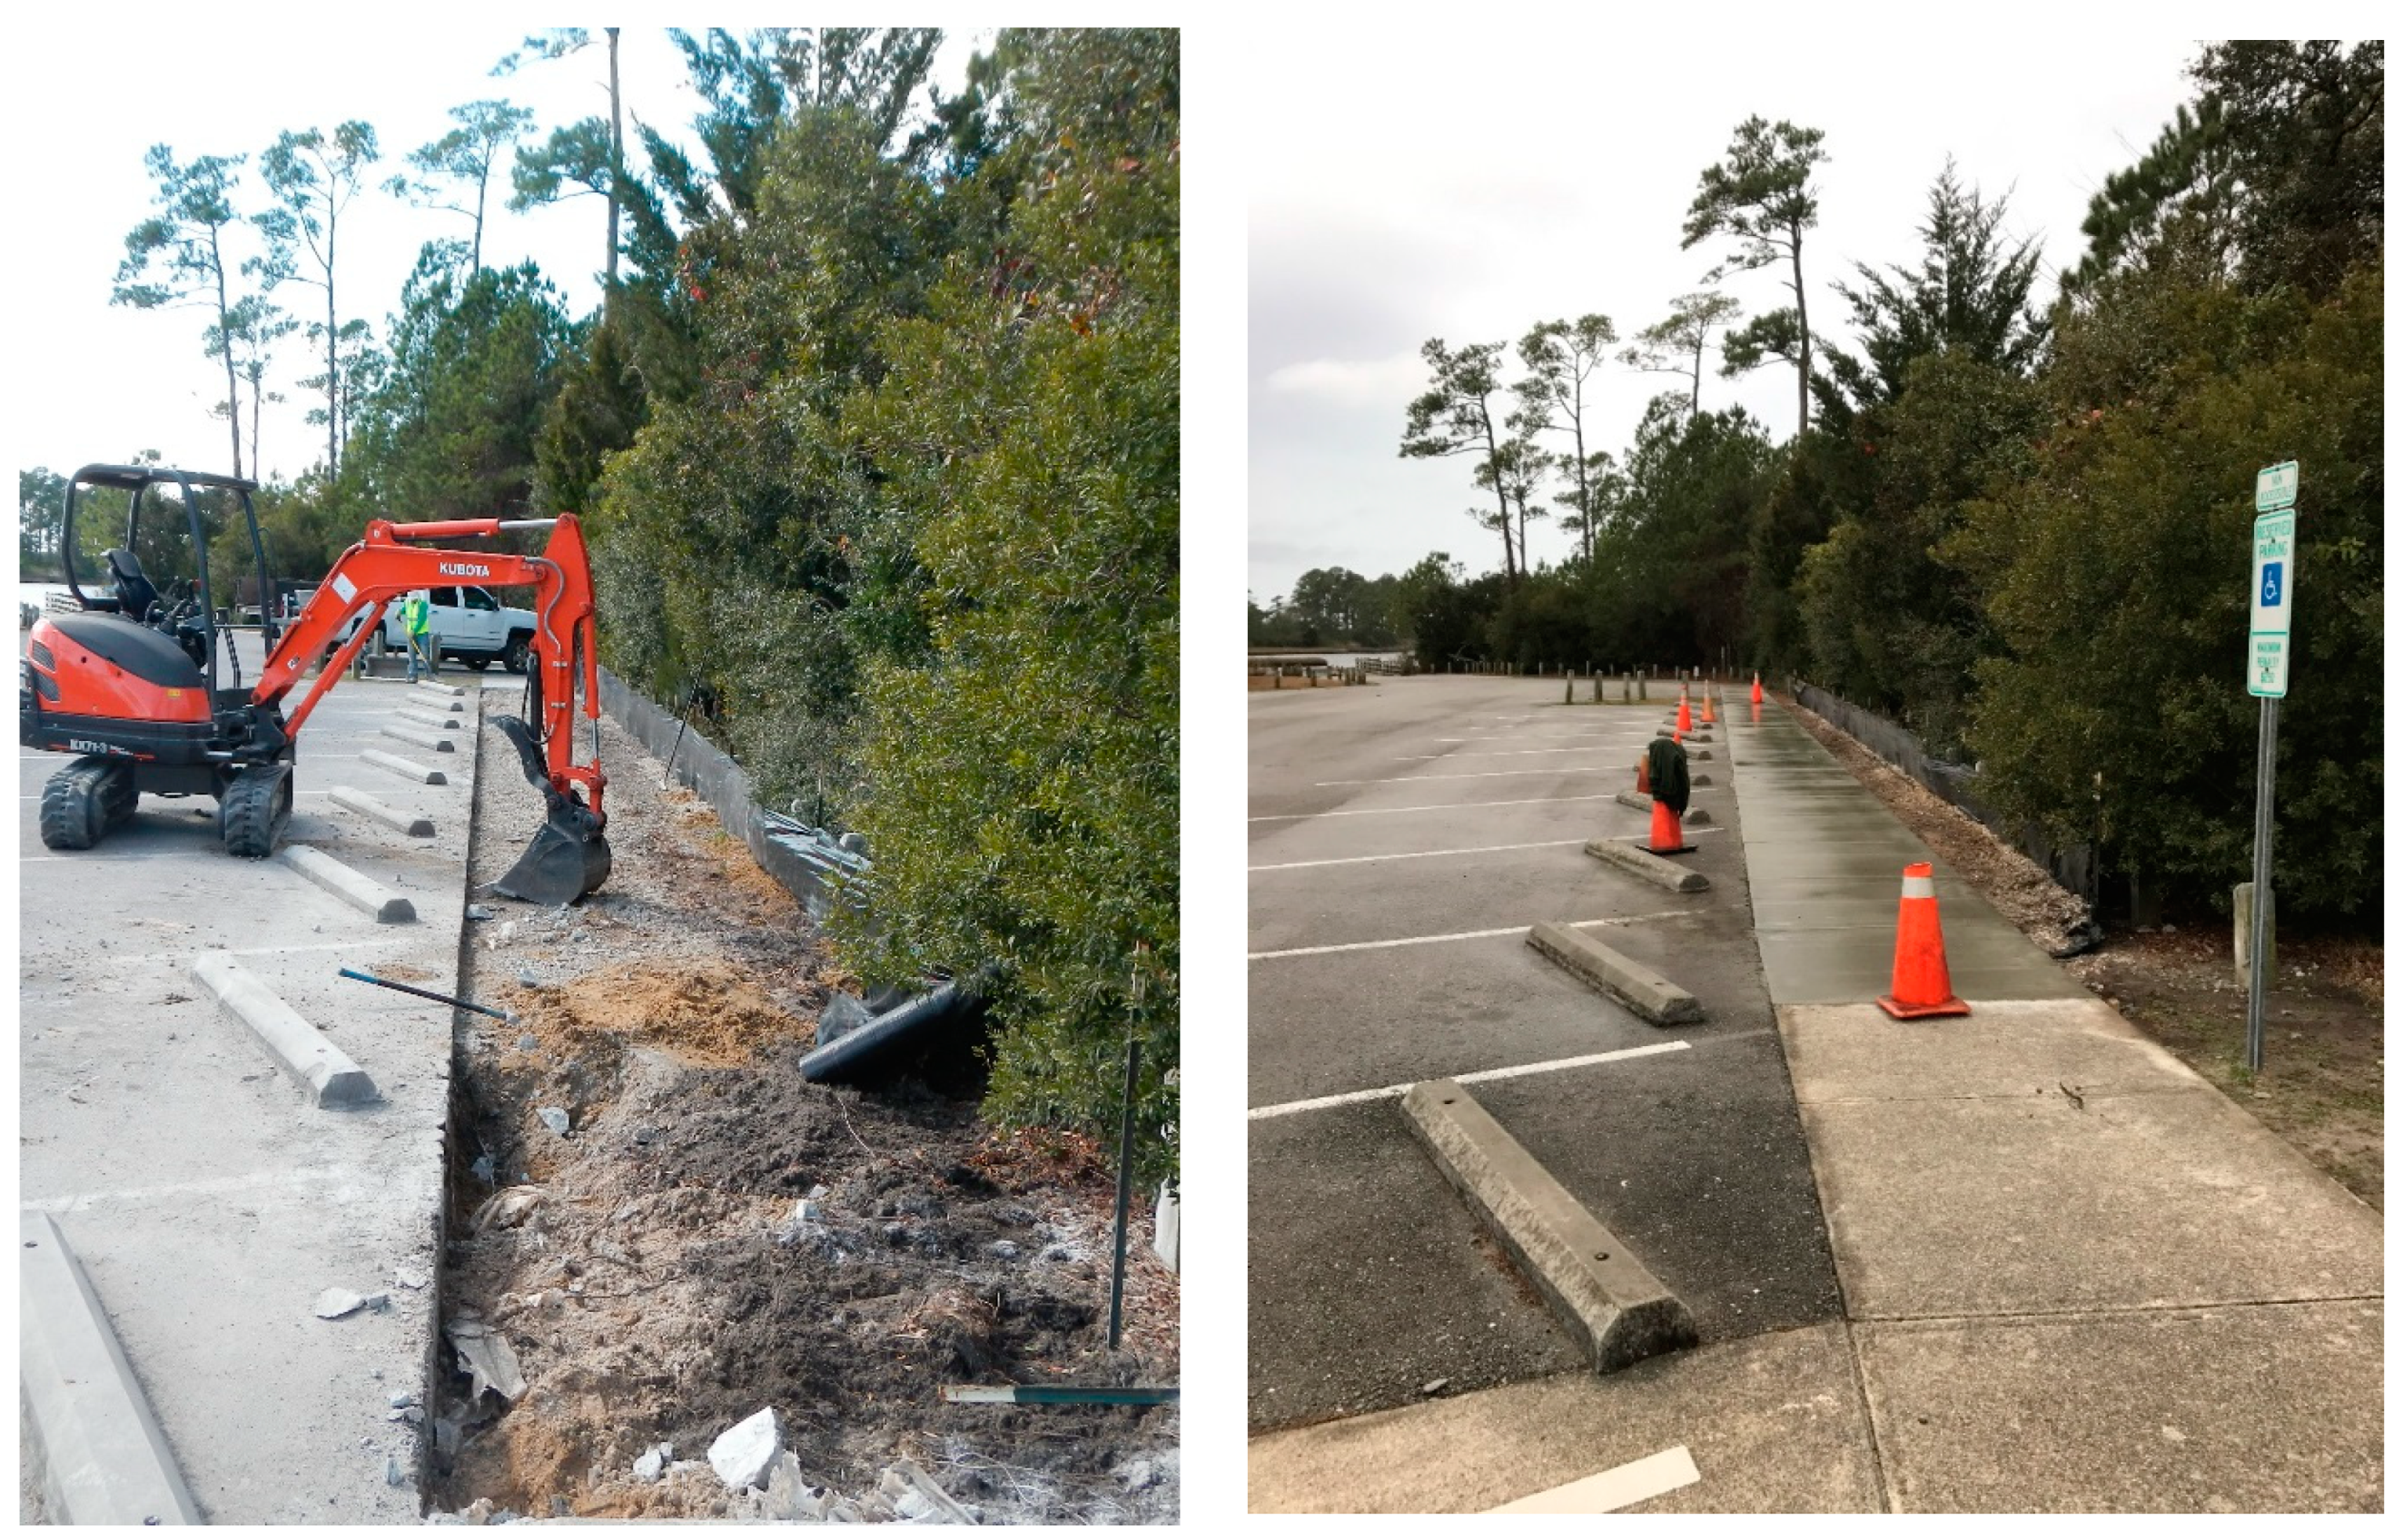
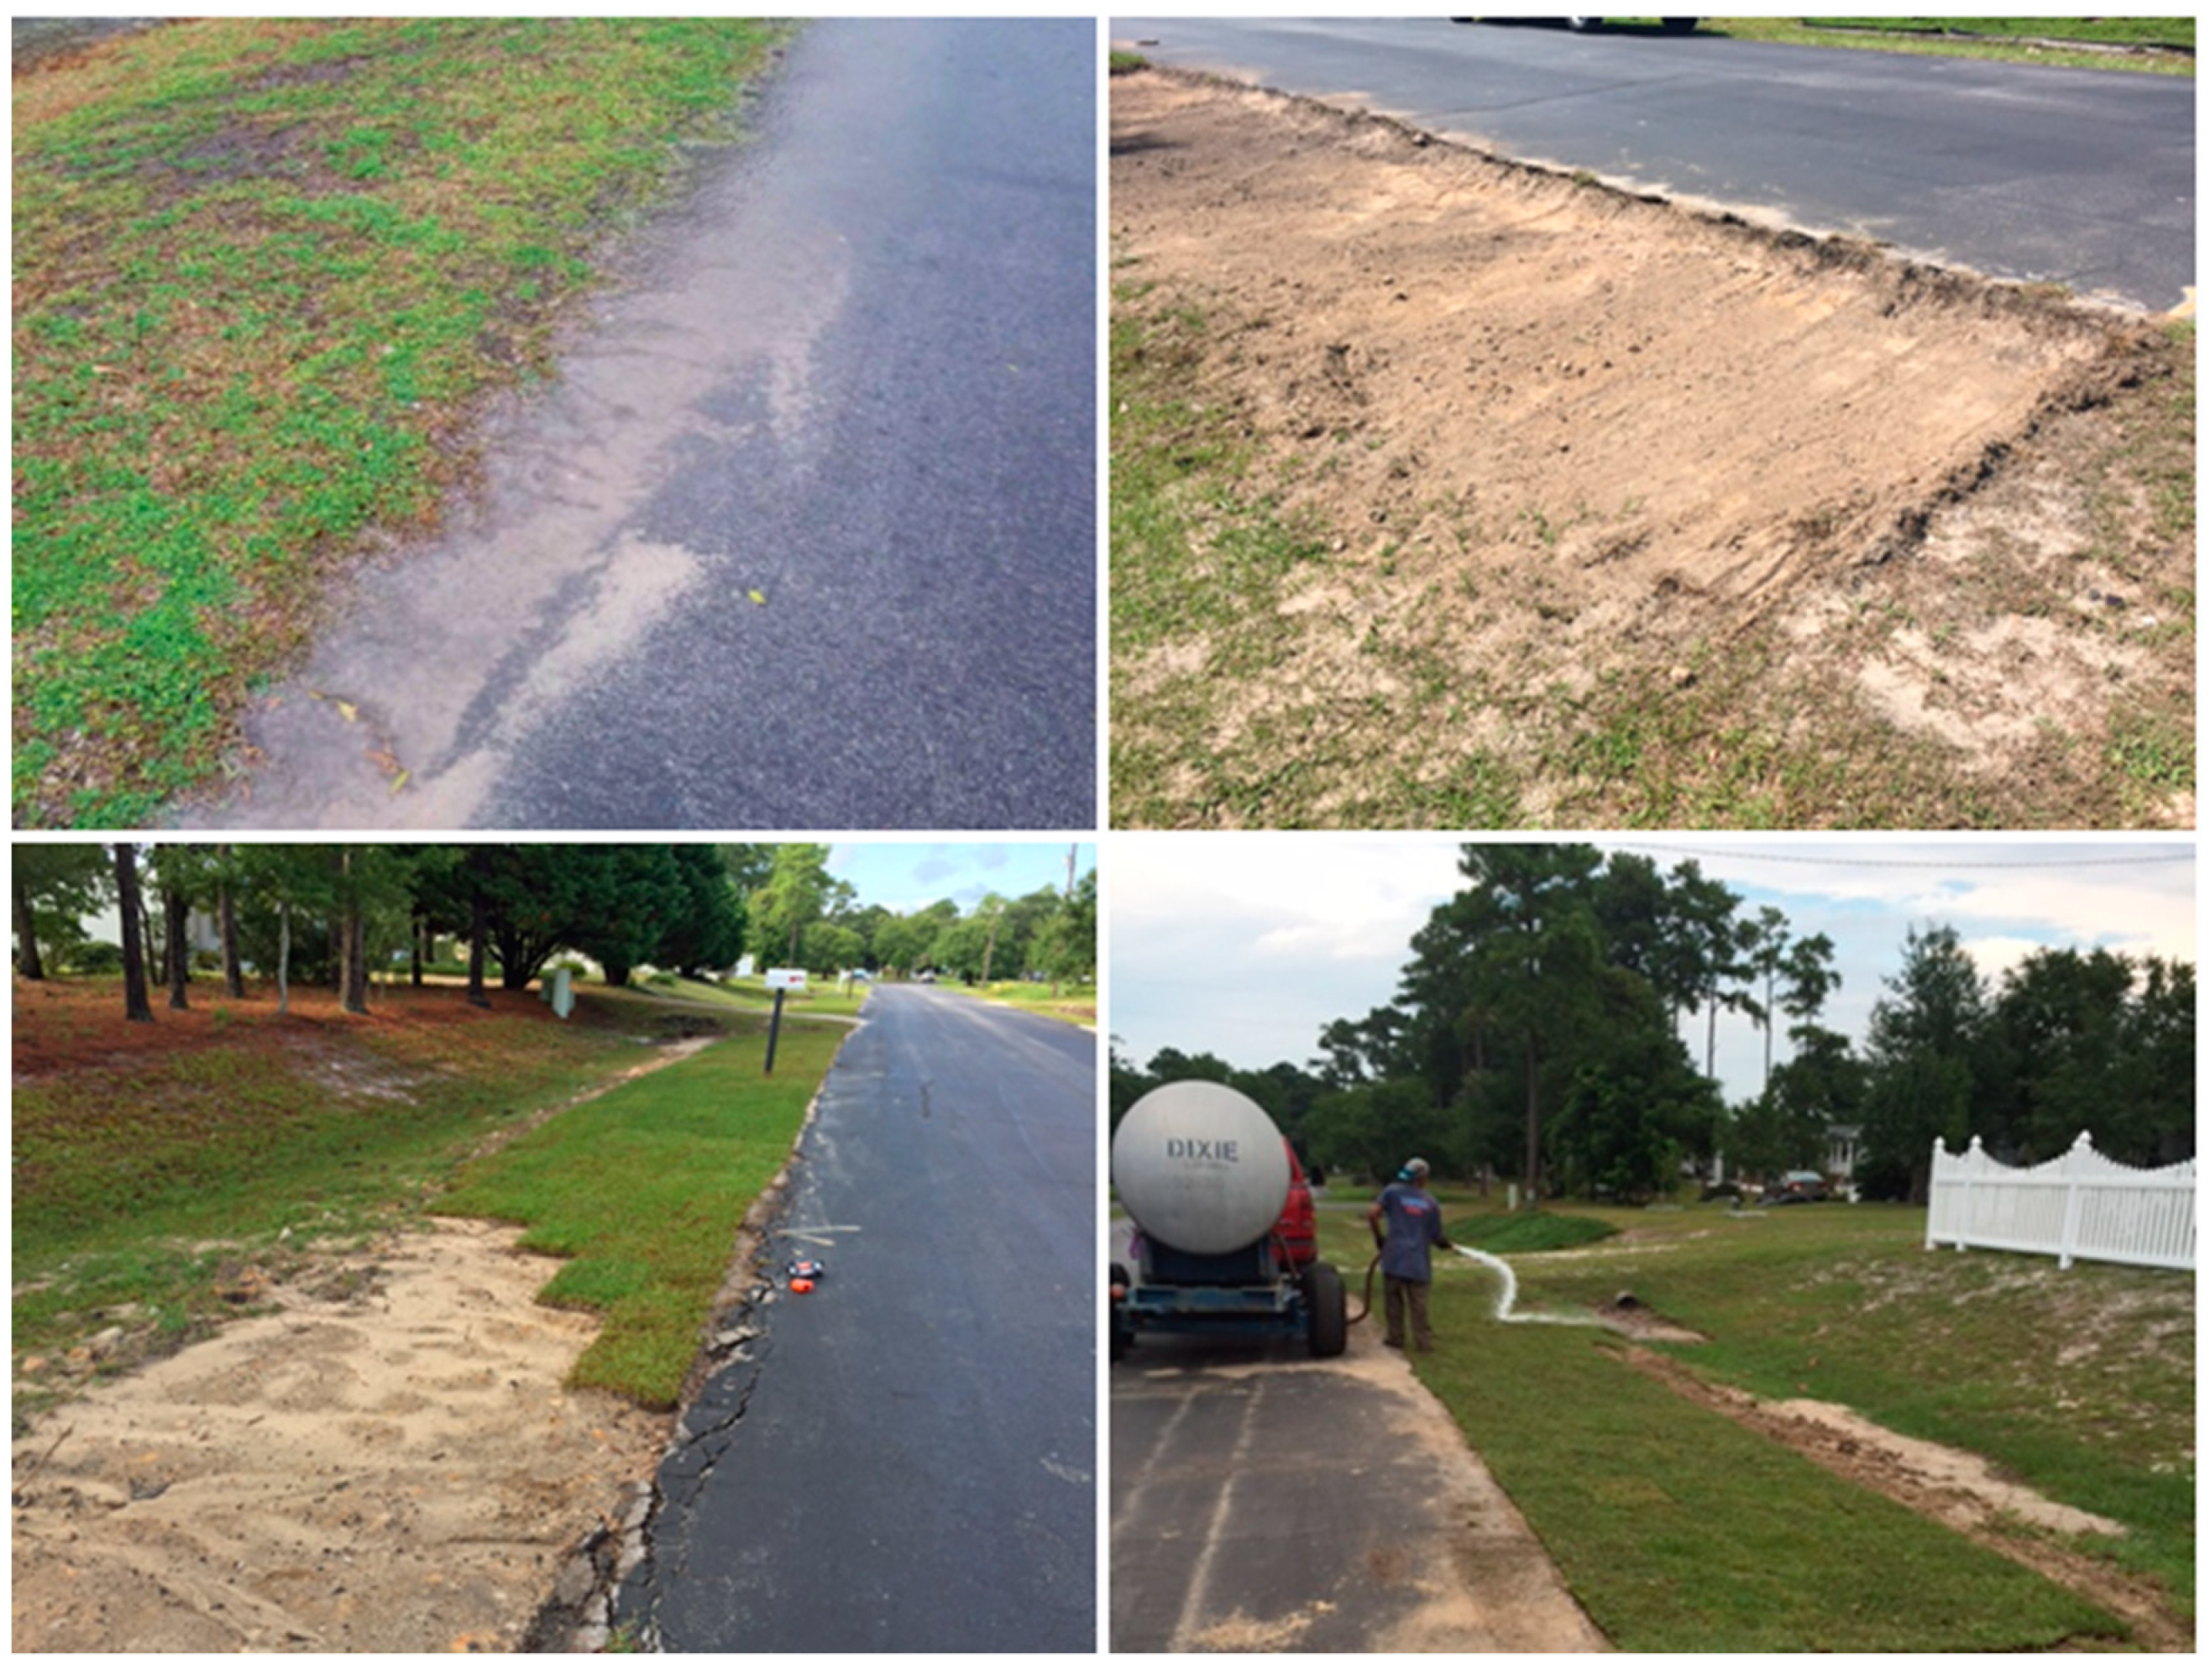
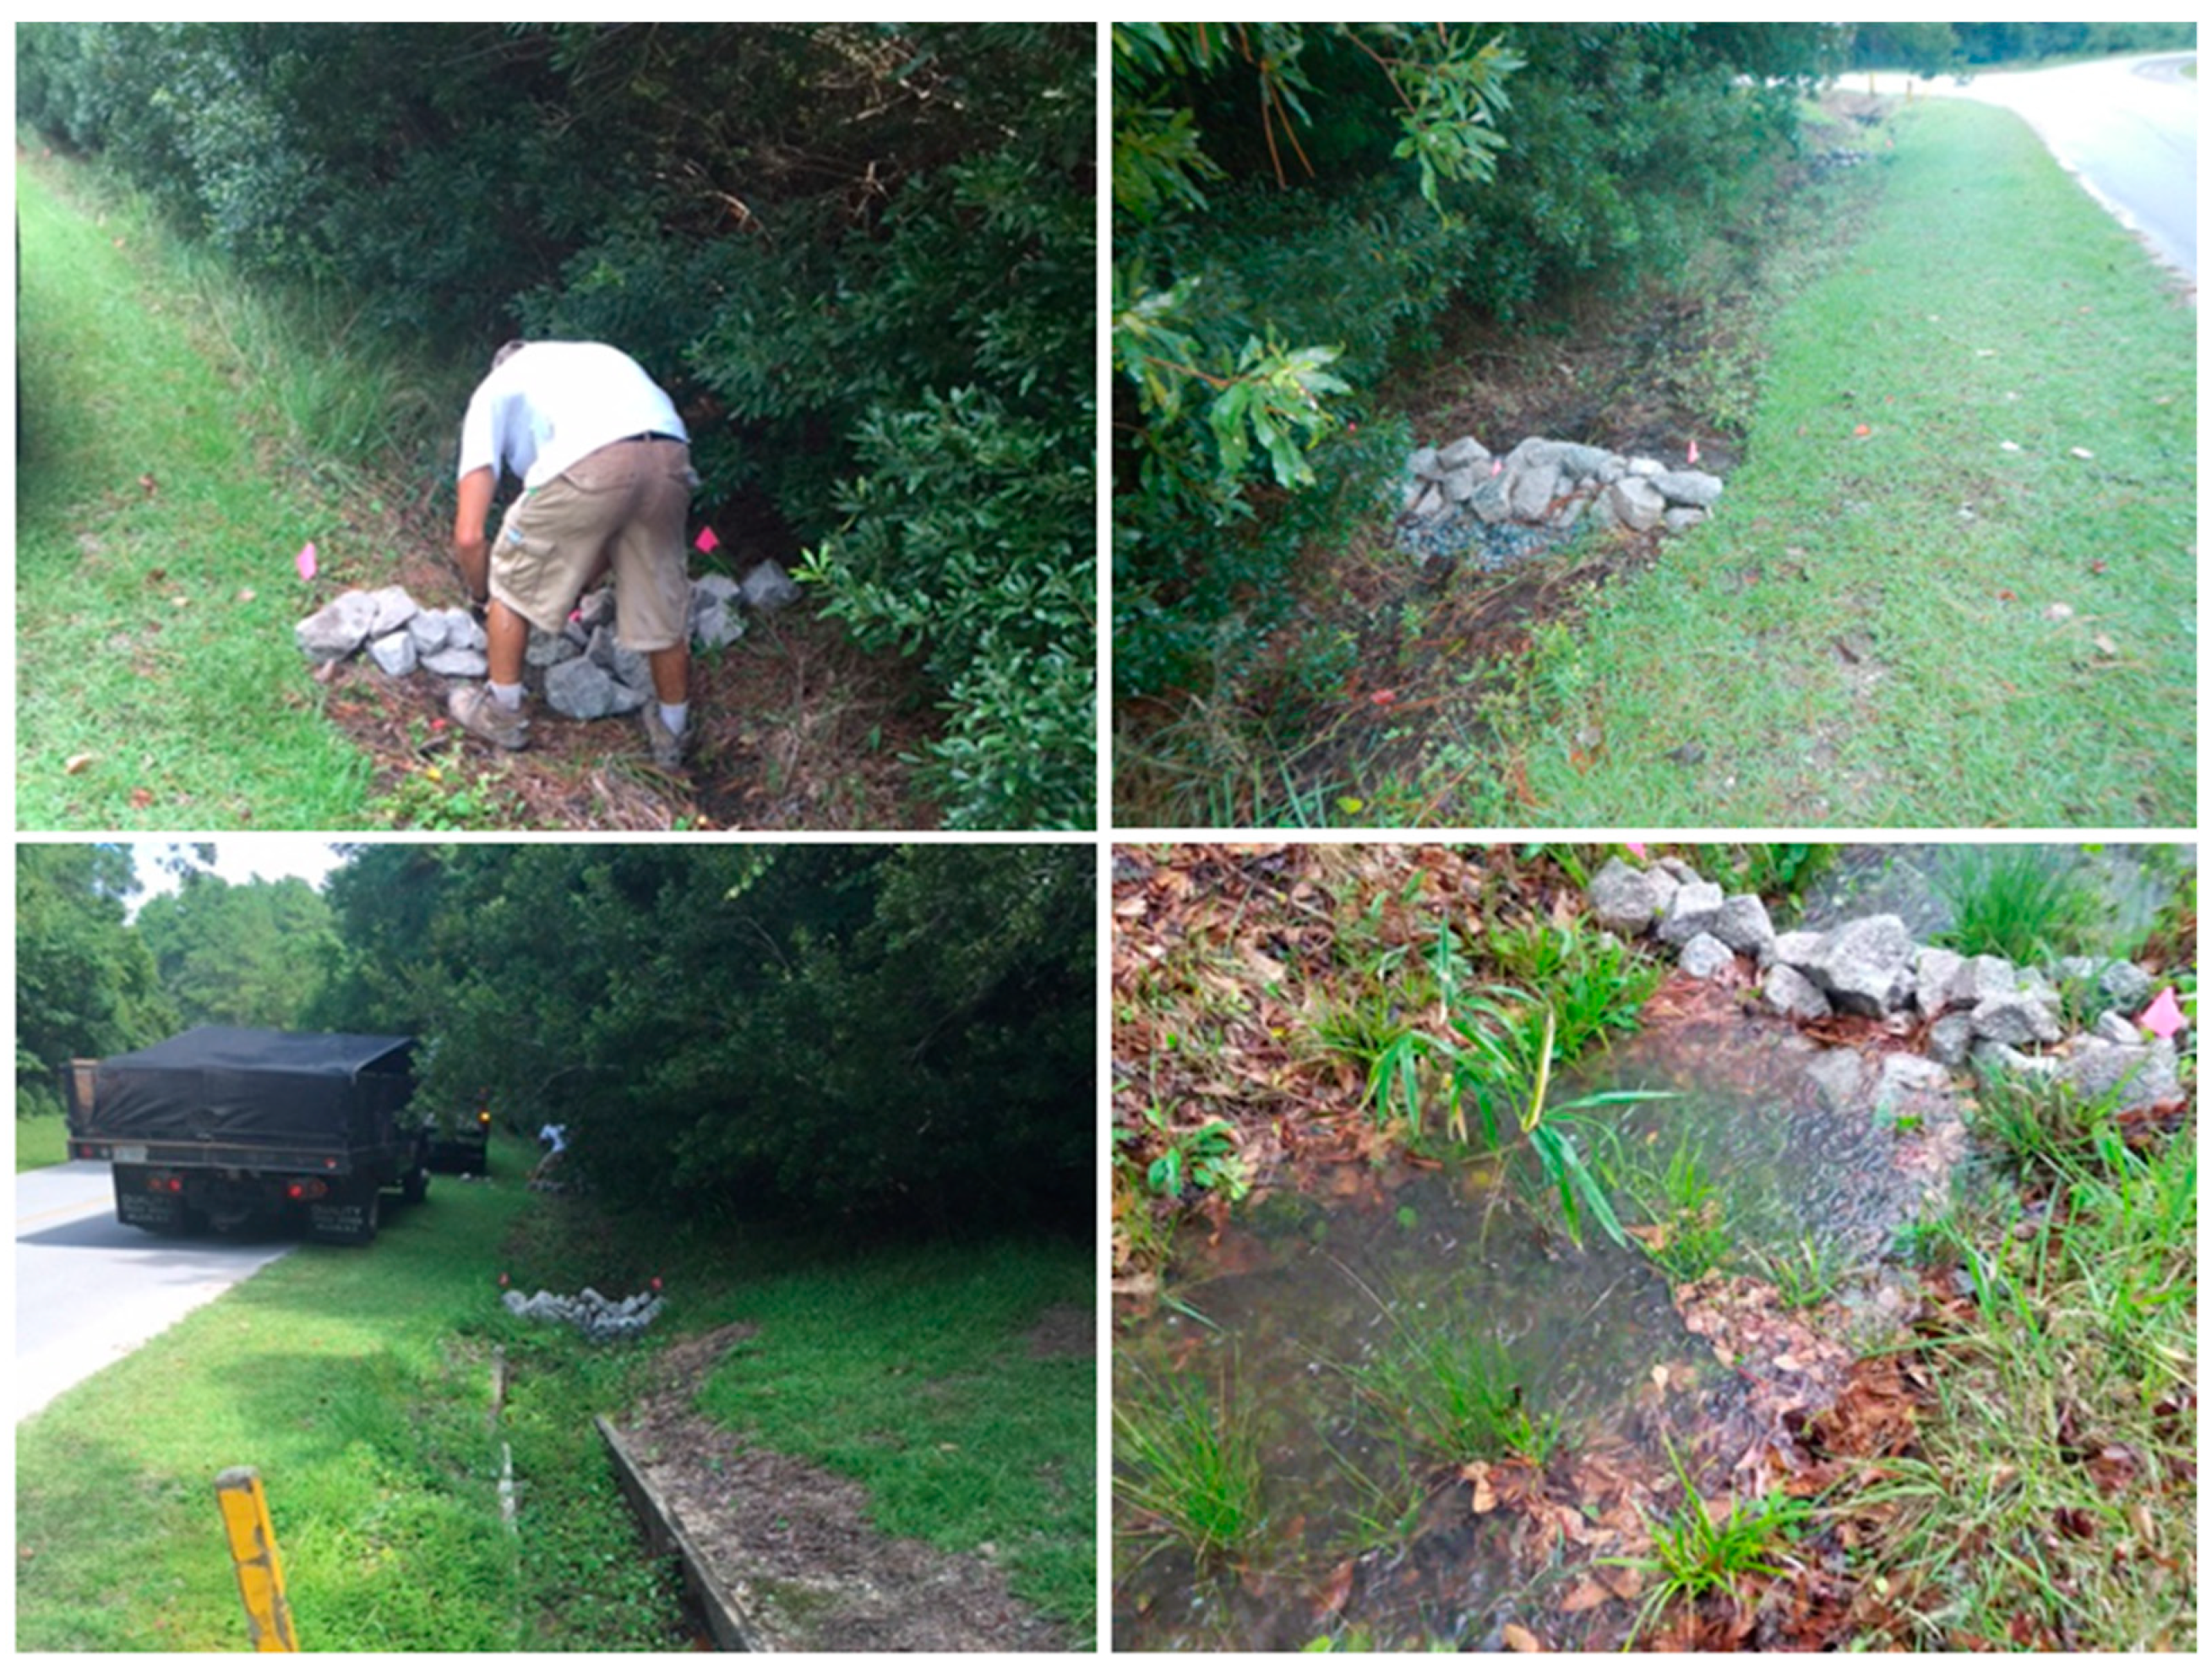
2.8. Stormwater Control Measure Implementation

Researchers and project partners with the NC Coastal Federation met with representatives from the Town of Cedar Point, US Forest Service, Ocean Spray Homeowners Association, and Marsh Harbor to discuss the water-quality monitoring and water-quality improvement initiatives associated with the project. During the meeting, the local representatives expressed concerns about drainage and ideas about better managing runoff on their properties and in their neighborhoods. Lawn maintenance contractors and several local representatives stated that rainwater from the road in higher portions of the neighborhoods would not enter the adjacent grass swales/ditches due to excessive grass growth along the shoulder of the roads. The excessive growth caused water to pool and flow along the road edge to lower areas of the neighborhoods where it then discharged into the swales/ditches and contributed to flash flooding of those lower areas. Representatives from the Forest Service mentioned some drainage issues in the campground and opportunities for possibly remediating runoff from the boat ramp and parking area near the estuary. Site visits were later made to these sites during intense rain events to observe drainage patterns and note locations where landscape modifications could potentially be made to better manage runoff. Follow-up trips to the identified properties were made to assess in more detail the soil and site characteristics (texture, groundwater depth) to match stormwater control measures to the conditions and seek permission from the property owners to install the practices. Several control measures and landscape modifications were implemented throughout the watershed. The control measures included a rain garden and walkway reconstruction at the boat ramp, drainageway check dams (n = 4) along the main road to the boat ramp, water control structures (n = 5), roadside ditch modifications (n = 13) within the Ocean Spray community, and a culvert replacement at the US Forest Service Campground. Reductions in annual cumulative runoff were calculated based on runoff estimates using watershed characteristics, mean annual rainfall, and the Simple method [33] with volume reductions associated with storage capacity of the implemented control measures and/or reported reductions from other studies using similar practices [34,35,36,37].
A rain garden was installed in an open space at the boat ramp to increase infiltration and reduce runoff from the parking area (Figure 2). The storage capacity of the rain garden was developed using an excavator to dig approximately 0.2 m depth of soil, and the soil was moved to the downslope side of the garden to create a berm. The excavated area and back berm were lined with sod. The berm was used to create storage rather than making a deeper excavation because the seasonal-high groundwater was about 0.8 m below the surface. Prior research [38] has shown that sandy soils 0.6 m thick are effective filters for E. coli, so the goal was to maintain that depth (0.6 m) of unsaturated thickness below the rain garden bottom. The rain garden was designed to handle runoff from a rain event totaling 9.1 cm (1 year, 24-h storm) over the approximately 748 m2 contributing area. Shortly after an intense rain, a photograph was taken of the rain garden to illustrate the storage capacity of the practice (Figure 2). Therefore, runoff reductions from the contributing area would be 100% for rain events totaling less than 9 cm.
A concrete walkway on the west side of the parking area at the boat ramp had settled, causing water to pond and then flow overland to the estuary. The walkway was demolished and then repaved to ensure runoff from the 473 m2 drainage area, which would be directed to the forested area to enable infiltration in the sandy soil and thus reduce the transport of FIB (Figure 3). It was expected that 100% of runoff entering the forest would infiltrate given the large surface area of the woodlands and the sandy, conductivity soils.
Along many segments of the road system in the Ocean Spray community, grass along the shoulder of the road had grown higher than the road edge, thus preventing runoff from the road from flowing into the grass swales. The water would pond along the edge of the road or flow along the road edge until reaching a lower portion of the community, which would contribute to inundation, flooding, and pollutant transport to the creeks and estuary. A contractor was hired to excavate the overgrown grass along 13 different reaches of roads in the community and to remove enough soil to lower the elevation below the shoulder of the road. Sod was planted along the road swales to stabilize the soil and enable runoff to enter the swale close to where the runoff was generated and infiltrate the sandy soil (Figure 4). Modifications were made along 145 m of roadside with overgrown grass to help better disperse the road runoff in the community where the soil was deep and sandy.
Water control structures (n = 5) were fabricated and inserted into driveway culverts in strategic locations in the Ocean Spray community to help slow runoff and increase the infiltration of water in the grassed swales (Figure 5). The structures included a frame on the front where “flash boards” could be installed to raise the outlet elevation. This effectively causes the water in the swale to increase above the top of the board before outflow can occur. Water control structures such as these have been used extensively in agricultural settings and outflow reductions of 30% have been reported [34] in fields that were previously poorly drained or somewhat poorly drained. The water control structures installed in Ocean Spray influenced the drainage from about 21,000 m2, of which 23% was impervious surface.
Rock check dams (n = 4) were installed in a grassed swale along the road to the Cedar Point Campground to slow runoff and increase infiltration (Figure 6). The check dams function like the water control structures except they do not have removable flash boards. Prior studies in other parts of North Carolina where the soils have higher clay content have shown that check dams incorporated into swales can reduce runoff volumes by 17% [35] to 23% [36]. Other studies have shown that when subsoils are more hydraulically conductive (sandy) like the Wando and Kureb soils in the Boat House Creek Watershed, runoff reductions of up to 66% may be observed [37]. The four check dams influenced drainage from about 510 m2 of area with 69% impervious coverage. It was estimated that runoff reductions for the check dams and water control structures were 66% due to their placement in grassed swales with well-drained, sandy soils.
A new culvert was installed at the Cedar Point Campground to better disperse runoff to open spaces and increase infiltration (Figure 7). The old culvert was crushed and clogged and thus prevented drainage from flowing through the pipe and into an open area. Instead, the runoff was directed to another location, which caused flooding issues due to hydraulic overload in that area. After the new culvert was installed, runoff was more evenly dispersed.

3. Results and Discussion

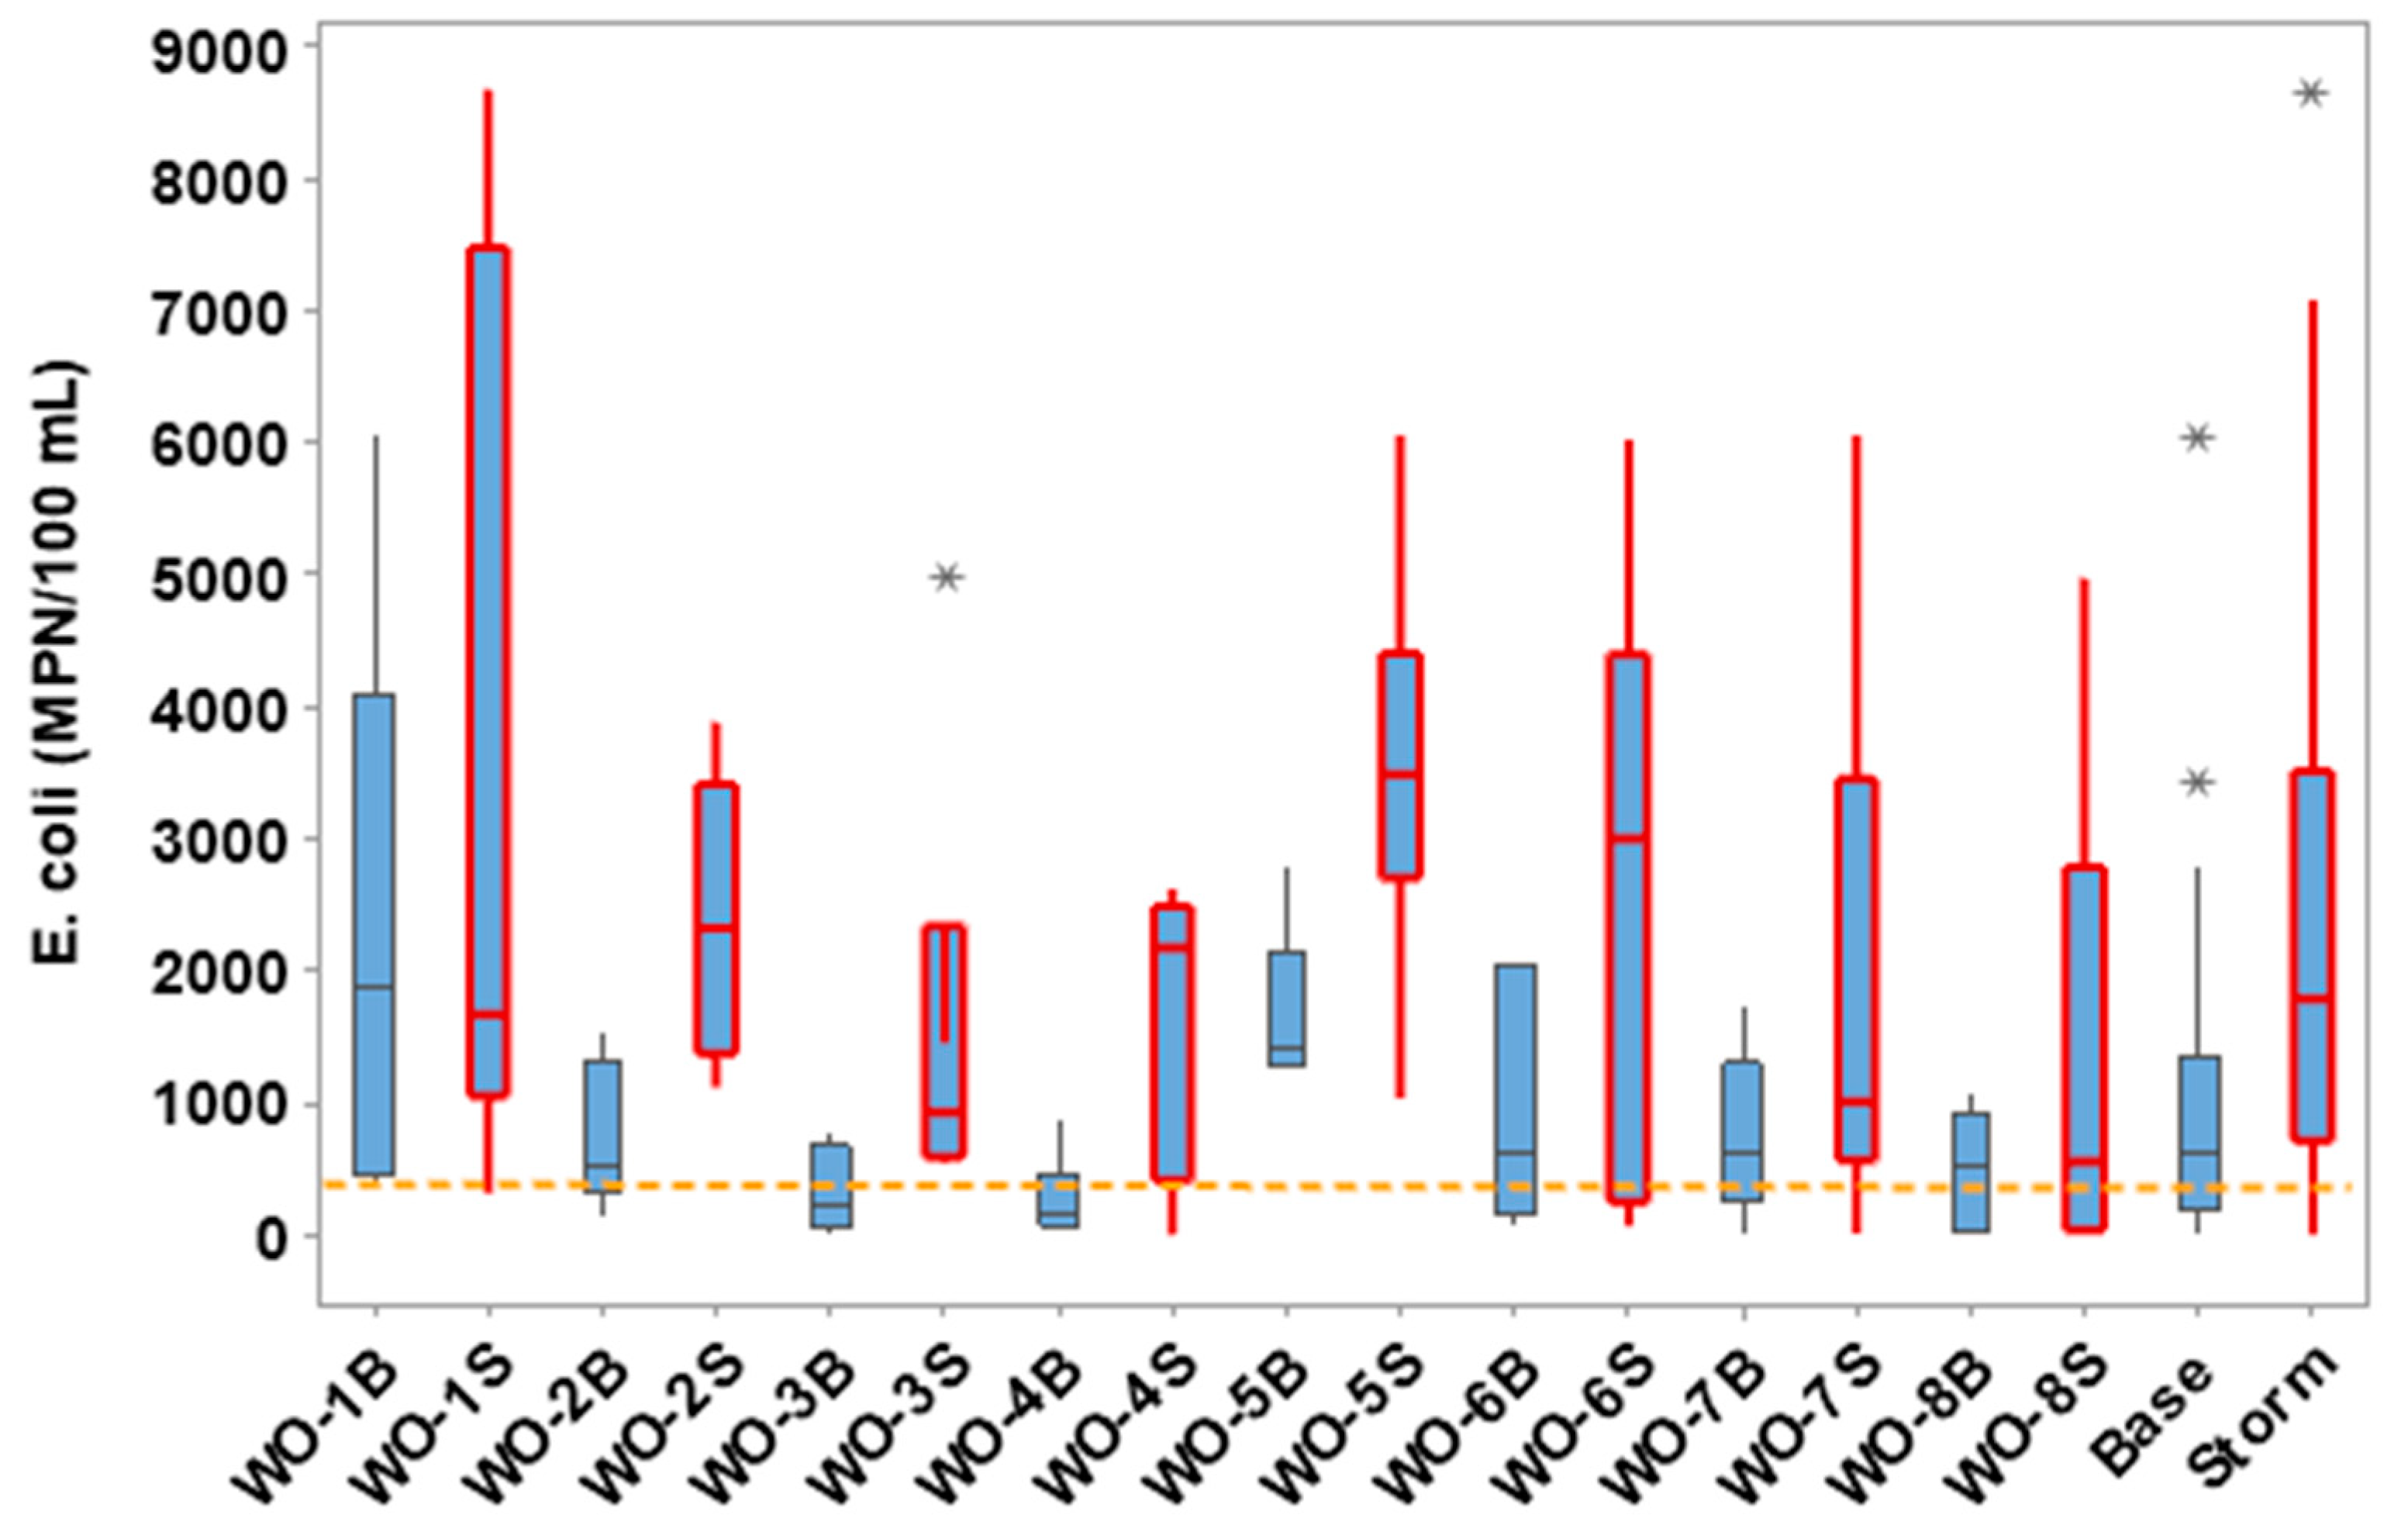
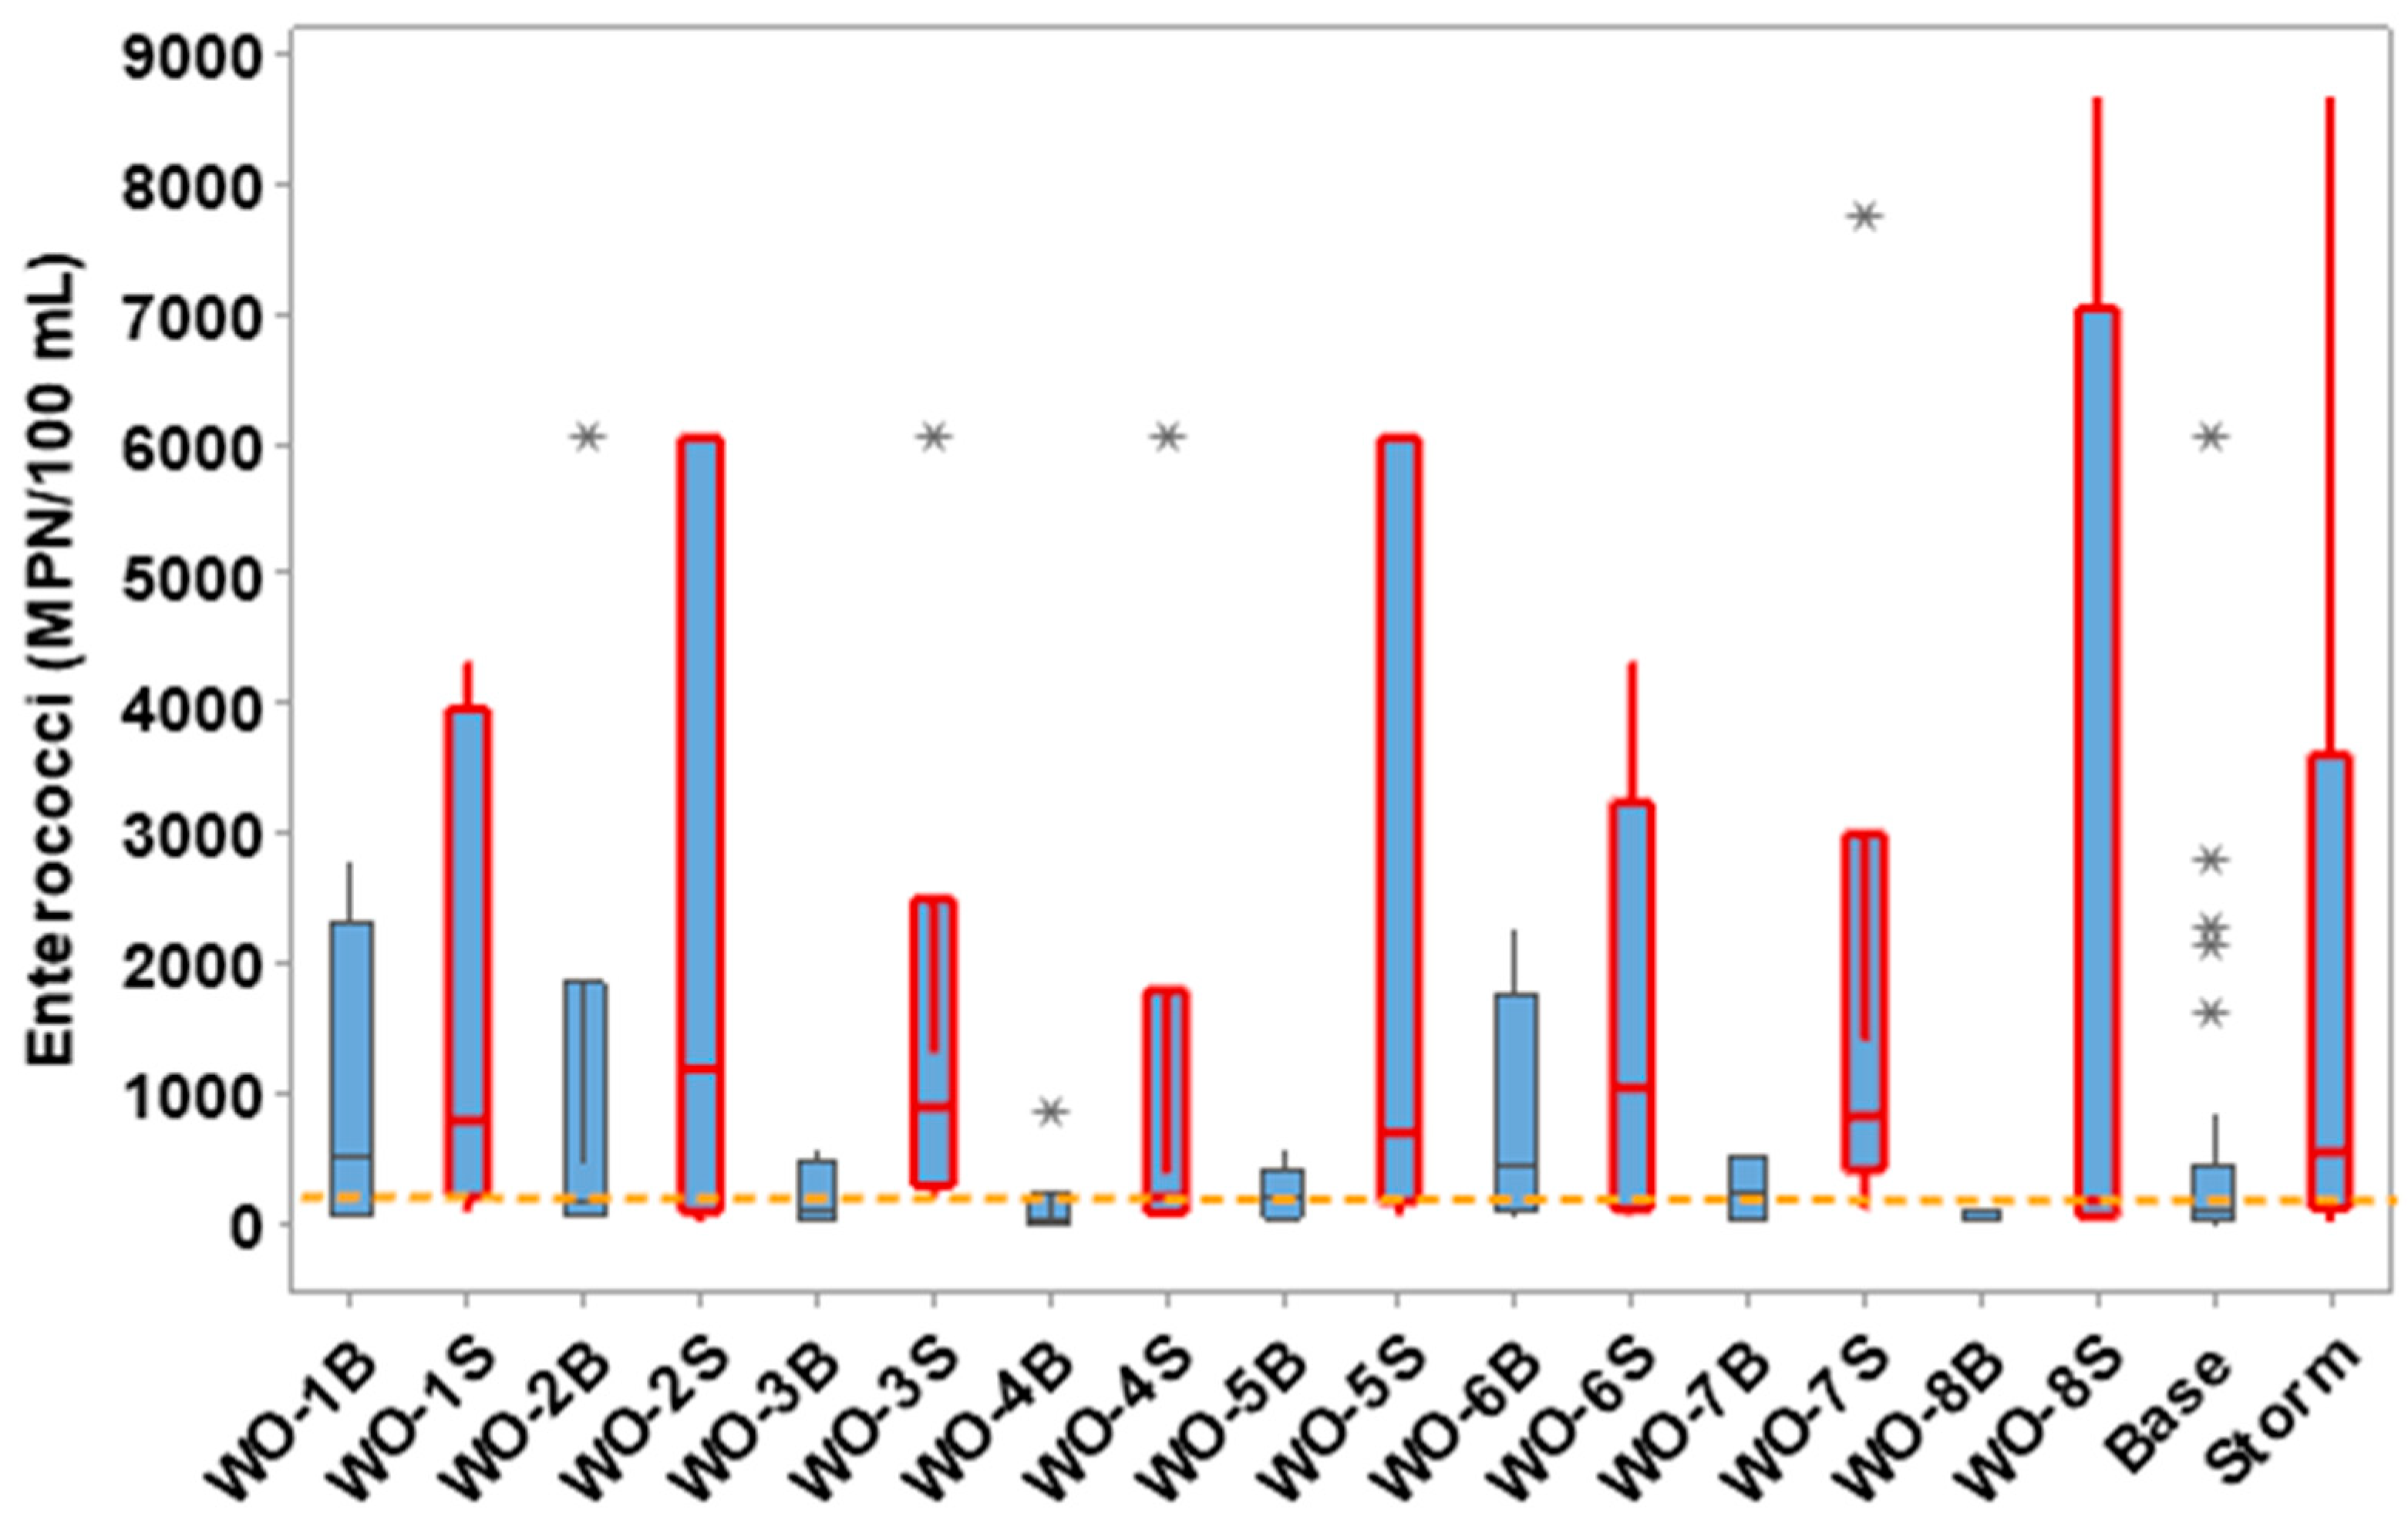
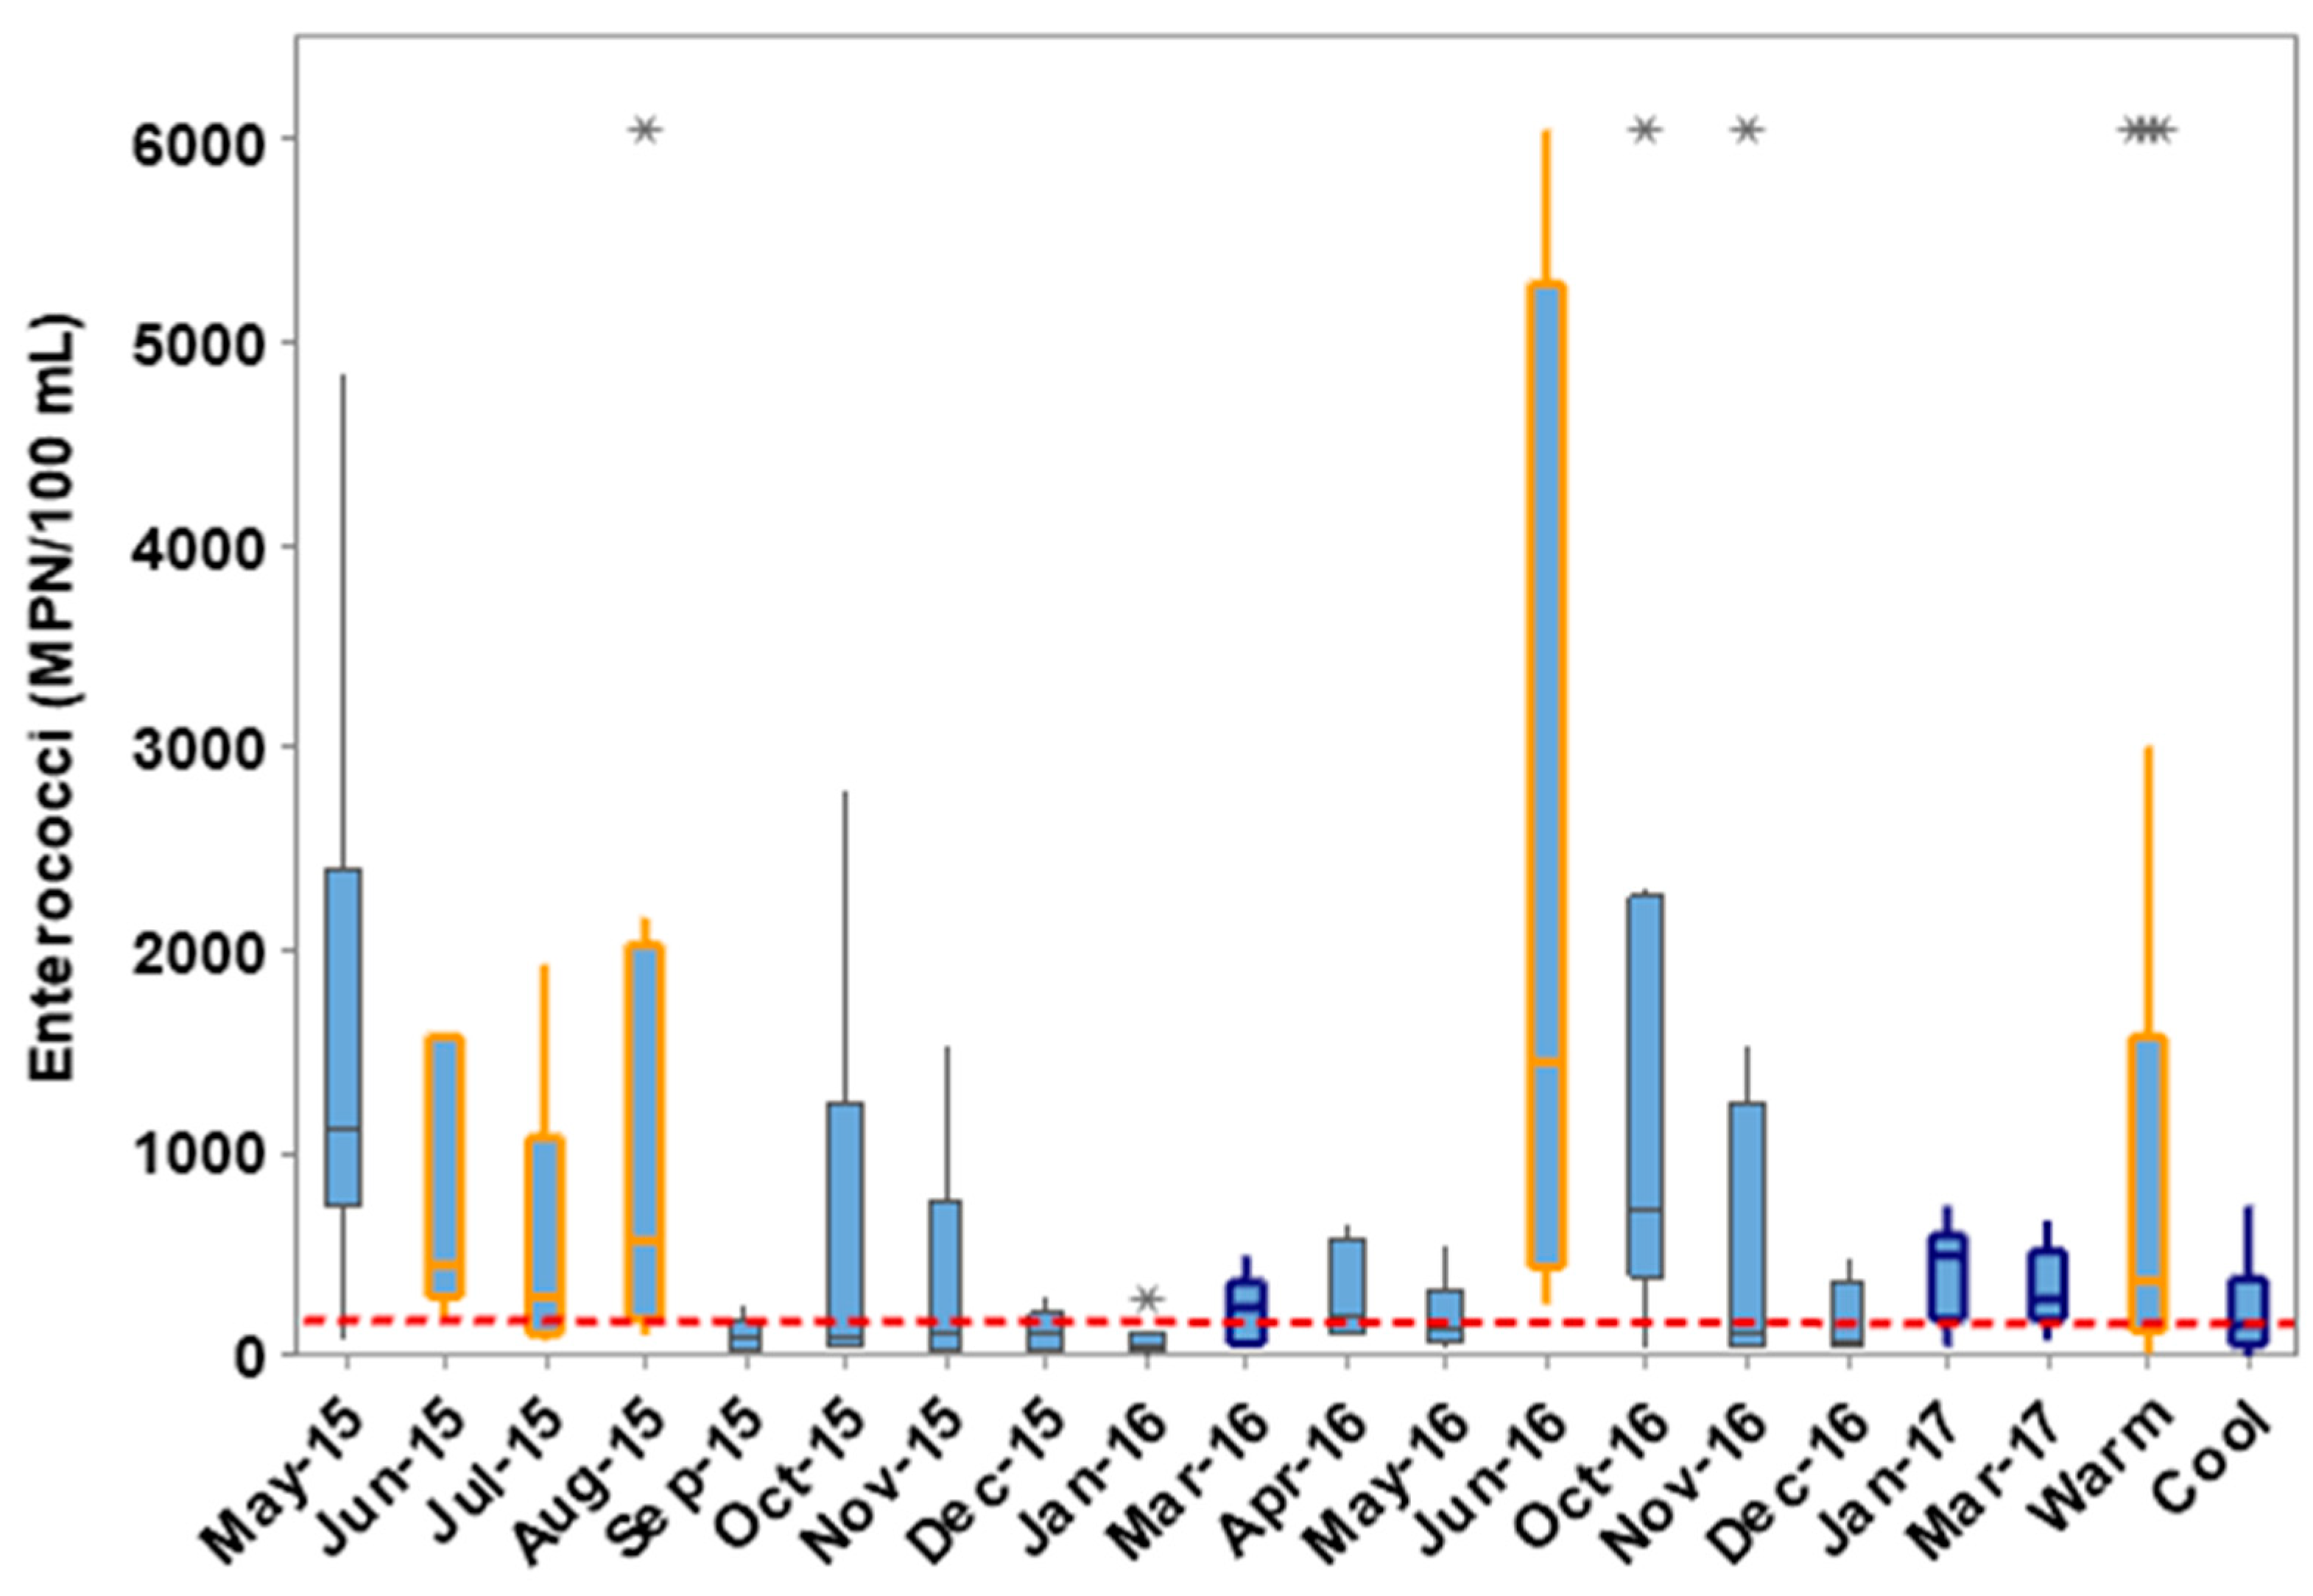
3.1. Fecal Indicator Bacteria Concentrations

Concentrations of E. coli and enterococci were elevated relative to the STV for all locations during most sampling events. Overall, of the 192 samples collected for each FIB, 144 samples (75%) analyzed for E. coli and 126 samples (66%) analyzed for enterococci were above their STVs. These included 72% and 61% of baseflow samples analyzed for E. coli and enterococci, respectively, and 83% and 79% of stormflow samples analyzed for E. coli and enterococci, respectively. Concentrations of E. coli and enterococci during stormflow were elevated relative to baseflow (Figure 8 and Figure 9). The median concentrations of E. coli and enterococci for all baseflow samples were 1017 MPN 100 mL1 and 256 MPN 100 mL1, respectively, while stormflow medians were 1780 MPN 100 mL1 and 571 MPN 100 mL1 for E. coli and enterococci, respectively. Stormflow concentrations of E. coli (p = 0.027) and enterococci (p < 0.001) were significantly greater in comparison to baseflow concentrations. These data suggest that while baseflow concentrations of FIB were elevated in comparison to the STVs, runoff is mobilizing FIB leading to even higher concentrations in waters. Prior studies have also shown elevated FIB during stormflow conditions resulting from the transport of waste materials deposited on impervious surfaces and/or suspension/resuspension of sediments with FIB attached [28,39,40]. Higher FIB concentrations in coastal North Carolina waters associated with stormwater runoff were reported, and researchers [28] suggested better measures to control erosion and sedimentation. In a review of the literature, researchers [39] summarized that FIB concentrations in waters can increase 2–3 folds during rain events due to mechanical disturbance of bottom sediments and resuspension of FIB-laden soil. Research [40] conducted in coastal waters near Captiva, Florida, USA found enterococci levels were significantly higher after rain events due to diffuse sources contributing to stormwater runoff. Thus, reducing the volume of runoff during rain events in the Boat House Creek watershed may help reduce FIB loading to the estuary by reducing overland transport of FIB and erosion of stream beds.

3.2. Spatial Variability in FIB Concentrations

Baseflow concentrations of FIB were typically lower near the headwater relative to the mouth of each major stream segment (Figure 8 and Figure 9). For example, the overall geometric mean concentration of E. coli at WO-3 (near headwaters) was 337 MPN 100 mL1 and significantly lower (p = 0.01) in comparison to near the mouth at WO-7 (geometric mean = 1261 MPN 100 mL1). The overall geometric mean concentration of enterococci at WO-3 was 190 MPN 100 mL1, while at WO-7 it was 340 MPN 100 mL1, although the differences were not significant (p = 0.256). The overall geometric mean concentration of E. coli at WO-4 near the headwaters was 361 MPN 100 mL1, while near the mouth, it was 1464 MPN 100 mL1, and the differences were significant (p = 0.006). The overall geometric mean concentration of enterococci at WO-4 was 119 MPN 100 mL1, and at WO-6, it was 488 MPN 100 mL1. Differences were significant at p = 0.007. Samples collected closer to the mouth of the streams at WO-7 and WO-6 more frequently exceeded the statistical threshold values for E. coli and enterococci. For example, baseflow samples collected at WO-7 exceeded the E. coli and enterococci STVs 78% of the time, while samples collected at WO-3 exceeded the STV for E. coli and enterococci 56% and 61% of the time, respectively. Baseflow samples collected at WO-6 exceeded the STVs 78% of the time, while 50% and 28% of samples collected from WO-4 exceeded the STV for E. coli and enterococci, respectively. The overall geometric means of E. coli and enterococci concentrations from samples collected during stormflow conditions and near the mouth of the streams at WO-7 and WO-6 (E. coli: 963 MPN 100 mL1; enterococci: 801 MPN 100 mL1) were not significantly elevated (p = 0.505) relative to near the headwaters (E. coli: 750 MPN 100 mL1; enterococci: 532 MPN 100 mL1). The frequencies of exceedance during stormflow conditions near the mouths of the streams were 67% (WO-6) and 83% (WO-7) for E. coli and 83% (WO-6) and 100% (WO-7) for enterococci, while at the headwaters, the exceedance for E. coli were 100% (WO-3) and 83% (WO-4) and 100% (WO-3) and 50% (WO-4) for enterococci. There was a wider vegetated buffer along the streams near the mouth (~55 m) relative to the headwaters (~15 m). The marsh and forested buffer areas provide habitats and corridors for wildlife including bears, raccoons, deer, and various waterfowls [29]. It is possible that concentrations of FIB increased in these segments of the waterways due to animal activity [33]. Research in Florida, USA [41] revealed that raccoons were the dominant source of fecal coliform in the tested waterways after wastewater treatment improvements were made. Some work [39] has reported that direct deposition of animal waste material into streams may be a likely dominant source of FIB during baseflow conditions in some watersheds, and that may also be the case for Boat House Creek.
Bacterial source tracking revealed that human wastewater was not likely the dominant contributor of indicator bacteria to the streams and estuary. More specifically, twenty-four percent (8 of 34) of samples tested were positive for the general order Bacteroidales. The samples that were positive included six collected during stormflow conditions and two during baseflow. However, the only sample that was positive for human-specific Bacteroidales was an effluent sample from a septic system used as a positive control. A dog waste sample tested positive for the general Bacteroidales but was negative for the human-specific Bacteroidales (negative control). These data indicate that animals were the most likely source of fecal indicator bacteria in surface waters during the time of sample collection. Because FIB concentrations were highest during stormflow events and the presence of Bacteroidales was more frequent during stormflow, slowing the delivery of runoff during rain events may help to reduce FIB loading to the estuary. While animals are the most likely source of FIB, the transport of FIB is facilitated by runoff from the impervious surface. Prior studies have shown that density of onsite wastewater systems was a factor regarding FIB concentrations and exports in some watersheds [25,26], but those studies documented that malfunctioning systems were present adjacent to the waterways. In the current study, even though the density of OWS exceeded 1 system ha1, malfunctioning systems were not observed during more than 30 visits to the sites.

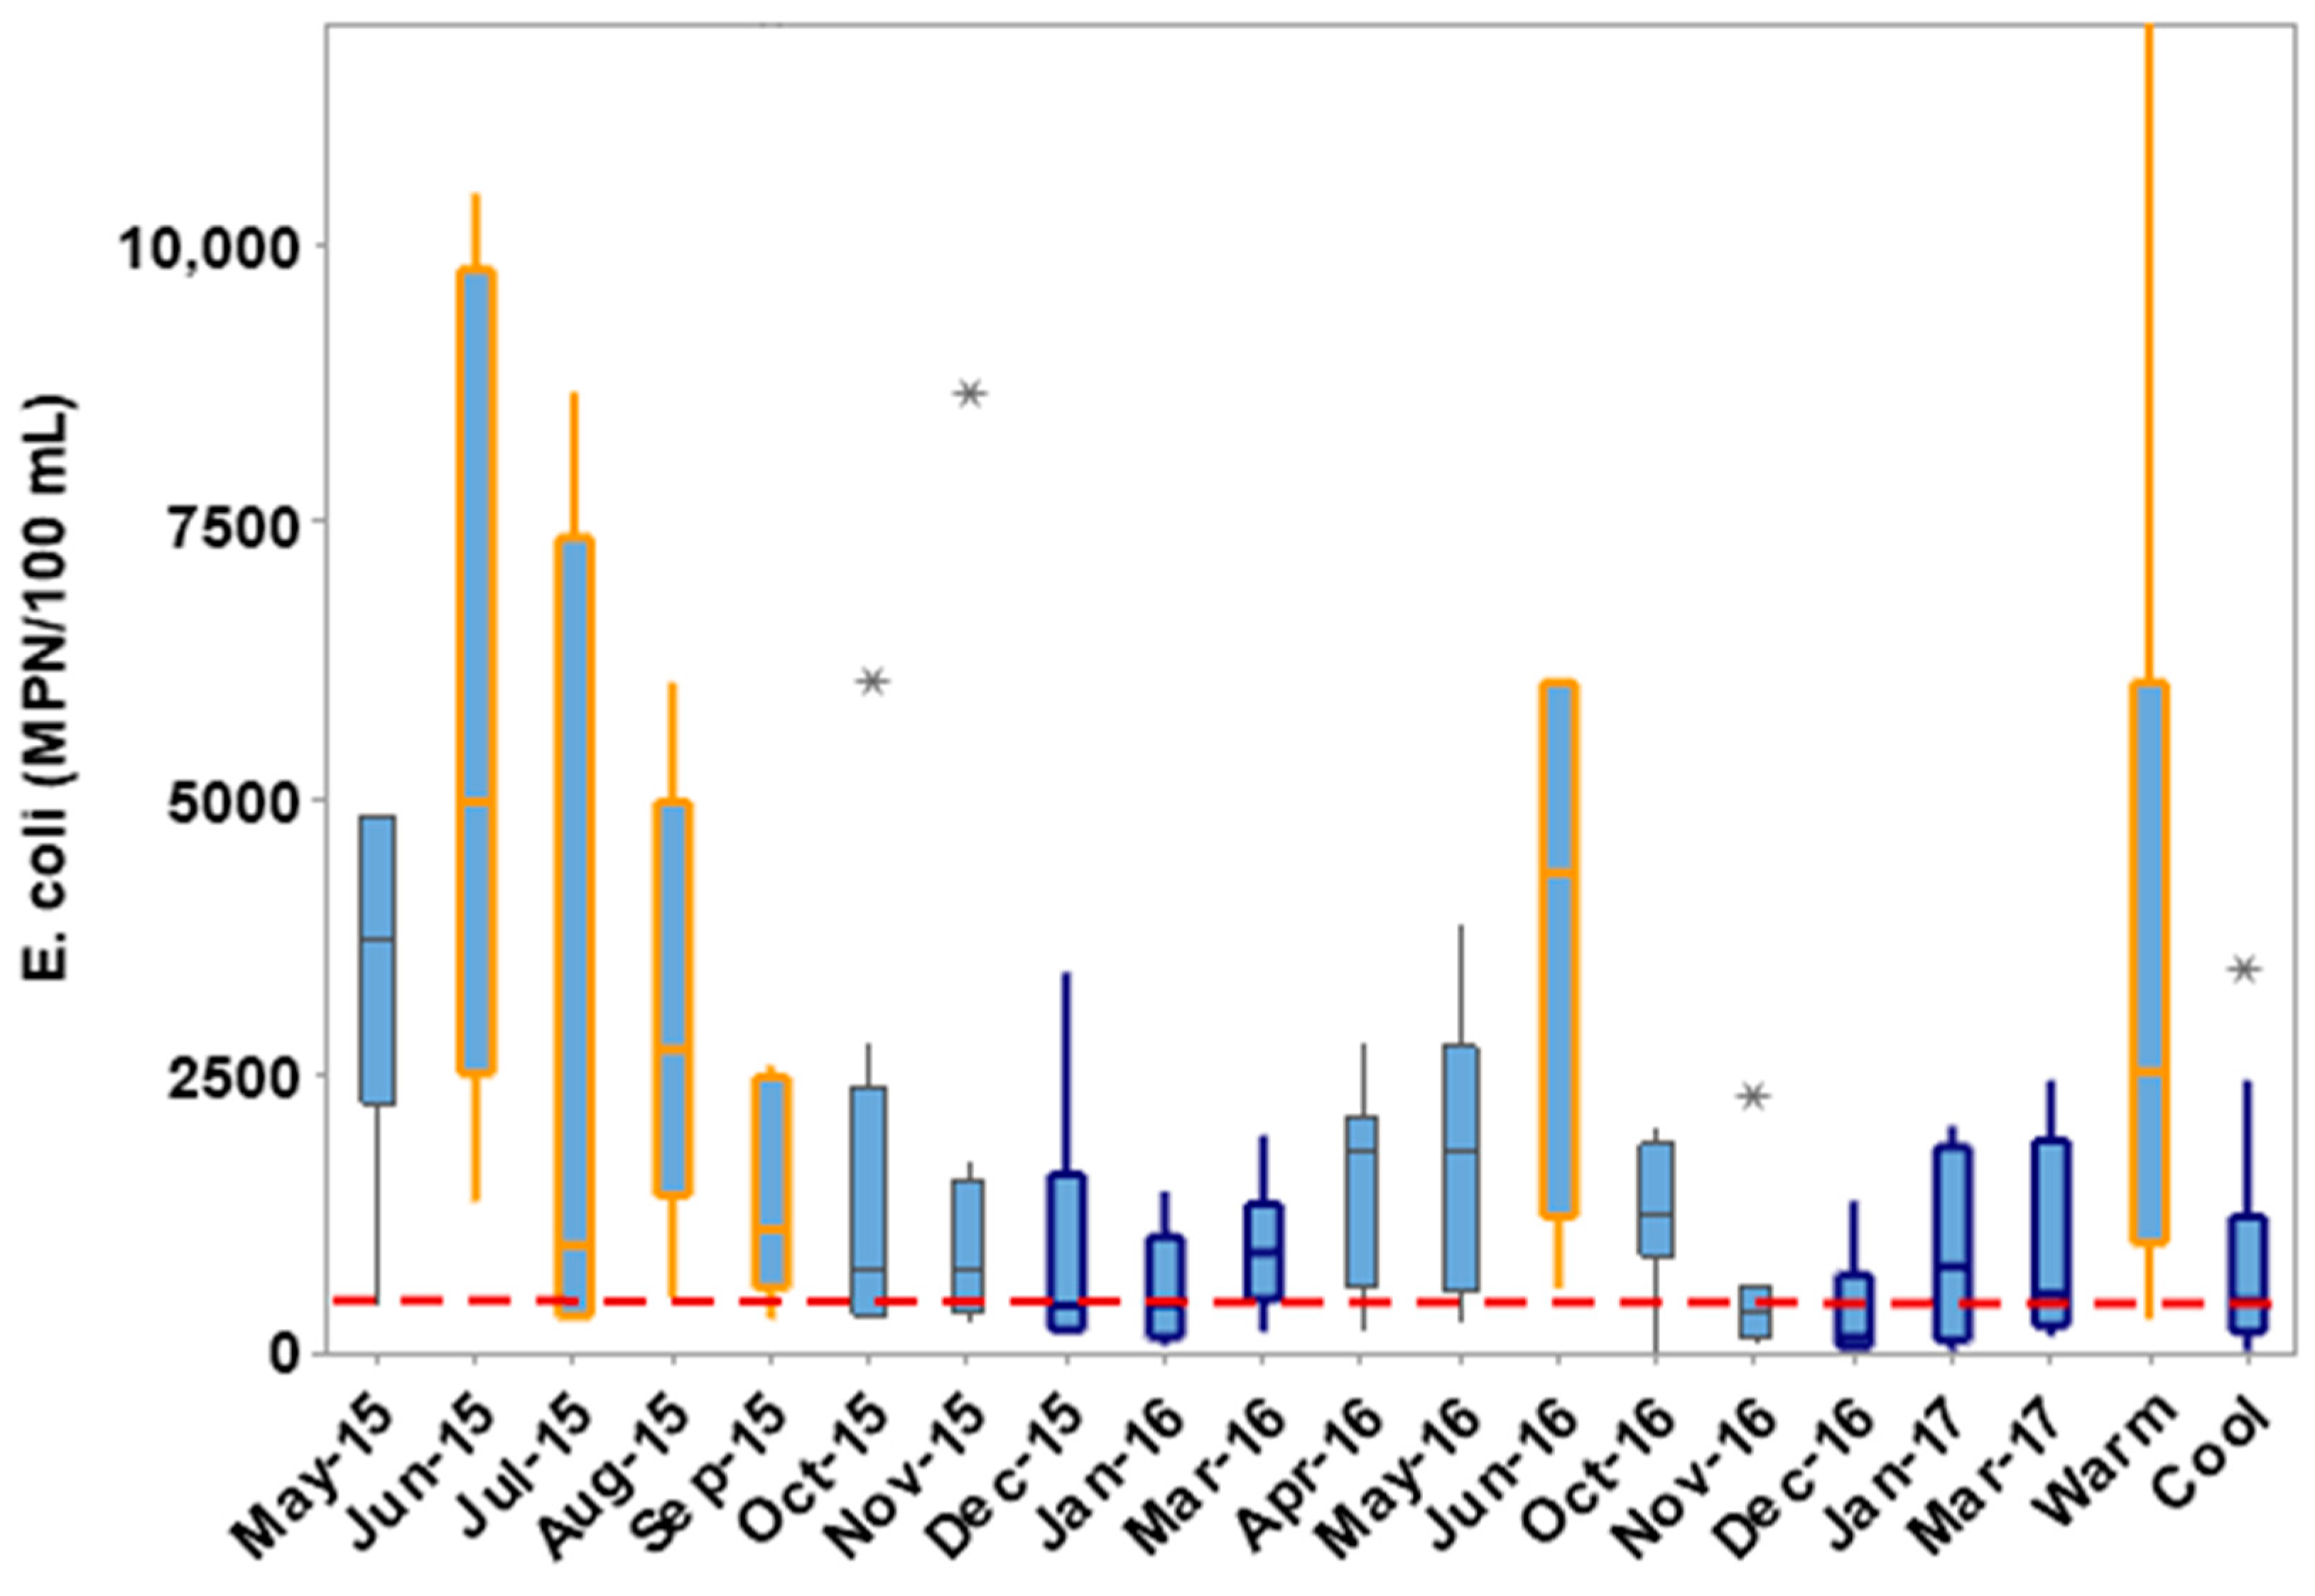
3.3. Temporal Variability in FIB Concentrations and Loadings

Baseflow concentrations of FIB were higher during warm (June to September), relative to colder (December to March) months (Figure 10). The differences in concentrations were statistically significant when comparing warm to cold months. The geometric mean of E. coli concentrations during warm months under baseflow conditions was 2243 MPN 100 mL1 while in cold months was 411 MPN 100 mL1 (p < 0.01) (Figure 11). Enterococci concentrations during warm months and baseflow conditions were 437 MPN 100 mL1, and during cold months, the median concentration was 139 MPN 100 mL1 (p = 0.001) (Figure 12). The frequencies of exceedance of the STV for E. coli and enterococci during warm periods were 90% and 73%, respectively, and greater relative to cold periods (58% and 54%). The geometric mean concentrations of E. coli and enterococci were higher during warm months (1186 MPN 100 mL1 and 1206 MPN 100 mL1 in comparison to colder months 949 MPN 100 mL1 and 574 MPN 100 mL1, respectively. Furthermore, significant correlations were observed between water temperature and geometric mean concentrations of E. coli (r = 0.917, p < 0.001) and enterococci (r = 0.548, p = 0.019). Prior research [42] has documented elevated fecal indicator bacteria concentrations in urban runoff during warmer months relative to colder months in NC. Other work has reported higher FIB concentrations in streams of NC during warmer periods (relative to colder) possibly because of increased animal activity during warm seasons.
The Geometric mean of FIB loadings to the estuary during baseflow was not significantly different when comparing warm to cold months for either E. coli (p = 0.12) or enterococci (p = 0.41) (Figure 13). While concentrations of FIB were typically higher during the warmer months (Figure 11 and Figure 12), the discharge was relatively low (Figure 14). The opposite was true of colder periods; when the discharge was relatively high, the FIB concentrations were lower. Because FIB loading is the product of discharge and concentration, significant differences in loading were not observed during baseflow conditions when comparing warm and cold months. Mean stormflow loadings of E. coli (2434,662 MPN s1) were significantly higher (p = 0.03) relative to baseflow loadings (569,107 MPN s1) (Figure 13). Mean stormflow loadings of enterococci (2,006,257 MPN s1) were significantly greater (p = 0.05) in comparison to mean baseflow loadings (278,759 MPN s1) (Figure 13). Stormflow loadings of E. coli and enterococci were not significantly different (p > 0.05) when comparing warm and cold seasons.

3.4. Physicochemical Characteristics

Mean baseflow to the estuary was lower during the summer (22.4 L s−1, or 0.09 L s−1 ha−1) and higher during the winter months (60.4 L s−1, or 0.24 L s−1 ha−1), and differences in baseflow between the summer and winter were statistically significant (p = 0.008) (Figure 14). A significant inverse correlation was observed between water temperature and discharge (r = −0.590, p = 0.010). The observed lower discharge during the warmer months was not a result of lower precipitation totals because the mean rainfall received during the warm months (June–August) was 15 cm, while during the cold months (January–March), it was 11 cm. A similar finding was observed in another study conducted in Eastern North Carolina, where it was concluded that evaporation and transpiration rates were greater during warm periods relative to colder periods and that resulted in less discharge during warmer months [12]. The mean pH of samples collected from the eight locations was slightly alkaline and during baseflow, ranged from 7.1 at site WO-2 to 7.4 at site WO-7, while during stormflow, the range was 7.1 (WO-3) to 7.7 (WO-1). Mean dissolved oxygen concentrations ranged from 4.0 mg L−1 at Site WO-8 to 7.2 mg L−1 at Site WO-7 during baseflow conditions and between 5.0 mg L−1 (WO-5) and 6.5 mg L−1 (WO-6) during stormflow. Dissolved oxygen concentrations were inversely related to temperature (r = −0.791, p < 0.001), and thus during warmer months, concentrations were lower than in colder months.

3.5. Stormwater Control Measure Runoff Reductions

Overall, the control measures implemented in the watershed are expected to reduce annual stormwater runoff by 5747 m3 (Table 2). While the rain garden installation and walkway renovation removed the highest percentage (100%) of runoff from their contributing area, the water control structures installed in the grassed swales along with the roadside modifications were responsible for the largest volume reductions of runoff. The five water control structures influenced the drainage from just over 21,000 m2 in comparison to about 1222 m2 combined for the rain garden and walkway work. The overall geometric mean concentrations of E. coli and enterococci during stormflow conditions were 1091 and 671 MPN 100 mL1, respectively. The reduction in annual stormflow of 5747 m3 may result in a reduction in FIB exports from the watershed of 6.3 × 10¹⁰ MPN E. coli and 3.9 × 10¹⁰ MPN of enterococci (based on the product of stormflow discharge and FIB concentrations). The control measures implemented in this watershed were selected to match the soil and site conditions. The Wando, Kureb, Baymeade, and Seabrook soil series occupy 72% of the Boat House Creek watershed (Table 1), and each of these soils has an infiltration capacity that exceeds 15 cm h1 and water tables that are typically deeper than 0.8 m below the surface [43]. By dispersing runoff to open areas and modified grass swales with water control structures and check dams, stormwater can rapidly infiltrate these deep, sandy soils, and FIB can be filtered prior to reaching groundwater [38]. Thus infiltrating runoff that recharges the water table during rain events should have low concentrations of FIB due to filtration in the vadose zone beneath the rain garden, swales, forested area, and open space. If the groundwater had been closer to the surface and/or the subsoil and had contained a higher clay content, stormwater wetlands or detention basins may have been selected in place of the control structures, check dams, and rain gardens [8,11,12].

4. Conclusions

The goal of the study was to gain a better understanding of the sources and delivery mechanisms of FIB emanating from the Boat House Creek Watershed to the White Oak Estuary and to implement measures to help improve water quality. Microbial source tracking analyses along with land-use characterization and water-quality assessments during baseflow and stormflow conditions over a two-year period were conducted. Results showed that animal waste, likely from wildlife, was the major source of FIB, and urban runoff was contributing to the transport of FIB to the estuary. These data suggested that approaches that reduce and treat stormwater runoff should be targeted to reduce FIB loadings to the estuary. Multiple stormwater control measures including a rain garden, five water control structures, four check dams, and various drainageway modifications were implemented as part of this project to increase infiltration and reduce runoff, thereby reducing the transport of FIB to the estuary. The control measures were installed in areas with deep, sandy soils to enable filtration of FIB in the >0.6 m vadose zone. Mean annual runoff was reduced by an estimated 5747 m3 after the control measures were installed. These practices and many others installed by various organizations including the Coastal Federation, Soil and Water Conservation, and local governments helped reduce stormwater transport of FIB to the Lower White Oak River [44]. However, as the watershed continues to urbanize, more work will be needed to control runoff and improve and maintain water quality.

Supplementary Materials

The following supporting information can be downloaded at: https://www.mdpi.com/article/10.3390/hydrology10070156/s1, Aerial photograph of Marsh Harbor in early 2000’s and more recent. Soils map showing the location of the dominant soils in the watershed.

Author Contributions

Conceptualization, C.P.H.J., E.B. and M.O.; methodology, C.P.H.J., E.B., M.O. and A.W.; software, C.P.H.J., N.L., R.B. and A.W.; validation, C.P.H.J., E.B., M.O., N.L., R.B. and A.W.; formal analysis, C.P.H.J., N.L., R.B., A.W., E.B. and M.O.; investigation, N.L., R.B., C.P.H.J., E.B., M.O. and A.W.; resources, C.P.H.J., M.O. and E.B.; data curation, N.L., R.B., C.P.H.J., A.W., E.B. and M.O.; writing—original draft preparation C.P.H.J., N.L. and R.B.; writing—review and editing, C.P.H.J., E.B., M.O., N.L., R.B. and A.W.; visualization, C.P.H.J., N.L. and R.B.; supervision, C.P.H.J., E.B., M.O. and A.W.; project administration, C.P.H.J.; funding acquisition, C.P.H.J., M.O. and E.B. All authors have read and agreed to the published version of the manuscript.

Funding

This research was primarily funded by NC DENR, grant number 6191 and the APC was waived.

Data Availability Statement

Raw data can be provided upon request by emailing the corresponding author at [email protected].

Acknowledgments

The authors would like to acknowledge the NC Coastal Federation for partnering on this project, the Town of Cedar Point, the US Forest Service, and John Harris, Christa Sanderford, Caitlin Skibiel, Guy Iverson, and Josh Volcan for help with lab and/or field work.

Conflicts of Interest

The authors declare no conflict of interest. The funders had no role in the design of the study; in the collection, analyses, or interpretation of data; in the writing of the manuscript; or in the decision to publish the results.

References

  1. Li, D.; Liu, M.; Hu, Y.; Shi, T.; Qu, X.; Walter, M.T. Effects of urbanization on direct characteristics in urban functional zones. Sci. Total Environ. 2018, 643, 301–311. [Google Scholar] [CrossRef] [PubMed]
  2. Maniquiz-Redillas, M.; Robles, M.E.; Cruz, G.; Reyes, N.J.; Kim, L.-H. First flush stormwater runoff in urban catchments: A bibliometric and comprehensive review. Hydrology 2022, 9, 63. [Google Scholar] [CrossRef]
  3. Chen, J.; Theller, L.; Gitau, M.W.; Engel, B.A.; Harbor, J.M. Urbanization impacts on surface runoff of the contiguous United States. J. Environ. Manag. 2017, 187, 470–481. [Google Scholar] [CrossRef] [PubMed]
  4. Hardison, E.C.; O’Driscoll, M.A.; DeLoatch, J.P.; Howard, R.J.; Brinson, M.M. Urban land use, channel incision, and water table decline along coastal plain streams, North Carolina. J. Am. Water Resour. Assoc. 2009, 45, 1032–1046. [Google Scholar] [CrossRef]
  5. Manda, A.K.; Sisco, M.S.; Mallinson, D.J.; Griffin, M.T. Relative role and extent of marine and groundwater inundation on a dune-dominated barrier island under sea-level rise scenarios. Hydrol. Process. 2015, 29, 1894–1904. [Google Scholar] [CrossRef]
  6. Wurster, S.; Paraskevopoulos, T.; Toda, M.; Jiang, Y.; Tarrand, J.T.; Williams, S.; Chiller, T.M.; Jackson, B.R.; Kontoyiannis, D.P. Invasive mould infections in patients from floodwater-damaged areas after hurricane Harvey- a closer look at an immunocompromised cancer patient population. J. Infect. 2022, 84, 701–709. [Google Scholar] [CrossRef]
  7. Soetanto, R.; Proverbs, D.G. Impacts of flood characteristics on damage caused to UK domestic properties: The perceptions of building surveyors. Struct. Surv. 2004, 22, 95–104. [Google Scholar] [CrossRef] [Green Version]
  8. Collins, K.A.; Lawrence, T.J.; Stander, E.K.; Jontos, R.J.; Kaushal, S.S.; Newcomer, T.A.; Grimm, N.B.; Ekberg, M.L.C. Opportunities and challenges for managing nitrogen in urban stormwater: A review and synthesis. Ecol. Eng. 2010, 36, 1507–1519. [Google Scholar] [CrossRef]
  9. Cahoon, L.B.; Hales, J.C.; Carey, E.S.; Loucaides, S.; Rowland, K.R.; Nearhoof, J.E. Shellfishing closures in Southwest Brunswick County, North Carolina: Septic tanks vs. storm-water runoff as fecal coliform sources. J. Coast. Res. 2006, 22, 319–327. [Google Scholar] [CrossRef]
  10. Dietz, M.E. Low impact development practices: A review of current research and recommendations for future directions. Water Air Soil Pollut. 2007, 186, 351–363. [Google Scholar] [CrossRef]
  11. Humphrey, C.P.; Iverson, G. Reduction in nitrogen exports from stormflow after conversion of a dry detention basin to a stormwater wetland. Appl. Sci. 2020, 10, 9024. [Google Scholar] [CrossRef]
  12. Humphrey, C.P.; Ivreson, G.; Nolan, M. Nitrogen treatment by a dry detention basin with stormwater wetland characteristics. Hydrology 2022, 9, 85. [Google Scholar] [CrossRef]
  13. Vietz, G.J.; Walsh, C.J.; Fletcher, T.D. Urban hydrogeomorphology and the urban stream syndrome: Treating the symptoms and causes of geomorphic change. Prog. Phys. Geogr. 2016, 40, 480–492. [Google Scholar] [CrossRef]
  14. Newburn, D.A.; Alberini, A. Household response to environmental incentives for rain garden adoption. Water Resour. Res. 2016, 52, 1345–1357. [Google Scholar] [CrossRef] [Green Version]
  15. Bastia, J.; Mishra, B.K.; Kumar, P. Integrative assessment of stormwater infiltration practices in rapidly urbanizing cities: A case of Lucknow City, India. Hydrology 2021, 8, 93. [Google Scholar] [CrossRef]
  16. National Oceanic and Atmospheric Administration Department. National Coastal Population Report, Population Trends from 1970–2020. Available online: https://coast.noaa.gov/digitalcoast/training/population-report.html (accessed on 22 July 2023).
  17. NC Department of Environmental Quality. Basin Planning Branch 2023. Available online: https://www.deq.nc.gov/about/divisions/water-resources/water-planning/basin-planning-branch (accessed on 22 July 2023).
  18. NC Department of Environmental Quality. White Oak Basin Plan. 2007. Available online: https://www.deq.nc.gov/about/divisions/water-resources/water-planning/basin-planning/river-basin-plans/white-oak#2007WhiteOakBasinPlan-4044 (accessed on 22 July 2023).
  19. Gotkowksa-Plachta, A.; Goals, I.; Korzeniewaka, E.; Koc, J.; Rochwerger, A.; Solarski, K. Evaluation of the distribution of fecal indicator bacteria in a river system depending on different types of land use in the southern watershed of the Baltic Sea. Environ. Sci. Pollut. Res. 2016, 23, 4073–4085. [Google Scholar] [CrossRef]
  20. Kon, T.; Weir, S.C.; Howell, E.T.; Lee, H.; Trevors, J.T. Repetitive element (REP)-polymerase chain reaction (PCR) analysis of Escherichia coli isolates from recreational waters of southeastern Lake Huron. Can. J. Microbiol. 2009, 55, 269–276. [Google Scholar] [CrossRef]
  21. Wright, M.E.; Solo-Gabriele, H.M.; Elmir, S.; Fleming, L.E. Microbial load from animal feces at a recreational beach. Marine Pollut. Bull. 2009, 58, 1649–1656. [Google Scholar] [CrossRef] [Green Version]
  22. Nguyen, K.H.; Senay, C.; Young, S.; Nayak, B.; Lobos, A.; Conrad, J.; Harwood, V.J. Determination of wild animal sources of fecal indicator bacteria by microbial source tracking (MST) influences regulatory decisions. Water Res. 2018, 144, 424–434. [Google Scholar] [CrossRef]
  23. Toledo-Hernandez, C.; Ryu, H.; Gonzalez-Nieves, J.; Huertas, E.; Toranzos, G.A.; Domingo, J.W.S. Tracking the primary sources of fecal pollution in a tropical watershed in a one-year study. Appl. Environ. Microbiol. 2013, 79, 1689–1696. [Google Scholar] [CrossRef] [Green Version]
  24. Humphrey, C.; Finley, A.; O’Driscoll, M.; Manda, A.; Iverson, G. Groundwater and stream E. coli concentrations in coastal plain watersheds served by onsite wastewater and a municipal sewer treatment system. Water Sci. Technol. 2015, 72, 1851–1860. [Google Scholar] [CrossRef] [PubMed]
  25. Humphrey, C.P., Jr.; Sanderford, C.; Iverson, G. Concentrations and exports of fecal indicator bacteria in watersheds with varying densities of onsite wastewater systems. Water Air Soil Pollut. 2018, 229, 277. [Google Scholar] [CrossRef]
  26. Iverson, G.; Sanderford, C.; Humphrey, C.P., Jr.; Etheridge, J.R.; Kelley, T. Fecal indicator bacteria transport from watersheds with differing wastewater technologies and septic system densities. Appl. Sci. 2020, 10, 6525. [Google Scholar] [CrossRef]
  27. Mallin, M.A.; Williams, K.E.; Esham, E.C.; Lowe, R.P. Effect of human development on bacteriological water quality in coastal watersheds. Ecol. Appl. 2000, 10, 1047–1056. [Google Scholar] [CrossRef]
  28. Mallin, M.A.; Johnson, V.L.; Ensign, S.H. Comparative impacts of stormwater runoff on water quality of an urban, suburban, and a rural stream. Environ. Monit Assess 2009, 159, 475–491. [Google Scholar] [CrossRef] [PubMed]
  29. United States Forest Service. Croatan National Forest. Available online: https://www.fs.usda.gov/recarea/nfsnc/recarea/?recid=48466 (accessed on 22 July 2023).
  30. Cedar Point, North Carolina Population History. Available online: https://www.biggestuscities.com/city/cedar-point-north-carolina (accessed on 22 July 2023).
  31. Weather Spark. Climate and Average Weather Year round in Newport, NC. Available online: https://weatherspark.com/y/21630/Average-Weather-in-Newport-North-Carolina-United-States-Year-Round (accessed on 22 July 2023).
  32. United States Environmental Protection Agency. 2012 Recreational Water Quality Criteria. Office of Water EPA-820-F-12-061. Available online: https://www.epa.gov/sites/default/files/2015-09/documents/npdes-water-quality-based-permit-limits-for-recreational-water-quality-criteria-faqs_0.pdf (accessed on 22 July 2023).
  33. North Carolina Department of Environmental Quality, Stormwater Calculations. Available online: https://files.nc.gov/ncdeq/Energy%20Mineral%20and%20Land%20Resources/Stormwater/BMP%20Manual/B%20%20Stormwater%20Calculations.pdf (accessed on 2 June 2023).
  34. Osmond, D.L.; Gilliam, J.W.; Evans, R.O. Riparian Buffers and Controlled Drainage to Reduce Agricultural Nonpoint Source Pollution. NC Agricultural Research Ser-vice Technical Bulletin 318, North Carolina State University, Raleigh, NC. Available online: https://content.ces.ncsu.edu/riparian-buffers-and-controlled-drainage-to-reduce-agricultural-nonpoint-source-pollution (accessed on 22 July 2023).
  35. Winston, R.J.; Powell, J.T.; Hunt, W.F. Retrofitting a grass swale with rock check dams: Hydrologic impacts. Urban Water J. 2019, 16, 404–411. [Google Scholar] [CrossRef]
  36. Knight, E.M.P.; Hunt, W.F.; Winston, R.J. Side-by-Side Evaluation of Four Level Spreader-Vegetated Filter Strips and a Swale in Eastern North Carolina. J. Soil Water Conserv. 2013, 68, 60–72. [Google Scholar] [CrossRef]
  37. Bäckström, M. Grassed Swales for Stormwater Pollution Control during Rain and Snowmelt. Water Sci. Technol. 2003, 48, 123–132. [Google Scholar] [CrossRef]
  38. Stall, C.; Amoozegar, A.; Graves, A.; Rashash, D. Transport of E. coli in a sandy soil as impacted by depth to water table. J. Environ. Health 2014, 76, 92–100. [Google Scholar]
  39. Pachepsky, Y.A.; Shelton, D.R. Escherichia coli and fecal coliforms in freshwater and estuarine sediments. Crit. Rev. Environ. Sci. Technol. 2011, 41, 1067–1110. [Google Scholar] [CrossRef]
  40. Thompson, M.; Milbrandt, E.; Bartleson, R.; Rybak, A. Evaluation of bacteriological and nutrient concerns in nearshore waters of a barrier island community in SW Florida. Mar. Pollut. Bull. 2012, 64, 1425–1434. [Google Scholar] [CrossRef] [PubMed]
  41. Harwood, V.J.; Whitlock, J.; Withington, V. Classification of antibiotic resistance patterns of indicator bacteria by discriminant analysis: Use of predicting the source of fecal contamination in subtropical waters. Appl. Environ. Microbiol. 2000, 66, 3698–3704. [Google Scholar] [CrossRef] [PubMed] [Green Version]
  42. Hathaway, J.M.; Hunt, W.F.; Simmons III, O.D. Statistical evaluation of factors affecting indicator bacteria in urban storm-water runoff. J. Environ. Eng. 2010, 136, 1360–1368. [Google Scholar] [CrossRef]
  43. United States Department of Agriculture, Natural Resources Conservation Service. Official Soil Series Description. Available online: https://soilseries.sc.egov.usda.gov/osdname.aspx (accessed on 22 July 2023).
  44. NC Department of Environmental Quality. White Oak Plan 2021. Available online: https://www.deq.nc.gov/about/divisions/water-resources/water-planning/basin-planning/river-basin-plans/white-oak#2021WhiteOakBasinPlan-9661 (accessed on 22 July 2023).
Figure 1. Boathouse Creek Watershed in Coastal North Carolina, USA. Monitoring locations are labeled WO1 to WO8).
Hydrology 10 00156 g001
Figure 2. Construction of a rain garden at the Cedar Point boat ramp. The image on the lower right shows the rain garden storing runoff after a rain event.
Hydrology 10 00156 g002
Figure 3. Removal of walkway in place of a new one that allowed runoff to flow into the adjacent forested area to infiltrate.
Hydrology 10 00156 g003
Figure 4. Overgrown grass and about 10 cm of soil along the shoulder of many roads in the Ocean Spray community were excavated and replaced with new sod. The lower-elevation sod allowed runoff to enter the swales and infiltrate.
Hydrology 10 00156 g004
Figure 5. Installation of a water control structure in the driveway culvert of a property in the Ocean Spray community. The flash board in the frame raises the outlet elevation of the drainageway, thus reducing outflow during smaller storms.
Hydrology 10 00156 g005
Figure 6. Installation of check dams along a road swale in the Boat House Creek watershed.
Hydrology 10 00156 g006
Figure 7. A crushed culvert (top left) was replaced (top right) to allow drainage to flow into an open area to infiltrate and prevent the hydraulic overload of one side of the campground (bottom) that occurred prior to the replacement of the culvert. Runoff was diverted to the left side of the road before the culvert was replaced.
Hydrology 10 00156 g007
Figure 8. Concentrations of E. coli during baseflow (B) and stormflow (S) from each of the eight monitoring locations, and the pooled baseflow (Base) and stormflow (Storm) data. Stormflow data are outlined in red. The dashed line represents the statistical threshold value (STV) for E. coli. Statistical outliers are shown as (*).
Hydrology 10 00156 g008
Figure 9. Concentrations of enterococci during baseflow (B) and stormflow (S) from each of the eight monitoring locations, and the pooled baseflow (Base) and stormflow (Storm) data. Stormflow data are outlined in red. The dashed line represents the statistical threshold value (STV) for enterococci. Statistical outliers are shown as (*).
Hydrology 10 00156 g009
Figure 10. Concentrations of E. coli and enterococci during the study period. Data are pooled for all sampling locations (WO-1 to WO-8).
Hydrology 10 00156 g010
Figure 11. Concentrations of E. coli during relatively warm (June–September) and cool (December–March) periods. The dashed line represents the statistical threshold value (STV) for E. coli. Statistical outliers are shown as (*).
Hydrology 10 00156 g011
Figure 12. Concentrations of enterococci during relatively warm (June–September) and cool (December–March) periods. The dashed line represents the statistical threshold value (STV) for enterococci. Statistical outliers are shown as (*).
Hydrology 10 00156 g012
Figure 13. Baseflow fecal indicator bacteria loadings during warm (June–September) and cold (December–March) months. Comparison of bacteria loadings during baseflow and stormflow (outlined in red) conditions.
Hydrology 10 00156 g013
Figure 14. Baseflow discharge to the estuary from the two major stream segments (WO-6 and WO-7) and the combined total.
Hydrology 10 00156 g014
Table 1. Soil properties within the Boathouse Creek Watershed. Hydrologic Soil Group A has the highest infiltration capacity, while D has the lowest.
Map Unit
Symbol
Map Unit NameHydrologic
Soil Group
AcresPercent
Area
AgAugusta loamy fine sandB/D2.70.4%
ApArapahoe fine sandy loamA/D44.17.0%
ByBBaymeade fine sandA52.88.4%
HBHobucken mucky fine sandy loamB/D26.04.2%
KuBKureb sandA88.414.1%
LnLeon sandA/D86.913.9%
SeSeabrook fine sandA61.69.8%
WaBWando fine sandA252.940.5%
WWater 10.31.7%
Total 625.7100.0%
Table 2. Stormwater runoff estimates using the Simple Method [37] are shown prior to retrofits. Runoff estimates made post-implementation of control measures (SCM) including water control structures (WCS), rain gardens, and check dams are also shown.
Control
Measure
Drainage Area (m2)Impervious Surface (m2)Annual Rain Depth (m)Pre-SCM Runoff Volume (m3)Post-SCM Runoff Volume (m3)
WCS-110926.52428.11.2536861253
WCS-26070.31335.51.251909649
WCS-31618.7445.21.25611208
WCS-41214.1242.81.25354120
WCS-51214.1283.31.25400136
Rain Garden748.7218.51.252970
Walkway473.5473.51.255700
Check Dams509.9352.11.25434148
Totals22775.85779 82612514
Disclaimer/Publisher’s Note: The statements, opinions and data contained in all publications are solely those of the individual author(s) and contributor(s) and not of MDPI and/or the editor(s). MDPI and/or the editor(s) disclaim responsibility for any injury to people or property resulting from any ideas, methods, instructions or products referred to in the content.

