Article

Applying Geophysical and Hydrogeochemical Methods to Evaluate Groundwater Potential and Quality in Middle Egypt

1
Geology Department, Faculty of Science, Minia University, Minia 61519, Egypt
2
Laboratory of Geoenvironmental Science and Environmental Quality Assurance, Department of Civil Engineering, School of Engineering, University of West Attica, 250 Thivon & P. Ralli Str., GR 12241 Athens, Greece
3
Geology and Geophysics Department, College of Science, King Saud University, Riyadh 11451, Saudi Arabia
*
Author to whom correspondence should be addressed.
Hydrology 2023, 10(8), 173; https://doi.org/10.3390/hydrology10080173
Submission received: 11 July 2023 / Revised: 7 August 2023 / Accepted: 16 August 2023 / Published: 18 August 2023
(This article belongs to the Special Issue Groundwater Pollution: Sources, Mechanisms, and Prevention)

Abstract

:
The El-Minia district is a location of interest for future urban development. Using hydrochemistry and electrical resistivity studies, this work aimed to evaluate the groundwater potentiality and it’s suitable for various uses. The groundwater potential in the study area was evaluated based on 24 VESs (vertical electrical soundings), and its quality was determined based on the analyses of 57 groundwater samples. EC (salinity index), Na% (salt hazard), SAR (ratio of sodium adsorption), chloride risks, SSP (soluble sodium percentage), MH (magnesium hazard), and other indicators were used to determine whether the collected water samples were suitable for irrigation. Four layers in the study area are mentioned in the geoelectrical cross-sections that have been constructed. The first is made up of silt and clay from the Nile River, while the second is made up of sandy clay, which has a resistivity range of 15 to 32 Ohm.m and a range thickness of 2 to 68 m. Dry limestone makes up the third layer; its resistivity ranges from 1222 to 3000 Ohm.m and its thickness varies between 75 and 95 m. The Eocene aquifer in the research area is represented by the final layer, which has a thickness of more than 250 m and resistivity values that range from 602 to 860 Ohm.m. Most groundwater samples that were collected are safe for drinking; however, none of them are fit for home usage because of their extreme hardness. According to the SAR and US diagram, RSC, KR, and PI, most groundwater samples from the Pleistocene and Eocene aquifers are fit for irrigation.

1. Introduction

Water quality degradation has become a global issue due to its fundamental ability to cause significant changes in the hydrological cycle [1,2,3,4]. Water quality concerns that are complex and diverse require immediate attention. There has been widespread interest and response. Intensive anthropogenic activities and rapid economic growth have put additional strain on the environment and ecosystems, resulting in soil and water resource degradation and severely limiting sustainability [2,3,4,5,6]. Pollution in both groundwater and surface water is caused by the presence of chemical substances [3,4,5,6,7,8,9]. These chemical components considerably impact whether or not water is appropriate for human consumption as well as industrial and agricultural purposes. Due to population growth, rising demands for home water use, and increased industrial and agricultural activity. Pollution has decreased the amount of water that is available, which has led to over-pumping. In the last few decades, the Eastern Desert has attracted the attention of different investments, especially in petroleum, tourism, mining, and agricultural activities. It occupies a portion of the arid to the semi-arid belt of Egypt. Water management presents unique issues in arid and semi-arid areas. These areas present significant demands to produce and manage freshwater resources since they are, by definition, locations where water is most scarce.
Egypt’s over-population and the significant rise in water demand for urban, industrial, and agricultural growth are two of the country’s many water resource challenges. With the expansion of urban and agricultural development, groundwater quality and quantity are regularly impacted by increased groundwater abstraction and new discharge sources. Groundwater exploration greatly benefits from geophysical research, especially geoelectrical techniques. These techniques are widely used to establish the groundwater carrier, layer thickness, and depth of the groundwater level. The fundamental hydrogeochemical activities that govern the groundwater environment and its connection to its migration are clearly understood thanks to groundwater geochemical investigations.
The management of groundwater resources offers a thorough grasp of the aquifer’s hydraulic properties and changes in chemical composition.
The area under investigation was thoroughly investigated for hydrogeology and hydro-geochemistry, as well as to assess groundwater quality and its suitability for various applications, using various methods. In the research area, overuse seriously threatens groundwater, particularly for irrigation. Groundwater pollution and abstraction have considerably increased due to industrial and domestic use, which has greatly impacted the hydrologic system. Due to human activities such as wastewater leaching and extensive fertilizer use in agriculture, groundwater pollution is also increasing. In order to safeguard the water resources in the research area, geochemical and geophysical technologies are effective tools for establishing integrated and sustainable water management strategies. The evaluation of groundwater for different purposes has been performed by many researchers, including [10,11,12,13,14,15,16]. In Egypt, the evaluation of groundwater has been by many scholars [17,18,19,20,21,22,23,24,25,26,27,28,29].
The area under investigation is located along the Eastern portion of the Nile Valley facing El-Minia and the northern part of Assiut districts. Wadi El-Sheikh bounds it at the north and Wadi El-Assuit at the south. The area under research is restricted between latitudes 27°10′ N–28°48′ N and longitudes 30°30′ E–31°30′ E (Figure 1).
In order to identify and characterize the Pleistocene and Eocene aquifers, hydrogeochemical and geoelectrical measurements were taken in this study. The second goal was to examine groundwater potential for agricultural and household use.

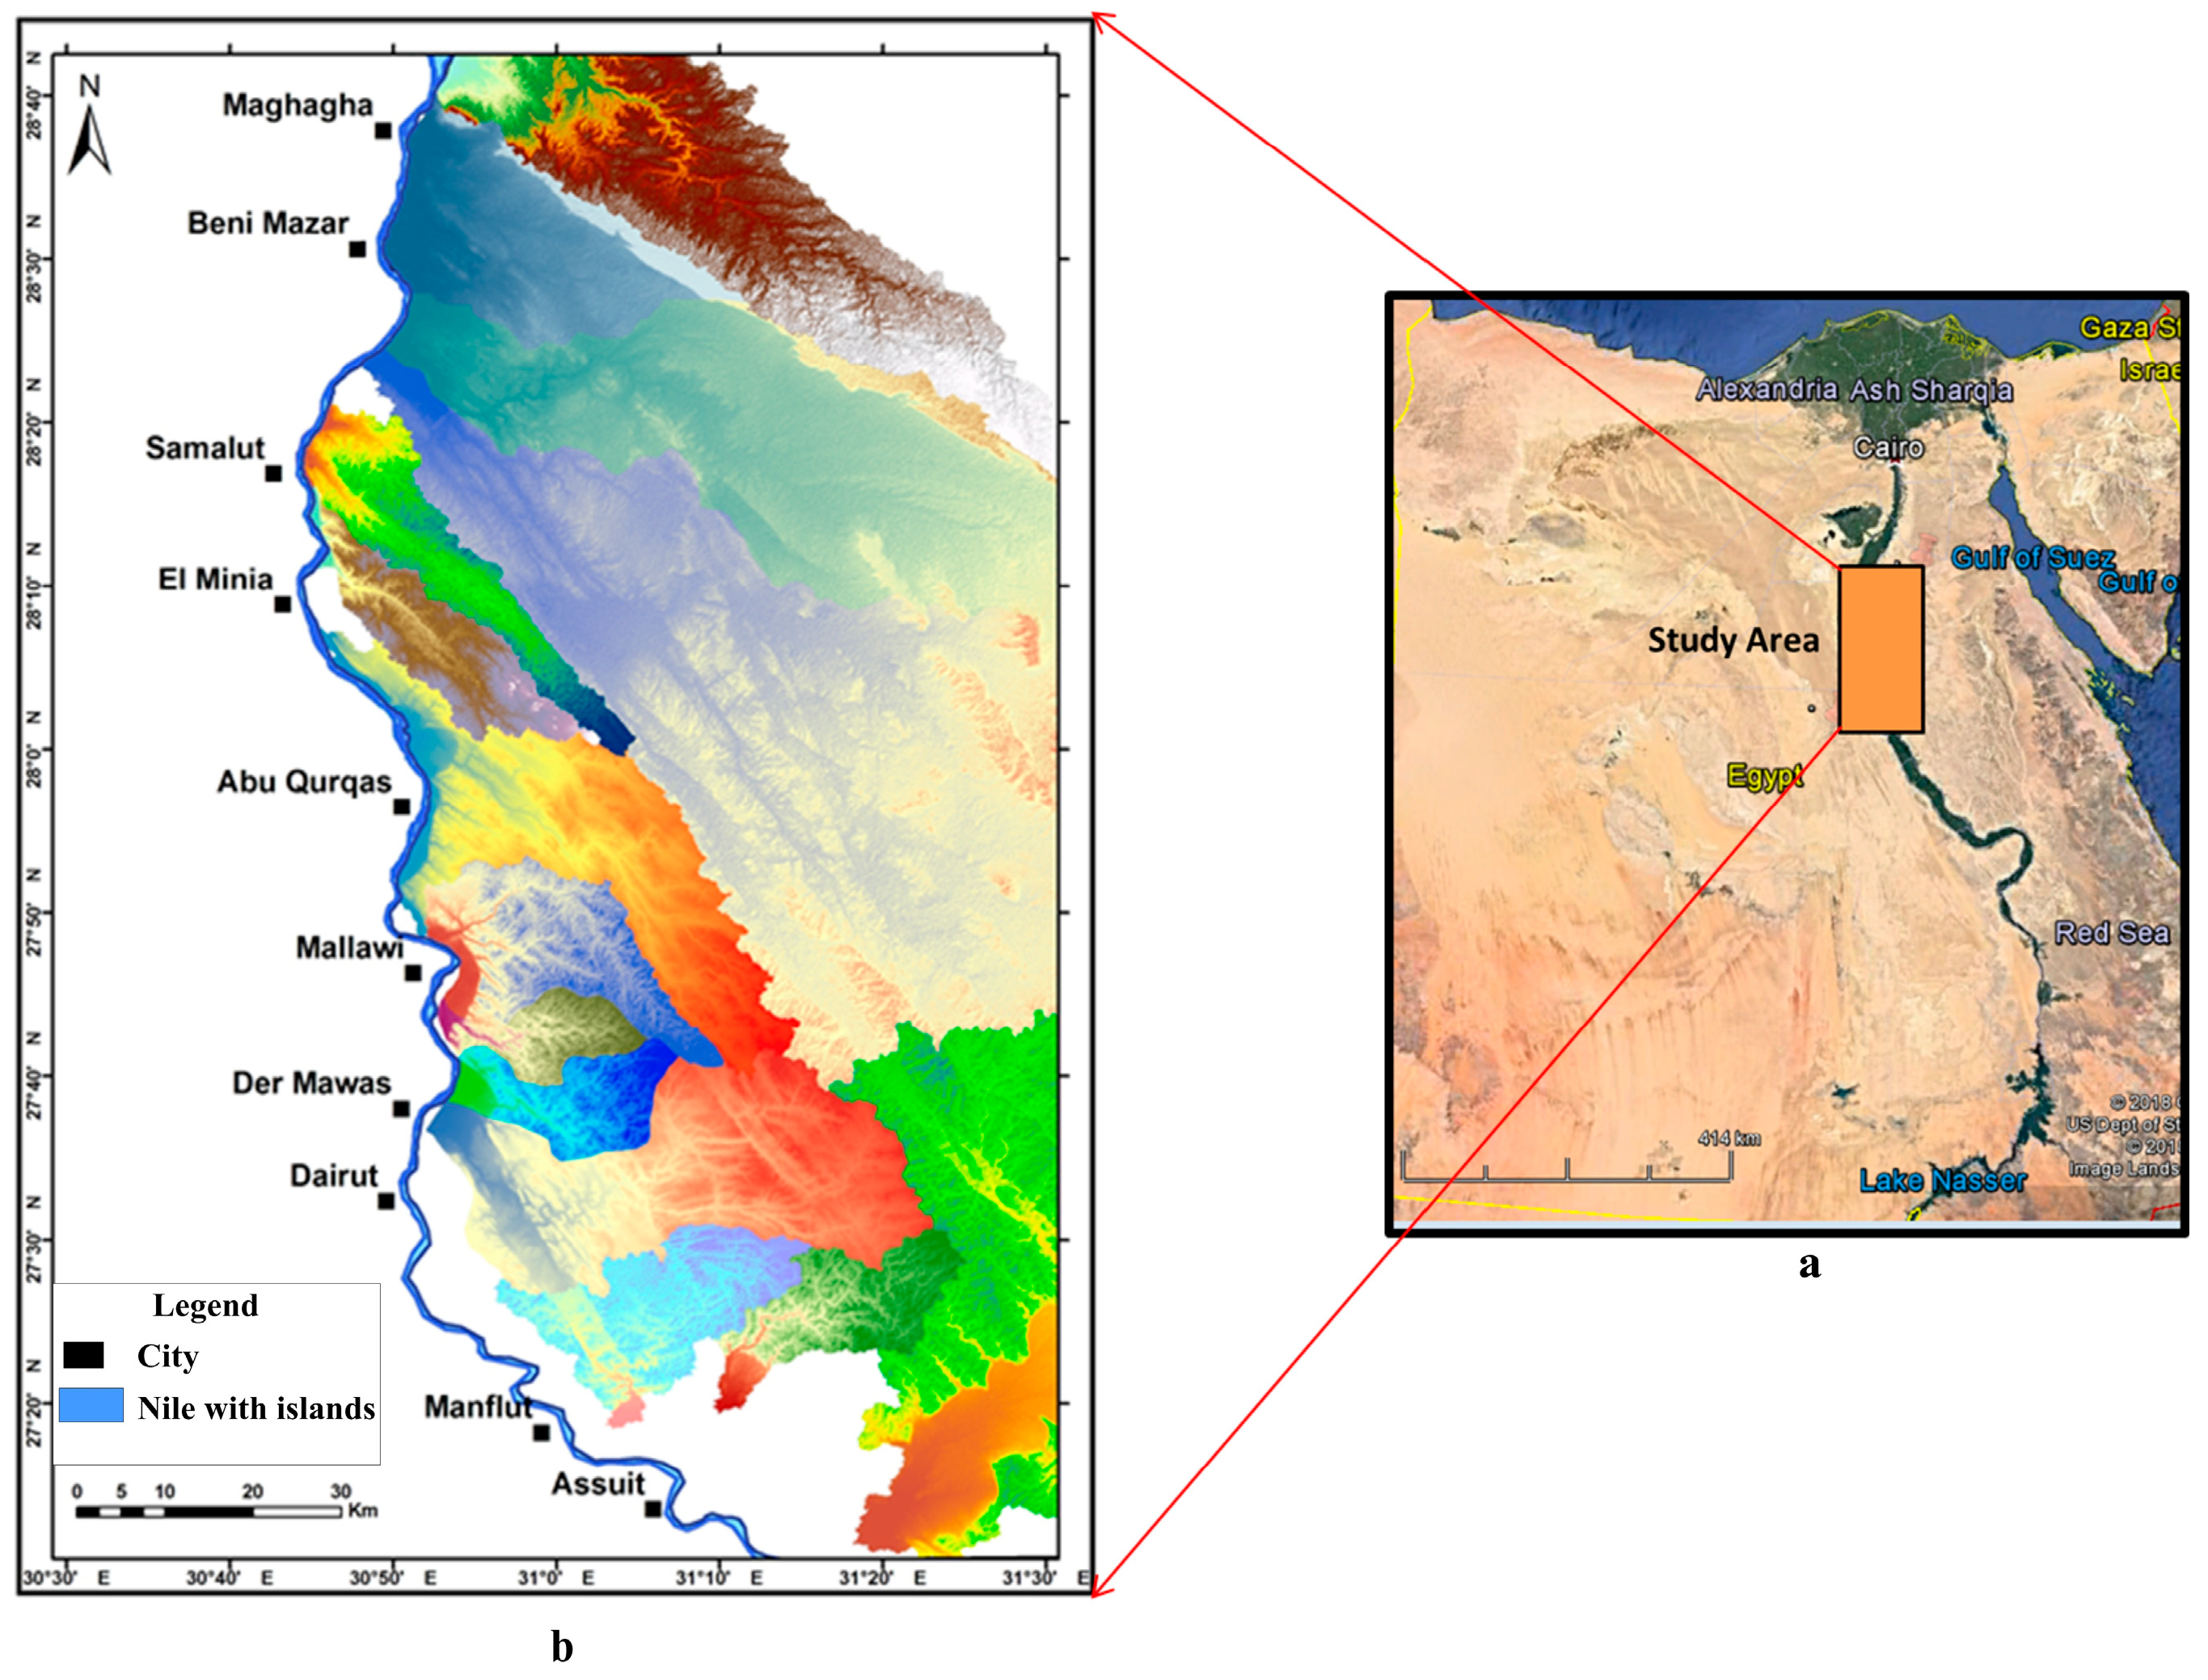
2. Geological Settings

The study of the area’s surface and subsurface geology is essential for understanding the water potentiality, water migration through various aquifers, and hydrogeologic configuration in terms of aquifer characteristics and leaching processes. Generally, a sedimentary succession dating from the Eocene to the Holocene dominates the studied area. The geological succession in the study area is mainly built of the following rock units from the bottom to the top: (a) Eocene rocks: the Eocene deposits are shales, limestone, chalky limestone, and argillaceous limestone. These rocks are the oldest units cropping out in the study area [30]; (b) Oligocene rocks: the Oligocene rocks are represented by different basaltic flows, which are mainly restricted to the Alawy El-Zurq and Lessan El-Baqara [31]; and (c) Pliocene deposits comprise an upper fluviatile sequence from the late Pliocene and a lower marine sequence from the early Pliocene. The lower marine sequence may cause salinization for the wells tapping it, while the fluviatile sequence is a freshwater-bearing formation [32]. The Pliocene deposits were reported from several deep wells [33].
The Pleistocene deposits are a thick succession that unconformably overlies the Nile Valley’s Pliocene or older deposits and the surrounding deserts and underlies the Holocene Nile silts. The Pleistocene sediments are generally friable, highly porous, and permeable. The produced water of the Pleistocene aquifer is extracted from the Qena Formation (which acts as the Nile Valley’s primary groundwater aquifer).
A variety of unconsolidated sediments that formed under various environmental conditions make up the Holocene deposits. Dunes and Nile silts serve as representations of these deposits. The top layer of the old cultivated area in the floodplain comprises deposits of silt and clay called Nile silts. Their thickness ranges from location to location and gets thinner near the Nile Valley’s margins, where these deposits are laid out unevenly on top of the eroded surface of Pleistocene sediments. Dunes are composed of well-sorted loose quartz sand grains mixed with heavy minerals. In addition, these deposits cover the marginal areas adjacent to the western portion of the cultivated land.
The groundwater of the Pleistocene aquifer occurs under free conditions in major parts of the study area, except in some localities near the Nile River he groundwater is present under unconfined to semi-confined conditions, where it is overlain by Holocene silt clay. The possible recharge of the Pleistocene aquifer in the area under study occurs from upward leakage of underlying Eocene aquifer and surface runoff due to flash floods, while the discharge occurs through pumping wells used mainly for irrigation. The water of the Eocene aquifer occurs under unconfined conditions where the permeable Quaternary sediments overlie it. The possible recharge of the Eocene aquifer may occur from the direct recharge by downward seepage through percolation of the atmospheric precipitation and the occasional flood flashes and direct recharge from the percolation of irrigation water and the lateral seepage of the overlying younger aquifers. The discharge of this aquifer mainly occurs through the pumping wells for irrigation purposes, as well as the seepage towards the Nile River through the fractures.

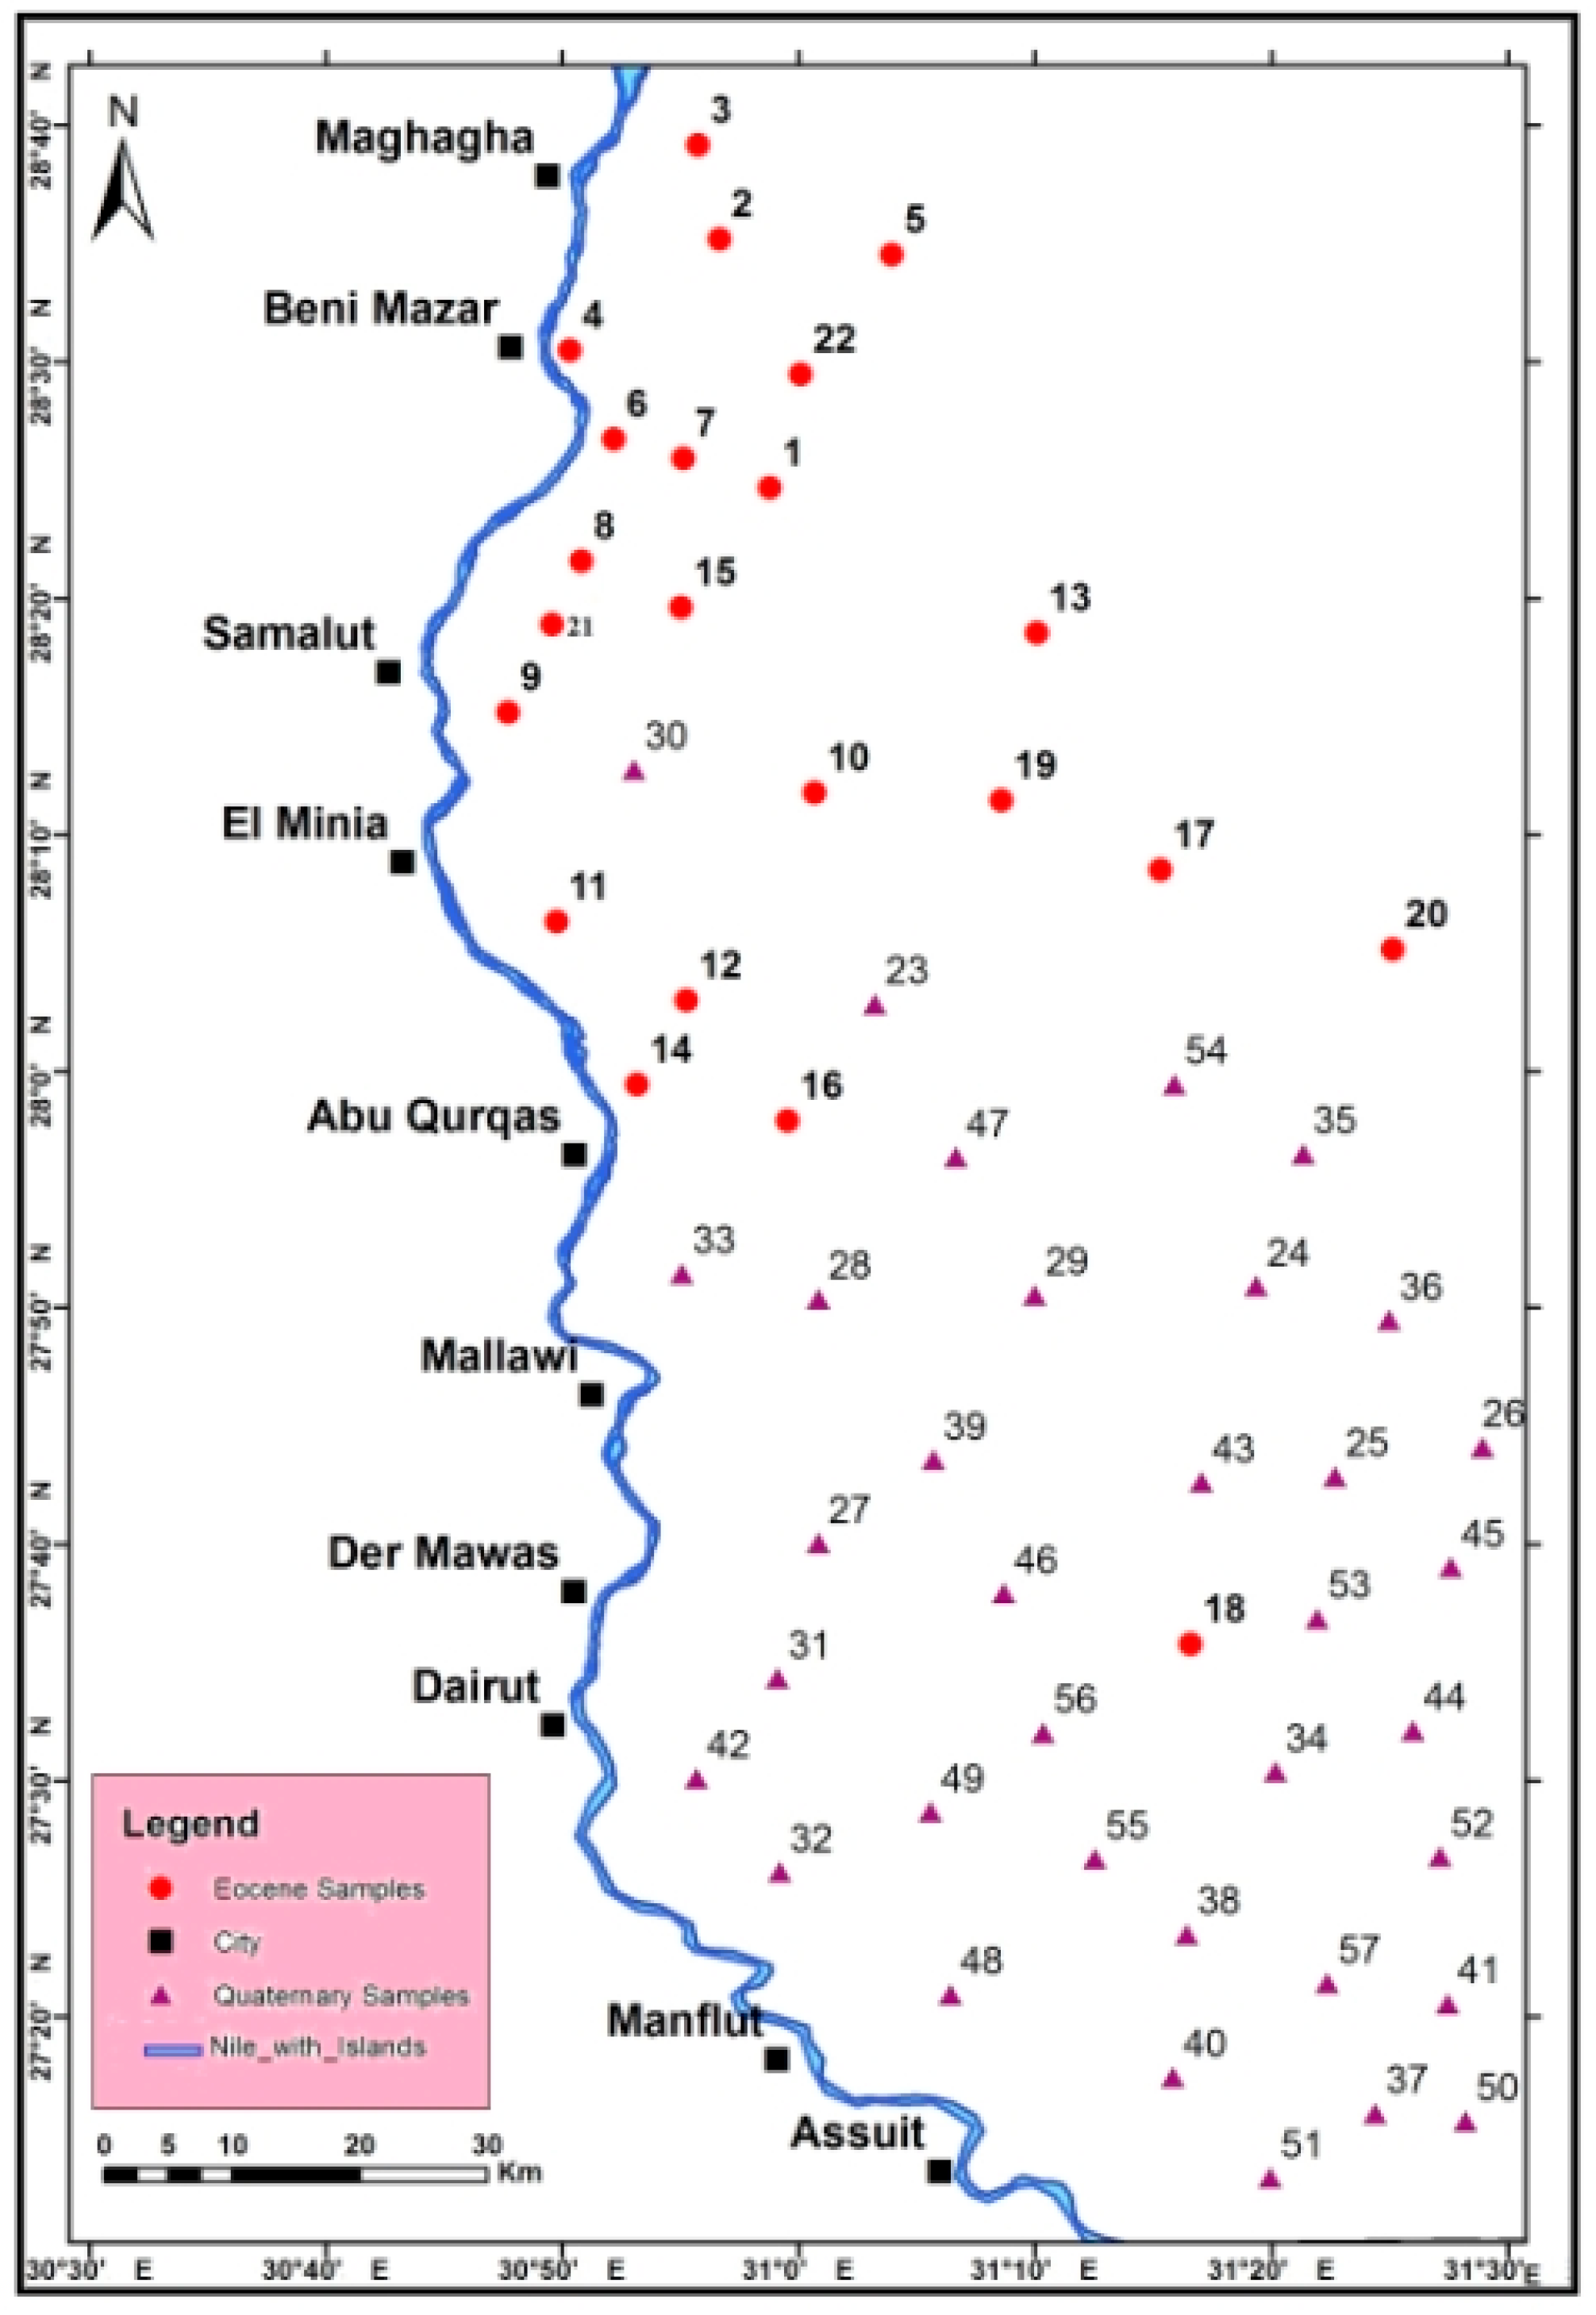
3. Materials and Methods

In the area studied, 57 groundwater samples (22 from the Eocene aquifer and 35 from the Pleistocene aquifer) were collected in 2020 (Figure 2). The coordinates and the ground elevation of the studied water points were noted using the GPS (Global Positioning System). After an hour of pumping, water samples were collected from the pumps and put into plastic bottles that had already been cleaned. With the assistance of the well owners, the depth to the water table, the total depth of drilling wells, and the groundwater level were all recorded for each point where samples were taken. Water table and water level contour maps were constructed by using ARC-GIS software program version 10.3 to interpret the water flow. After sampling, the Ultrameter SM101 equipment was used to test temperature, electrical conductivity (EC), total dissolved solids (TDS), pH, and TDS. At the Ministry of Agriculture Laboratories in El-Minia Governorate, Egypt, all of the chemical analyses of the collected samples were carried out using the methods recommended by the American Public Health Association. Volumetric titration was used to test magnesium (Mg2+), calcium (Ca2+), and bicarbonate (HCO3); a flame photometer was used to detect chloride (Cl), potassium (K+), and sodium (Na+); and a UV spectrophotometer was used to assess sulphate (SO42−). Several indices were applied to evaluate the suitability of groundwater in the study area for drinking and irrigation uses. The outcomes were contrasted with drinking water quality guidelines set by the WHO (World Health Organization). The equations in Table 1 were used to determine EC, Na%, SAR, RSC, MH, KR, and PI from the correlation of analytical data by projecting several graphical representations [34,35,36,37]. The classification of the groundwater quality for different uses was established. Twenty-four vertical electrical sounds were measured. The Schlumberger setup method and a Syscal-Pro instrument were used to obtain these VES, with the measuring process’ current spacing varying between 300 and 1000 m. For each VES profile, a distance between the potential electrodes of 0.5 m to 50 m was gradually increased. Three inversion programs (ATO by Zohdy [38], RESIST by Velpen and Resist [39] and RESIXP by Davis et al. [40]) were used to interpret the electrical data. The lithological information constrained the starting models for these programs from the drilled wells, including the thickness and resistivity of each lithologic layer in the study area.

4. Results and Discussion

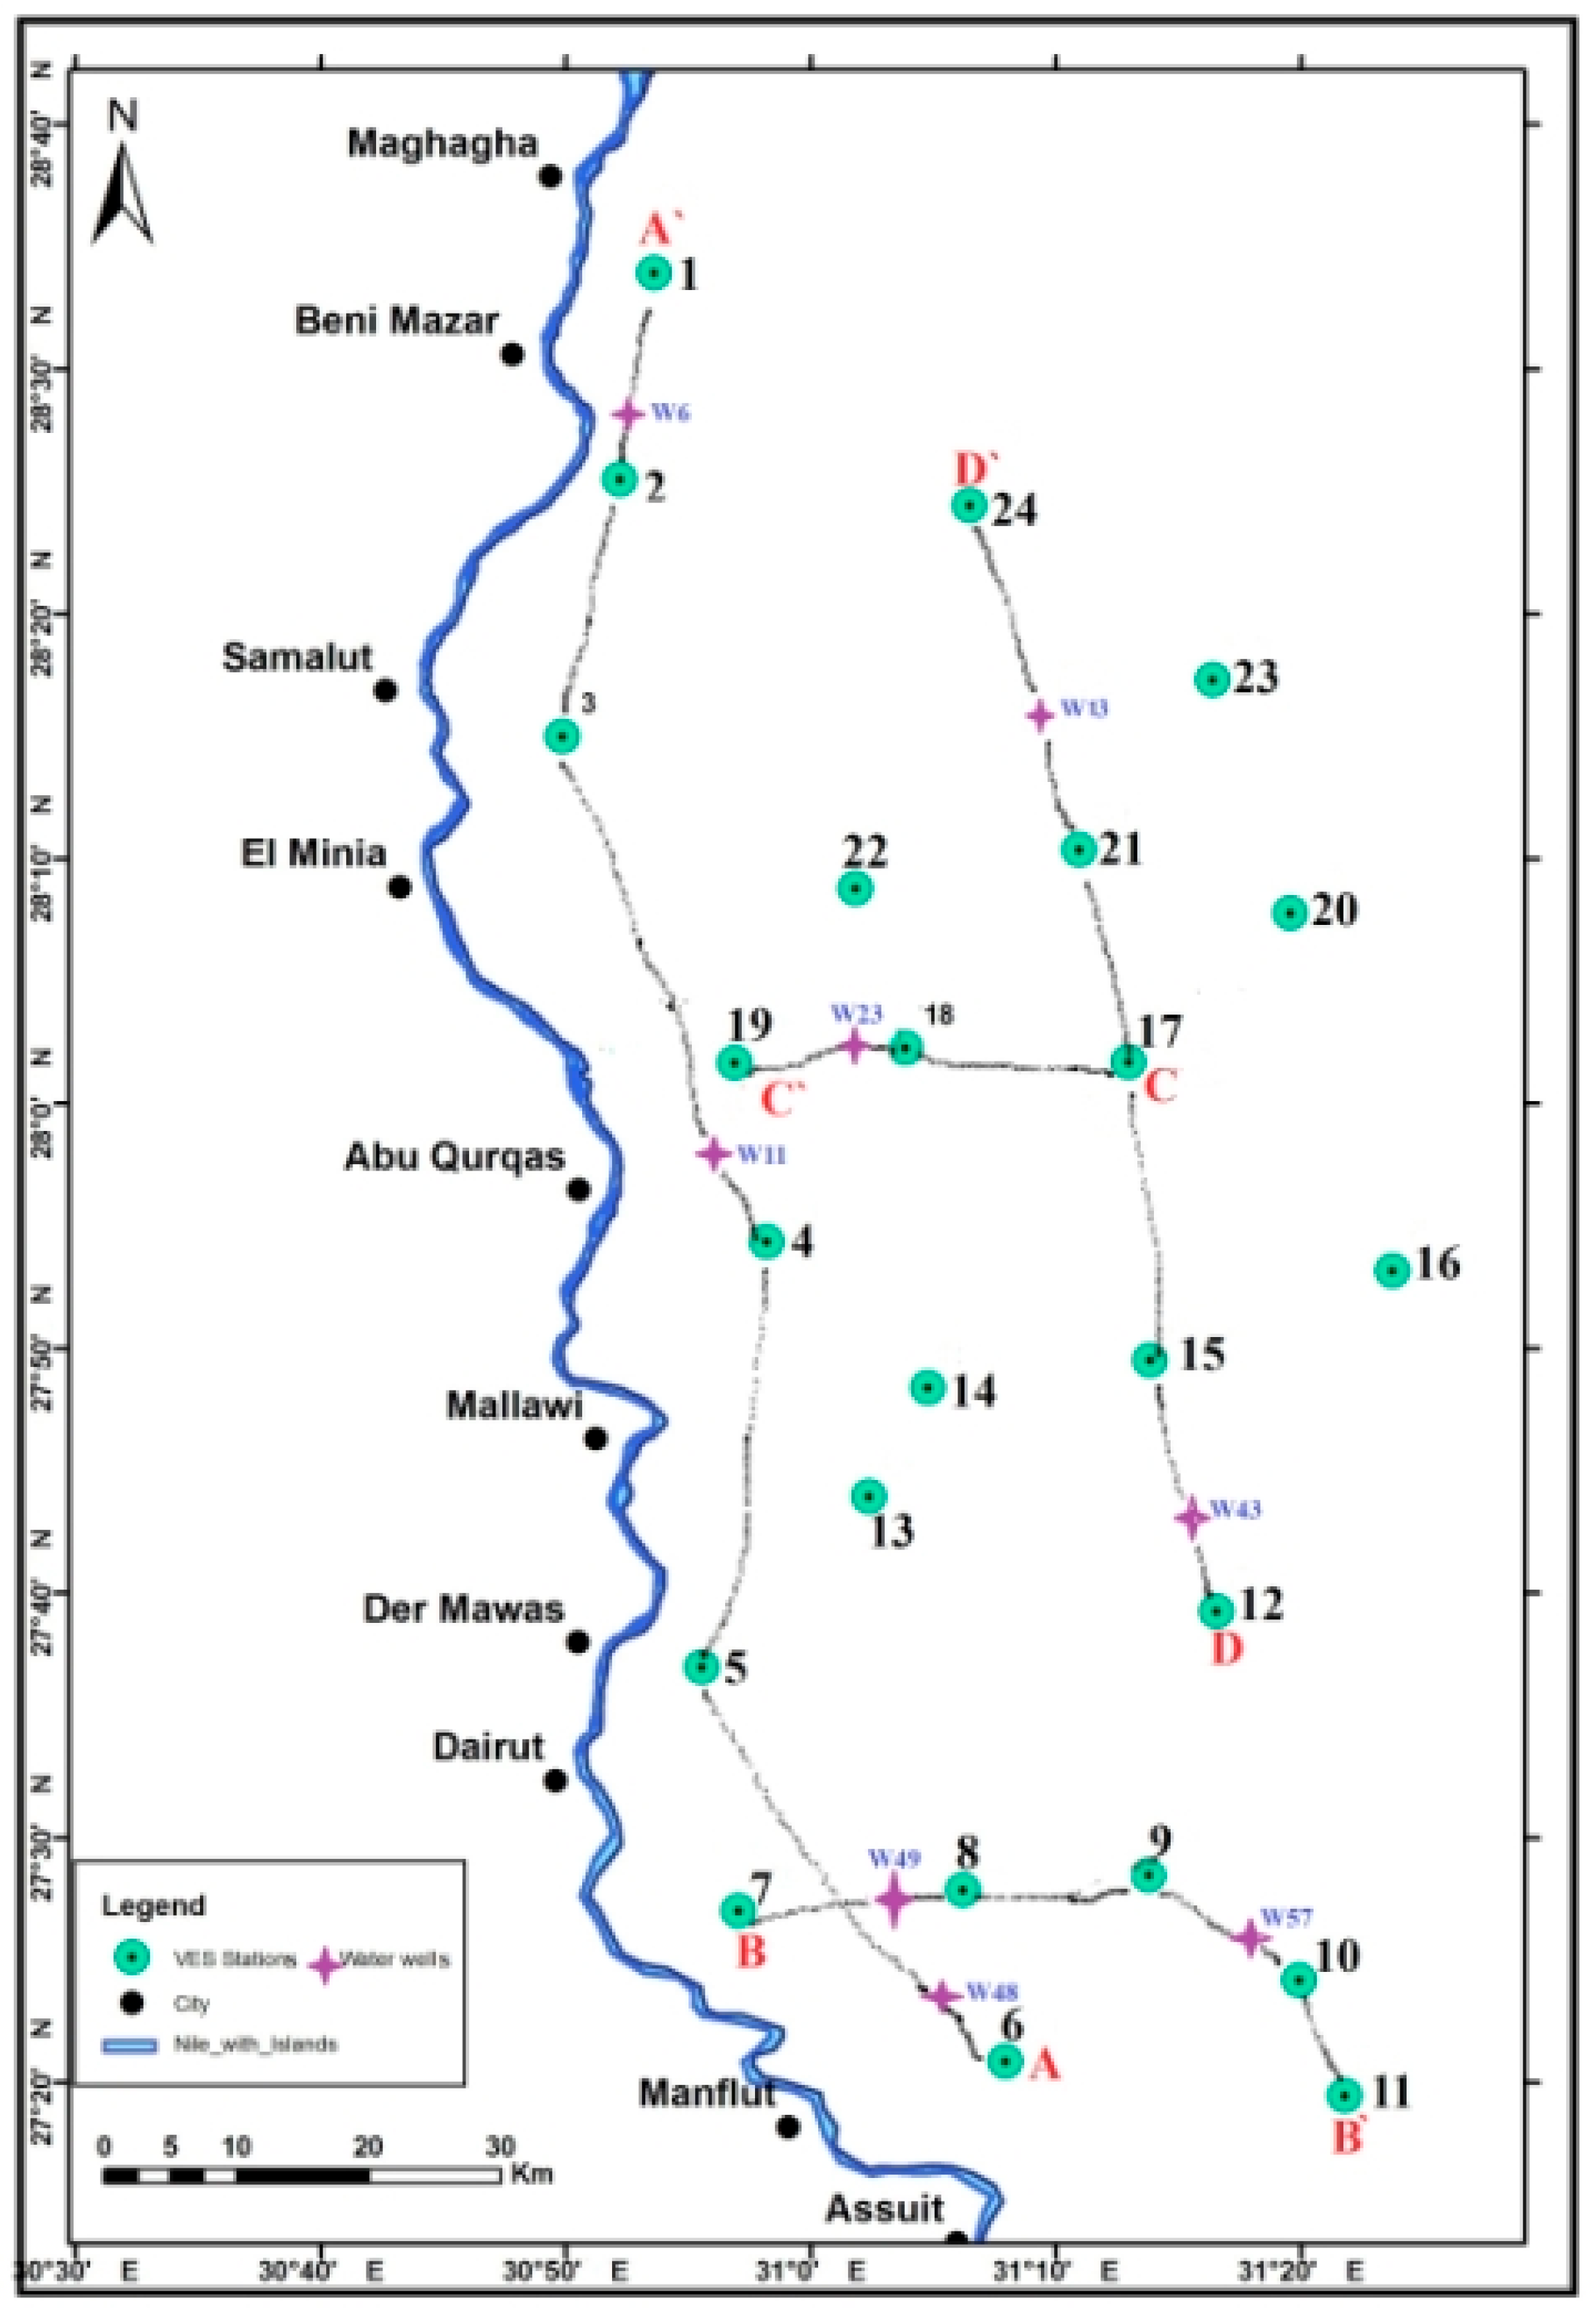
4.1. Electrical Resistivity Studies

Using the interpreted resistivity data, four geoelectrical cross-sections were created (Figure 3). These sections have been constructed to reflect the underlying arrangement in terms of each layer’s type, thickness, and depth.

4.1.1. Geoelectrical Cross-Section A-A`

This section runs in a south–north direction (Figure 4), parallel to the Nile River from the eastern side, and consists mainly of four geoelectrical layers. The first geoelectrical layer extends to a depth of 10 m below the ground surface and displays resistivity ranges ranging from 4229 to 5171 Ohm.m. The second layer exhibits resistivity values varying between 52 and 113 Ohm.m. By comparing wells in the study area, such as well No. 6, 11, and 48, it can be seen that this layer’s thickness ranges from 2 to 68 m and is formed from sandy clay deposits. This layer is not recorded at VESs No. 3 and 4 as a result of the weathering process. The third layer of this geoelectrical cross-section is represented by dry limestone. It exhibits resistivity values varying from 1312 to 2617 Ohm.m. The thickness of this layer ranges from 22 to 170 m. The last geoelectrical layer of this section is characterized by resistivity values ranging between 613 and 889 Ohm.m and a thickness that reaches over 200 m. This layer is considered a water-bearing formation and is composed of limestone sediments of the Samault formation; it seems to be affected by fault action.

4.1.2. Geoelectrical Cross-Section B-B`

This section runs perpendicular to the mouth of Wadi El-Omrani, Wadi El-Ibrahimi, and Wadi El-Assuiti. Five geoelectrical layers were recorded in this section (Figure 5). Nile silt and clay make up the top layer, which ranges in thickness from 2 to 26 m and resistivity from 450 to 6000 Ohm.m. The thickness of the second layer is between 10 and 152 m, and the resistivity ranges from 15 to 32 Ohm.m. This layer was removed entirely by the effect of weathering in the eastern part of this section under VES stations No. 10 and 11. Sand and clay deposits make up the third layer in the cross-section, and the estimated resistivity values range from 50 to 82 Ohm.m. This layer ranges in thickness from 25 to 33 m. This layer is also, entirely removed by the effect of weathering in the eastern part of this section under VES stations No. 10 and 11. The resistivity of the fourth layer ranges from 1222 to 3000 Ohm.m, and the thickness ranges between 75 and 95 m. It is composed of dry limestone. The Eocene aquifer is represented by the last layer, which has a predicted thickness of more than 200 m and resistivity ranges from 613 to 820 Ohm.m.

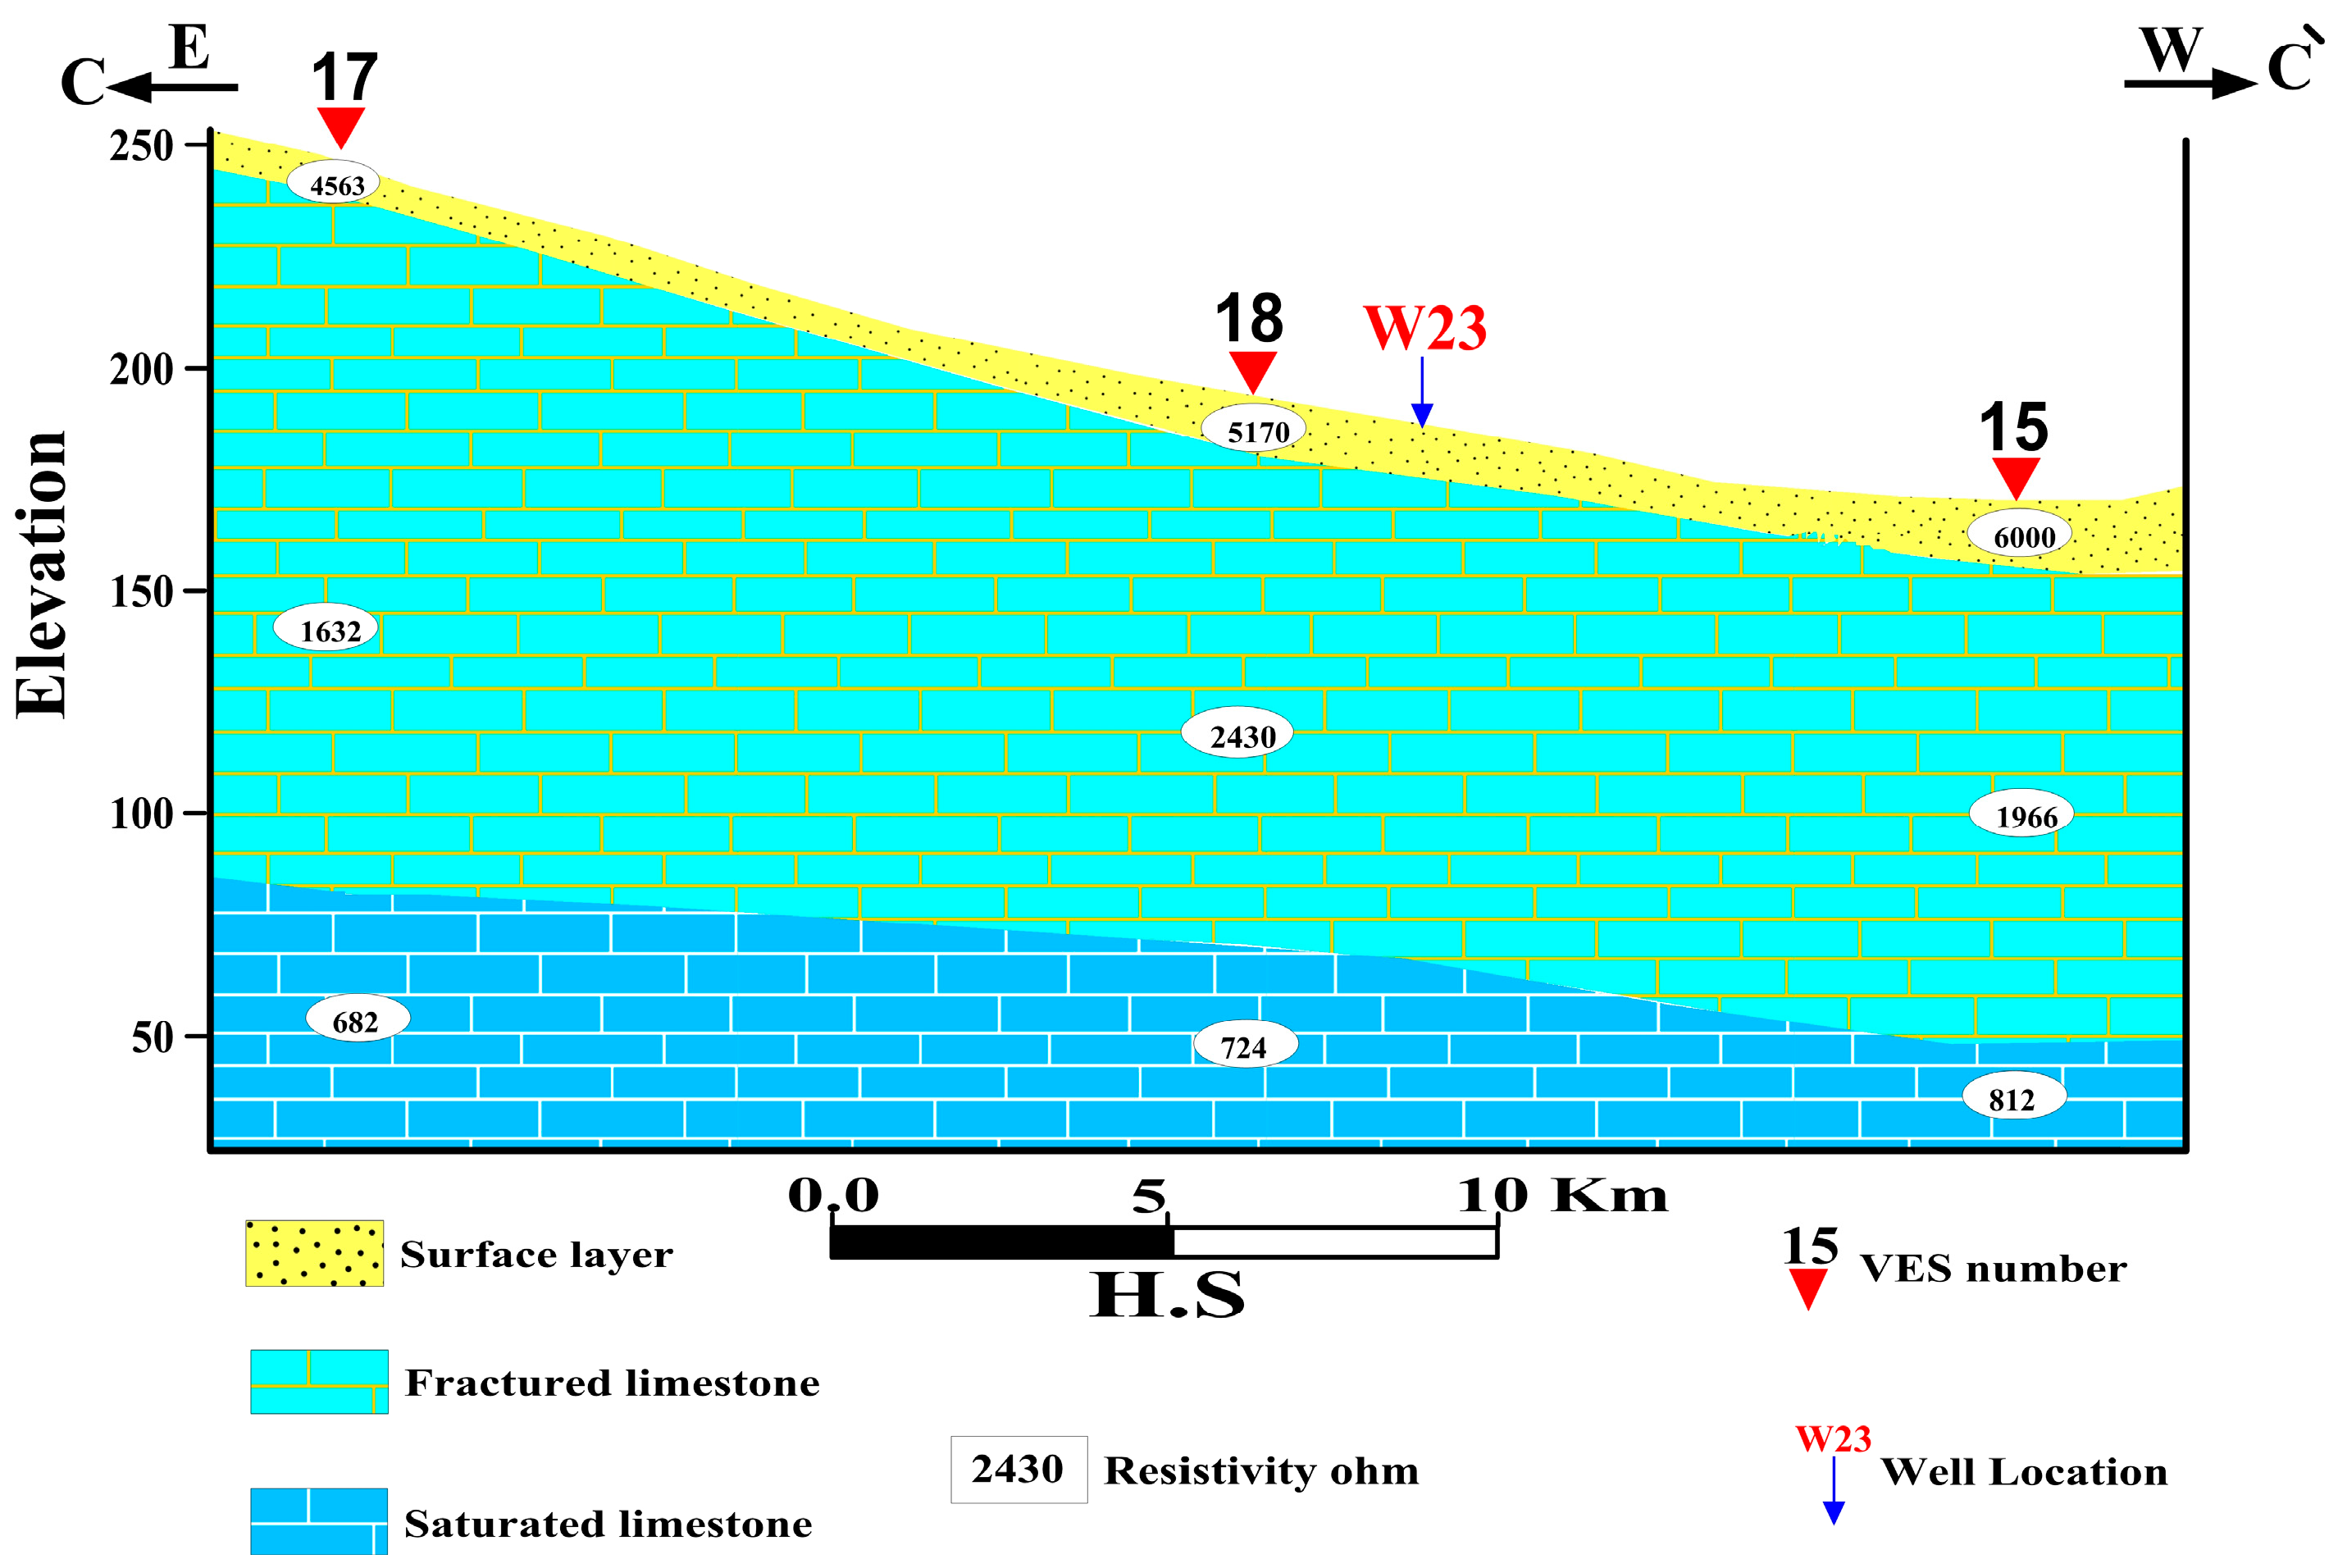
4.1.3. Geoelectrical Cross-Section C-C`

This section runs in the E–W direction and the rock succession of this section consists of three layers (Figure 6). The surface layer consists of Nile silt and clay, ranges in resistivity from 4563 to 6000 Ohm.m, and has thickness ranges between 17 and 35 m. Dry limestone is represented in the second layer, with resistivity ranging from 1632 to 2430 Ohm.m. The thickness of this layer is relatively large; it varies between 103 and 157 m. The Eocene aquifer is represented in the last layer; its calculated thickness exceeds 200 m and resistivity ranges from 682 to 812 Ohm.

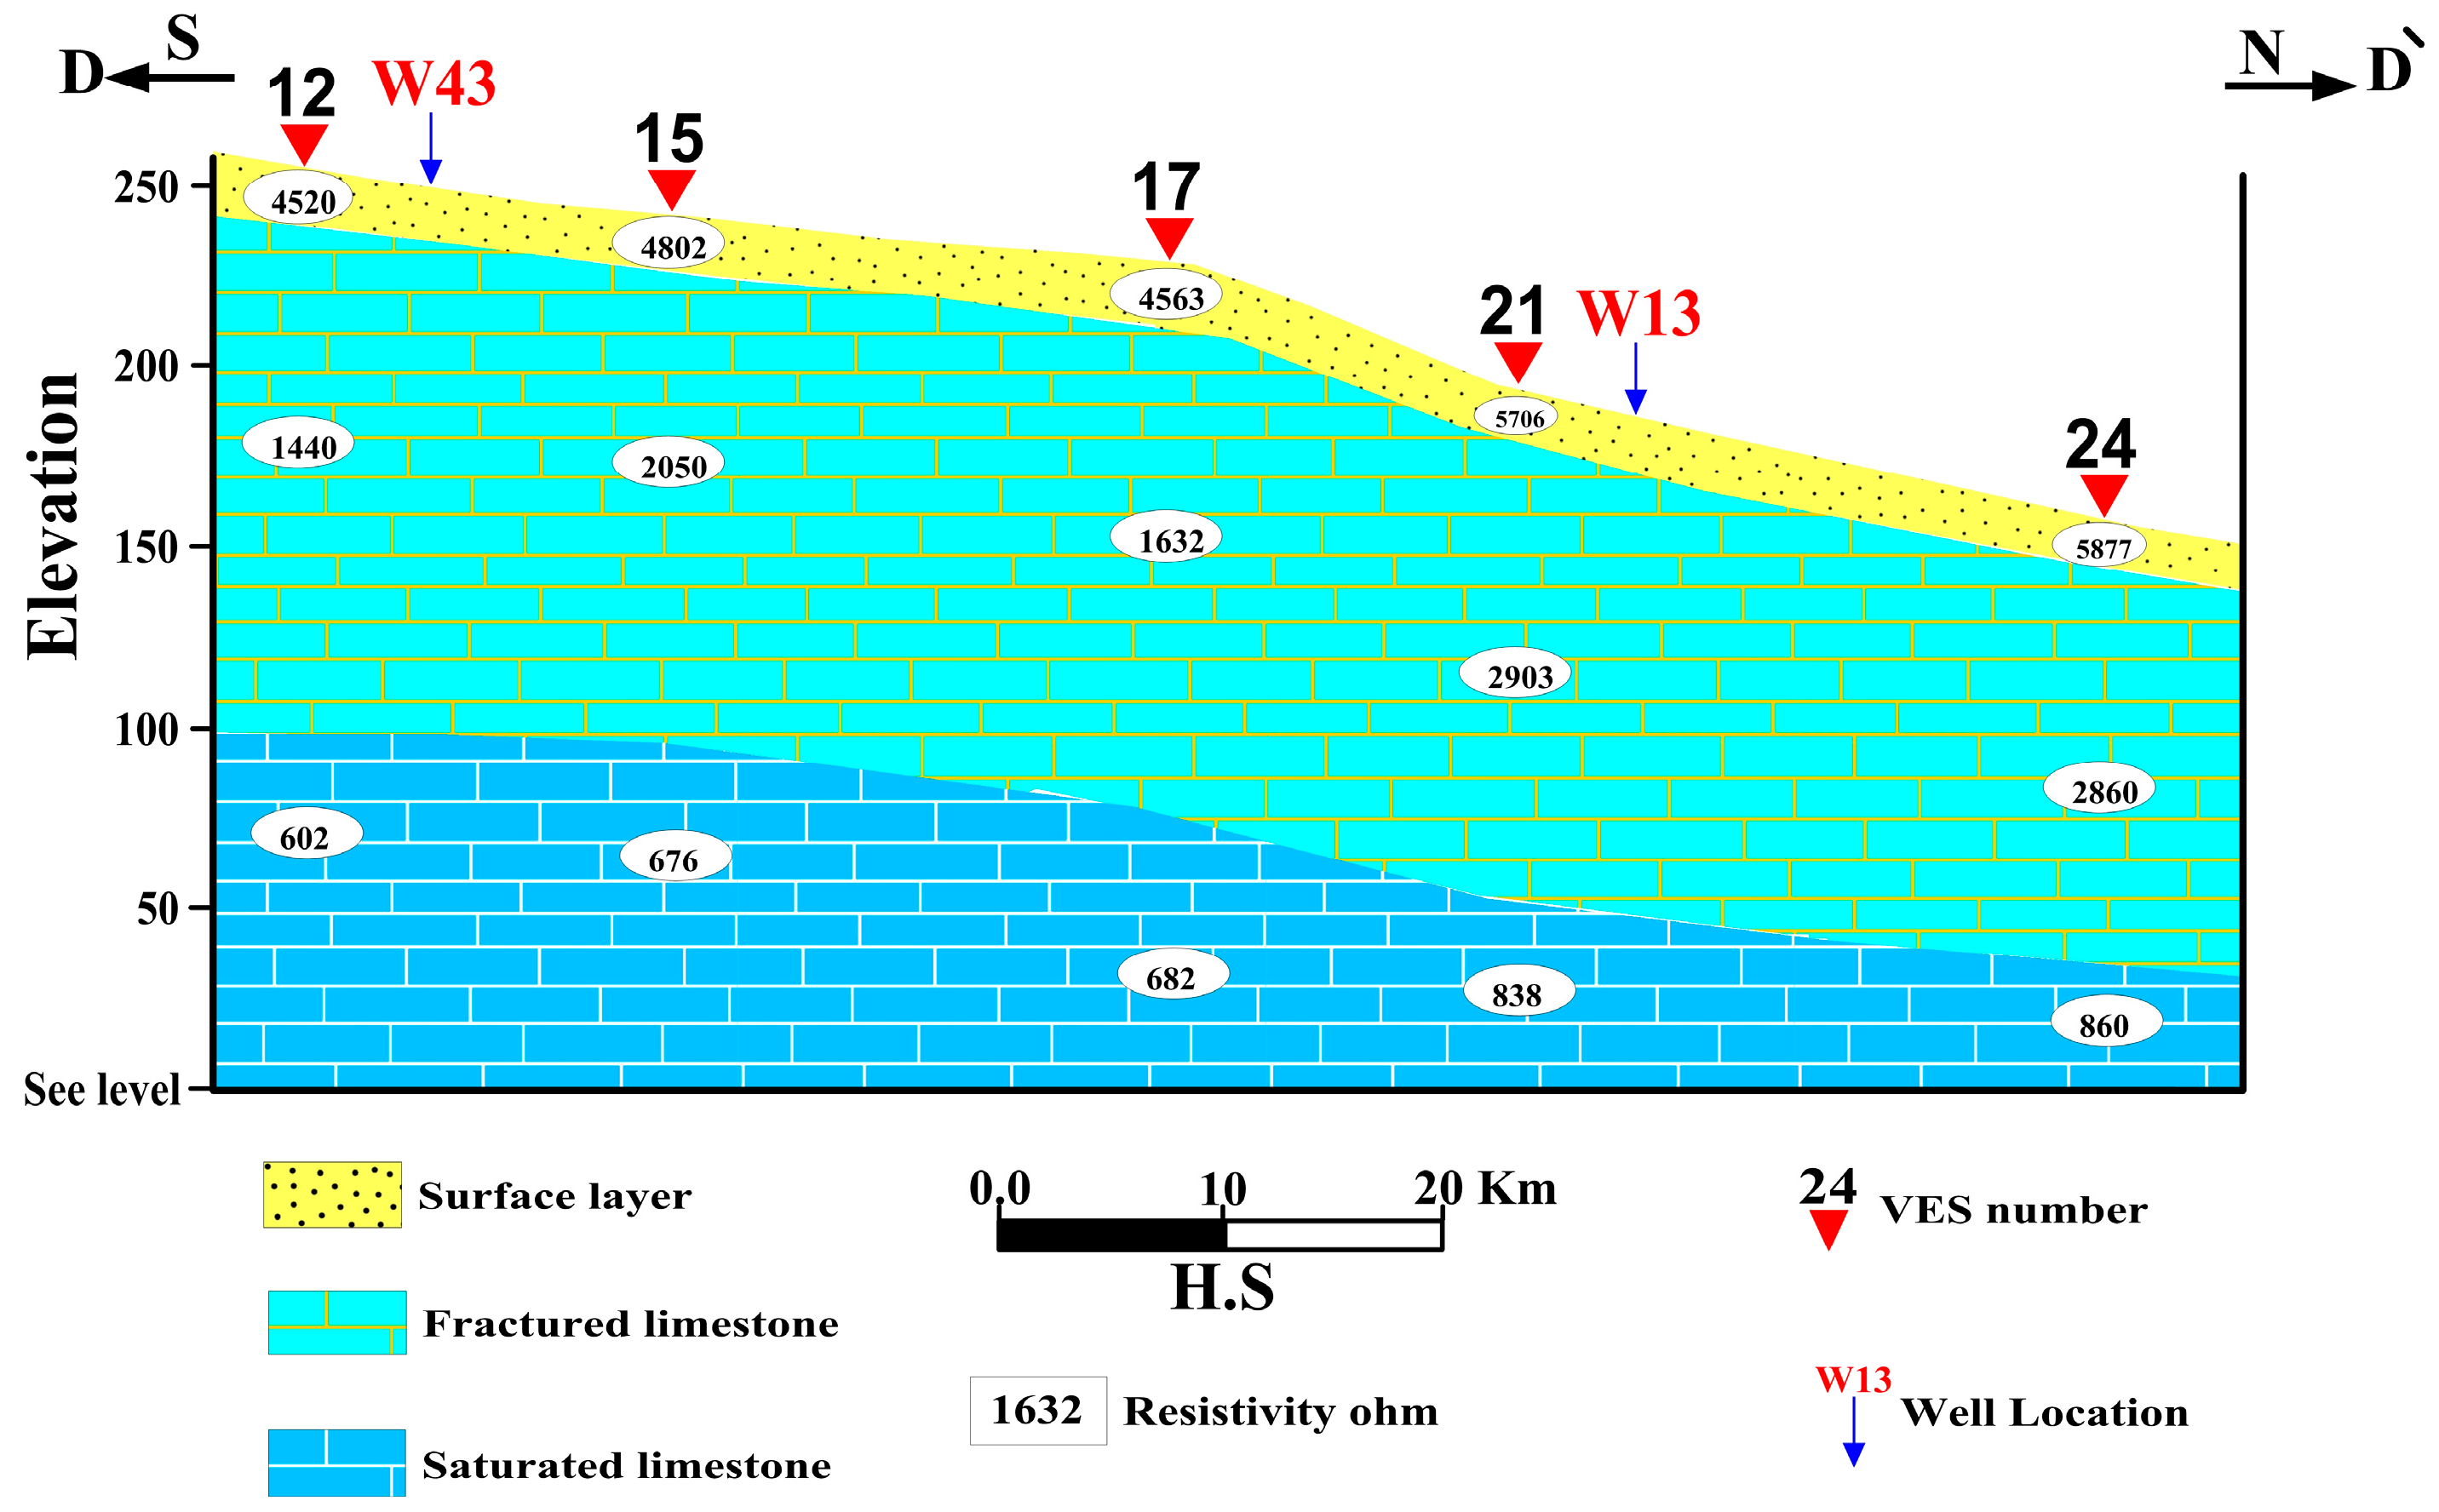
4.1.4. Geoelectrical Cross-Section D-D`

This cross-section runs in the S-N direction. It includes VES stations No. 12, 15, 17, 21, 24, and wells No. 13 and 43 (Figure 7). Three geoelectrical layers can be recognized in this section, the first one ranging in thickness from 5 to 21 m and resistivity from 4520 to 5877 Ohm.m. The second one has resistivity varying from 1440 to 2903 Ohm.m and thickness varying between 115 and 157 m, and is composed of dry limestone. The Eocene aquifer is represented by the last layer, which is formed of marly limestone. The thickness of marly limestone exceeds 250 m and its resistivity ranges from 602 to 860 Ohm.m.

4.2. Groundwater Level

The depth of water of the Pleistocene and Eocene aquifer in the study area ranges from 18.5 to 93 m and 15 and 91 m, respectively. The water level varies between 8.6 and 74 m for the Pleistocene aquifer and 18.5 and 175 m for the Eocene aquifer. The study area’s groundwater flow mainly occurs in topographically low directions, such as west and north towards the Nile River (Figure 8a,b).

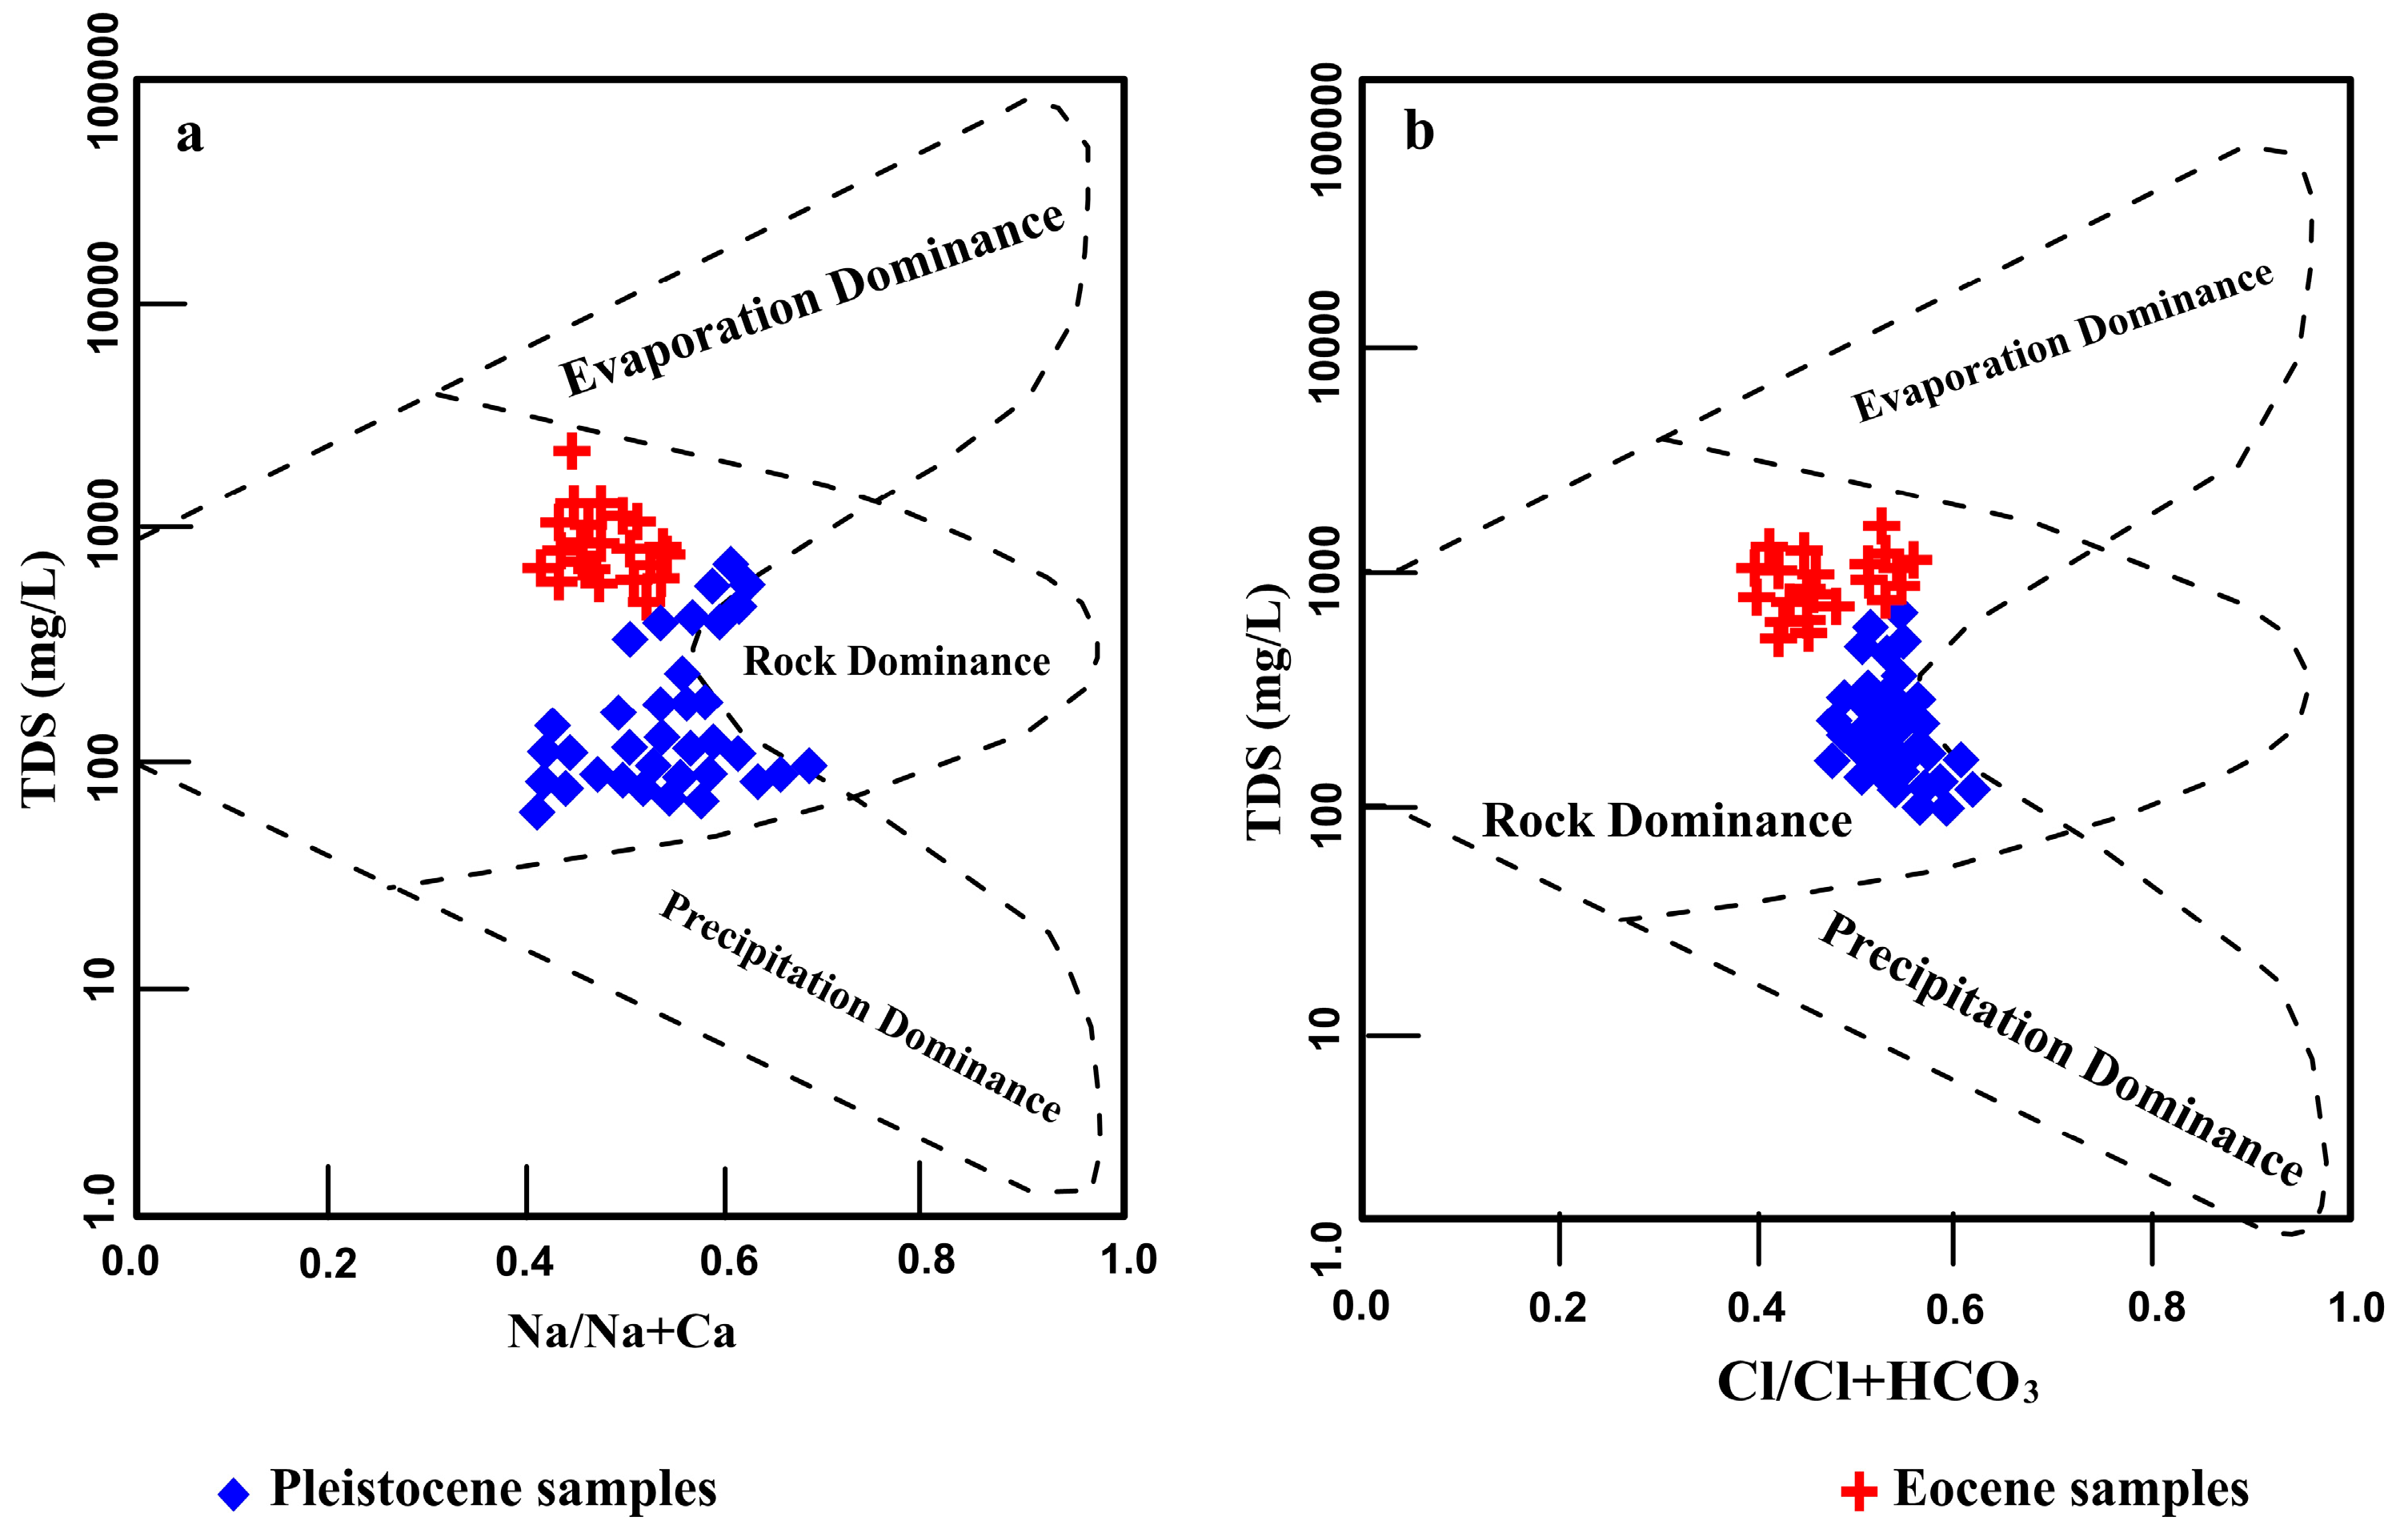
4.3. Hydrogeochemical Properties of Groundwater

The measured pH values of the water of the Pleistocene aquifer range from 7.74 and 8.60, with an average of 8.18, while in the Eocene aquifer, pH in water samples vary between 7.84 and 8.20, with an average of 7.98. All the pH values of the water samples of the two aquifers indicate a slightly alkaline media (natural groundwater). The collected Pleistocene water samples presented EC values that vary between 1230 and 9659 micro-mhos, averaging 3135 micro-mhos. The EC values of the Eocene water samples vary between 600 and 2200 micro-mhos, with an average of 1253 micro-mhos. In the study area, the collected samples of Pleistocene water have salinities varying between 787 and 6182 mg/L, with an average of 2006 mg/L. Leaching processes, the effect of direct surface evaporation through irrigation water before penetration to the aquifer, and the heavy pumping of groundwater from the aquifer are the driving forces of the high water salinity. In the collected water samples of the Eocene wells, TDS values ranging from 384 to 1408 mg/L, with an average of 802 mg/L, were measured. The high TDS values of some Eocene wells can be attributed to the dissolution of salts such as halite and gypsum. According to Hem [46], 6% of the Pleistocene wells and 82% of the Eocene wells show TDS values less than 1000 mg/L, reflecting the fresh category. A total of 83% of the Pleistocene wells and 18% of the Eocene wells are slightly saline. The rest of the Pleistocene samples (11%) are moderately saline.
Figure 9 shows the salinity zonation maps of the collected Pleistocene and Eocene samples, these maps indicate increased values in east, north, south, and central areas. Generally, the zonation maps show increases in salinity from west to east, reflecting the impact of limestone deposits being leached and dissolved by water and the fact that the eastern region is far from the Nile River (source of recharge).
The total hardness ranges from 260 to 2537 mg/L for the collected Pleistocene water samples, with an average of 770 mg/L, and varies between 101 and 716 mg/L for the collected Eocene water samples, with an average of 280 mg/L. According to Hem [46], the Pleistocene water samples and 95% of the Eocene water samples are very hard water, and the rest of the Eocene water samples (5%) are moderately hard water. The leaching and dissolution processes of Ca- and Mg-bearing deposits (limestone) are responsible for the high values of total hardness.
Sodium is the dominant cation and sulphate is the dominant anion in the water collected from Pleistocene aquifer. Na2SO4 and NaCl are the two main chemical water types identified in the Pleistocene wells. The presence of the Na2SO4 water type is attributed to the intensive application of fertilizers in the study area. In the Eocene water, sodium is the dominant cation, while the dominant anion is chloride, and the dominant chemical water type is NaCl. The sodium chloride water type reflects the ultimate phase of metasomatism and the impact of the dissolution of the marine Eocene rocks.
The Piper trilinear chart [34] was created to analyze a water’s origin and the source of its dissolved salts and to explain various processes that impact the characteristics of groundwater. Figure 10 illustrates how the Pleistocene and Eocene samples in the study area fall into two categories based on the chemical data of the obtained groundwater samples. Alkalies are more abundant than alkaline earth in the first category, and strong acids are more abundant than weak acids in the second category.
An evaluation of the functional sources of dissolved ions is performed by plotting samples in relation to the variation in the ratios of Na/(Na + Ca) and Cl/(Cl + HCO3) as functions of TDS. The collected groundwater wells were plotted on a Gibbs diagram (Figure 11). The Gibbs diagram shows that the groundwater quality is affected by the chemical weathering of rock-forming minerals through the dissolution of the aquifer materials.

4.4. Assessment of Water Quality for Domestic and Drinking Uses

The majority of the tested groundwater was tasteless, odorless, and colorless. All of the Eocene wells, with the exception of 5%, are suitable for drinking (TDS 1200 mg/L), in comparison with the guidelines of the WHO and the Egyptian maximum permissible limit, while 80 % of the Pleistocene are unsafe for drinking (TDS > 1200 mg/L), and the remaining 20 % are suitable. According to Sawyer and McCarthy [47], the collected Pleistocene water samples have total hardness values ranging from 260 to 770 mg/L, which are hard to very hard water, while the Eocene water samples have total hardness values ranging from 101 to 280 mg/L, which is moderate to hard water. This indicates that all the collected groundwater is unfit for domestic use. The increase in total hardness is attributed to the abundance of Ca+2 and Mg+2 within the aquifer material.

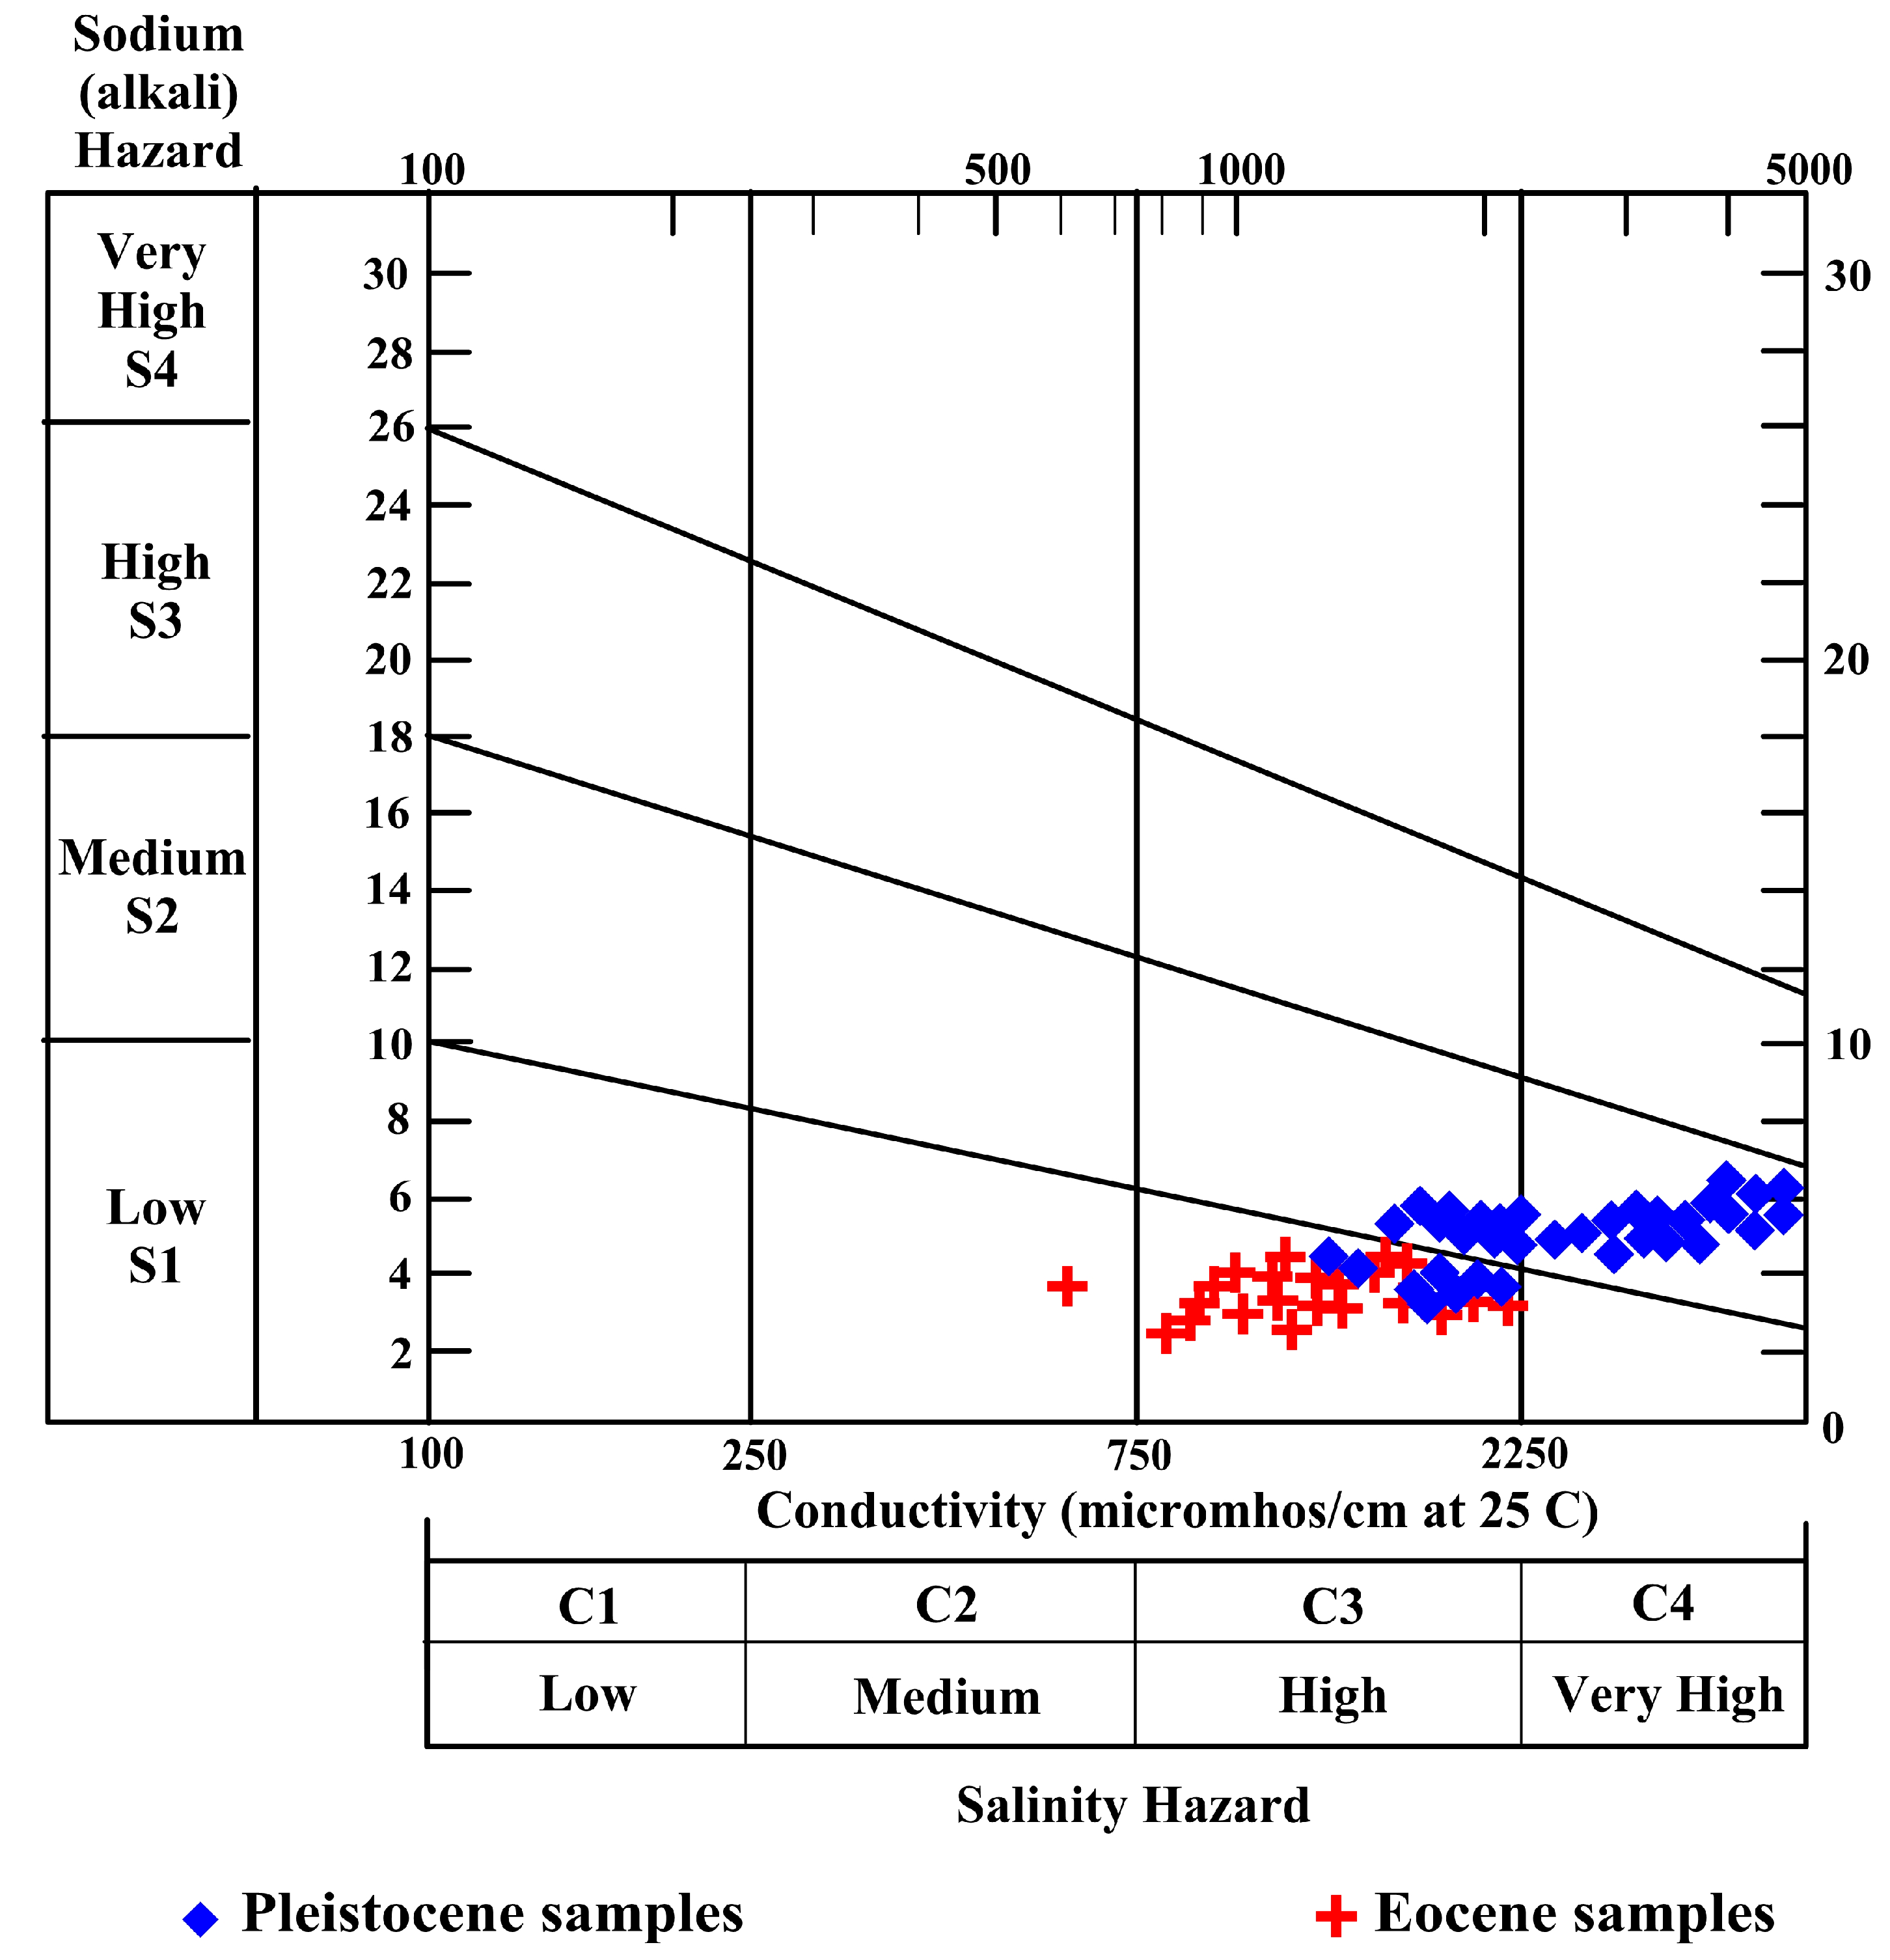
4.5. Evaluation of Water Quality for Irrigation

The evaluation of water for agriculture depends on the water’s quality, the soil’s composition, and the farming methods used. EC, Na%, SAR, RSC, KR, and PI parameters were used to determine the suitability of water for irrigation. Regarding the TDS, 5% of the Eocene water can be used for irrigation, while 95% of the Eocene and 54% of the Pleistocene wells can be used for irrigation with more problems. A total of 46% of the Pleistocene wells are not acceptable for irrigation.
According to Bauder et al. [48], 95% of the Eocene and 23% of the Pleistocene wells are acceptable for irrigation, while 77% of the Pleistocene and 5% of the Eocene are suitable for irrigation use (Table 2).
Based on Richards’ [35] classification, all the studied water samples show SAR values lower than 10 and fall into the “Excellent” water category for agriculture. The U.S. salinity laboratory staff used SAR and salinity hazards to assess irrigation water in 1954. Hence, the Eocene water is in class C3-S1, except for one sample located in class C2-S1 (Figure 12). Generally, this water is acceptable for irrigation. In the Pleistocene, 23% are in class C3-S1, 31% are in class C3-S2, which is acceptable for irrigation, and 46% are in class C4-S2, which is unsuitable for agriculture.

4.5.1. Sodium Hazard (Na%)

Figure 13 illustrates that 5% of the Eocene wells are categorized as excellent to good; 90% of the Eocene and 14% of the Pleistocene are categorized as good to permissible; 34% of the Pleistocene are categorized as permissible to doubtful; 5% of the Eocene and 29% of the Pleistocene are categorized as doubtful to unsuitable, while 23% of the Pleistocene are categorized as unacceptable for irrigation purposes.

4.5.2. Residual Sodium Carbonate (RSC)

RSC can be estimated by the formula introduced by Eaton [49] and Ragunath [50], as follows:
RSC = (CO3 + HCO3) − (Ca + Mg) (epm)
Water can be categorized as safe (1.25), slightly appropriate (1.25–2.5), or unsuitable (>2.5) based on the RSC values. A total of 3% of the collected Pleistocene water wells and 64% of the Eocene wells are acceptable for irrigation according to the data gathered (Table 3), whereas 97% of the Pleistocene and 36% of the Eocene wells are not.

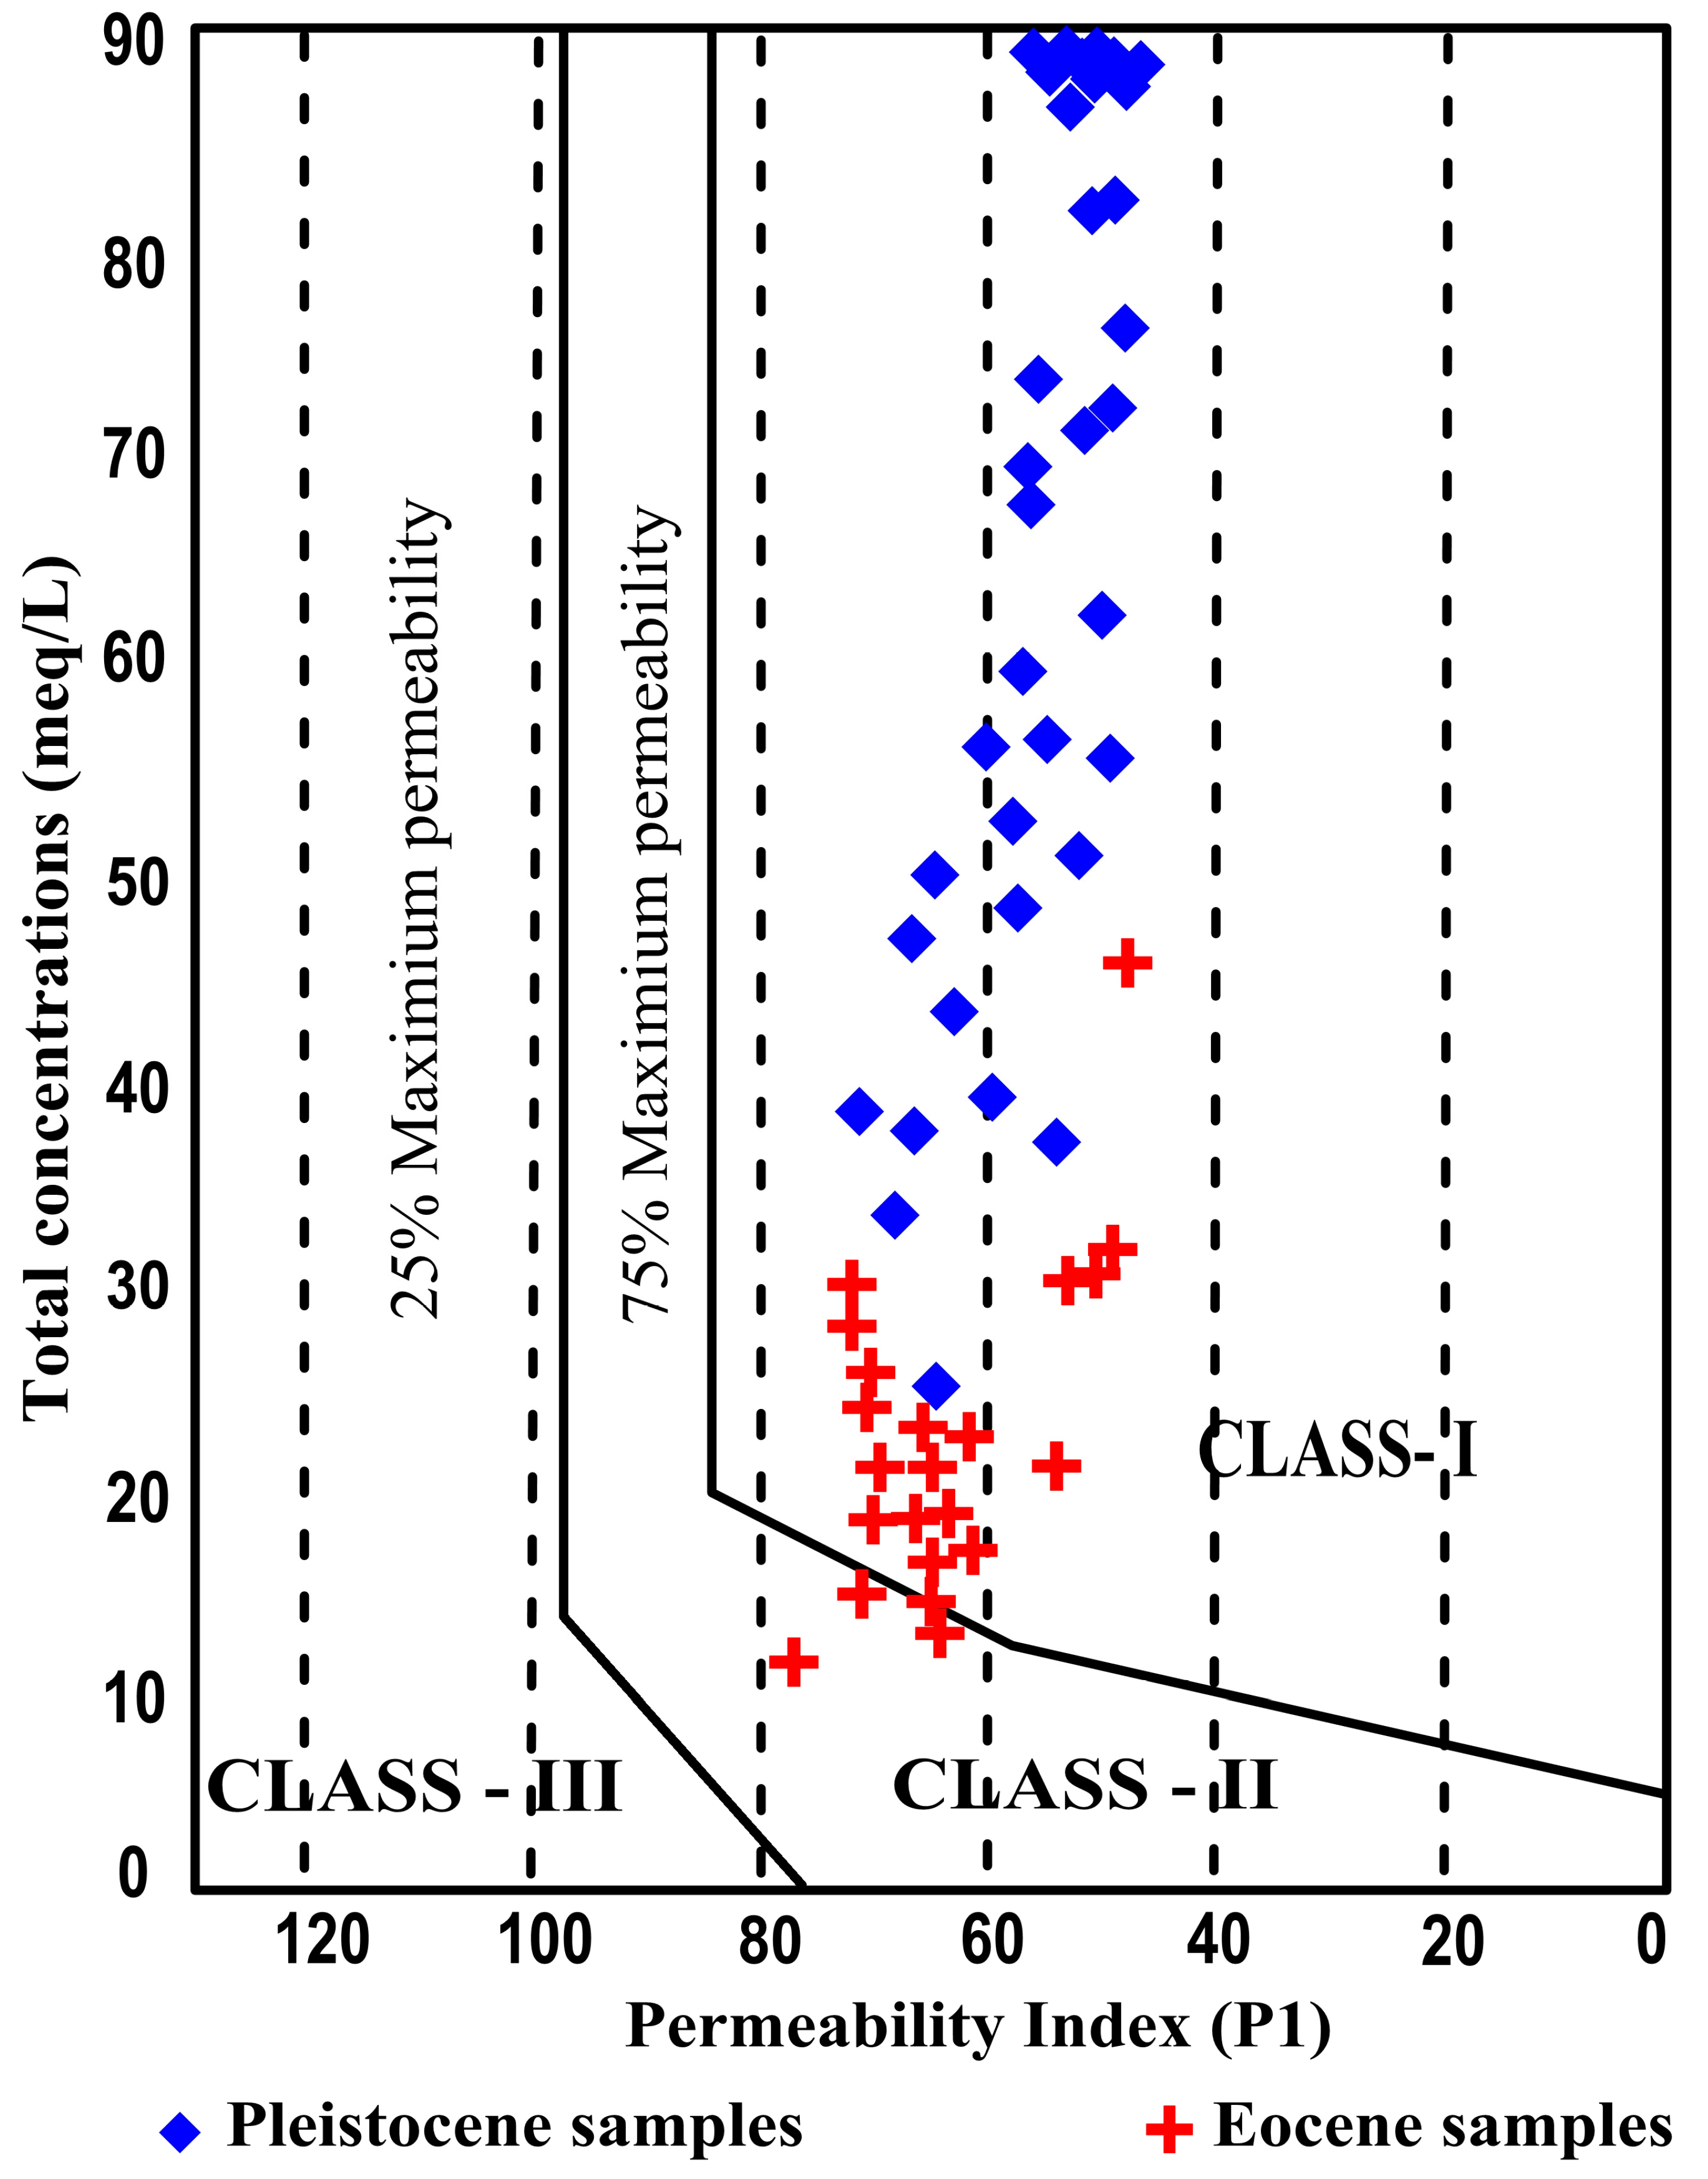
4.5.3. Permeability Index (PI)

Based on the PI values of Doneen’s chart [51] (Figure 14), the groundwater can be classified as classes 1 (Excellent > 75%), 2 (Good 25–75%), and 3 (<25% Unsuitable). All of the collected Pleistocene water samples and 82% of the Eocene water samples fall in class 1, while the rest (18%) of the Eocene water samples fall in class 2 (Table 4).

4.5.4. Kelly’s Ratio (KR)

According to Kelly [52] and Paliwal [53], who used sodium measured against Ca2+ and Mg2+ to calculate this parameter, 55% of Eocene and 69% of Pleistocene wells are suitable for irrigation, while 45% of Eocene and 31% of Pleistocene wells are unsuitable for irrigation.

4.5.5. Soluble Sodium Percentage (SSP)

According to Joshi et al. [43], SSP is the ratio of sodium to all cations multiplied by 100. The Soluble salt Percentage (SSP) is a crucial metric for analyzing the salt hazard in irrigation water quality assessments. SSP results (Table 5) show that 14% of the collected Eocene samples fall into the category of “Good”, while all Pleistocene samples and 86% of Eocene samples fall into the “Fair” category.

4.5.6. Potential Salinity (PS)

Doneen [54,55] described PS as the sum of the chloride and sulphate concentrations. Groundwater samples’ potential salinity was divided into: Excellent to Good (5), Good to Injurious (5–10), and Injurious to Unsatisfactory (>10). According to this classification (Table 6), 9% of the Eocene wells fall into the “Excellent to Good” category, 86% of the Eocene and 23% of the Pleistocene wells fall into the “Good to Injurious” category, and 5% of the Eocene and 77% of the Pleistocene wells fall into the “Injurious to Unsatisfactory” category.
Wilcox [37] categorized irrigation groundwater by integrating the electrical conductivity and sodium content. Based on this classification, 18% of the collected Eocene water is of the good type, while all of the Pleistocene and 82% of the Eocene samples are permissible.

5. Conclusions

Four geological formations of the study area are mentioned in the geoelectrical cross-sections that have been constructed. The first is made up of silt and clay from the Nile River, while the second is made up of sandy clay, which has a range of resistivity of 15 to 32 Ohm.m and a range of thickness of 2 to 68 m. Dry limestone makes up the third layer; its resistivity ranges from 1222 to 3000 Ohm.m and its thickness varies between 75 and 95 m. The Eocene aquifer in the area studied is represented by the final layer, which has a thickness of more than 250 m and resistivity values ranging from 602 to 860 Ohm.m. While most Pleistocene wells are undesirable due to their high salt content, most Eocene wells are suitable for drinking. Due to their high hardness values, the collected water is unsuitable for home use. Based on the RSC, KR, SAR, and PI, most of the studied wells (Pleistocene and Eocene) are acceptable for irrigation.

Author Contributions

Conceptualization, E.I., M.A.H. and D.H.; methodology, E.I., A.A., M.S.A., M.H. and D.H.; validation, E.I., M.A.H., M.S.A. and A.A.; data curation, E.I. and D.H.; writing—review and editing, E.I., A.A., M.A.H., M.S.A., D.E.A. and M.H.; visualization, E.I., A.A., M.A.H. and D.E.A.; supervision, E.I. and M.A.H. All authors have read and agreed to the published version of the manuscript.

Funding

This work is funded by the Researchers Supporting Project number (RSP2023R455), King Saud University, Riyadh, Saudi Arabia.

Data Availability Statement

An Appendix includes the chemical analyses and the hydrochemical parameters of the collected groundwater samples is associated.

Acknowledgments

The editor and the anonymous reviewers are thanked for their constructive comments which enhanced the manuscript. This work is funded by Researchers Supporting Project number (RSP2023R455), King Saud University, Riyadh, Saudi Arabia.

Conflicts of Interest

The authors declare no conflict of interest.

References

  1. Sidiropoulos, P.; Dalezios, N.R.; Loukas, A.; Mylopoulos, N.; Spiliotopoulos, M.; Faraslis, I.N.; Alpanakis, N.; Sakellariou, S. Quantitative Classification of Desertification Severity for Degraded Aquifer Based on Remotely Sensed Drought Assessment. Hydrology 2021, 8, 47. [Google Scholar] [CrossRef]
  2. Sidiropoulos, P.; Mylopoulos, N.; Lyra, A.; Tziatzios, G.A.; Loukas, A. Risk analysis framework for the optimum remediation of a contaminated aquifer under uncertainty: Application in Lake Karla aquifer, Thessaly, Greece. Stoch. Environ. Res. Risk Assess 2023, 37, 1281–1302. [Google Scholar] [CrossRef]
  3. Cedrick, M.M.; Alexander, A.; Nobert, J.; Mbudi, C.N.U.D. Modeling groundwater flow under chaotic urbanization constraints in Kinshasa Capital Region (D.R. Congo). Phys. Chem. Earth 2021, 124, 102985. [Google Scholar] [CrossRef]
  4. Alexakis, D.E. Applying Factor Analysis and the CCME Water Quality Index for Assessing Groundwater Quality of an Aegean Island (Rhodes, Greece). Geosciences 2022, 12, 384. [Google Scholar] [CrossRef]
  5. Alexakis, D.; Kiskira, K.; Gamvroula, D.; Emmanouil, C.; Psomopoulos, C. Evaluating toxic element contamination sources in groundwater bodies of two Mediterranean sites. Environ. Sci. Pollut. Res. 2021, 28, 34400–34409. [Google Scholar] [CrossRef]
  6. Gamvroula, D.E.; Alexakis, D.E. Evaluating the Performance of Water Quality Indices: Application in Surface Water of Lake Union, Washington State-USA. Hydrology 2022, 9, 116. [Google Scholar] [CrossRef]
  7. Tsitsis, C.; Alexakis, D.E.; Moustris, K.; Gamvroula, D.E. Combining Artificial Neural Network and Driver–Pressure–State–Impact–Response Approach for Evaluating a Mediterranean Lake. Water 2023, 15, 266. [Google Scholar] [CrossRef]
  8. Alexakis, D.E. Meta-Evaluation of water quality indices. Application into groundwater resources. Water 2020, 12, 1890. [Google Scholar] [CrossRef]
  9. Alexakis, D.E. Linking DPSIR model and water quality indices to achieve sustainable development goals in groundwater resources. Hydrology 2021, 8, 90. [Google Scholar] [CrossRef]
  10. Liu, J.; Feng, J.; Gao, Z.; Wang, M.; Li, G.; Shi, M.; Zhanget, H. Hydrochemical characteristics and quality assessment of groundwater for drinking and irrigation purposes in the Futuan River Basin, China. Arab. J. Geosci. 2019, 12, 560. [Google Scholar] [CrossRef]
  11. Rasul, A.K. Hydrochemistry and quality assessment of Derbendikhan Reservoir, Kurdistan Region, Northeastern Iraq. Arab. J. Geosci. 2019, 12, 312. [Google Scholar] [CrossRef]
  12. Berhe, B.A. Evaluation of groundwater and surface water quality suitability for drinking and agricultural purposes in Kombolcha town area, eastern Amhara region, Ethiopia. Appl. Water Sci. 2020, 10, 127. [Google Scholar] [CrossRef]
  13. Al Maliki, A.A.; Abbass, Z.D.; Hussain, H.M.; Al-Ansari, N. Assessment of the groundwater suitability for irrigation near Al Kufa City and preparing the final water quality maps using spatial distribution tools. Environ. Earth Sci. 2020, 79, 330. [Google Scholar] [CrossRef]
  14. Nagarajan, M.; Gauns, A.; Lalitha, R.; Baskar, M. GIS-based assessment of groundwater quality for drinking and irrigation by water quality index. Int. J. Curr. Microbiol. App. Sci. 2020, 9, 2361–2370. [Google Scholar] [CrossRef]
  15. Asadi, E.; Isazadeh, M.; Samadianfard, S.; Ramli, M.F.; Mosavi, A.; Nabipou, N.; Shamshirband, S.; Hajnal, E.; Chau, K.W. Groundwater quality assessment for sustainable drinking and irrigation. Sustainability 2020, 12, 177. [Google Scholar] [CrossRef]
  16. Ismail, E.; El-Sayed, E.; Sakr, S.; Youssef, E. Characteristic of groundwater potentialities in West Nile Valley South, Minia Governorate, Egypt. Arab. J. Geosci. 2017, 10, 521. [Google Scholar] [CrossRef]
  17. Ismail, E.; Zaki, R.; Rapantova, N.; Licbinska, M.; Sharawi, H. Hydrogeochemical characteristics of the groundwater in the quaternary aquifer of western fringes of El-Minia Governorate, Egypt using an integration of geochemical modeling and geo-statistical techniques. Desalin. Water Treat. 2020, 189, 134–151. [Google Scholar] [CrossRef]
  18. Ismail, E.; El-Rawy, M. Assessment of groundwater quality in West Sohag, Egypt. Desalin. Water Treat. 2018, 123, 101–108. [Google Scholar] [CrossRef]
  19. Abd-Elaty, I.; Abd-Elhamid, H.F.; Nezhad, M.M. Numerical analysis of physical barriers systems efficiency in controlling saltwater intrusion in coastal aquifers. Environ. Sci. Pollut. Res. 2019, 26, 35882–35899. [Google Scholar] [CrossRef]
  20. Snousy, M.G.; Ismail, E.; Zaki, R. Trace element occurrence and distribution problems in the irrigation water at El-Minia district, north Upper Egypt. Arab. J. Geosci. 2019, 12, 582. [Google Scholar] [CrossRef]
  21. Geriesh, M.H.; Mansour, B.M.H.; Farouk, H. Assessment of drinking water quality along Port Said Canal treatment plants, Suez Canal corridor, Egypt. Arab. J. Geosci. 2019, 12, 738. [Google Scholar] [CrossRef]
  22. Abdelhalim, A.; Sefelnasr, A.; Ismail, E. Numerical modeling technique for groundwater management in Samalut city, Minia Governorate, Egypt. Arab. J. Geosci. 2019, 12, 124. [Google Scholar] [CrossRef]
  23. Abdelhalim, A.; Sefelnasr, A.; Ismail, E. Response of the interaction between surface water and groundwater to climate change and proposed megastructure. J. Afr. Earth Sci. 2020, 162, 103723. [Google Scholar] [CrossRef]
  24. Abdalazem, A.; Gamee, M.; Hamdan, A.; Awad, A.; Mohamed, A. Groundwater quality assessment for irrigation in West Edfu region, Aswan Egypt. Assiut J. Agri. Sci. 2020, 51, 125–149. [Google Scholar]
  25. Sharaky, A.M.; Abdoun, S.H. Assessment of groundwater quality in Bahariya Oasis, Western Desert, Egypt. Environ. Earth Sci. 2020, 79, 145. [Google Scholar] [CrossRef]
  26. Abotalib, Z.; Heggy, E.; El Bastawesy, M.; Ismail, E.; Gad, A.; Attwa, M. Groundwater mounding: A diagnostic feature for mapping aquifer connectivity in hyper-arid deserts. Sci. Total Environ. 2021, 801, 149760. [Google Scholar] [CrossRef]
  27. Snousy, M.G.; Jianhua, W.; Fengmei, S.; Abdelhalim, A.; Ismail, E. Groundwater Quality and Its Regulating Geochemical Processes in Assiut Province, Egypt. Expo. Health 2022, 14, 305–323. [Google Scholar] [CrossRef]
  28. Abotalib, Z.; Abdelhady, A.A.; Heggy, E.; Salem, S.G.; Ismail, E.; Ali, A.; Khalil, M.M. Irreversible and large-scale heavy metal pollution arising from increased damming and untreated water reuse in the Nile Delta. Earth’s Future 2023, 11, e2022EF002987. [Google Scholar] [CrossRef]
  29. Ismail, E.; Snousy, M.G.; Alexakis, D.E.; Abdelhalim, A.; Ahmed, M.S.; Elsayed, E. Diagnosis of Groundwater Quality in North Assiut Province, Egypt, for Drinking and Irrigation Uses by Applying Multivariate Statistics and Hydrochemical Methods. Water 2023, 15, 2812. [Google Scholar] [CrossRef]
  30. Said, R. The Geology of Egypt; Balkema: Rotterdam, The Netherlands, 1990. [Google Scholar]
  31. Zaki, R. Geochemical Characteristics and Element Associations in Different Rock Types of El Minia District, North Upper Egypt. Sedimentol. Egypt 2011, 13, 349–370. [Google Scholar]
  32. Gamil, R. Hydro-Geochemical Study for the Water Resources in the Desert Fringes of Assiut Governorate, Egypt. Ph.D. Thesis, Faculty of Science, Assuit University, Asyut, Egypt, 2013. [Google Scholar]
  33. Tamer, M.A. Hydrogeology of R. E. A. and Some Changes Occurring as a Result of the Construction of Hydrotechnologic Projects. Ph.D. Thesis, Kiev University, Kyiv, Ukraine, 1974. [Google Scholar]
  34. Piper, A.M. A Graphic Procedure in the Geochemical Interpretation and Analysis of Water Samples; USGS, Water Supply 1953, Paper 1454; US Geological Survey: Reston, VA, USA, 1953. [Google Scholar]
  35. Richards, L.A. Diagnosis and improvement of saline and alkaline soils. In U.S. Department of Agricultural Handbook; No. 60; US Government Printing Office: Washington, DC, USA, 1954; 160p. [Google Scholar]
  36. Gibbs, R.J. Mechanisms controlling World’s water chemistry. Science 1970, 170, 1088–1090. [Google Scholar] [CrossRef]
  37. Wilcox, V. Classification and Use of Irrigation Waters; US Department of Agriculture: Washington, DC, USA, 1955; 19p. [Google Scholar]
  38. Zohdy, A.A.R. A new method for the automatic interpretation of Schlumberger and Wenner sounding curve. Geophysics 1989, 54, 245–253. [Google Scholar] [CrossRef]
  39. Velpen, V.D.B.; Resist, A.A. Computer Program for the Interpretation of Resistivity Sounding Curves, An ITC.M. Sc., Research Project; ITC: Delft, The Netherlands, 1988. [Google Scholar]
  40. Davis, P.A.; Greenhalgh, S.A.; Merrick, N.P. Resistivity Sounding Computations with Any Array using a Single Digital Filter. Explor. Geophys. 1980, 11, 54–62. [Google Scholar] [CrossRef]
  41. Todd, D.K. Groundwater Hydrology, 2nd ed.; Wiley: New York, NY, USA, 1982; 552p. [Google Scholar]
  42. Paliwal, K.V. Irrigation with Saline Water; Monogram No. 2 (New Series); IARI: New Delhi, India, 1972; 198p. [Google Scholar]
  43. Joshi, D.M.; Kumar, A.; Agarwal, N. Assessment of the irrigation water quality of River Ganga in Haridwar District India. J. Chem. 2009, 2, 285–292. [Google Scholar]
  44. Doneen, L.D. Notes on Water Quality in Agriculture; Water Science and Engineering, University of California: Davis, CA, USA, 1964; pp. 101–105. [Google Scholar]
  45. Kelly, W.P. Use of Saline Irrigation Water. Soil Sci. 1963, 95, 355–391. [Google Scholar] [CrossRef]
  46. Hem, J.D. Study and Interpretation of the Chemical Characteristics of Natural Water; Water Supply, Paper 2254; USGS: Reston, VA, USA, 1985; pp. 23–25. [Google Scholar]
  47. Sawyer, G.N.; McCarthy, D.L. Chemistry of Sanitary Engineers, 2nd ed.; Mc Graw Hill: New York, NY, USA, 1987; 518p. [Google Scholar]
  48. Bauder, T.A.; Waskom, R.M.; Davis, J.G. Irrigation Water Quality Criteria; Extension Fact Sheet No. 506; Colorado State University: Fort Collins, CO, USA, 2007; Available online: https://extension.colostate.edu/docs/pubs/crops/00506.pdf (accessed on 17 January 2023).
  49. Eaton, F.M. Significance of carbonate in Irrigation Water. Soil Sci. 1950, 69, 123–133. [Google Scholar] [CrossRef]
  50. Ragunath, H.M. Groundwater; Wiley Eastern: New Delhi, India, 1987; 563p. [Google Scholar]
  51. Domenico, P.A.; Schwartz, F.W. Physical and Chemical Hydrogeology; Wiley: New York, NY, USA, 1990; pp. 410–420. [Google Scholar]
  52. Kelly, W.P. Permissible composition and concentration of irrigated waters. Proceeding ASCF 1940, 66, 607. [Google Scholar]
  53. Paliwal, K.V. Effect of gypsum application on the quality of irrigation waters. Madras. Agric. J. 1967, 59, 646–647. [Google Scholar]
  54. Doneen, L.D. Salination of Soil by Salts in the Irrigation Water. Am. Geophys. Union Trans. 1954, 35, 943–950. [Google Scholar] [CrossRef]
  55. Doneen, L.D. The influence of crop and soil on percolating waters. In Proceedings of the 1961 Biennial Conference on Groundwater Recharge, Dusseldorf, Germany; 1962; pp. 156–163. [Google Scholar]
Figure 1. The location of the study area.
Hydrology 10 00173 g001
Figure 2. Map showing the location of wells in the study area.
Hydrology 10 00173 g002
Figure 3. Map showing the VES’s location and the study area’s geoelectrical cross-sections.
Hydrology 10 00173 g003
Figure 4. Geoelectric cross-section A-A`.
Hydrology 10 00173 g004
Figure 5. Geoelectrical cross-section B-B`.
Hydrology 10 00173 g005
Figure 6. Geoelectrical cross-section C-C`.
Hydrology 10 00173 g006
Figure 7. Geoelectrical cross-section D-D`.
Hydrology 10 00173 g007
Figure 8. (a) Water level zonation map of the studied Pleistocene water samples (b) Water level zonation map of the studied Eocene water samples.
Hydrology 10 00173 g008
Figure 9. (a) TDS zonation map of the studied Pleistocene water samples; (b) TDS zonation map of the studied Eocene water samples.
Hydrology 10 00173 g009
Figure 10. Piper’s diagram of the collected groundwater samples.
Hydrology 10 00173 g010
Figure 11. Gibbs’s diagram of the collected groundwater samples.
Hydrology 10 00173 g011
Figure 12. US Salinity Laboratory (USSL) diagram of the collected groundwater samples.
Hydrology 10 00173 g012
Figure 13. Wilcox diagram for the studied wells.
Hydrology 10 00173 g013
Figure 14. Classification of collected water based on permeability index (PI).
Hydrology 10 00173 g014
Table 1. The mathematical formulas used for calculating the irrigation quality parameters.
ItemEquationReferences
TH TH = 2.497 Ca2+ + 4.115 Mg2+ ions in mg/L[41]
SAR S A R = N a / ( C a + M g ) / 2 all ions in meq/L[35]
Na (%) N a % = ( N a + K ) ( C a + M g + N a + K ) × 100 all ions in meq/L[37]
RSC R S C = H C O 3 + C O 3 2 ( C a 2 + + M g 2 + ) all ions in meq/L[35]
MH M H = M g ( C a + M g ) × 100 all ions in meq/L[42]
SSP SSP = ((Na+ + K+)/(K+ + Na+ + Ca2+ + Mg2+)) × 100 all ions in meq/L[43]
PS P S = C l + S O 4 all ions in meq/L[44]
KR K R = N a ( C a + M g ) all ions in meq/L[45]
Table 2. Classification of the water samples based on electrical conductivity (EC).
Class. NoEC (μS/cm)Water ClassPleistocene
Water Samples (%)
Eocene
Water Samples (%)
1<250Excellent--
2251–750Good-5
3751–2000Permissible23 90
42001–3000Doubtful31 5
5>3000Unsuitable46 -
Table 3. Classification of collected water samples based on RSC values.
RSCWater ClassPleistocene
Water Samples (%)
Eocene
Water Samples (%)
<1.25Safe-5
1.25–2.5suitable359
>2.5unsuitable97 36
Table 4. Classification of collected samples based on the permeability index (PI).
Class. NoPI (%)Water ClassPleistocene
Water Samples (%)
Eocene
Water Samples (%)
1>75Excellent10082
275–25Good-18
3<25Unsuitable--
Table 5. Classification of collected samples based on soluble sodium percentage (SSP).
SSP (epm)Water QualityPleistocene
Water Samples (%)
Eocene
Water Samples (%)
<20Excellent quality--
20–40Good quality-14
40–80Fair100 86
>80Poor--
Table 6. Classification of collected water samples based on Potential salinity (PS).
Class. NoPS (epm)Water ClassPleistocene
Water Samples (%)
Eocene
Water Samples (%)
1<5Excellent to Good10082
25–10Good to Injurious-81
3>10Injurious to Unsatisfactory--
Disclaimer/Publisher’s Note: The statements, opinions and data contained in all publications are solely those of the individual author(s) and contributor(s) and not of MDPI and/or the editor(s). MDPI and/or the editor(s) disclaim responsibility for any injury to people or property resulting from any ideas, methods, instructions or products referred to in the content.

