Article

Understanding Spatio-Temporal Hydrological Dynamics Using SWAT: A Case Study in the Pativilca Basin

by
Yenica Pachac-Huerta
1,2,*,
Waldo Lavado-Casimiro
1,3,
Melania Zapana
1,4 and
Robinson Peña
1,5
1
Programa de Doctorado en Recursos Hídricos Escuela de Posgrado, Universidad Nacional Agraria La Molina, Lima 15024, Peru
2
Facultad de Ciencias Agrarias, Universidad Nacional Santiago Antúnez de Mayolo, Huaraz 02002, Peru
3
Servicio Nacional de Meteorología e Hidrología del Perú (SENAMHI), Lima 15072, Peru
4
Facultad de Ingeniería Agrícola, Universidad Nacional del Altiplano, Puno 21000, Peru
5
Facultad de Ciencias Agropecuarias, Universidad Técnica de Ambato, Ambato 180104, Ecuador
*
Author to whom correspondence should be addressed.
Hydrology 2024, 11(10), 165; https://doi.org/10.3390/hydrology11100165
Submission received: 23 August 2024 / Revised: 22 September 2024 / Accepted: 27 September 2024 / Published: 4 October 2024

Abstract

:
This study investigates the hydrological dynamics of the Pativilca Basin in the Southern Hemisphere using the SWAT (Soil and Water Assessment Tool) model. Seventy-seven watersheds across a mountainous region were analyzed using elevation data, land cover, soil type, and gridded meteorological products (RAIN4PE and PISCO) for hydrological simulations. Watershed delineation, aided by a Digital Elevation Model, enabled the identification of critical drainage points and the definition of Hydrological Response Units (HRUs). The model calibration and validation, performed using the SWAT-CUP with the SUFI-2 algorithm, achieved Nash–Sutcliffe Efficiency (NSE) values of 0.69 and 0.72, respectively. Cluster analysis categorized the watersheds into six distinct groups with unique hydrological and climatic characteristics. The results showed significant spatial variability in the precipitation and temperature, with pronounced seasonality influencing the daily flow patterns. The higher-altitude watersheds exhibited greater soil water storage and more effective aquifer recharge, whereas the lower-altitude watersheds, despite receiving less precipitation, displayed higher flows due to runoff from the upstream areas. These findings emphasize the importance of incorporating seasonality and spatial variability into water resource planning in mountainous regions and demonstrate the SWAT model’s effectiveness in predicting hydrological responses in the Pativilca Basin, laying the groundwork for future research in mountain hydrology.

1. Introduction

The global challenge of water scarcity has intensified due to rapid population growth, environmental degradation, and the accelerating impacts of climate change, particularly in regions already experiencing water stress [1]. By 2022, nearly half of the world’s population faced severe water scarcity for at least part of the year, and approximately one-quarter lived in areas subjected to extremely high levels of water stress [2]. This challenge is especially acute in regions like the Pacific slope of Peru, where increasing population pressures, expanding agricultural and industrial activities, and climatic variability exacerbate the existing water resource limitations.
The Pativilca Basin, located on the Pacific slope, is a prime example of a region facing mounting water stress. As the demand for water grows due to economic activities and population growth, the competition for limited water resources is expected to intensify. This basin supports agriculture, hydropower, and other vital sectors, making the efficient management of its water resources crucial for regional sustainability [3]. However, one of the primary challenges in the Pativilca Basin, as in many parts of Peru, is the scarcity of observed hydrological data, such as streamflow records, which limits the ability to fully understand and manage the region’s water resources. This lack of data, combined with the region’s complex topography and variable climate, necessitate the use of advanced hydrological modeling tools [3,4,5].
Hydrological models, like the Soil and Water Assessment Tool (SWAT), play a critical role in simulating the water cycle and predicting water availability under various climatic and land-use scenarios [6,7]. The SWAT is a physically based model that can simulate the spatial and temporal distribution of water resources, making it particularly valuable for regions with limited observational data. In Peru, the integration of gridded climate datasets such as RAIN4PE (Rain for Peru and Ecuador) and PISCO (Peruvian Interpolated data), which provide high-resolution precipitation data derived from satellite- and ground-based sources, enhances the accuracy of hydrological models and enables more reliable predictions in data-scarce regions [8,9] like the Pativilca Basin.
RAIN4PE is a novel daily gridded precipitation dataset generated by merging multi-source precipitation data (satellite-based CHIRP, reanalysis ERA5, and ground-based observations) with terrain elevation using the random forest regression method [10]. PISCO, another key dataset, offers interpolated precipitation and temperature data, further enhancing the capacity to model the hydrological processes in Peru’s watersheds [10,11]. These datasets, when integrated into the SWAT, enable a more detailed understanding of the spatio-temporal variability in the water resources [12,13,14] in the Pativilca Basin.
Furthermore, the calibration and validation of the SWAT model are critical to ensuring simulation reliability. Calibration adjusts the model parameters to reflect the observed conditions, while validation tests the model’s capacity to predict hydrological events under conditions not used during calibration [8,15,16,17]. Proper calibration and validation are crucial for achieving accurate estimates of key parameters such as runoff, evapotranspiration, and infiltration, which are essential for effective water resource planning and management [18,19,20].
The primary objectives of this study are to (1) calibrate and validate the SWAT model using both ground-based and satellite-derived datasets (RAIN4PE and PISCO) to improve the reliability of hydrological simulations and (2) characterize the spatial and temporal patterns of key hydrological variables, such as surface water availability, runoff, evapotranspiration, and groundwater recharge, in the Pativilca Basin. These insights will be critical for the development of sustainable water management strategies in the Pativilca Basin, where water scarcity is expected to worsen due to increasing demand and the impacts of climate change.

2. Materials and Methods

2.1. Study Area

The study area is the Pativilca Basin, located north of Lima Province in Peru, between latitudes 9°50′–10°55′ S and longitudes 76°45′–77°50′ W, spanning the departments of Ancash and Lima, with a total population of 126 716 inhabitants (Figure 1a,b). The Pativilca River Basin, part of the Pacific Basin, drains a total area of 4837 km². The Pativilca River flows approximately 174 km, with an average slope of 2.8% from its source in the Cajatambo glaciers to its mouth in the Pacific Ocean (Figure 1c). Notable tributaries include the Achin, Rapay, and Gorgor Rivers [21].
Climatically, the multiannual average temperature ranges from 5 °C to 20 °C, with a clear altitudinal temperature variation trend. Relative humidity fluctuates between 50% and 90% throughout the year. The multiannual average total precipitation for the study period exceeds 500 mm, exhibiting both annual and spatial variability, with the highest values concentrated between January and March and the lowest from June to August. Similarly, spatial variability is observed, with headwater watersheds recording the highest precipitation levels, while lower-elevation watersheds near the river mouth record the lowest values [21].
The basin contains an unconsolidated alluvial detrital aquifer, where groundwater is concentrated through wells, with maximum development in the alluvial fans of the tributaries. The aquifer’s geometry is defined by pre-Quaternary rocks forming the impermeable substrate and by permeable materials classified as unconsolidated detrital deposits of aeolian and marine origin [21].

2.2. Dataset

The various variables employed in the present research consist of remote sensing (RS) data and ground data. For the accurate development of Hydrologic Response Units (HRUs), remote sensing products including the Digital Elevation Model (DEM), soil type, and land cover are crucial. The Shuttle Radar Topography Mission (SRTM) DEM, with a resolution of 30 m with the codes S11W077 and S11W078, was accessed through Earth Explorer, managed by the US Geological Survey, covering an elevation range from 0 to 6322 m a.s.l. The slope distribution indicates that 73.03% of the area has slopes greater than 30%, while 12.43%, 9.13%, and 5.41% of the area have slopes in the ranges of 20.0–30.0%, 10.0–20.0%, and 0–10.0%, respectively (Figure 2a).
Land cover data, also at a 30 m resolution, can be obtained from the Global Land Cover website, which provides freely accessible and validated data, including eleven distinct types. Mixed Forests (FRST) dominate the landscape, comprising 44% of the area, followed by Pastures (PAST) at 30.32%. Barren Land (BARR) and Evergreen Forests (FRSE) contribute 10.53% and 7.74%, respectively, while Agricultural Land (AGRL) accounts for 2.61%. Other land types, including Urban Areas (URML), Rangelands (RNGB), and Water Bodies (WATR), collectively represent less than 5% of the total area (Figure 2b). The soil map, scaled at 1:5,000,000, was acquired from the FAO’s dataset, available through their data catalog, and includes six types. The predominant soil type is Lithosols with eolic and colluvial horizons (43.9%). Lithosols with organic matter, colluvial materials, and cemented layers cover 18.07%, 17%, and 15.59% of the area, respectively. Glacier-covered areas and Eutric Fluvisols represent only 2.87% and 2.57%, respectively (Figure 2c). The historical daily data for precipitation and temperature from 1981 to 2015, including satellite-derived data, were key inputs for the SWAT model. Precipitation data were provided by RAIN4PE, and maximum and minimum temperature data were obtained from the gridded PISCO dataset; a script code was developed in RStudio, which enabled the extraction of data for the basin. The daily hydrometric data from the Cahua station, located at coordinates −77.34 longitude and −10.61 latitude and covering the period from 2000 to 2015, were sourced from the Water Observatory, part of the National Water Resources Information System managed by Peru’s National Water Authority (ANA). This station, located in the mid-lower section of the Pativilca Basin, is continuously monitored by STATKRAFT PERU S.A (Figure 1c). The PISCO and RAIN4PE data were used as input variables in the SWAT model, while the streamflow data from the Cahua station were employed for calibration and validation. Due to the limited number of meteorological stations with long-term records in the study area, satellite and gridded data were essential for ensuring the robustness of the model. The 2000–2015 period was selected for hydrometric data due to the availability of reliable daily measurements, providing a solid foundation for model calibration and validation. Table 1 lists the data specifics and information sources.

2.3. SWAT Hydrological Modeling

SWAT is a sophisticated hydrological model developed by the USDA Agricultural Research Service for simulating the impacts of land management practices on water, sediment, and agricultural chemical yields in complex watersheds. This semi-distributed, process-based model operates on a continuous time scale and utilizes a range of input data, including land use, soil properties, topography, and meteorological conditions, to simulate the terrestrial phase of the hydrological cycle. SWAT discretizes the watershed into multiple watersheds, which are further divided into HRUs based on unique combinations of land use, soil type, and slope. This approach enables the detailed representation of spatial variability within the watershed, enabling accurate simulation of surface runoff, sediment transport, and nutrient cycling. The model’s capacity to simulate long-term hydrological processes makes it a powerful tool for assessing the effects of land management and climate change on watershed hydrology [25,26,27].
SWAT model is based on water balance Equation (1):
SW t = SW o + t = 1 t R d Q s u r W s e e p ET Q g w
where SWt is the soil water storage at time t in mm, SWo is the soil water storage at the beginning of the time period in mm, t is the calculation time period in days, Rd is the rainfall volume in mm, Qsur is the surface runoff in mm, ET is the evapotranspiration in mm, Wseep is the seepage water from the top into deeper layers in mm, and Qgw is the underground runoff in mm [28].
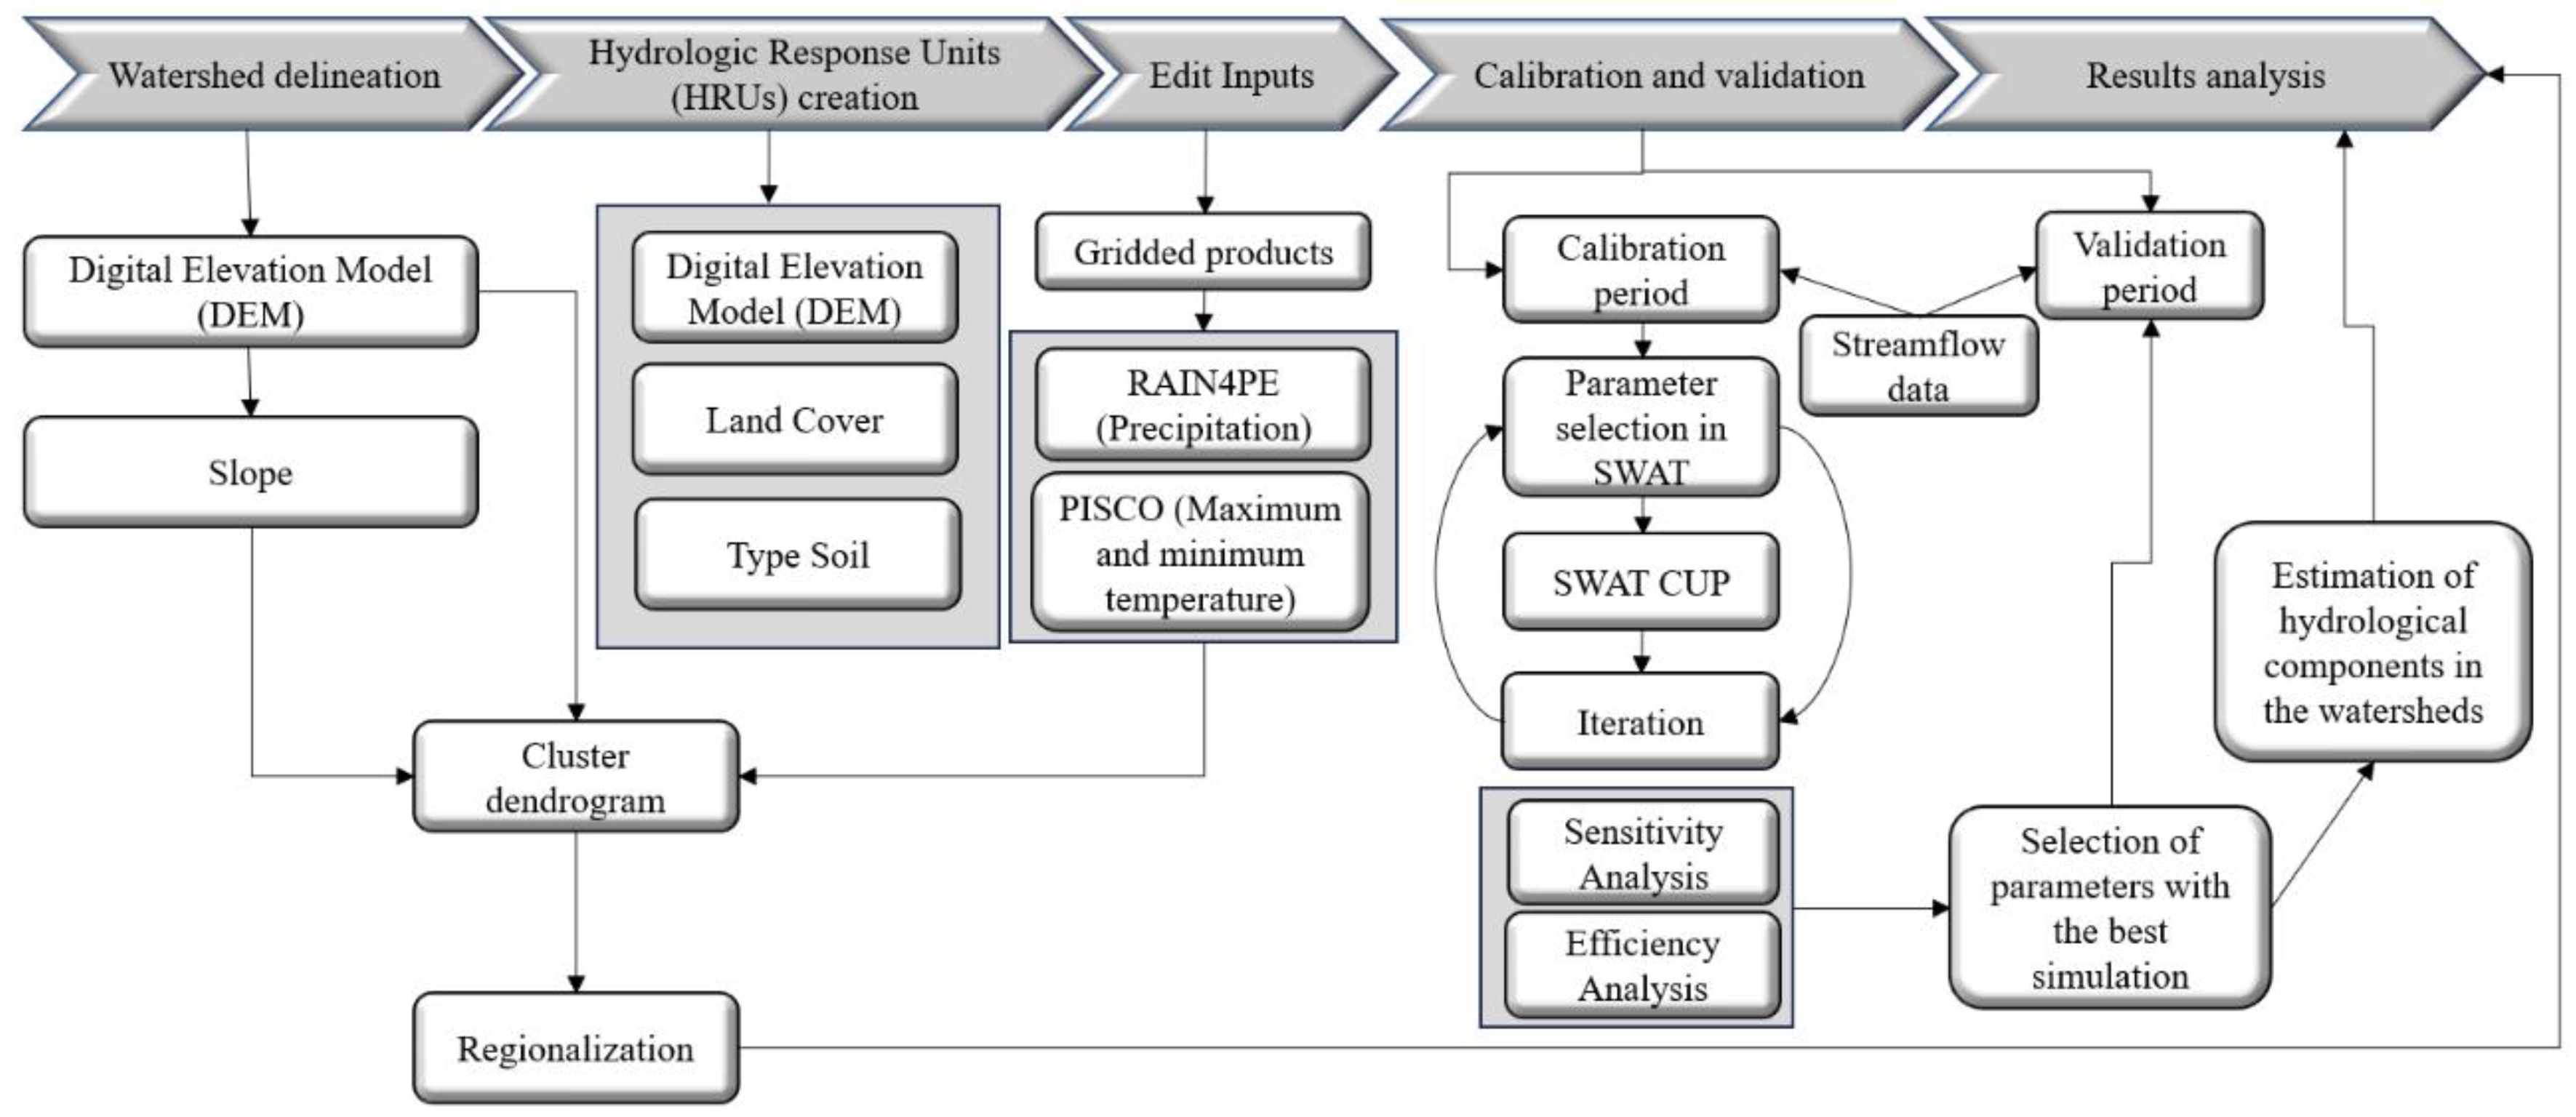
Figure 3 illustrates the flowchart for hydrological modeling, starting with watershed delineation using a Digital Elevation Model (DEM) and slope analysis to define the watershed boundaries. Next, Hydrologic Response Units (HRUs) are created using DEM, land cover, and soil type data to characterize distinct hydrological regions. Gridded meteorological inputs, such as RAIN4PE (precipitation) and PISCO (temperature), are then incorporated. The process continues with calibration and validation, where the SWAT model is calibrated using streamflow data, iterating through parameter sets in SWAT-CUP with sensitivity and efficiency analyses to optimize the simulation. Once calibrated, the model is validated with separate data to assess accuracy. Finally, the validated model is used to estimate hydrological components of the watersheds. Throughout the flowchart, regionalization and cluster analysis using a dendrogram ensure consistent parameter selection and simulation across different regions. The process emphasizes iterative refinement to achieve precise hydrological predictions. Watersheds were grouped using a dendrogram clustering method, considering factors such as elevation, slope, precipitation, and maximum and minimum temperatures. This approach enables grouping similar watersheds, facilitating a more accurate and comprehensive analysis.

2.4. SWAT Model Set-Up

The SWAT model was employed to assess the hydrological dynamics of the Pativilca Basin, providing a comprehensive framework for simulating the complex interactions between topography, soil properties, meteorological data, vegetation, and land management practices. The input datasets were reprojected to the UTM zone 18S to ensure spatial consistency across the study area. The basin delineation was performed using a DEM, identifying the final outflow point as the main drainage outlet. The model was set up using QSWAT interface for QGIS. The basin was delineated into 77 catchments based on DEM, and the HRUs were defined by overlaying land use, soil, and slope data. For each HRU, simulations were conducted to quantify soil moisture content, evapotranspiration rates, surface runoff, nutrient dynamics, crop growth, sediment transport, and land management practices. The aggregation of sub-basin outputs was performed using a weighted average approach, incorporating key physical parameters such as elevation, drainage length, and climatic inputs. RAIN4PE and PISCO gridded products provided the meteorological data, which were then used to calculate values for each watershed based on its centroid.

2.4.1. Model Calibration

The calibration and uncertainty analysis of the SWAT model were meticulously performed using SWAT-CUP with the Sequential Uncertainty Fitting (SUFI-2) algorithm. SUFI-2 was selected due to its proven capability to effectively quantify both parameter uncertainty and the resulting uncertainty in model outputs. Seven key parameters were calibrated within the SWAT model, requiring significant computational effort and time. The model was calibrated over the designated period from 2000 to 2011. The initial year (2000) was allocated for model warm-up.

2.4.2. Model Validation

Post-calibration, model validation involved compared field observations (data not used in calibration) performed by comparing the model’s output with independent field observations from the 2011–2015 period. This step was crucial for assessing the model’s predictive accuracy without modifying any input parameters.

2.4.3. Model Performance Evaluation

The performance of the calibrated model was evaluated in SWAT-CUP using the Nash–Sutcliffe Efficiency (NSE), the Coefficient of Determination (R2), Kling Gupta Coefficient (KGE), the Ratio of the Root Mean Square Error to the Standard Deviation of measured data (RSR), and the Percent Bias (PBIAS) during both calibration and validation periods [29]. The detailed equations are as follows:
N S E = 1 i = 1 n Q s i m Q o b s 2 i = 1 n Q o b s Q a v g , o b s 2
R 2 = i = 1 n Q o b s Q a v g , o b s Q s i m Q a v g , s i m i = 1 n Q o b s Q a v g , o b s 2 i = 1 n Q s i m Q a v g , s i m 2 2
P B I A S = i = 1 n Q o b s Q s i m i = 1 n Q o b s × 100
R S R = i = 1 n Q o b s Q s i m 2 i = 1 n Q o b s Q a v g , o b s 2
K G E = 1 r 1 2 + α 1 2 + β 1 2
r = σ s i m μ s i m σ o b s μ o b s α = σ s i m σ o b s β = μ s i m μ o b s
where, Qobs is the observed discharge, and Qsim is the simulated discharge. Additionally, metrics such as Qavg,obs and Qavg,sim refer to the average observed and simulated discharge, respectively. Furthermore, σ s i m and σ o b s represent the standard deviation of simulated and observed discharge, respectively, providing insights into the variability in discharge data. Finally, μ s i m and μ o b s signify the mean values of simulated and observed discharge, respectively [8].

2.4.4. Sensitivity Analysis Using SWAT-CUP

The sensitivity analysis was performed using SWAT-CUP, a powerful calibration and uncertainty program designed to work with the SWAT model. This analysis is crucial for identifying the most influential parameters that affect model output, thereby guiding the calibration process and improving the model’s predictive performance. Two statistical metrics were employed to assess sensitivity: the t-Stat and the p-value. The t-Stat is a measure that indicates the sensitivity of a parameter by comparing its estimated coefficient to its standard error. A larger absolute t-Stat value suggests that the parameter has a significant influence on the model output. This metric enables the prioritization of parameters that require more accurate calibration due to their greater impact on the model. The p-value complements the t-Stat by providing a measure of the statistical significance of each parameter. A low p-value (typically less than 0.05) indicates that the parameter’s influence on the model output is statistically significant, implying that variations in this parameter are not due to random chance. Parameters with low p-values are deemed highly sensitive and critical for achieving robust model calibration [29,30].

3. Results

3.1. Regionalization and Analysis of Climatic Variables

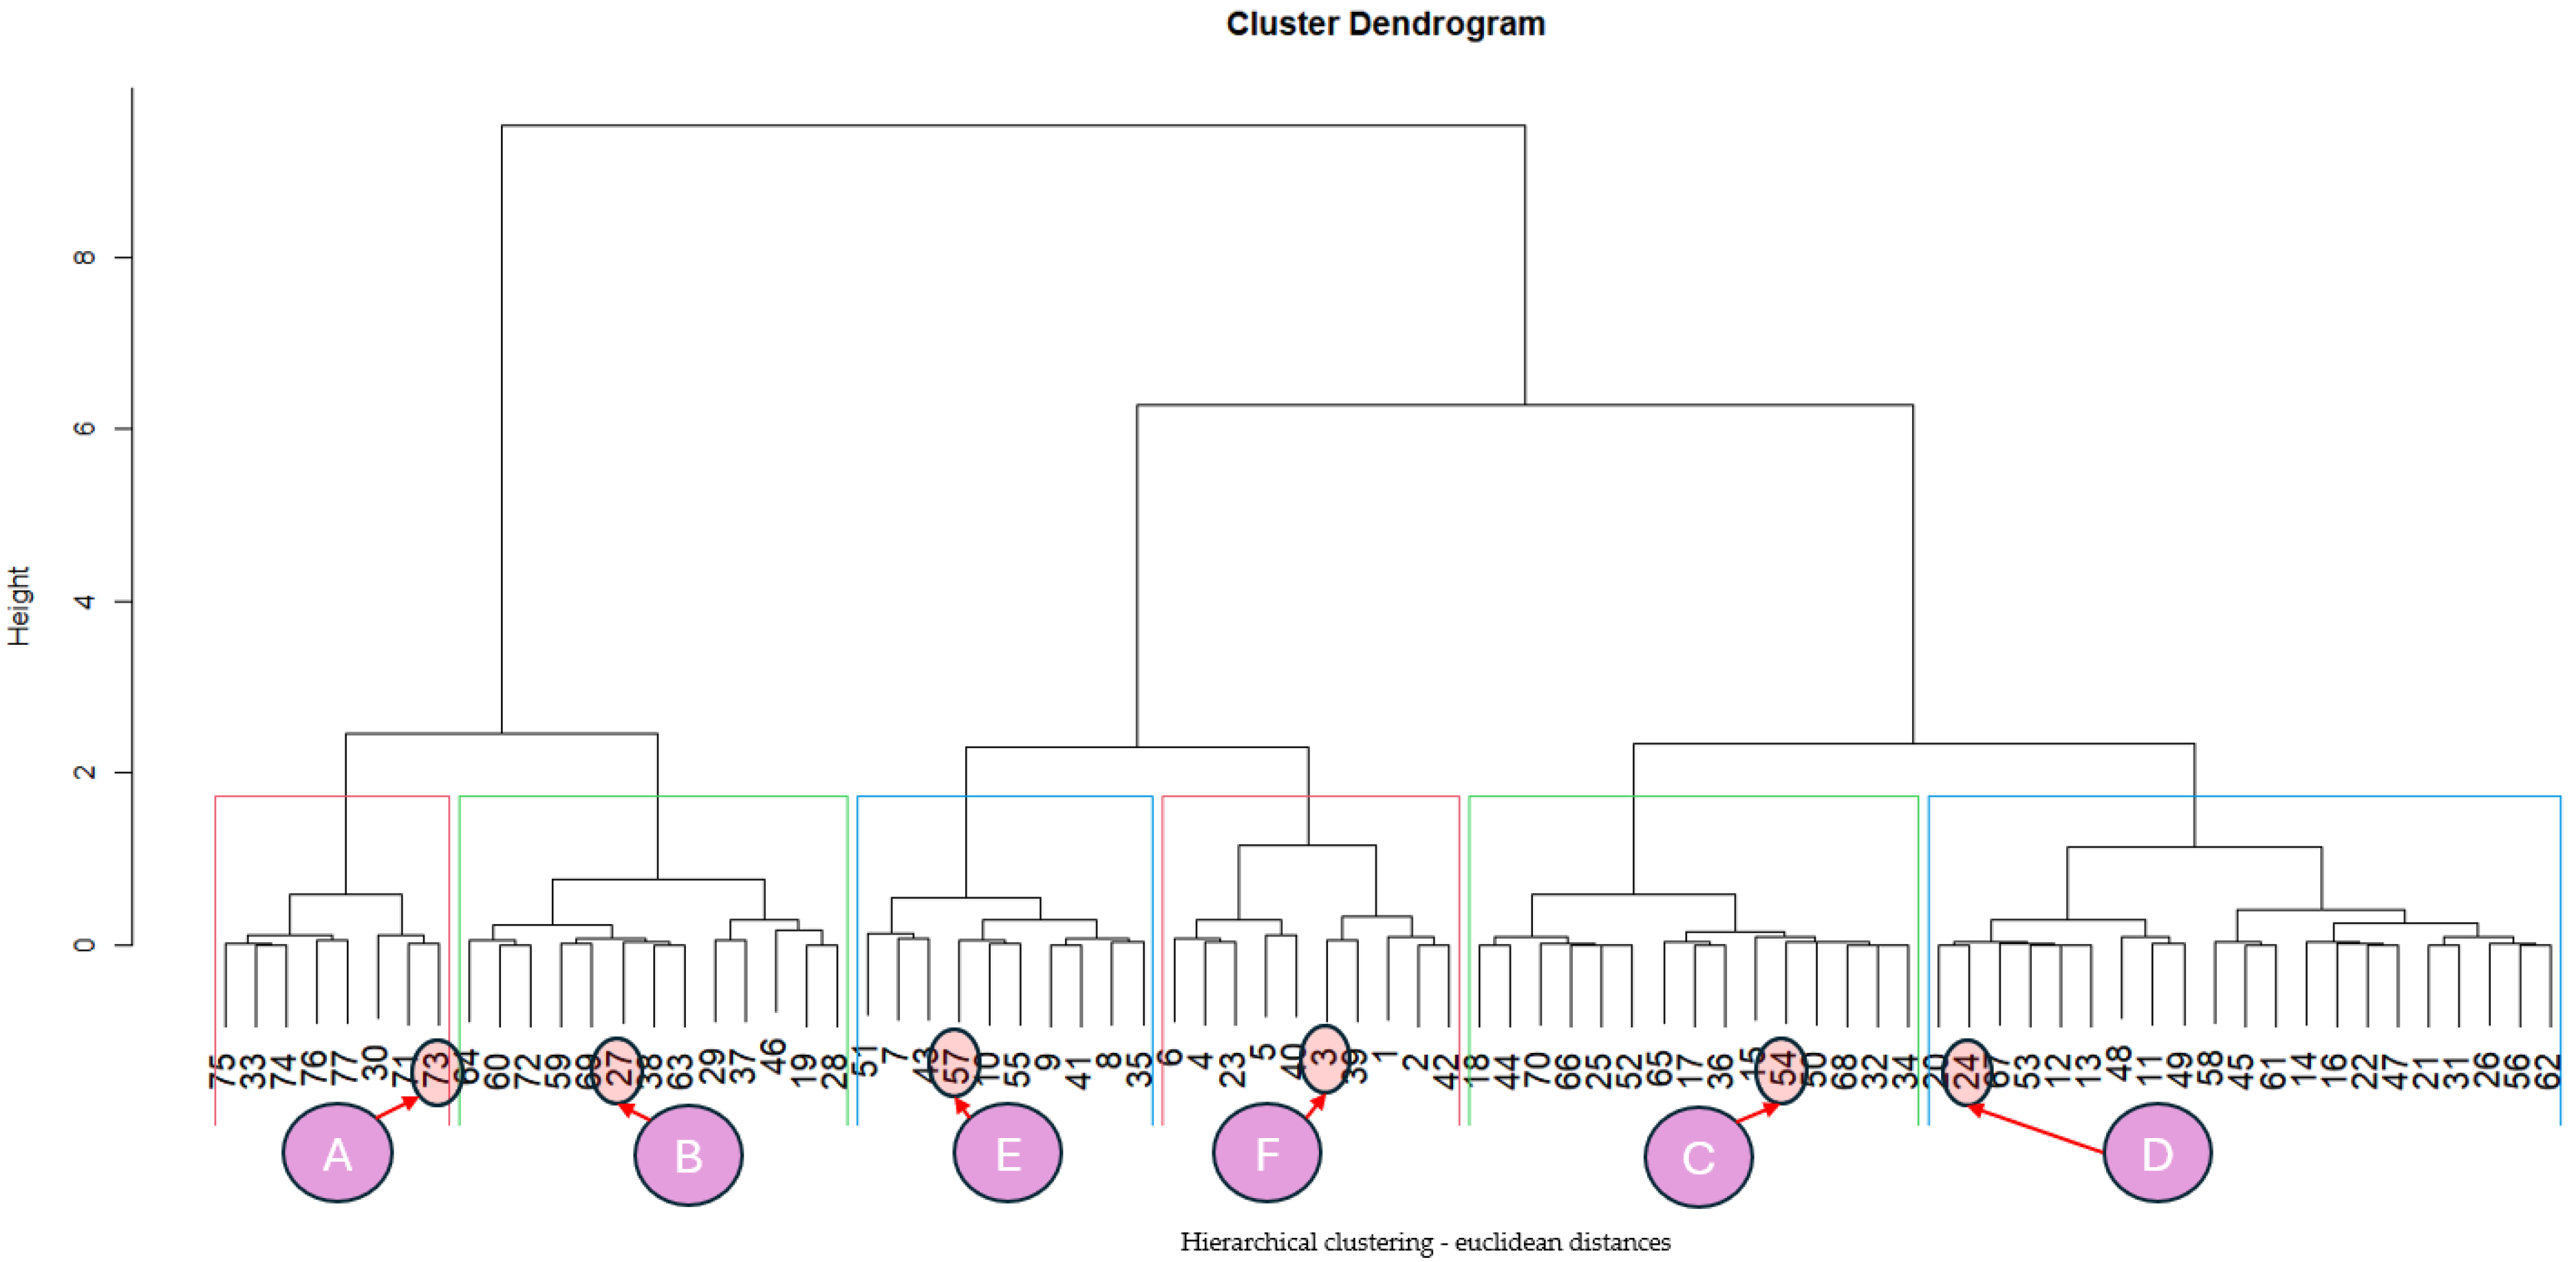
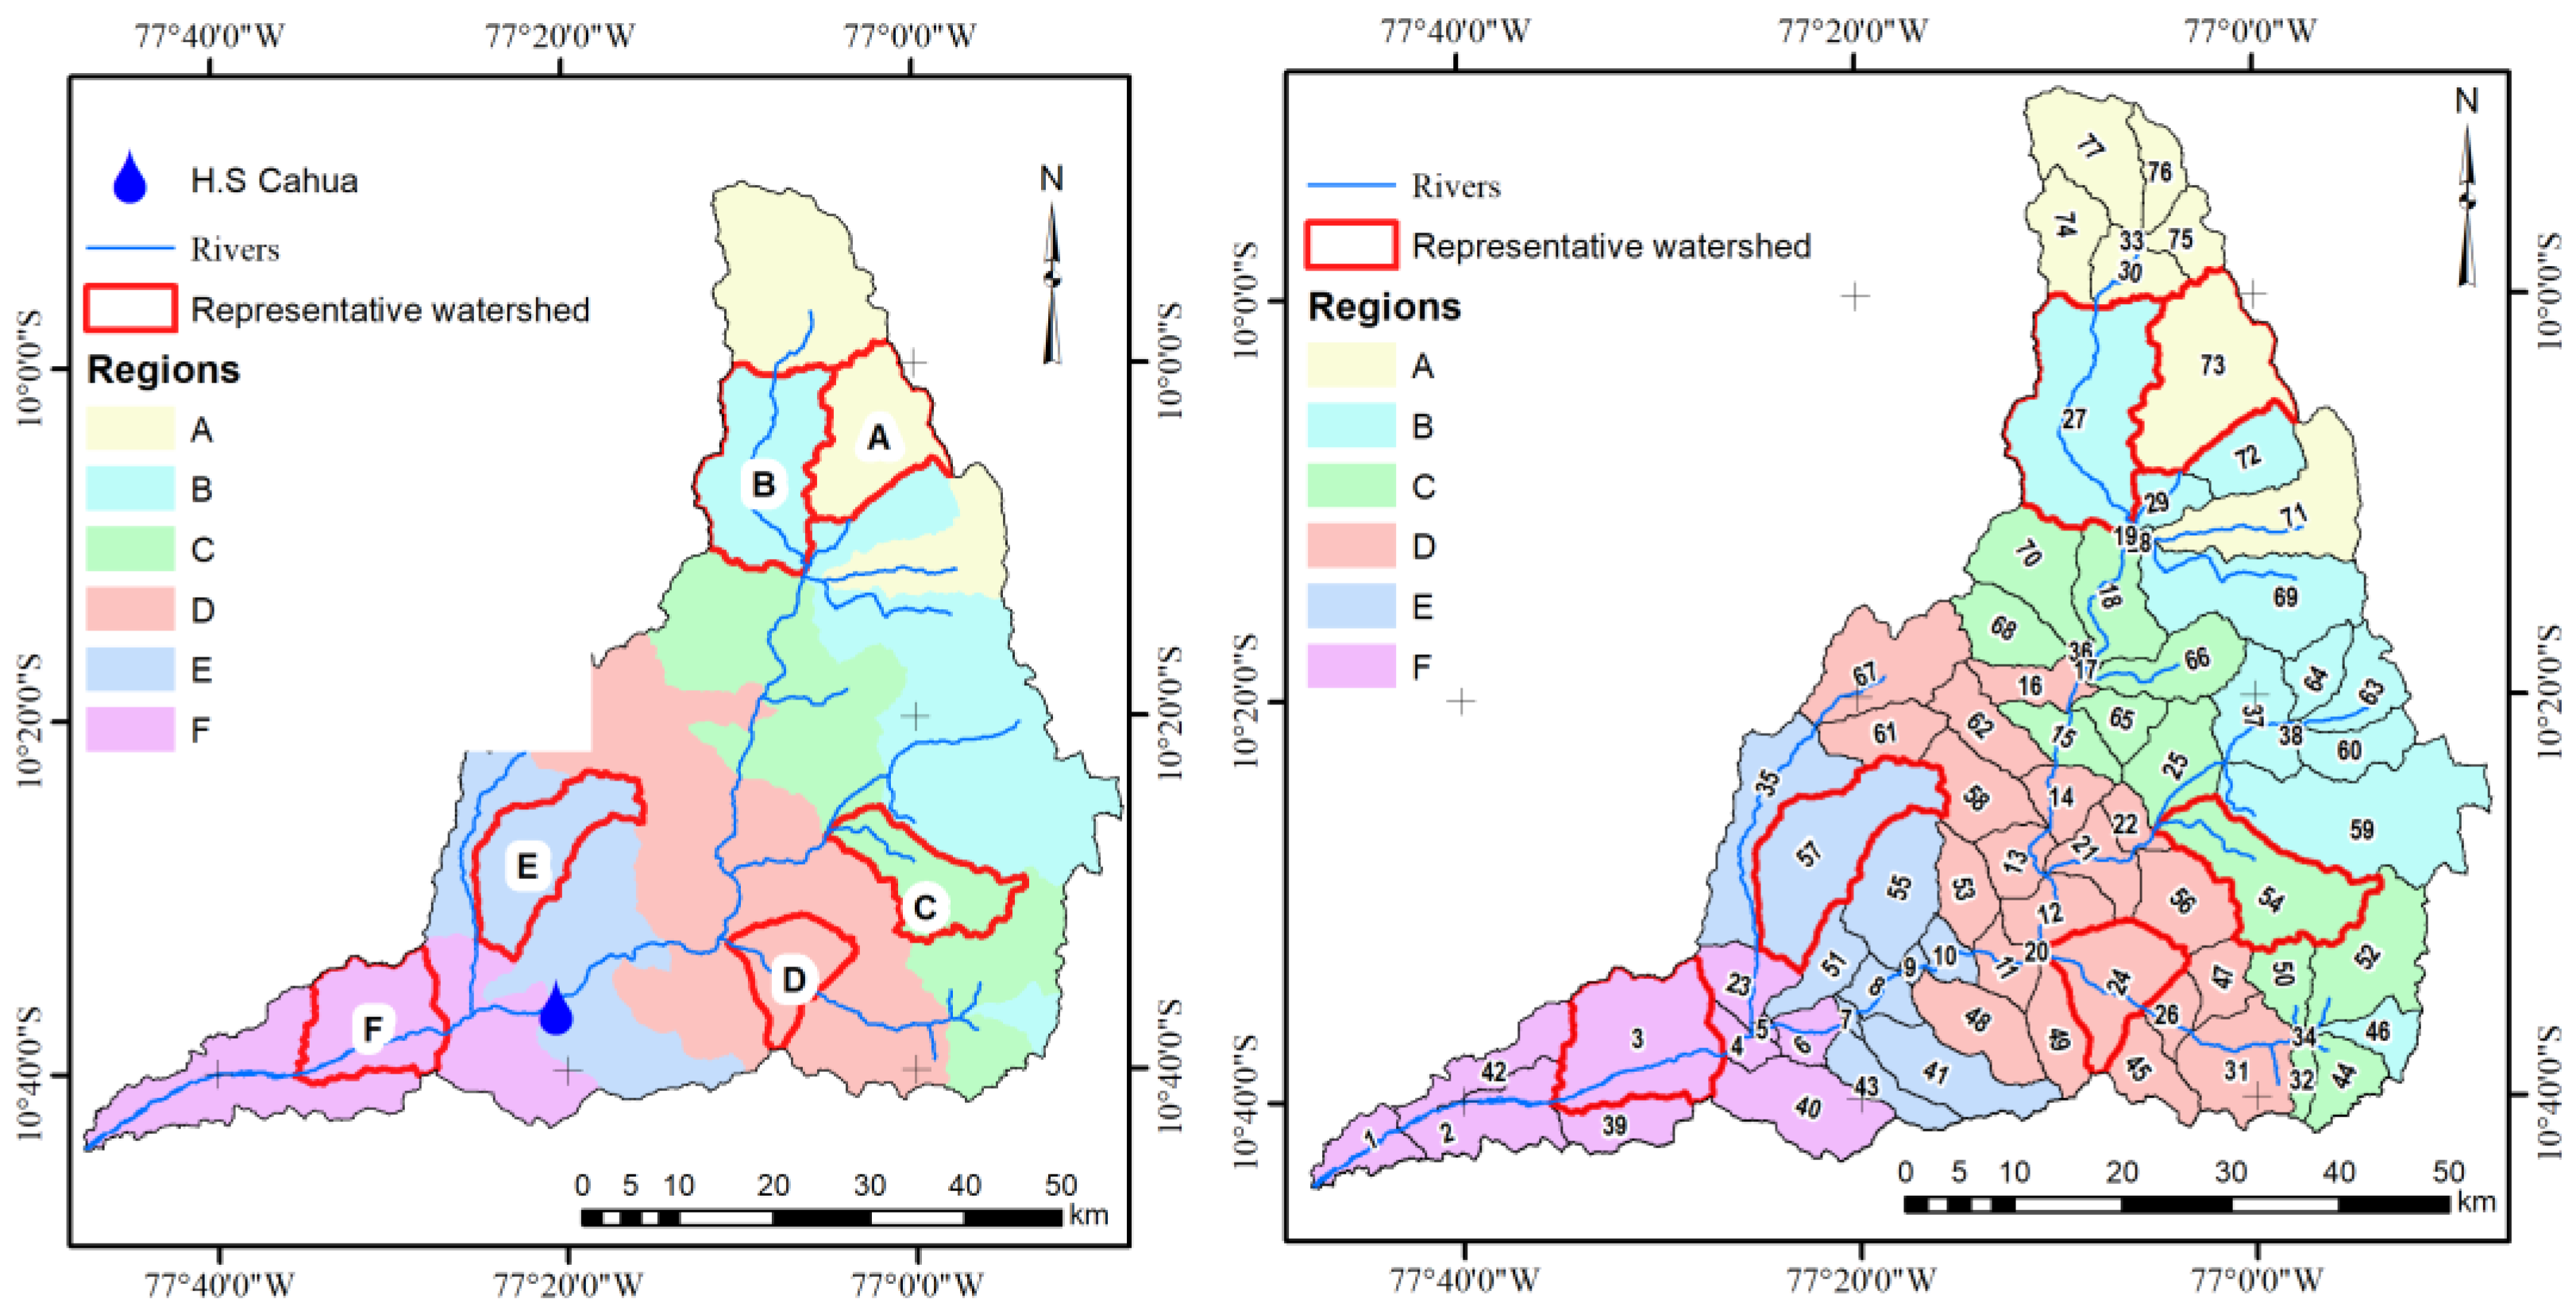
To achieve a more accurate spatio-temporal analysis of the Pativilca Basin, the 77 watersheds were grouped using a dendrogram clustering method, considering the elevation, slope, precipitation, maximum temperature, and minimum temperature as factors. This analysis resulted in seven distinct groups (A to F) (Figure 4), with a representative watershed selected from each: A (73), B (27), C (54), D (24), E (57), and F (3) (Figure 5).
The representative watersheds were chosen to exemplify the hydrological behavior of each group and serve as key indicators for interpreting the dynamics of the hydrological cycle variables. Specifically, for groups A, C, and E, the watersheds with the largest area were selected as these are critical in capturing the spatial variability and overall water balance. In contrast, for groups B, D, and F, the selected watersheds were those receiving upstream contributions and possessing significant catchment areas, thus reflecting the cumulative influence of upstream flows and larger spatial extents.
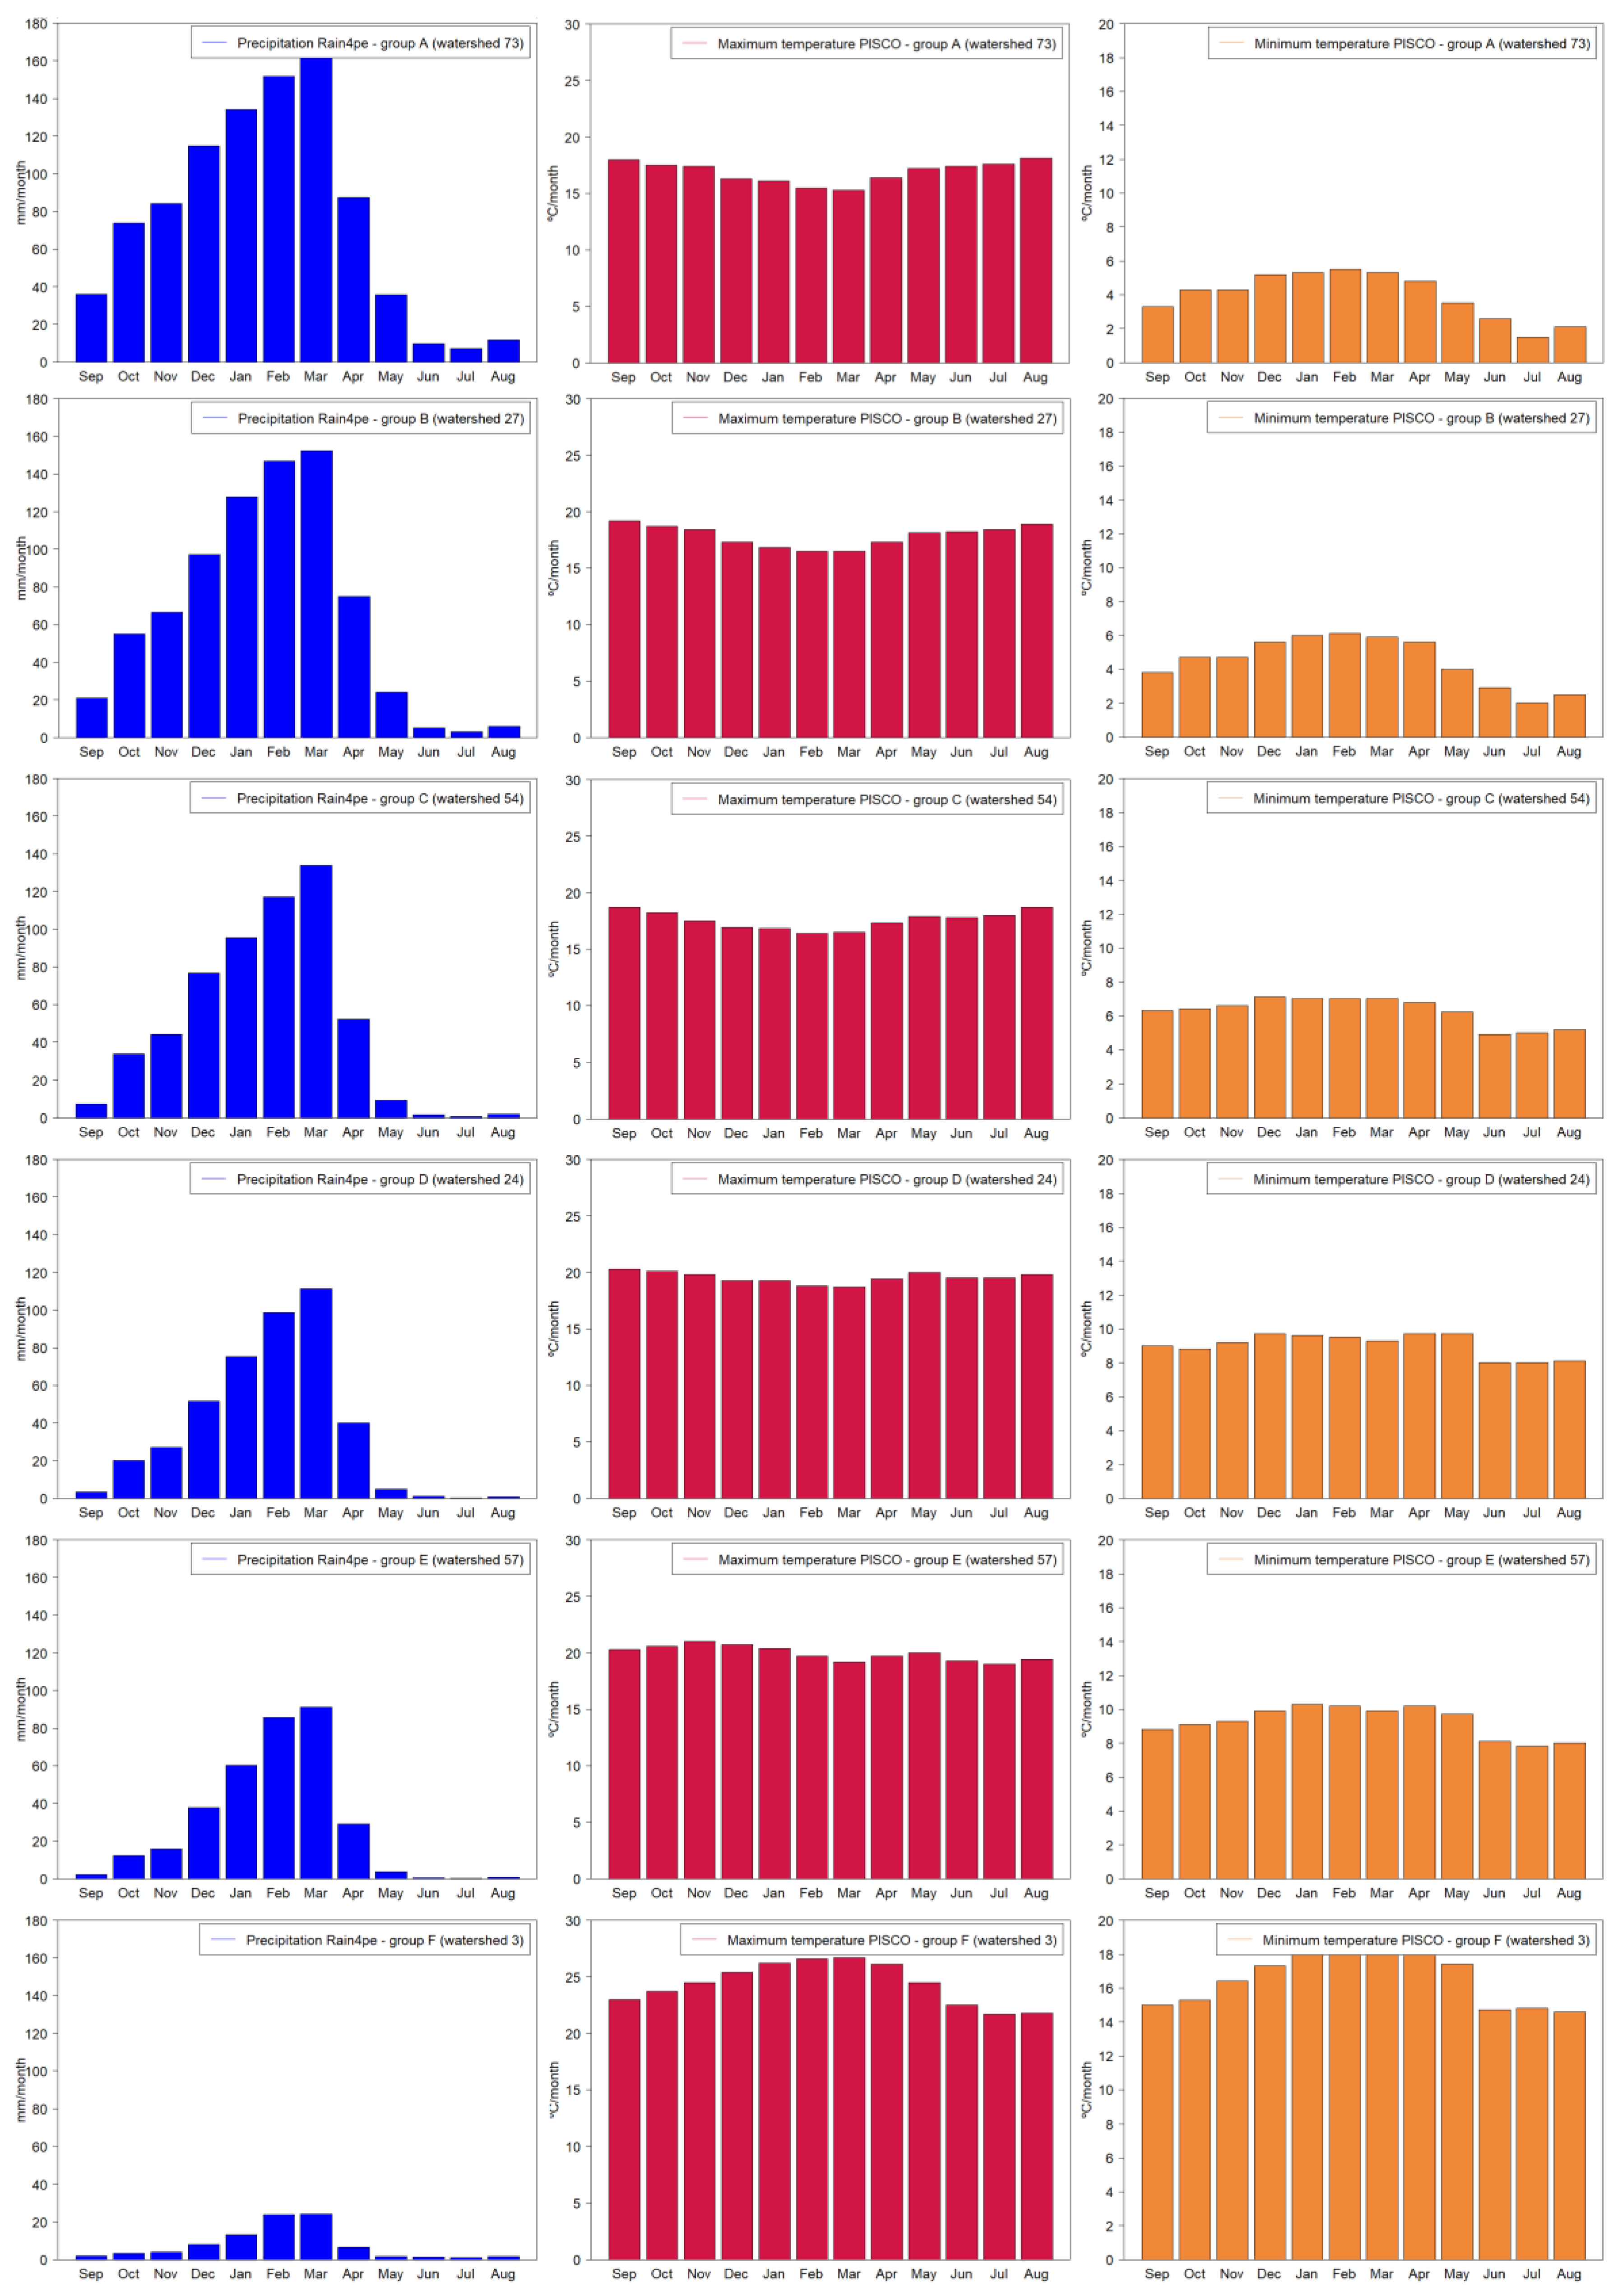
The analysis of the seasonal average data for the period 1981–2015 in the six watersheds (Groups A–F) revealed a pronounced monthly variation in the precipitation, as well as the maximum and minimum temperatures, as illustrated in Figure 6. The precipitation was predominantly concentrated from January to March, with Group A reaching a peak of 163.5 mm in March, followed by Group B with 152.3 mm during the same month. From April onwards, the precipitation sharply decreased, reaching the lowest values during the dry season (June to August), with the minimum levels approaching 0 mm in Groups C and F in July, confirming the clear seasonality of the rainfall in the Pativilca Basin.
The maximum temperatures also exhibited a distinct seasonal pattern, with the highest values observed during the austral summer (December to March). Group F recorded a peak of 26.7 °C in March, whereas the higher-altitude watersheds, such as Group A, displayed more moderate maximum temperature ranges, between 16.1 °C and 18.1 °C. Conversely, the minimum temperatures reached their lowest values during the austral winter months (May to August), with Group A registering a minimum of 1.5 °C in July, reflecting the colder conditions at higher elevations.
Figure S1 of the Supplementary Materials illustrates the temporal variations in the precipitation, as well as the maximum and minimum temperatures, on daily (a,d,g), monthly (b,e,h), and annual (c,f,i) scales in the regions of the Pativilca Basin in Group A. The figure demonstrates that the clustering performed through the cluster analysis is appropriate as all the watersheds within Group A exhibit similar climatic behaviors. This analysis was extended to all the groups, from A to F, confirming the consistency in the grouping. Also, Figures S2–S4 display the monthly temporal variability in all the watersheds, grouped by clusters, for precipitation, maximum temperature, and minimum temperature, respectively, for Groups B through F.
The analysis of the daily, monthly, and annual precipitation reveals significant spatial variability among the watershed groups. The watershed in Group A (73) records the highest annual precipitation accumulation (1242 mm), followed by the watersheds in Groups B (27) and C (54), with values of 1220 mm and 820 mm, respectively. In contrast, the watershed in Group F (3) exhibits the lowest annual value (194 mm), indicating a low precipitation regime, which is associated with its lower elevation (1144 m a.s.l.) compared to the other watersheds. The monthly precipitation is concentrated between January and March, peaking in March, with the maximum values of 163 mm in Group A and 151 mm in Group B, and decreasing significantly during the dry months (June to August). This pattern suggests a precipitation regime influenced by seasonality, typical of regions with well-defined dry and wet seasons.
Regarding the daily maximum temperatures, Group F (3) shows the highest values, with a maximum of 31 °C, consistent with its lower altitude and proximity to warmer climatic zones. Conversely, the watershed in Group A (watershed 73), situated at the highest elevation (4407 m a.s.l.), records the lowest daily maximum temperature (21.13 °C). This altitudinal gradient is also evident in the minimum temperatures, where the watershed in Group F records a maximum daily minimum temperature of 23.71 °C, in contrast to the negative values observed in the higher-elevation watersheds like Group A (−2.84 °C). Annually, the maximum and minimum temperatures follow similar patterns, with warmer temperatures in the Group F watersheds and colder temperatures in the higher-elevation watersheds (Groups A and B). The monthly variability shows a decline in the temperatures during the winter months, particularly in the higher-elevation watersheds, and an increase during the summer months, reflecting clear thermal seasonality.

3.2. Assessment of Hydrological Parameters

The SWAT hydrological model of the Pativilca Basin was applied to analyze the streamflow parameters on a daily time step during the period of 2000 to 2011, which served as the validation phase. A sensitivity analysis identified the most influential parameters affecting the hydrological processes, optimizing the calibration. A total of 1000 iterations were performed using the SWAT-CUP, with the best statistical results obtained at iteration 301, leading to a more accurate and reliable representation of the watershed’s hydrological behavior. The curve number (CN2) was calibrated to a value of −0.3555, within the acceptable range of −0.5 to 0.5. The soil evaporation compensation factor (ESCO) was calibrated to 0.9946, with the parameter range spanning from 0.01 to 1. For the shallow aquifer (GWQMN), a calibrated value of 1.4550 was determined. During the calibration, the groundwater delay time (GW_DELAY) was optimized to 81 days, within a specified range of 30 to 450 days. The baseflow alpha factor (ALPHA_BF), which ranges from 0 to 1, was calibrated to 0.8555. The percolation coefficient (REVAPM) was optimized to 64.76 mm, while the groundwater revap coefficient (GW_REVAP) was calibrated to 0.0917. Table 2 provides the optimal values and their corresponding parameter ranges.
The sensitivity analysis identified CN2.mgt, GWQMN.gw, and GW_DELAY.gw as the parameters exerting the most significant influence on the runoff values, while the other parameters also demonstrated notable effects on the model simulations and water balance calibration, as evidenced in Table 3. The CN2.mgt parameter, which represents the curve number for the surface runoff, was calibrated with a reduction of 35.55%, significantly decreasing the runoff potential and increasing the infiltration across all the Hydrological Response Units (HRUs). This adjustment improves the model’s ability to simulate the surface hydrology more accurately. The high t-Stat value of 55.35 and the p-value of 0.00 indicate that CN2.mgt has a very strong and statistically significant influence on the model. A t-Stat of 55.35 shows that the parameter’s effect is substantial, while a p-value of 0.00 means that there is virtually no chance that this effect occurred randomly. This confirms that CN2.mgt plays a critical role in the calibration process, directly impacting the surface runoff generation and making it a key factor in accurately reflecting the hydrological behavior of the catchment.
The ALPHA_BF.gw parameter, with a fitted value of 0.855, indicates a significant delay in groundwater discharge, suggesting that baseflow is a major component of the catchment’s streamflow. This high value implies a strong buffering effect of the groundwater storage, which sustains the streamflow during periods of low precipitation. Although the p-value for ALPHA_BF.gw is 0.81, suggesting lower statistical significance in the sensitivity analysis, the physical interpretation of its high fitted value provides crucial insights into the catchment’s hydrological behavior.
GW_DELAY.gw, calibrated at 81 days, represents the time lag between the recharge and discharge within the groundwater system. This moderate delay enables a balanced interaction between the surface and groundwater systems, ensuring that the groundwater contributions to streamflow are neither too rapid nor too delayed, which is essential for maintaining streamflow continuity. Despite its p-value of 0.14, GW_DELAY.gw plays a critical role in capturing the temporal dynamics of groundwater discharge.
The ESCO.hru parameter, with a near-maximum fitted value of 0.995, indicates that soil evaporation predominantly occurs from the uppermost soil layers. This suggests that the model is effectively capturing the evapotranspiration processes, which are critical for the accurate simulation of soil moisture dynamics and water balance. The t-Stat of 0.28 and p-value of 0.78 for ESCO.hru imply that, while it may not be the most statistically significant parameter, its calibrated value plays a crucial role in the overall model performance.
Other parameters, such as GWQMN.gw and GW_REVAP.gw, although less statistically significant, contribute to the model’s ability to simulate the baseflow and groundwater recharge processes. The GWQMN.gw parameter, with a fitted value of 1.455, sets a threshold for the groundwater contribution to the baseflow, and its p-value of 0.06 indicates a borderline significance. The low fitted value of GW_REVAP.gw at 0.09173 suggests a limited role in delaying groundwater recharge, while the REVAPMN.gw value of 64.76 mm suggests that a relatively low water depth in the shallow aquifer triggers the onset of the revaporation processes, which is critical for accurately simulating groundwater–surface water interactions.

3.3. Calibration and Validation Results

The calibration (2000–2010) and validation (2011–2015) of the Pativilca watershed using the SWAT hydrological model, conducted on a daily time step, yielded robust statistical metrics indicative of model performance. The NSE values were 0.69 and 0.72 for the calibration and validation periods, respectively, demonstrating satisfactory predictive capability with a good performance [31]. The R2 was 0.84 during the calibration and slightly lower at 0.82 during the validation, reflecting strong agreement between the observed and simulated daily flows, demonstrating a very good performance [31]. The PBIAS was −28.01% for the calibration and −22.51% for the validation, indicating a tendency for the model to underestimate the streamflow, particularly in the calibration phase, with a satisfactory performance [31]. The RSR was consistent at 0.54 for both periods, suggesting a moderate level of residual variance. The KGE improved from 0.60 during the calibration to 0.69 in the validation, underscoring the enhanced model reliability over time and validating the SWAT model’s applicability to the Pativilca watershed (Table 4; Figure 7).

3.4. Hydrologic Cycle and Water Balance Analysis

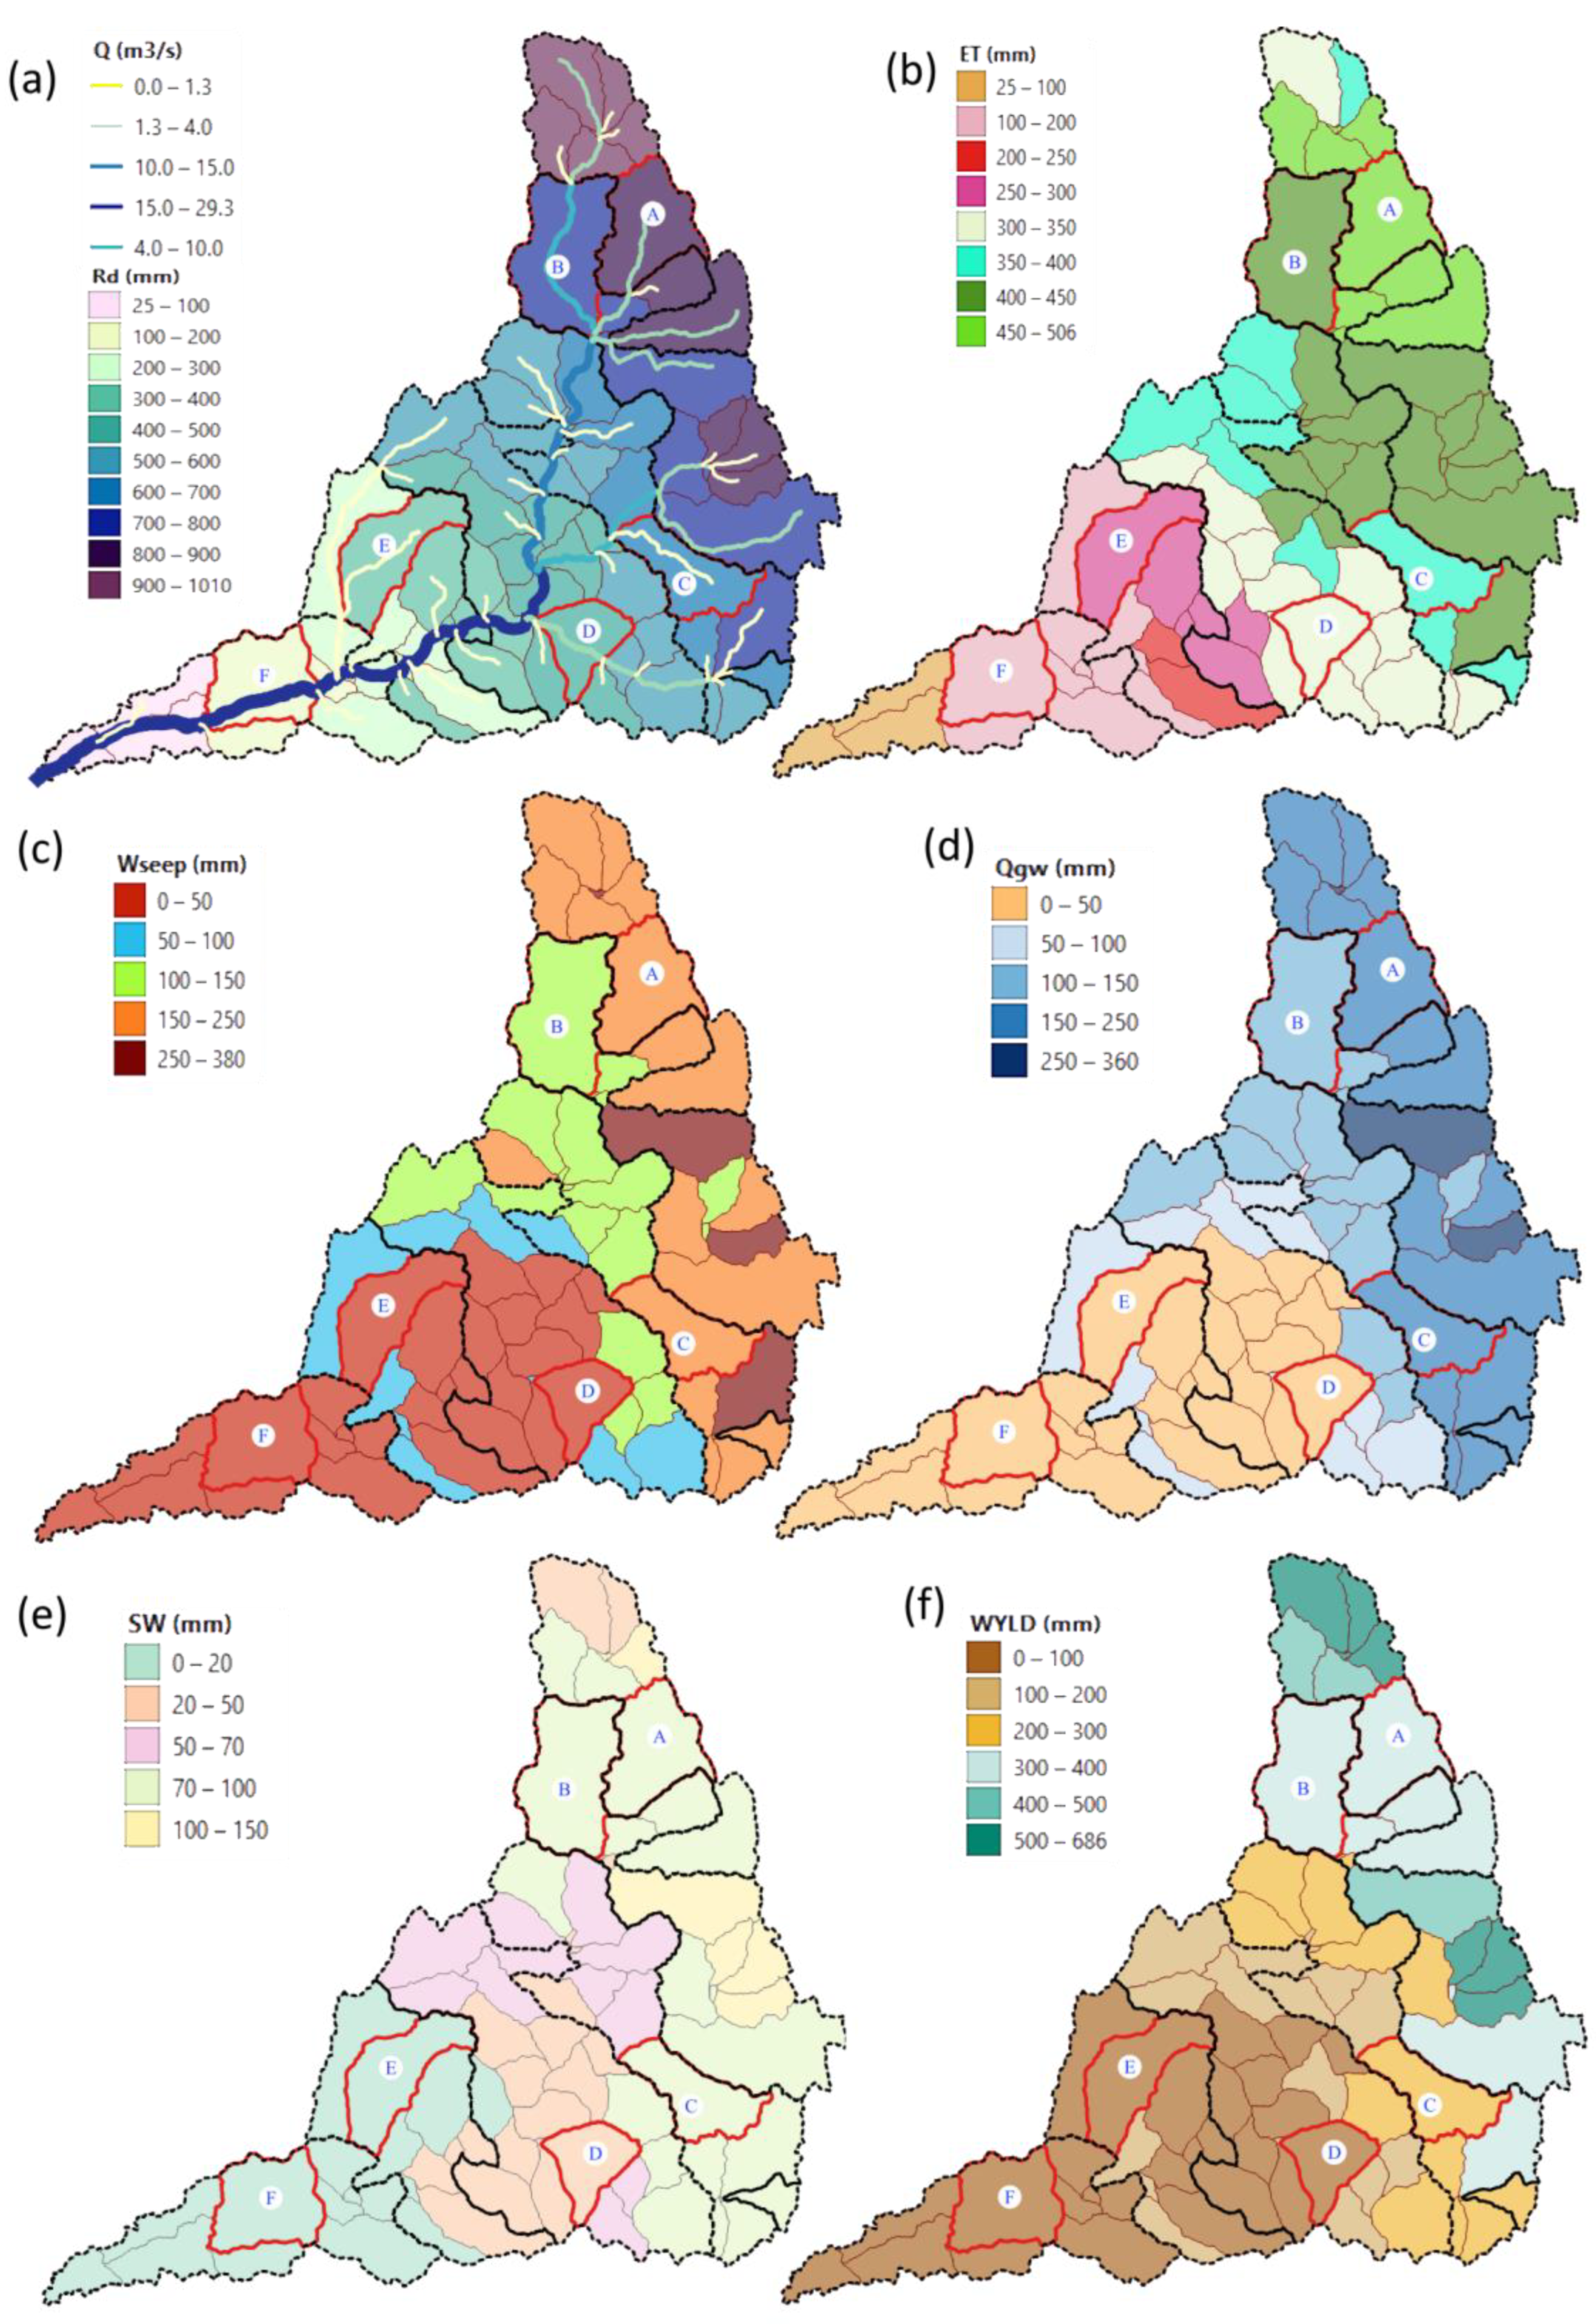
Figure 8 illustrates the spatial distribution of the key hydrological components within the Pativilca Basin. These components include annual precipitation (Rd), evapotranspiration (ET), percolation ( W s e e p ), groundwater contribution to streamflow (Qgw), water yield (WYLD), and the average daily soil water storage (SW) and river flow (Q in m3/s). The values for all the variables, except for the daily mean flow, are presented in millimeters (mm), representing their annual totals. This detailed representation provides a comprehensive understanding of how water is distributed and moves through the basin, offering crucial insights into the basin’s hydrological processes.
The hydrological behavior of the Pativilca Basin was comprehensively analyzed through a regionalized assessment of the watershed’s groups, considering the components of the hydrological cycle. In Group A, the highest-elevation basins (4091 to 4630 m a.s.l.) exhibited annual precipitation exceeding 870 mm, with significant soil water storage, particularly in larger basins such as watershed 73. The groundwater flow was also substantial, indicating a robust aquifer recharge capacity. The analysis of the maximum daily mean flows revealed that larger basins, such as watershed 30 (3.92 m3/s), had the highest values, reflecting their ability to manage large water volumes. Group B, characterized by elevations ranging from 2896 to 4874 m a.s.l., displayed diverse hydrological behavior, with watershed 63 standing out due to its high soil water storage (138 mm) and percolation (188 mm), which are critical for aquifer recharge. Despite its lower elevation and smaller area, watershed 19 had the highest maximum daily mean flow of the group (10.10 m3/s) as it acts as a critical accumulation point for flows, particularly from watershed 27. In Group C, where the basins have lower precipitation and variable elevations, the soil water retention varied according to the area and infiltration capacity, with larger basins like watershed 52 showing significant water storage (90 mm). The maximum daily mean flow of the group analysis indicated that watershed 15, with 15.98 m3/s, was the most significant in terms of flow management, especially given its role as an inter-basin. Group D, with elevations between 1499 and 4608 m a.s.l., demonstrated a wide range of hydrological behaviors, with larger basins such as watershed 31 being essential for water accumulation and distribution. The highest maximum daily mean flow was observed in watershed 11, with 27.64 m3/s, highlighting its importance in regional water management. These larger basins play a crucial role in regional water sustainability by managing the significant flows affecting both the upstream and downstream basins. In Group E, with the lowest annual precipitation, larger basins like watershed 57 showed good soil water storage. The highest maximum daily mean flow in the group was recorded in watershed 7 (Hydrometric Station Cahua) with 28.16 m3/s, emphasizing its role in the water redistribution in a low-precipitation area, acting as a critical inter-basin for the regional water sustainability. Lastly, in Group F, where the basins function as discharge zones, the highest maximum daily mean flows among all the groups were recorded, with watershed 3 reaching 30.12 m3/s. This underscores their role in redistributing large water volumes to both the surface and subsurface systems, making them essential for managing the region’s flow dynamics despite receiving low precipitation.
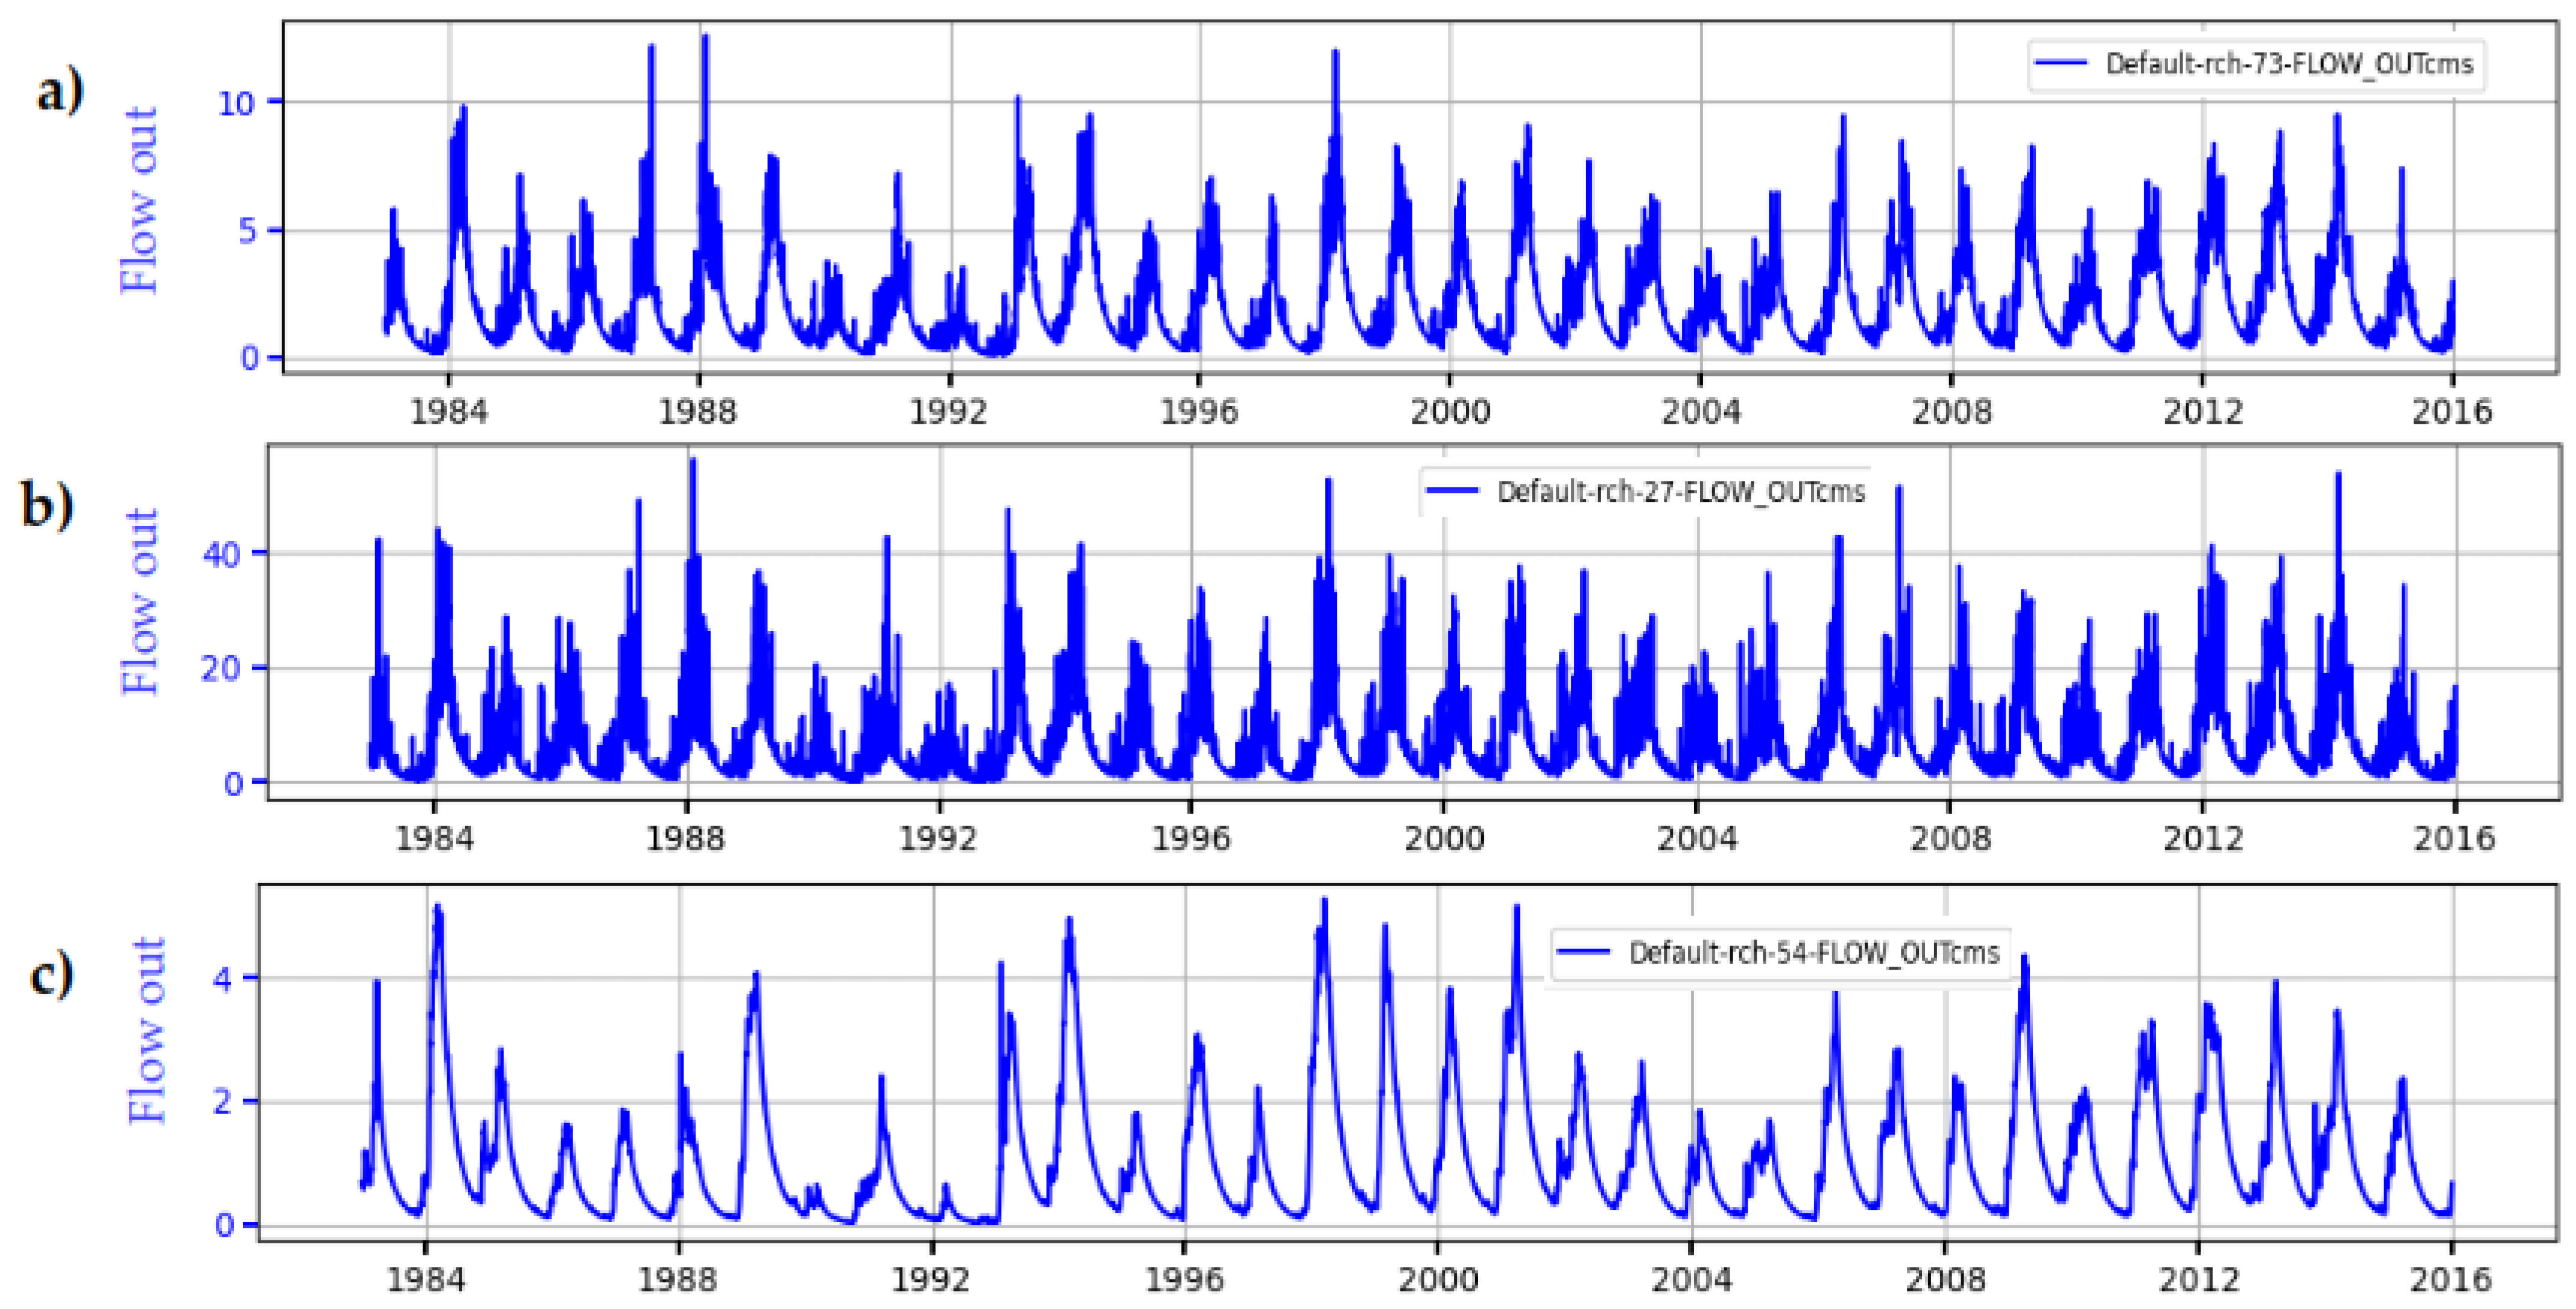
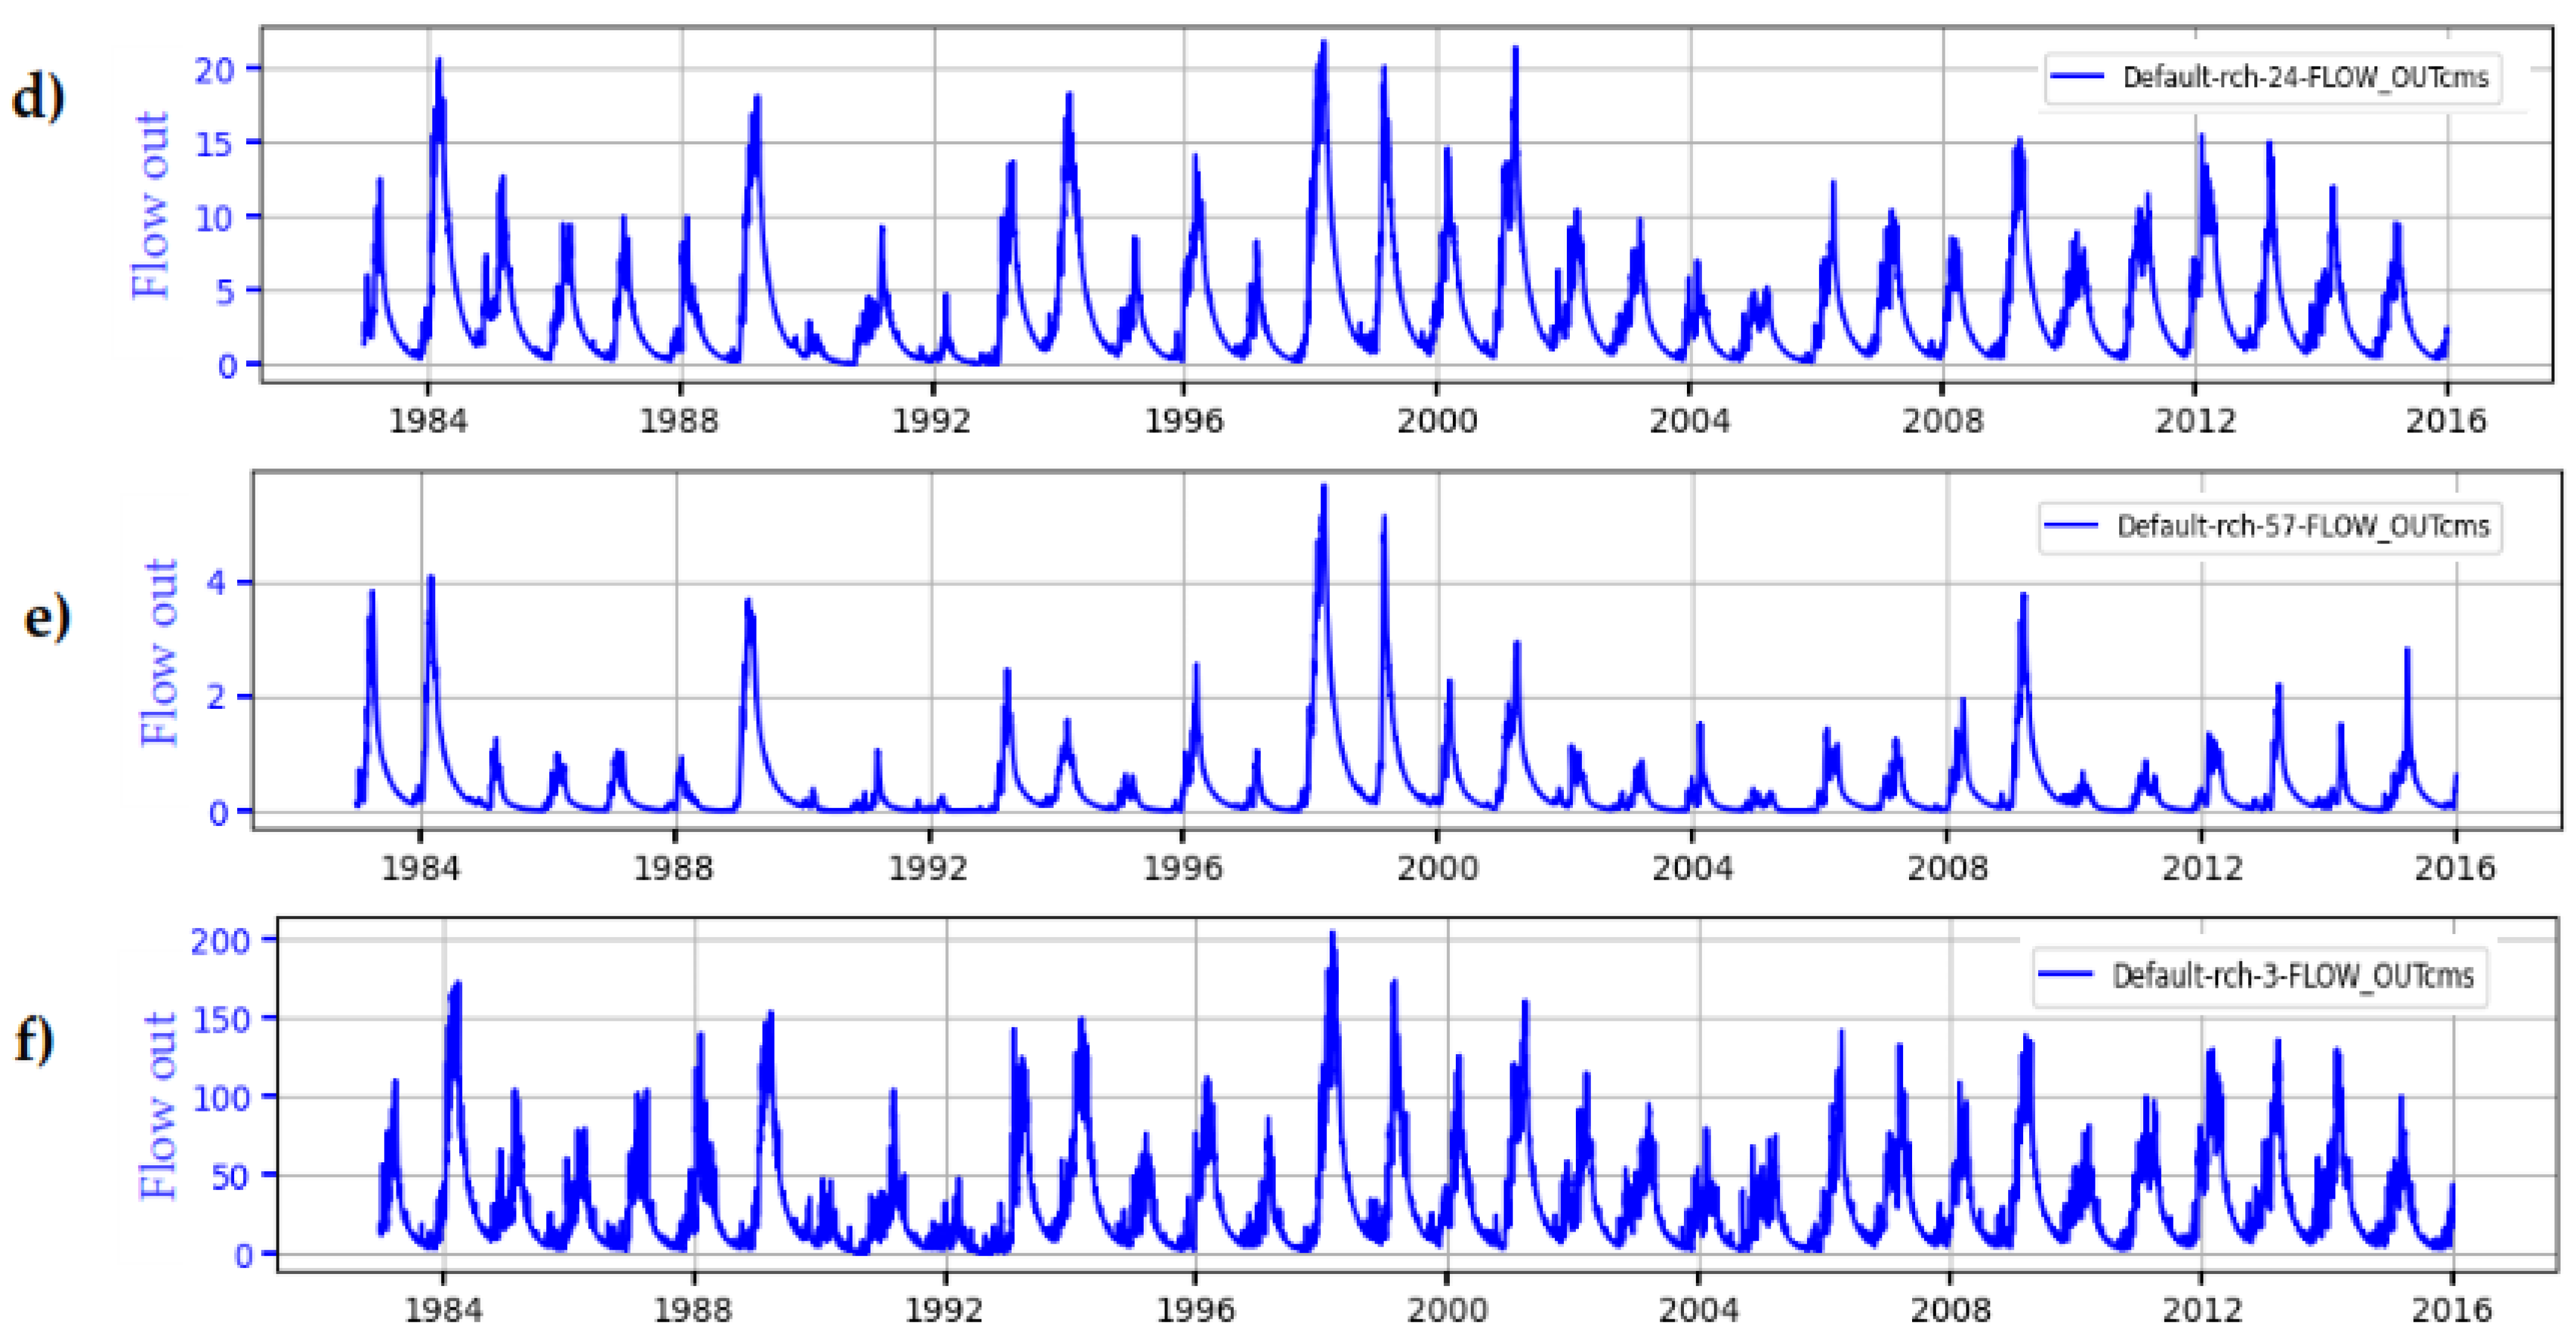
The analysis of the estimated daily flows between 1981 and 2015 for the representative watersheds of the Pativilca Basin reveals a marked seasonality pattern, with peaks recorded during the wet months (January to March) and lows during the dry months (June to September). In Group A, represented by watershed 73, the average daily flow reaches its maximum in March with 4.77 m3/s and decreases to 0.59 m3/s in September, reflecting the direct influence of seasonal precipitation in higher-altitude areas; this group shows a daily flow range from 1.00 to 12.00 m3/s (Figure 9a). Group B, corresponding to sub-watershed 27, exhibits higher flows with a maximum average of 16.53 m3/s in March and a minimum of 1.65 m3/s in August, indicating a greater capacity for water capture and storage at intermediate elevations, with a daily flow range from 1.74 to 52.70 m3/s (Figure 9b). Meanwhile, Group C, represented by watershed 54, shows lower flows, with a maximum of 2.51 m3/s in March and a minimum of 0.25 m3/s in October, reflecting a more limited storage capacity and significant dependence on seasonal precipitation; its daily flow varies between 0.15 and 5.28 m3/s (Figure 9c). Group D, represented by watershed 24, exhibits significant seasonal variation, with a maximum of 8.79 m3/s in March and a minimum of 0.86 m3/s in October, with a daily flow range from 0.95 to 21.80 m3/s, underscoring the importance of precipitation in maintaining flow (Figure 9d). In Group E, watershed 57 has the lowest daily flows, with a maximum of 1.30 m3/s in March and a minimum of 0.07 m3/s in October, denoting a limited storage capacity and high dependence on upstream contributions, with a range from 0.07 to 5.66 m3/s (Figure 9e). Finally, Group F, whose watersheds are located in the lower part of the Pativilca Basin, records the highest average daily flows, reaching 77.36 m3/s in March and decreasing to 7.75 m3/s in September, with a wide variability between 10.20 and 205 m3/s (Figure 9f), reflecting its crucial role as a discharge zone that receives and redistributes water from the upper watersheds. This analysis highlights the hydrological diversity within the Pativilca Basin, influenced by the altitude, storage capacity, and connectivity between the watersheds, with the wet months significantly contributing to the flow peaks, while, during the dry months, the watersheds rely on the redistribution of water from higher elevations.

4. Discussion

The Pativilca River Basin, located on the Peruvian coast, is situated in a semi-arid region. Due to the increasing demand for water and escalating social conflicts in the area, it is imperative to implement integrated water management strategies that ensure water security in the Andean basins. This can be achieved through adaptive water management in the context of climate change, particularly in response to glacio-hydrological and socioeconomic impacts [32]. Peru’s recent economic boom, driven by natural resource exports, has exacerbated the nation’s water crisis and forced the government to take measures to alleviate social tensions and meet the growing water demand from the burgeoning mining and agricultural industries. This trend signals future competition for water resources [33]. In the Pativilca Basin, conflicts have been recorded, such as the dispute over mining exploration near Lake Conococha, located at the headwaters of three major basins—Santa, Fortaleza, and Pativilca—adversely affecting the downstream agricultural activities [34]. This situation is further aggravated by inadequate distribution infrastructure, the absence of proper flow measurement systems, and a lack of systematic monitoring of water flows, resulting in limited knowledge of the actual irrigation water volumes being used. This has fueled conflicts among users and dissatisfaction with the water distribution services [35].
The findings of this study reveal different patterns of water availability in the Pativilca Basin, which can help to mitigate these conflicts. One of the major issues is the lack of adequate information for equitable water distribution. These results contribute to the integrated management of the water resources in the Pacific watershed, particularly given that 59% of the country’s energy comes from hydropower [36].
Furthermore, these findings will enhance the adaptive capacities in response to aspects such as climate change. The Nationally Determined Contributions (NDCs) emphasize the need for precise knowledge of water availability to inform climate adaptation policies [37].
Additionally, the results of this study provide a solid foundation for improving adaptive capacities in light of the projected impacts of climate change, particularly concerning water availability. Numerous studies have shown that climate change significantly alters the hydrological cycle, affecting precipitation patterns, evapotranspiration, and runoff, which in turn influence the water availability in watersheds [38,39]. These findings align with the priorities established in Peru’s NDC, which underscore the need for accurate water resource data to support adaptation and mitigation planning [37]. The integration of hydrological models with climate change scenarios is essential for anticipating the response of water systems to extreme events such as droughts and intense rainfall, which have already been documented in various regions worldwide [40,41]. In this context, the availability of tools to assess water availability and watershed vulnerability is crucial, as highlighted by the recent studies on water management in vulnerable environments [42]. These approaches not only improve the adaptive capacity but also strengthen the decision-making at both the government and community levels, facilitating the implementation of sustainable water management strategies, as recommended by international organizations within the framework of global climate agreements [43]. Furthermore, the relationship between the altitude and precipitation observed in the watersheds of the Pativilca Basin aligns with previous studies documenting the influence of topography on the spatial distribution of precipitation. Specifically, it is confirmed that higher-altitude watersheds, such as those in Groups A and B, receive greater annual precipitation volumes, which can be attributed to orographic effects that promote the condensation of ascending air masses [44,45]. This finding is consistent with the report by [46], which highlights the capacity of mountainous regions to act as natural water catchments, increasing precipitation in areas of higher elevation. However, the non-linearity observed in the altitude–precipitation relationship suggests the presence of other factors, such as relief orientation and local climatic variability, warranting a more detailed analysis in future studies [47,48].
Seasonality, particularly marked during the austral summer months (December to March), has significant implications for the hydrological recharge and water resource management in the basin [49]. The concentration of precipitation during this season underscores the importance of high-altitude watersheds as critical zones for aquifer recharge [50]. This is in line with the findings of [51], which emphasizes that mountainous watersheds play a crucial role in regional water regulation, especially in semi-arid regions. However, seasonal thermal variability, particularly in lower-altitude watersheds, poses challenges for hydrological modeling as higher temperatures may accelerate evapotranspiration, reducing the water availability during critical periods, especially during the dry months (May to September) [52,53].
The analysis of the hydrological cycle in the Pativilca Basin reveals complex patterns of hydrological connectivity, particularly in inter-watersheds that act as redistribution points for water. Higher-altitude watersheds, such as those in Group A, demonstrate greater capacity for soil water storage and percolation, which is essential for aquifer recharge [54,55]. These findings are supported by [56], which argues that a watershed’s ability to sustain flow during the dry season is directly related to its water storage capacity and hydrological connectivity. However, the increase in flow in lower-altitude watersheds due to contributions from upper sub-watersheds highlights the need for differentiated management strategies that consider both the accumulation and redistribution functions within the hydrological system [57].
In lower-altitude watersheds, such as those in Group F, the role of water outflow is fundamental to the flow regulation throughout the system. These watersheds not only receive water flow from the upper watersheds but also play a crucial role in the region’s hydrological stability, especially in contexts of limited seasonal precipitation [58,59]. This behavior is consistent with the observations in [51] on the importance of lower watersheds in flow regulation within complex hydrological systems.
Finally, the results obtained have direct implications for the calibration and validation of the SWAT model, where the spatial and temporal variability in the precipitation and temperatures must be precisely integrated. Furthermore, seasonality and hydrological connectivity should be considered key elements in assessing climate change scenarios and their impact on regional water resources [60,61]. The existing literature supports the importance of lower watersheds as water accumulators and redistributors, underscoring the need for integrated and adaptive management that can respond to climatic and topographic variations [62,63].

5. Conclusions

Regionalization and watershed delineation: The regionalization analysis revealed that the Pativilca Basin, located on the Pacific slope of Peru, is divided into six distinct hydrological regions. Each of these regions exhibits unique characteristics in terms of water availability, hydrological connectivity, and response to climatic variations, which are critical for effective water management strategies.
SWAT model calibration and validation: The SWAT model was successfully calibrated and validated against the observed streamflow data from the Cahua station, achieving satisfactory statistical performance. Key sensitive parameters, including CN2.mgt (curve number) and ALPHA_BF.gw (baseflow recession coefficient), were identified as crucial in accurately simulating the surface runoff and groundwater contributions. While the model performance is classified as good, it may still be within the acceptable range for the decision-making processes in water resource management. This validation demonstrates that the SWAT model is a robust tool for guiding the decision-making in hydrological planning and water resource management in the Pativilca Basin.
Hydrological availability and regional dynamics: The analysis of the water availability across the Pativilca Basin shows that Region A, located at higher elevations, experiences the highest water availability due to greater precipitation inputs. This region not only generates substantial runoff but also plays a pivotal role in aquifer recharge. Other key variables influencing water availability include evapotranspiration, soil moisture, and groundwater flow, which collectively regulate the hydrological balance. The lower-elevation regions benefit from hydrological contributions from these upper watersheds, maintaining system-wide connectivity and supporting the downstream water supply, particularly during the dry season.
Importance of seasonality and hydrological connectivity: Seasonality has been identified as a critical factor shaping the hydrological dynamics of the Pativilca Basin. During the wet season, the watersheds in Groups A and B maintain substantial flows, which contribute to both surface and subsurface water systems. In contrast, during the dry season, the intermediate and lower watersheds rely heavily on water transfer from the upper regions to sustain flow, highlighting the importance of hydrological connectivity. The watersheds in Group F, located at the lower elevations, function as discharge zones, effectively managing and redistributing water from the upper catchments.

Supplementary Materials

The following supporting information can be downloaded at https://www.mdpi.com/article/10.3390/hydrology11100165/s1.

Author Contributions

Conceptualization, W.L.-C. and Y.P.-H.; methodology, W.L.-C. and Y.P.-H.; software, Y.P.-H.; validation, W.L.-C. and Y.P.-H.; formal analysis, M.Z. and R.P.; investigation, Y.P.-H.; resources, Y.P.-H. and M.Z.; writing—original draft preparation, Y.P.-H. and M.Z.; writing—review and editing, Y.P.-H. and R.P.; visualization, M.Z.; supervision, W.L.-C.; project administration, Y.P.-H. All authors have read and agreed to the published version of the manuscript.

Funding

This research received no external funding.

Data Availability Statement

Data are contained within the article; the available data can be requested by contacting the corresponding author via email.

Acknowledgments

The authors extend their appreciation to Universidad Nacional Santiago Antúnez de Mayolo (UNASAM), Research Center for Environmental Earth Science and Technology (ESAT), and Universidad Nacional Agraria La Molina (UNALM) for providing academic support during the entire investigation.

Conflicts of Interest

The authors declare no conflicts of interest.

References

  1. Shemer, H.; Wald, S.; Semiat, R. Challenges and Solutions for Global Water Scarcity. Membranes 2023, 13, 612. [Google Scholar] [CrossRef] [PubMed]
  2. United Nations. The Sustainable Development Goals Report 2024; United Nations: San Francisco, CA, USA, 2024. [Google Scholar]
  3. Cullen, K.A. A review of applications of remote sensing for drought studies in the Andes region. J. Hydrol. Reg. Stud. 2023, 49, 101483. [Google Scholar] [CrossRef]
  4. Fernandez, N.; Camacho, L.A.; Nejadhashemi, A.P. Modeling streamflow in headwater catchments: A data-based mechanistic grounded framework. J. Hydrol. Reg. Stud. 2022, 44, 101243. [Google Scholar] [CrossRef]
  5. Muñoz, R.; Huggel, C.; Drenkhan, F.; Vis, M.; Viviroli, D. Comparing model complexity for glacio-hydrological simulation in the data-scarce Peruvian Andes. J. Hydrol. Reg. Stud. 2021, 37, 100932. [Google Scholar] [CrossRef]
  6. Aloui, S.; Mazzoni, A.; Elomri, A.; Aouissi, J.; Boufekane, A.; Zghibi, A. A review of Soil and Water Assessment Tool (SWAT) studies of Mediterranean catchments: Applications, feasibility, and future directions. J. Environ. Manag. 2023, 326, 116799. [Google Scholar] [CrossRef]
  7. Janjić, J.; Tadić, L. Fields of Application of SWAT Hydrological Model—A Review. Earth 2023, 4, 331–344. [Google Scholar] [CrossRef]
  8. Hlaing, P.T.; Humphries, U.W.; Waqas, M. Hydrological model parameter regionalization: Runoff estimation using machine learning techniques in the Tha Chin River Basin, Thailand. MethodsX 2024, 13, 102792. [Google Scholar] [CrossRef]
  9. Ha, L.T.; Bastiaanssen, W.G.M.; van Griensven, A.; van Dijk, A.I.J.M.; Senay, G.B. Calibration of Spatially Distributed Hydrological Processes and Model Parameters in SWAT Using Remote Sensing Data and an Auto-Calibration Procedure: A Case Study in a Vietnamese River Basin. Water 2018, 10, 212. [Google Scholar] [CrossRef]
  10. Fernandez-Palomino, C.A.; Hattermann, F.F.; Krysanova, V.; Lobanova, A.; Vega-Jácome, F.; Lavado, W.; Santini, W.; Aybar, C.; Bronstert, A. A Novel High-Resolution Gridded Precipitation Dataset for Peruvian and Ecuadorian Watersheds: Development and Hydrological Evaluation. J. Hydrometeorol. 2022, 23, 309–336. [Google Scholar] [CrossRef]
  11. Huerta, A.; Aybar, C.; Imfeld, N.; Correa, K.; Felipe-Obando, O.; Rau, P.; Drenkhan, F.; Lavado-Casimiro, W. High-resolution grids of daily air temperature for Peru-the new PISCOt v1.2 dataset. Sci. Data 2023, 10, 847. [Google Scholar] [CrossRef]
  12. Dayal, D.; Pandey, A.; Gupta, P.K.; Kalura, P. Investigating the utility of satellite-based precipitation products for simulating extreme discharge events: An exhaustive model-driven approach for a tropical river basin in India. Environ. Monit. Assess. 2024, 196, 608. [Google Scholar] [CrossRef] [PubMed]
  13. Ningthoujam, V.; Romeji, N. SWAT Model Calibration and Validation with Remotely Sensed Evapotranspiration data in Maklang-Tuyungbi-Taret lok Ungauged Basin in Manipur, India. Iran. J. Sci. Technol. Trans. Civ. Eng. 2024, 1–17. [Google Scholar] [CrossRef]
  14. Qquenta, J.; Rau, P.; Bourrel, L.; Frappart, F.; Lavado-Casimiro, W. Assessment of Bottom-Up Satellite Precipitation Products on River Streamflow Estimations in the Peruvian Pacific Drainage. Remote. Sens. 2024, 16, 11. [Google Scholar] [CrossRef]
  15. Shree, S.; Kumar, M. Assessment of the Impact of Land Use and Land Cover Change on Hydrological Components of the Upper Watershed of Subarnarekha River Basin, Jharkhand, India Using SWAT Model. Water Conserv. Sci. Eng. 2023, 8, 50. [Google Scholar] [CrossRef]
  16. Singh, S.K.; Kanga, S.; Gulati, B.; Raič, M.; Sajan, B.; Đurin, B.; Singh, S. Spatial and Temporal Analysis of Hydrological Modelling in the Beas Basin Using SWAT+ Model. Water 2023, 15, 3338. [Google Scholar] [CrossRef]
  17. Bennour, A.; Jia, L.; Menenti, M.; Zheng, C.; Zeng, Y.; Barnieh, B.A.; Jiang, M. Calibration and Validation of SWAT Model by Using Hydrological Remote Sensing Observables in the Lake Chad Basin. Remote. Sens. 2022, 14, 1511. [Google Scholar] [CrossRef]
  18. Immerzeel, W.W.; Droogers, P. Calibration of a distributed hydrological model based on satellite evapotranspiration. J. Hydrol. 2008, 349, 411–424. [Google Scholar] [CrossRef]
  19. N’guessan, J.Y.K.; Adahi, B.M.; Konan-Waidhet, A.B.; Kra, J.L.; Koffi, B.; Habel, M.; Brou, D.; Hironobu, S.; Assidjo, E.N. Using the SWAT+ model to assess the conditions of water inflow to a reservoir in an uncontrolled agricultural catchment. Case Study of the Nanan Reservoir in the Lake Taabo catchment (Côte d’Ivoire). Ecohydrol. Hydrobiol. 2024, 24, 568–582. [Google Scholar] [CrossRef]
  20. Zhang, K.; Chen, H.; Ma, N.; Shang, S.; Wang, Y.; Xu, Q.; Zhu, G. A global dataset of terrestrial evapotranspiration and soil moisture dynamics from 1982 to 2020. Sci. Data 2024, 11, 445. [Google Scholar] [CrossRef]
  21. ANA (Autoridad Nacional del Agua) Evaluación de Recursos Hídricos en la Cuenca del río Pativilca Disponible. Available online: https://hdl.handle.net/20.500.12543/3 (accessed on 22 August 2024).
  22. Chen, J.; Chen, J. GlobeLand30: Operational global land cover mapping and big-data analysis. Sci. China Earth Sci. 2018, 61, 1533–1534. [Google Scholar] [CrossRef]
  23. Jun, C.; Ban, Y.; Li, S. Open access to Earth land-cover map. Nature 2014, 514, 434. [Google Scholar] [CrossRef]
  24. FAO (The Food and Agriculture Organization) FAO Map Catalog Disponible. Available online: https://data.apps.fao.org/map/catalog/srv/eng/catalog.search#/metadata/446ed430-8383-11db-b9b2-000d939bc5d8 (accessed on 30 August 2024).
  25. Arnold, J.G.; Kiniry, J.R.; Srinivasan, R.; Williams, J.R.; Haney, E.B.; Neitsch, S.L. Input/Output Documentation Soil & Water Assessment Tool; Texax Water Resources Institute: Thrall, TX, USA, 2012; pp. 1–650. [Google Scholar]
  26. Kausher, R.; Singh, R.; Sinha, A.K. Hydrological modeling and simulation of water balance components using the SWAT model in the coal mining province of the Mahan River catchment, Central India. Environ. Earth Sci. 2024, 83, 185. [Google Scholar] [CrossRef]
  27. Wang, K.; Yue, D.; Zhang, H. Runoff Simulation of the Upstream Watershed of the Feiling Hydrological Station in the Qinhe River Based on the SWAT Model. Water 2024, 16, 1044. [Google Scholar] [CrossRef]
  28. Neitsch, S.L.; Arnold, J.G.; Kiniry, J.R.; Williams, J.R. Soil and Water Assessment Tool Theoretical Documentation Version 2009; Texas Water Resources Institute: College Station, TX, USA, 2011. [Google Scholar]
  29. Li, B.; Feng, Q.; Wang, Y. Historical and future runoff changes and their impacts on stormflow characteristics in the upper Yangtze River basin, China. CATENA 2024, 235, 107684. [Google Scholar] [CrossRef]
  30. Barresi Armoa, O.L.; Sauvage, S.; Houska, T.; Bieger, K.; Schürz, C.; Sánchez Pérez, J.M. Representation of Hydrological Components under a Changing Climate—A Case Study of the Uruguay River Basin Using the New Version of the Soil and Water Assessment Tool Model (SWAT+). Water 2023, 15, 2604. [Google Scholar] [CrossRef]
  31. Li, C.; Fang, H. Assessment of climate change impacts on the streamflow for the Mun River in the Mekong Basin, Southeast Asia: Using SWAT model. CATENA 2021, 201, 105199. [Google Scholar] [CrossRef]
  32. Izaguirre Liviac, M.F.; Drenkhan, F.; Timaná, M. Actual y futura disponibilidad del agua en un contexto de inseguridad hídrica en la subcuenca de Parón, cuenca del río Santa, Perú. Rev. Kawsaypacha. Soc. y Medio Ambient. 2024, 13. [Google Scholar] [CrossRef]
  33. Paerregaard, K.; Ullberg, S.B.; Brandshaug, M. Smooth flows? Hydrosocial communities, water governance and infrastructural discord in Peru’s southern highlands. Water Int. 2020, 45, 169–188. [Google Scholar] [CrossRef]
  34. Defensoría del pueblo del Perú. Reporte de Conflictos Sociales n° 84 Adjuntía para la Prevención de Conflictos Sociales y la Gobernabilidad. 2011. Available online: https://www.defensoria.gob.pe/wp-content/uploads/2018/07/reporte-84.pdf (accessed on 3 October 2024).
  35. MINAGRI-ANA Proyecto. Obras de Control y Medición de Agua por Bloques de Riego en el Valle Lurín; MINAGRI-ANA Proyecto, 2008. Lima, Peru. Available online: http://www.ana.gob.pe/sites/default/files/publication/files/informe_principal_moche_0.pdf (accessed on 3 October 2024).
  36. Cruz Castello, F.S.; Mujica San Martín, M.E.; Alvarez Lam, J.; Leslie, J. Cambio Climático, Agua y Desarrollo Humano. 2013. Available online: https://www.undp.org/es/peru/publicaciones/idhperu2013 (accessed on 3 October 2024).
  37. MINAM Contribuciones Nacionalmente Determinadas|Dirección General de Cambio Climático y Desertificación Disponible. Available online: https://www.minam.gob.pe/cambioclimatico/ndc/ (accessed on 18 September 2024).
  38. IPCC Climate Change 2021: The Physical Science Basis|Climate Change 2021: The Physical Science Basis Disponible. Available online: https://www.ipcc.ch/report/ar6/wg1/ (accessed on 18 September 2024).
  39. Sun, X.; Wang, G.; Sun, J.; Song, C.; Hu, Z.; Lin, S. More intense and less elevation-dependent hydrological intensity from 2000 to 2015 in the high mountains. Clim. Dyn. 2024, 1–18. [Google Scholar] [CrossRef]
  40. Clark, M.P.; Fan, Y.; Lawrence, D.M.; Adam, J.C.; Bolster, D.; Gochis, D.J.; Hooper, R.P.; Kumar, M.; Leung, L.R.; Mackay, D.S.; et al. Improving the representation of hydrologic processes in Earth System Models. Water Resour. Res. 2015, 51, 5929–5956. [Google Scholar] [CrossRef]
  41. Hagemann, S.; Chen, C.; Clark, D.B.; Folwell, S.; Gosling, S.N.; Haddeland, I.; Hanasaki, N.; Heinke, J.; Ludwig, F.; Voss, F.; et al. Climate change impact on available water resources obtained using multiple global climate and hydrology models. Earth Syst. Dyn. 2013, 4, 129–144. [Google Scholar] [CrossRef]
  42. Vörösmarty, C.J.; Green, P.; Salisbury, J.; Lammers, R.B. Global water resources: Vulnerability from climate change and population growth. Science 2000, 289, 284–288. [Google Scholar] [CrossRef] [PubMed]
  43. UNFCCC The Paris Agreemen Disponible. Available online: https://unfccc.int/process-and-meetings/the-paris-agreement (accessed on 18 September 2024).
  44. Fu, A.; Yu, W.; Bashir, B.; Yao, X.; Zhou, Y.; Sun, J.; Alsalman, A.; Alsafadi, K. Remotely Sensed Changes in Qinghai–Tibet Plateau Wetland Ecosystems and Their Response to Drought. Sustainability 2024, 16, 4738. [Google Scholar] [CrossRef]
  45. Jin, C.; Wang, B.; Cheng, T.F.; Dai, L.; Wang, T. How much we know about precipitation climatology over Tianshan Mountains––the Central Asian water tower. npj Clim. Atmos. Sci. 2024, 7, 21. [Google Scholar] [CrossRef]
  46. Buytaert, W.; De Bièvre, B.; Wyseure, G.; Deckers, J. The use of the linear reservoir concept to quantify the impact of changes in land use on the hydrology of catchments in the Andes. Hydrol. Earth Syst. Sci. 2004, 8, 108–114. [Google Scholar] [CrossRef]
  47. Li, Q.; Gao, X.; Li, J.; Yan, A.; Chang, S.; Song, X.; Lo, K. Nonlinear time effects of vegetation response to climate change: Evidence from Qilian Mountain National Park in China. Sci. Total. Environ. 2024, 933, 173149. [Google Scholar] [CrossRef]
  48. Ougahi, J.H.; Saeed, S.; Hasan, K. Assessment of Hydro-climatic Variables and Its Impact on River Flow Regime in the Sub-basins of the Upper Indus Basin. Earth Syst. Environ. 2023, 7, 307–320. [Google Scholar] [CrossRef]
  49. Shrestha, S.; Bhatta, B.; Shrestha, M.; Shrestha, P.K. Integrated assessment of the climate and landuse change impact on hydrology and water quality in the Songkhram River Basin, Thailand. Sci. Total. Environ. 2018, 643, 1610–1622. [Google Scholar] [CrossRef] [PubMed]
  50. Cai, P.; Li, R.; Guo, J.; Xiao, Z.; Fu, H.; Guo, T.; Wang, T.; Zhang, X.; Song, X. Spatiotemporal dynamics of groundwater in Henan Province, Central China and their driving factors. Ecol. Indic. 2024, 166, 112372. [Google Scholar] [CrossRef]
  51. Viviroli, D.; Dürr, H.H.; Messerli, B.; Meybeck, M.; Weingartner, R. Mountains of the world, water towers for humanity: Typology, mapping, and global significance. Water Resour. Res. 2007, 43, 7447. [Google Scholar] [CrossRef]
  52. Langs, L.E.; Petrone, R.M.; Pomeroy, J.W. Subalpine forest water use behaviour and evapotranspiration during two hydrologically contrasting growing seasons in the Canadian Rockies. Hydrol. Process. 2021, 35, e14158. [Google Scholar] [CrossRef]
  53. De Costa, D.d.A.; Bayissa, Y.; Villas-Boas, M.D.; Maskey, S.; Lugon Junior, J.; da Silva Neto, A.J.; Srinivasan, R. Water availability and extreme events under climate change scenarios in an experimental watershed of the Brazilian Atlantic Forest. Sci. Total. Environ. 2024, 946, 174417. [Google Scholar] [CrossRef] [PubMed]
  54. Nigro, M.; Penna, D.; Baneschi, I.; Castelli, G.; Dani, A.; Menichini, M.; Piemontese, L.; Trucchi, P.; Preti, F.; Doveri, M.; et al. The selection of paired watersheds affects the assessment of wildfire hydrological impacts. Sci. Total. Environ. 2024, 941, 173488. [Google Scholar] [CrossRef] [PubMed]
  55. Ouyang, Y.; Stanturf, J.A.; Williams, M.D.; Botmann, E.; Madsen, P. Quantification of Mountainous Hydrological Processes in the Aktash River Watershed of Uzbekistan, Central Asia, over the Past Two Decades. Hydrology 2023, 10, 161. [Google Scholar] [CrossRef]
  56. Spencer, S.A.; Anderson, A.E.; Silins, U.; Collins, A.L. Hillslope and groundwater contributions to streamflow in a Rocky Mountain watershed underlain by glacial till and fractured sedimentary bedrock. Hydrol. Earth Syst. Sci. 2021, 25, 237–255. [Google Scholar] [CrossRef]
  57. Davids, J.C.; Rutten, M.M.; Shah, R.D.T.; Shah, D.N.; Devkota, N.; Izeboud, P.; Pandey, A.; van de Giesen, N. Quantifying the connections—Linkages between land-use and water in the Kathmandu Valley, Nepal. Environ. Monit. Assess. 2018, 190, 304. [Google Scholar] [CrossRef]
  58. Wang, L.; Wei, W.; Sun, G.; Fu, B.; Chen, L.; Feng, X.; Ciais, P.; Mitra, B.; Wang, L. Effects of inter-basin transfers on watershed hydrology and vegetation greening in a large inland river basin. J. Hydrol. 2024, 635, 131234. [Google Scholar] [CrossRef]
  59. Simedo, M.B.L.; Pissarra, T.C.T.; Martins, A.L.M.; Lopes, M.C.; Costa, R.C.A.; Zanata, M.; Pacheco, F.A.L.; Fernandes, L.F.S. The assessment of hydrological availability and the payment for ecosystem services: A pilot study in a brazilian headwater catchment. Water 2020, 12, 2726. [Google Scholar] [CrossRef]
  60. Uniyal, B.; Kosatica, E.; Koellner, T. Spatial and temporal variability of climate change impacts on ecosystem services in small agricultural catchments using the Soil and Water Assessment Tool (SWAT). Sci. Total. Environ. 2023, 875, 162520. [Google Scholar] [CrossRef]
  61. Dapin, I.G.; Ella, V.B. Simulating climate variability impacts on streamflow of the layawan river watershed using the swat model. Int. Agric. Eng. J. 2020, 29, 9–23. [Google Scholar]
  62. He, Y.; Xiong, J.; Guo, S.; Zhong, S.; Yu, C.; Ma, S. Using Multi-Source Data to Assess the Hydrologic Alteration and Extremes under a Changing Environment in the Yalong River Basin. Water 2023, 15, 1357. [Google Scholar] [CrossRef]
  63. Li, T.; Wang, H.; Fang, Z.; Liu, G.; Zhang, F.; Zhang, H.; Li, X. Integrating river health into the supply and demand management framework for river basin ecosystem services. Sustain. Prod. Consum. 2022, 33, 189–202. [Google Scholar] [CrossRef]
Figure 1. Geographical map of the Pativilca River Basin (a) study area in Peru; (b) study area in Ancash and Lima regions; (c) study area with elevation and rivers in the basin.
Hydrology 11 00165 g001
Figure 2. Spatial distribution of slope, land cover, and type soil in the Pativilca Basin. (a) Shows how the slope changes, with steeper areas mostly up in the upper part of the basin; (b) maps out the land cover, including vegetation, farms, and urban spots; and (c) highlights the soil types, showing how they affect water retention and erosion throughout the basin.
Hydrology 11 00165 g002
Figure 3. Methodological flowchart.
Hydrology 11 00165 g003
Figure 4. Cluster dendrogram for the regionalization of catchments in the Pativilca Basin. The dendrogram delineates six distinct catchment groups (A–F), represented by color-coded branches. Each group’s representative catchment is highlighted in pink. The vertical axis reflects the degree of dissimilarity between the catchments, with greater heights indicating higher dissimilarity. This regionalization was achieved using hierarchical clustering based on Euclidean distances, facilitating the identification of hydrologically similar catchment groups for further analysis.
Hydrology 11 00165 g004
Figure 5. Regionalization of watersheds in the Pativilca Basin and selection of representative watersheds.
Hydrology 11 00165 g005
Figure 6. Seasonal variations in precipitation, maximum, and minimum temperatures in the Pativilca Basin regions. The first column (blue bars) represents monthly precipitation, while red bars indicate maximum temperatures and orange bars depict minimum temperatures. The groups are arranged vertically from top to bottom, starting with Group A at the uppermost position and concluding with Group F at the lowest. These graphs highlight the temporal distribution and variability in key climatic variables across different seasons, enabling the assessment of seasonal trends and their impact on hydrological processes in the basin.
Hydrology 11 00165 g006
Figure 7. Calibration and validation at the Cahua hydrometric station.
Hydrology 11 00165 g007
Figure 8. Spatial distribution of hydrological components in the Pativilca Basin. The hydrological components include (a) flow out daily mean (Q) and annual precipitation (Rd), (b) evapotranspiration (ET), (c) percolation (Wseep), (d) groundwater contribution to streamflow (Qgw), (e) average daily soil water storage (SW), and (f) water yield (WYLD). Each map illustrates the spatial variability across the basin, highlighting the hydrological dynamics. The representative watersheds are bordered in red, indicating their respective groups at the center. Group boundaries are depicted with black dotted lines, enhancing the differentiation between zones. These visual elements allow for a detailed analysis of the distribution and influence of key hydrological processes across the basin’s distinct regions.
Hydrology 11 00165 g008
Figure 9. Temporal distribution of streamflow in the Pativilca Basin. Daily streamflows from 1981 to 2015 show a clear seasonal pattern, with peak flows during the wet season (January to March) and lows in the dry season (June to September). Flow variation is driven by altitude, storage capacity, and watershed connectivity, with lower watersheds redistributing water from upstream areas.
Hydrology 11 00165 g009aHydrology 11 00165 g009b
Table 1. Datasets used in this study.
DatasetsScale/ResolutionData Availability/Source
SRTM DEM30 mThis https://earthexplorer.usgs.gov/ (accessed on 30 September 2024)
Land Cover30 mThe data are openly available at http://www.globallandcover.com/ (accessed on 30 September 2024)
and validated by [22,23] (accessed on 30 September 2024)
Type Soil1:5,000,000https://data.apps.fao.org/map/catalog/srv/eng/catalog.search#/metadata/446ed430-8383-11db-b9b2-000d939bc5d8 (accessed on 30 September 2024) [24]
PISCO SENAMHI10 kmThe daily precipitation and temperature data were acquired from https://iridl.ldeo.columbia.edu/SOURCES/.SENAMHI/.HSR/.PISCO/index.html?Set-Language=es (accessed on 30 September 2024)
RAIN4PE10 kmThe daily precipitation was acquired from https://dataservices.gfz-potsdam.de/pik/showshort.php?id=6f766e20-2d94-11eb-9603-497c92695674 (accessed on 30 September 2024) [10]
Hydrometric datadailyThe observed flows were obtained from https://snirh.ana.gob.pe/VisorPorCuenca/ (accessed on 30 September 2024)
Table 2. Calibration parameters obtained in the Pativilca Basin.
ParametersDescriptionTypeLow ValueHigh ValueFitted Value
CN2.mgtSurface runoffrelative change−0.50.5−0.355500
ALPHA_BF.gwBase flow factorReplace010.855500
GW_DELAY.gwGround water delayReplace3045081.029999
GWQMN.gwBase flowReplace021.455000
ESCO.hruSoil evaporation factorReplace0.0110.994555
GW_REVAP.gwGround water delayReplace0.020.20.091730
REVAPMN.gwThreshold water depth of shallow aquiferReplace0.0150064.758705
Table 3. Global sensitivity assessment for calibration parameters.
Parameterst-Statp-Value
1CN2.mgt55.350.00
2GWQMN.gw−1.860.06
3GW_DELAY.gw−1.480.14
4GW_REVAP.gw−0.060.95
5ALPHA_BF.gw0.240.81
6ESCO.hru0.280.78
7REVAPMN.gw0.500.61
Table 4. Calibration and validation measuring coefficients.
CoefficientCalibrationValidation
NSE0.690.72
R20.840.82
PBIAS−28.01−22.51
RSR0.540.54
KGE0.600.69
Disclaimer/Publisher’s Note: The statements, opinions and data contained in all publications are solely those of the individual author(s) and contributor(s) and not of MDPI and/or the editor(s). MDPI and/or the editor(s) disclaim responsibility for any injury to people or property resulting from any ideas, methods, instructions or products referred to in the content.