Article

Expanding Karst Groundwater Tracing Techniques: Incorporating Population Genetic and Isotopic Data to Enhance Flow-Path Characterization

by
Benjamin W. Tobin
1,*,
Benjamin V. Miller
2,
Matthew L. Niemiller
3 and
Andrea M. Erhardt
4
1
Kentucky Geological Survey, University of Kentucky, Lexington, KY 40506, USA
2
Lower Mississippi Gulf Water Science Center, United States Geological Survey, Nashville, TN 37211, USA
3
Biological Sciences, University of Alabama in Huntsville, Huntsville, AL 35899, USA
4
Earth and Environmental Science, University of Kentucky, Lexington, KY 40506, USA
*
Author to whom correspondence should be addressed.
Hydrology 2024, 11(2), 23; https://doi.org/10.3390/hydrology11020023
Submission received: 21 November 2023 / Revised: 18 January 2024 / Accepted: 31 January 2024 / Published: 4 February 2024

Abstract

:
Karst aquifers are unique among groundwater systems because of variable permeability and flow-path organization changes resulting from dissolution processes. Over time, changes in flow-path connectivity complicate interpretations of conduit network evolution in karst hydrogeology. Natural and artificial tracer techniques have long provided critical information for protecting karst aquifers and understanding the potential impacts on ecosystems and human populations. Conventional tracer methods are useful in karst hydrogeologic studies for delineating flow paths and defining recharge, storage, and discharge properties. However, these methods only provide snapshots of the current conditions and do not provide sufficient information to understand the changes in interconnection or larger-scale evolution of flow paths in the aquifer over time. With advances in population genetics, it is possible to assess population connectivity, which may provide greater insights into complex groundwater flow paths. To assess this potential, we combined the more traditional approaches collected in this and associated studies, including artificial (dye) and natural (geochemistry, isotopes, and discharge) tracers, with the population genetic data of a groundwater crustacean to determine whether these data can provide insights into seasonal or longer changes in connections between conduits. The data collected included dye trace, hydrographs, geochemistry, and asellid isopod (Caecidotea bicrenenta) population genetics in Fern Cave, AL, USA, a 25 km-long cave system. Combined, these data show the connections between two separate flow paths during flood events as the downstream populations of isopods belonging to the same subpopulation were measured in both systems. Additionally, the sub-populations found in higher elevations of the cave suggest a highly interconnected unsaturated zone that allows for genetic movement in the vadose zone. Although upstream populations show some similarities in genetics, hydrologic barriers, in the form of large waterfalls, likely separate populations within the same stream.

1. Introduction

Karst groundwater systems are some of the most prolific aquifers and provide water for a large portion of the world [1]. At the same time, flooding and groundwater contamination in these systems threaten both the people and ecosystems that depend on them [2]. Research has continually shown that the complex and highly connected nature of karst groundwater, with rapid infiltration and complex flow paths, is an underlying challenge for mitigating contamination, e.g., [3,4]. Additionally, these complex flow paths control flooding behavior [5], making it difficult to predict floods in karst groundwater systems [6,7].
To provide basic information on the potential and actual impacts of these karst hazards on both the ecosystems and human habitation in karst regions, the research has focused on quantifying the flow paths and drainage properties in karst groundwater systems [2]. Artificial tracers, natural tracers, hydrograph analyses, conduit mapping, and modelling efforts have long been employed to understand the pathways that water takes from sinking on the surface to emerging at springs [8]. While valuable, these methods are limited [8]. Natural tracers and hydrograph analyses provide a lumped estimate of the overall patterns of storage and response of all components of the system since they are often focused on specific monitoring points along a flow path, usually at a spring [9]. The direct mapping of conduits provides the most accurate representation of flow paths but is limited to humanly accessible pathways [10]. Artificial tracers often offer the most direct information about connectivity. However, the interpretation of these data can be limited to the hydrologic conditions during the study period, as flow paths may vary under different hydrologic conditions [8]. As a result, researchers continue to combine these methodologies and seek out novel approaches to provide a clearer relationship between the storage components of karst systems and how they interact under different hydrologic conditions.
Recent research has suggested that ecosystem-level information, such as diversity metrics or species similarities between sites, can be used to understand connectivity in karst systems [11,12]. These efforts rely on the ability of cave-adapted species to move through subsurface pathways when present. If the same cave-adapted species are found in multiple caves, then these caves were likely recently connected via pathways that the cave-adapted species can travel [13,14]. This concept may address the limitations of existing methodologies as defined by Goldscheider et al. [15] by providing a measure of ephemeral connectivity that may not be captured by artificial tracers. Ecosystem-level data, however, are limited by our understanding of the organisms as a community. Cave-adapted ecosystems are difficult to study; the combination of minimal information on the dispersal capabilities of species [16], low species detection [17], and frequent convergent evolution [18] limits the viability of these data in providing improved information on flow-path connectivity. These previous works suggest that while ecosystem-level data are limited, genetic data for individual species, especially for more abundant species, have the potential to provide more information on conduit connections that are not accessible or ephemeral in nature [11].
Geologic processes are rarely explained using genetic data; however, genetic diversity is often explained by geological processes, e.g., [19]. In a groundwater system, the population genetic data for individual species have the potential to address the limitations of community-level data and provide greater insights into the connectivity of groundwater flow paths when coupled with other tracer data. Several studies have demonstrated that the genetic structure in groundwater-dwelling organisms often corresponds with contemporary and past regional hydrogeological patterns, with boundaries between lineages or species coinciding with surface or subsurface hydrological divides [20,21,22]. Barriers to dispersal, such as faulting or surface stream incision, are consistent with an existing model of divergence and speciation. Geological controls on regional groundwater movement, such as geomorphology, aquifer permeability, structure, etc. [19,22,23], drive population subdivisions, which ultimately result in the formation of new species over time, e.g., [21]. Additional extrinsic controls, such as the topography, location relative to surface water and the water table, and water chemistry [22,24], as well as intrinsic controls, such as physiological tolerances and dispersal ability [25], operate at local spatial scales to influence population structures and connectivity. As a result, the similarity among the subpopulations of a given species can provide insights into the connections between the observed habitats.
Aquatic asellid isopods (order: Isopoda, family: Asellidae) represent a potentially ideal model to test this concept of population fragmentation since they are relatively abundant throughout aquatic habitats, are small, and are relatively easy to sample when compared to other groundwater fauna. This diverse family of freshwater crustaceans also occurs in many diverse surface and groundwater habitats [26]. The two-toothed cave isopod Caecidotea bicrenata [27] is a stygobiotic asellid widely distributed throughout the Interior Low Plateau karst region from southern Illinois and Kentucky to northern Alabama in the eastern United States [28]. Previous work also suggested that species in the genus Caecidotea can provide insights into habitat connectivity [29].
Here, we explore the use of the population genomic data of the two-toothed cave isopod to determine whether population groupings and isotopic variability in water, sediment, and isopods can provide improved insights into groundwater flow behavior when added to more traditional tracing approaches, such as hydrographs and dye-tracing data. We hypothesize that population genetic data from C. bicrenata will provide insights into ephemeral groundwater flow paths that are otherwise not observed using traditional techniques.

2. Materials and Methods

2.1. Study Site
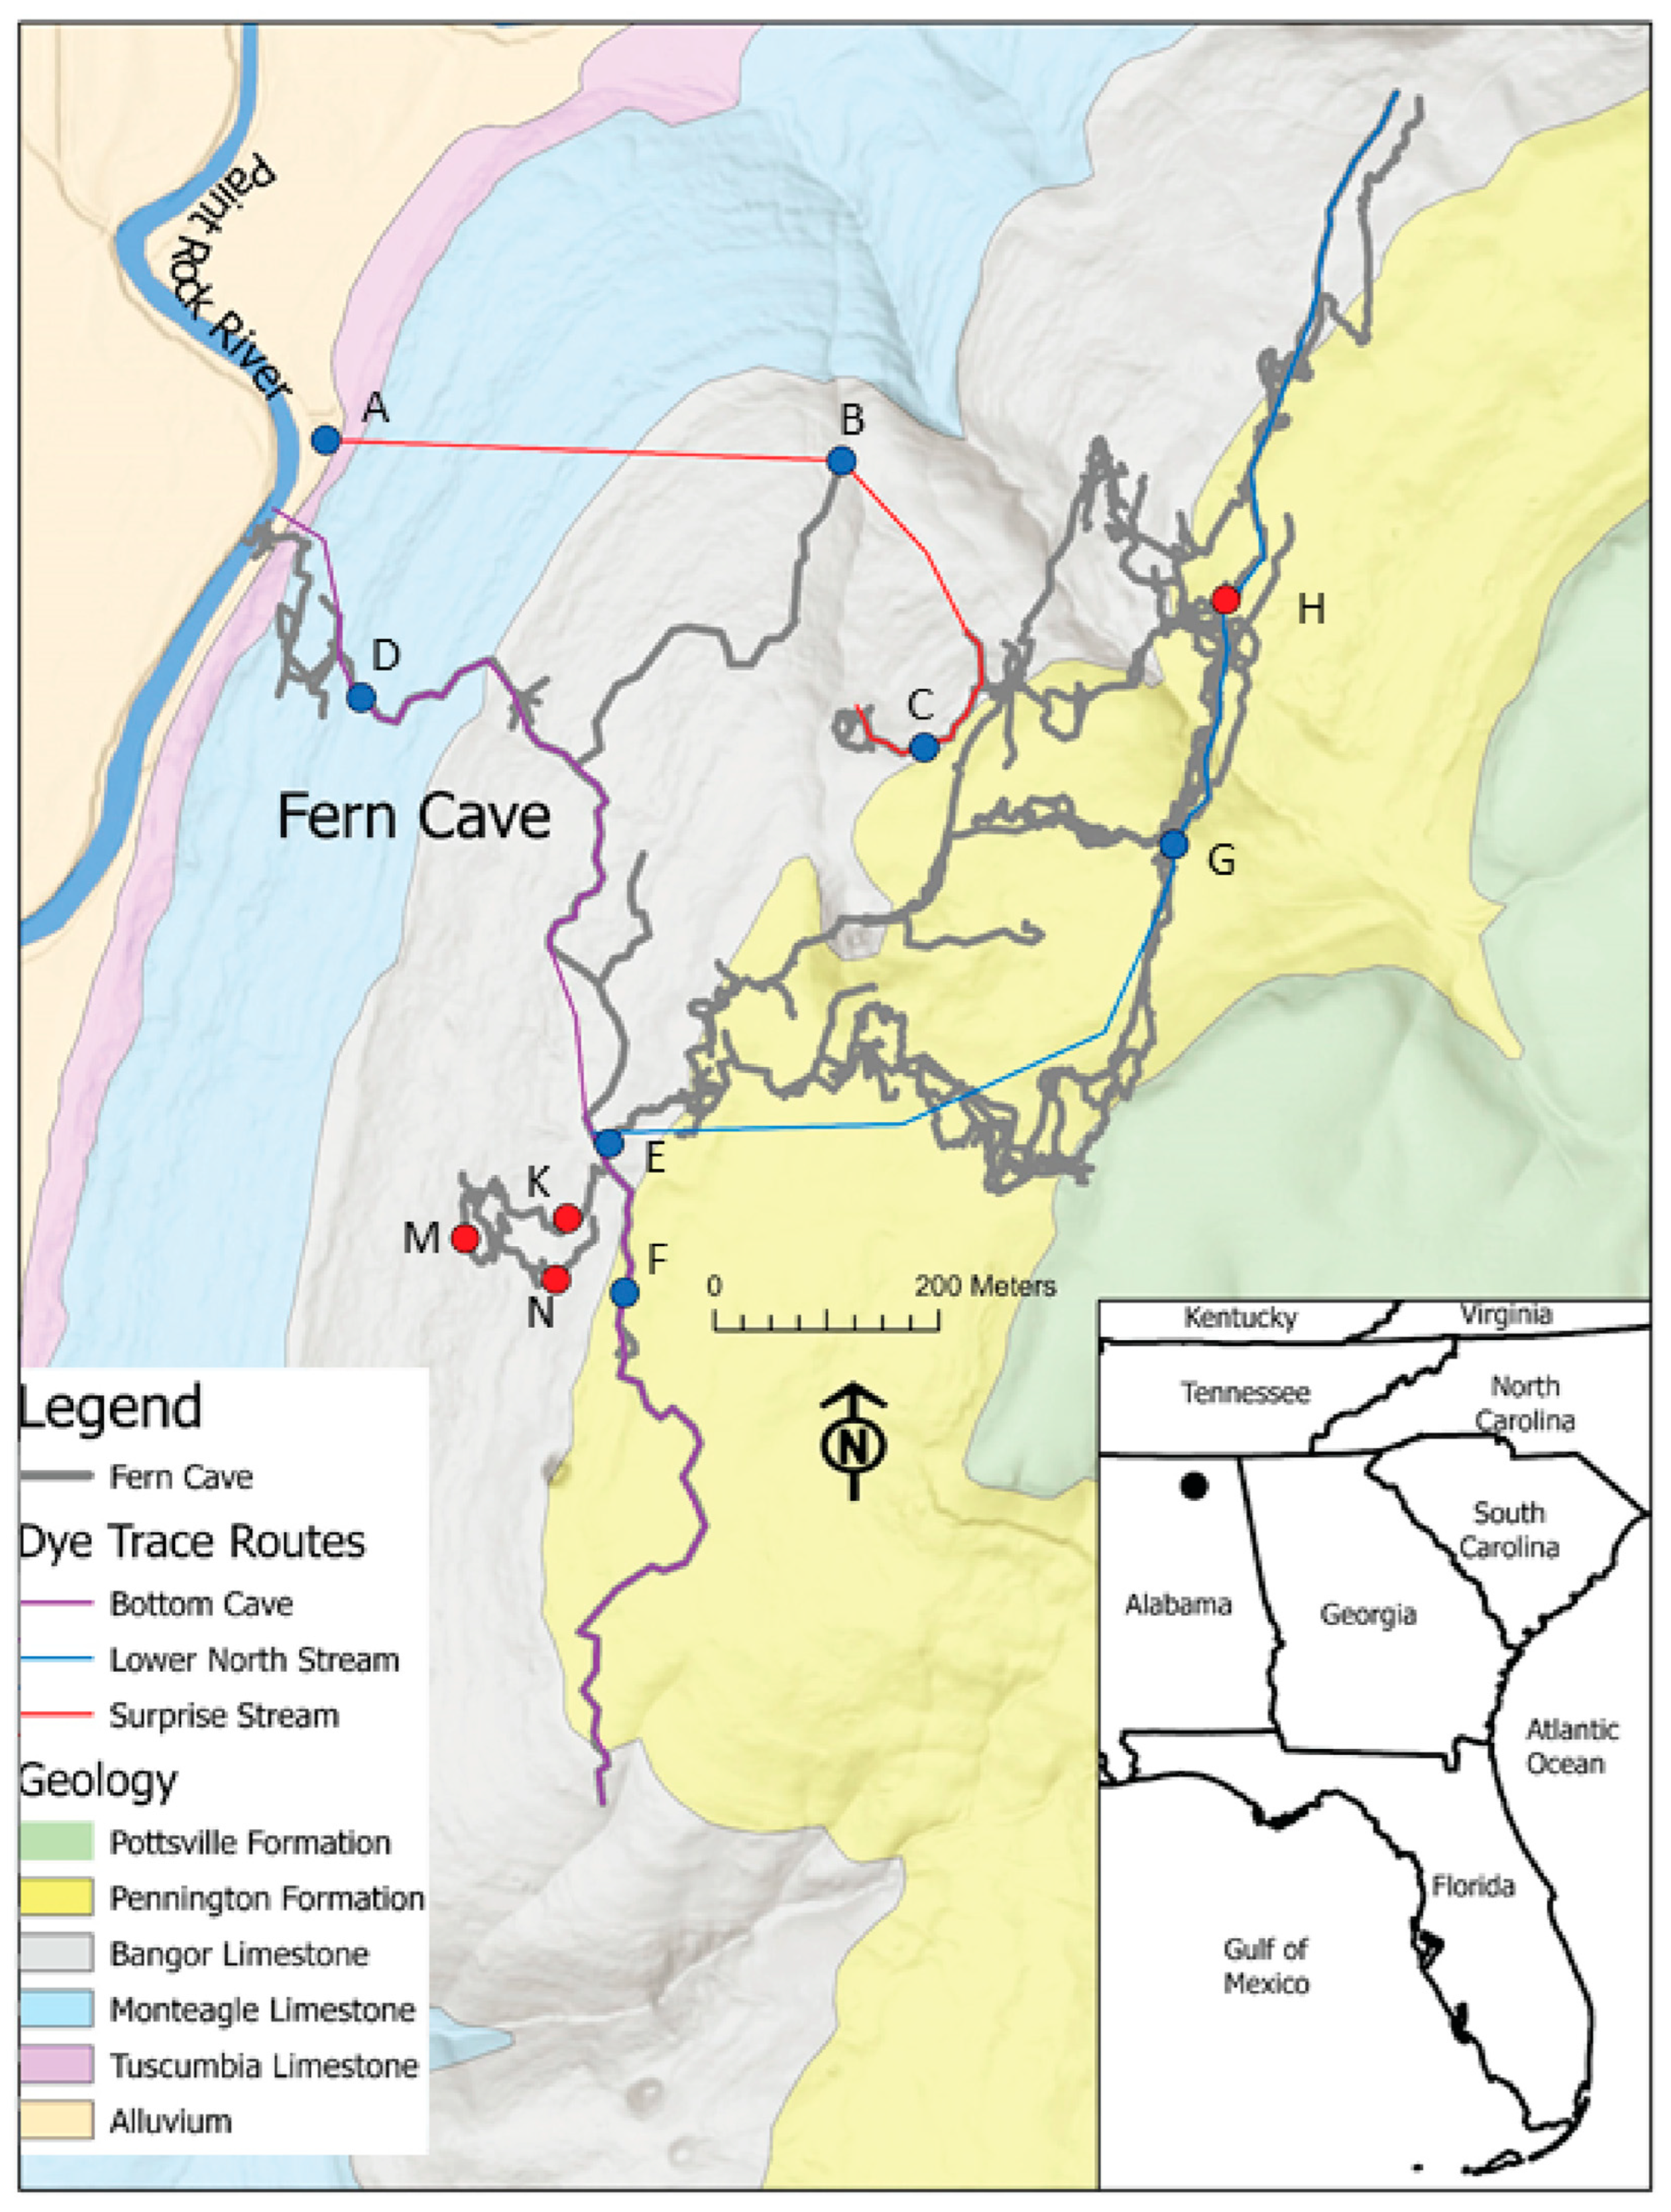
Fern Cave is a 25 km-long and 160 m-deep cave system developed in carbonate strata in Nat Mountain, a lobe of the Cumberland Plateau, in Jackson County in northeast Alabama, USA. This region has a humid, subtropical climate. Nat Mountain is capped by the Pottsville Formation, a Lower Pennsylvanian quartzose sandstone. Underlying this formation is a series of predominantly limestone bedrock formations, including the Pennington Formation and the Bangor, Monteagle, and Tuscumbia Limestones [30]. Seven entrances to Fern Cave are documented, of which four are in the 199-acre Fern Cave National Wildlife Refuge. A full geologic description of the site is available in the work by Miller and Tobin [31].
The cave has developed within the four limestone formations on the eastern side of the Paint Rock River Valley, with two main springs and a series of wet weather overflow springs that drain from Nat Mountain into the river. Within the cave, there are three primary streams including the Bottom Cave, North Cave, and Surprise Streams [31]. Two of these streams (North Cave Stream and Surprise Stream) can be followed from higher lithologic units down to the Tuscumbia Limestone at the base level of the cave system, while the third is only accessible in the Tuscumbia Limestone. Dye trace data for the cave system are available from Miller et al. [32] and shown in Figure 1. The study groundwater basin is dominated by deciduous forest, with minimal human disturbance [31].
Figure 1. Study site map showing the cave passage dye-traced flow paths from Miller and Tobin (2023), and sample sites (blue dots—major stream sites, yellow dots—unsaturated zone drip sites). Letters refer to site information in Table 1.
Hydrology 11 00023 g001
Table 1. Sample site identification and samples collected at each site.
Site IDSite NameWater IsotopesWater ChemistrySediment IsotopesIsopod IsotopesIsopod Genetics
AHaley Springxxxxx
BEarthquake Roomxxxxx
CSurprise Streamx x
DBottom Cave—downstream (DS)xxxxx
EBottom Cave—waterfallxxxxx
FBottom Cave—upstream (US)xxxxx
GLower North—cascadexx xx
HLower North—upstream (US)x x x
KMorgue Dome x
MRefrigerator Passage xx
NMorgue Entrance x

2.2. Field Data Collection and Analysis

Water, sediment, and specimens of C. bicrenata isopods were sampled throughout the cave (Figure 1) during a single sampling event between 22 September and 25 September 2020. Water and sediment samples were sampled following established procedures [33]. Water samples for geochemistry and isotopic analysis were filtered on site with a 0.45 μm filter and refrigerated as soon as possible after collection. Sediment samples were collected in whirlpak bags and dried at 70 C prior to analysis. Following the model of Francois et al. [34], isopods were sampled from eleven locations in the cave. We sampled up to 10 individual isopods at each aquatic site, with 5 individuals preserved in 100% ethanol for genetic analyses and 5 individuals stored in water and frozen after leaving the cave for isotopic analyses.

2.2.1. Hydrologic Monitoring

We installed non-vented continuous water-level and temperature loggers at four locations in Fern Cave with associated atmospheric loggers using established methods: Surprise Stream (Site C, Figure 1), Lower North—cascade (Site G, Figure 1), and two sites in Bottom Cave (Sites D and E, Figure 1). These data loggers recorded data at 15 min intervals and began recording data in early 2020 (see Table 2 for exact dates). Atmospheric loggers were used to compensate for barometric pressure.

2.2.2. Geochemical Analysis

Isopods were sampled from ten locations for isotopic analysis; only seven of these were analyzed due to the poor quality or quantity of material from the other three sites (Sites C, H, and K, Figure 1). Sediments and isopods were analyzed for δ15N and δ13C using a Costech Elemental Analyzer and Delta Plus IRMS. Nine water samples were analyzed for δ13CDIC and δ13CDOC using a ThermoFinnigan Gas Bench coupled to a Delta Plus IRMS, and δD and δ18O of water were measured using a Los Gatos Water Isotope Analyzer. All isotopic analyses were performed at the Kentucky Stable Isotope Geochemistry Laboratory (KSIGL) at the University of Kentucky, USA. Standard methods were followed for the analysis of stable water isotopes [35,36], δ13CDIC [37,38], δ13CDOC [39,40], organic δ13C, and δ15N in sediments [41,42]. Precision, accuracy, and difference between matrix-matched blind samples are ≤0.2‰ for all isotopic analyses. Six sites were sampled for major ion chemistry. Metals (Al, Sb, As, Ba, Be, B, Cd, Ca, Cr, Co, Cu, Au, Fe, Pb, Li, Mn, Mg, Ni, P, L, Se, Si, Ag, Na, Sr, Tl, Sn, V, Zn) were analyzed using inductively coupled argon plasma optical emission spectroscopy, total alkalinity was titrated, and anions (Br, Cl, F, NO3, SO4) were analyzed using ion chromatography in the Kentucky Geological Survey Water Lab, USA. These results showed minimal variability between sites and are not discussed here. Data are available via Tobin et al. [43].

2.2.3. Genetic Analysis

Forty-two whole specimens of isopods were collected from 11 locations throughout the Fern Cave system (Figure 1). Genomic DNA was extracted using the Qiagen DNeasy® Blood and Tissue Kit. Individual extractions were normalized and prepared using a restriction-site-associated DNA sequencing (RADseq; [44]) library procedure that uses three restriction enzymes (i.e., 3RAD, Adapterama III; [45]). The three enzymes used during the digestion step were BamHI, MspI, and ClaI. Each sample was quadruple-indexed, limited-cycled in PCR, and cleaned using speed beads [46]. Samples were pooled together, size-selected for 500 base pairs (bp) using a Pippin Prep (Sage Science), and paired-end-sequenced on an Illumina HiSeq 4000 with a PE 150 kit (Illumina Inc.).
The 3RAD sequence data were demultiplexed, quality-assessed, clustered, consensus-called, and assembled de novo using ipyrad v0.7.28 [47], which generated candidate single-nucleotide polymorphism (SNP) loci for each sample. Internal indexes were removed, and reads were trimmed to 120 bp. We set the clustering threshold to 85%, the minimum depth for statistical base calling to 6, the minimum depth for majority-rule base calling to 3, and the minimum number of individuals per locus to 10. We allowed up to two alleles per site in consensus sequences and 20 SNPs per read per locus. The resulting SNP dataset was filtered using the following criteria: minimum and maximum number of alleles per site of 2, minimum mean depth of coverage of 5, minor allele frequency of 0.05 to remove singletons, present in at least 50% of samples. Indels, singletons, and putatively linked SNPs were removed. Three samples all from a single sampling site, the Earthquake Room (site M, Figure 1) were removed after filtering, which resulted in 39 samples from 10 sampling sites with sufficient data (5393 SNPs were retained) for downstream analyses. We explored additional, more stringent thresholds for missing data, which did not significantly change the results.
We explored population structures using discriminant analysis of principal components (DAPC). DAPC is a multivariate approach that transforms individual genotypes using principal components analysis (PCA) prior to conducting a discriminant analysis that maximizes differentiation between groups while also minimizing variation within groups [48]. We used the dapc function in the adegenet v2.1 package [49] in R [50]. DAPC requires group assignments a priori; we employed a K-means clustering algorithm using the find.clusters function in the adegenet package to identify the optimal number of clusters from K = 1 to K = 10 with 1000 randomly starting centroids (n.start = 1000) in each K-means iteration. The various clustering solutions were compared using Bayesian information criterion (BIC). To avoid overfitting of discriminant functions, we used α-score optimization to evaluate the optimal number of principal components (PCs) to retain in the DAPC.
We also explored population structures using sparse nonnegative matrix factorization (sNMF). sNMF was performed using the LEA package [51] in R to estimate individual ancestral coefficients, which allows for the inference of the number of ancestral populations (K) that correspond to genetic clusters [52]. As in the DAPC analysis, we tested K values between 1 and 10 each with 10 replicates, and the best model was determined by minimizing the cross-entropy among clusters.

3. Results

All hydrologic and geochemical data collected for this project are available via a data release [42]. The dye trace data included are available in the work by Miller et al. [32], and a discussion is available in the work by Miller and Tobin [31].

3.1. Ion Geochemistry Analysis

The water samples showed very little variability between the sites sampled. While there was some variability in the Ca:Mg ratio, all water samples were plotted as Ca-CO3-dominant water types on a piper diagram (Figure 2). This is likely due to minimal non-karst input.

3.2. Hydrograph Analysis

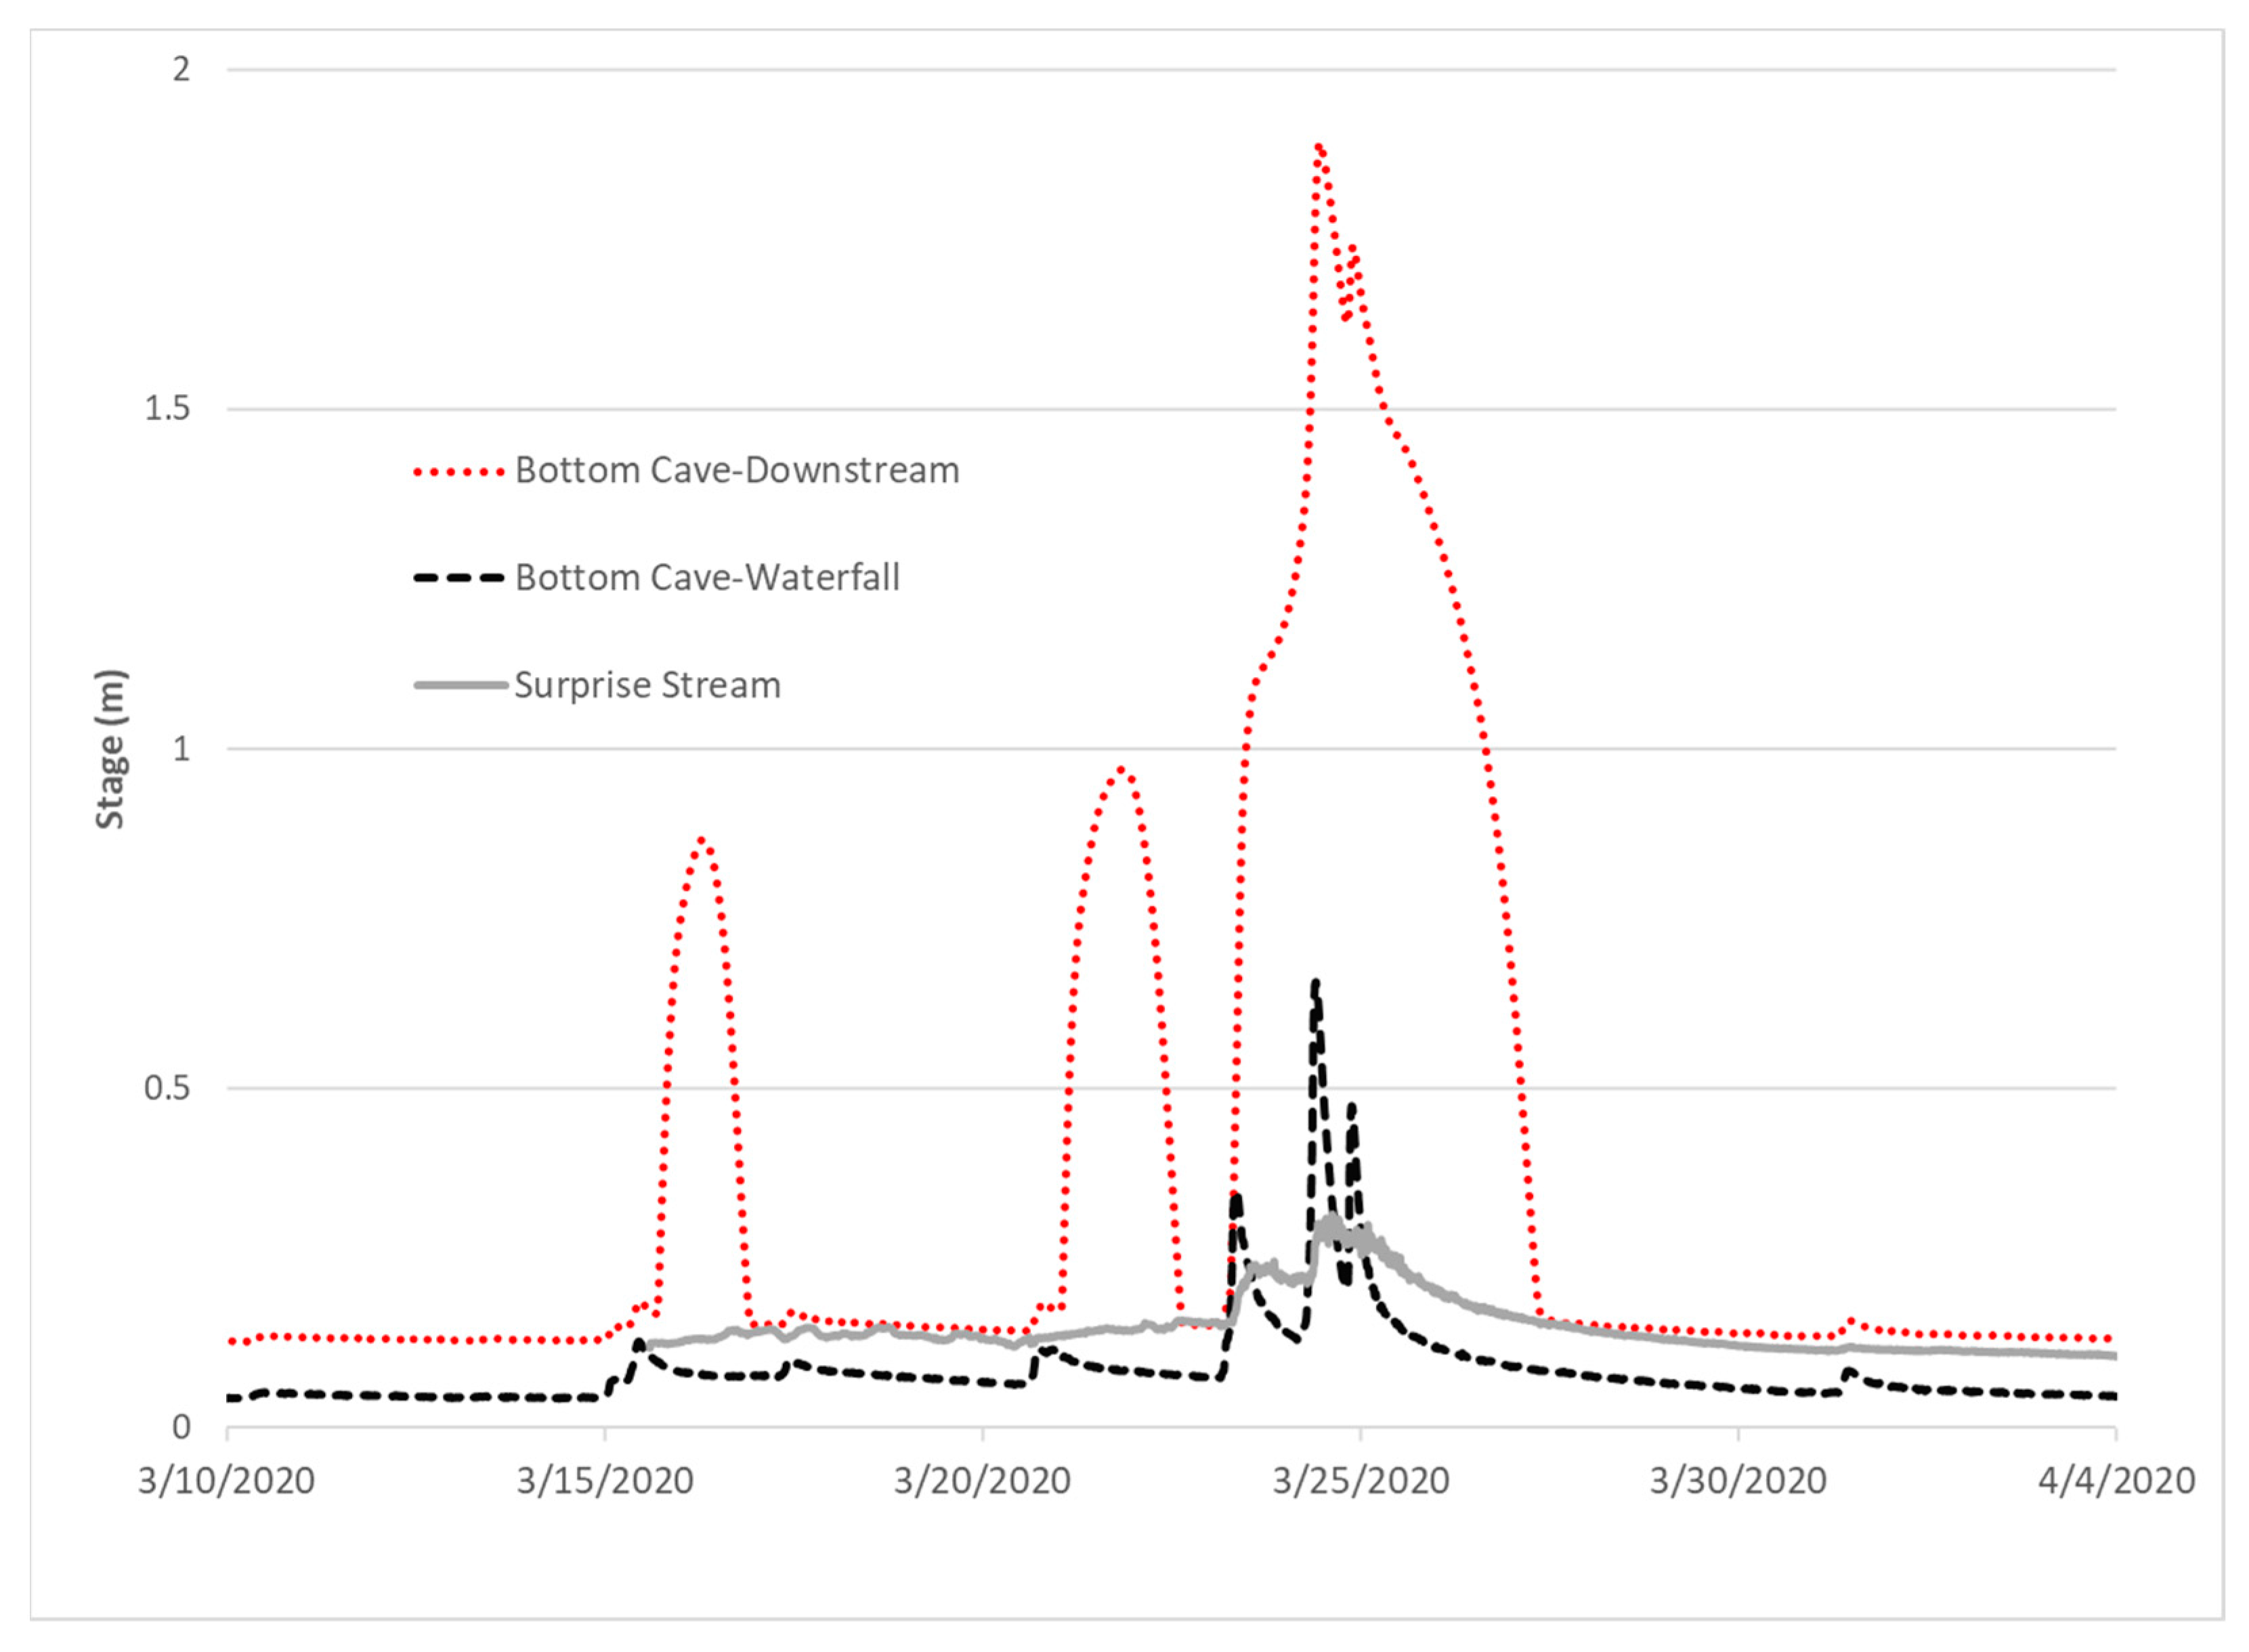
The four data loggers located in the cave captured a series of storm events. Three of the data loggers recorded normal storm-response curves for karst systems, with an initial rapid rise in discharge followed by a decaying recession slope. The downstream site in Bottom Cave, however, showed a much larger response and a more rounded response curve, with a lack of a distinct peak separating the rising and recession limbs of the hydrograph (Figure 3). This response may indicate influences from other sources not seen in the upstream part of the system, including possible back flooding from the Paint Rock River.
The four data loggers located in the cave captured a series of storm events. Three of the data loggers recorded normal storm response curves for karst systems, with an initial rapid rise in discharge followed by a logarithmically decaying recession slope. The downstream site in Bottom Cave, however, showed a much larger response and a more rounded response curve, with a lack of a distinct peak separating the rising and recession limbs of the hydrograph, as well as a lack of standard recession behavior (Figure 3). This delayed and rounded response did not match the responses seen in elsewhere in the cave and likely is tied to surface water back flooding into the lower extent of the cave stream.

3.3. Isotope Geochemistry

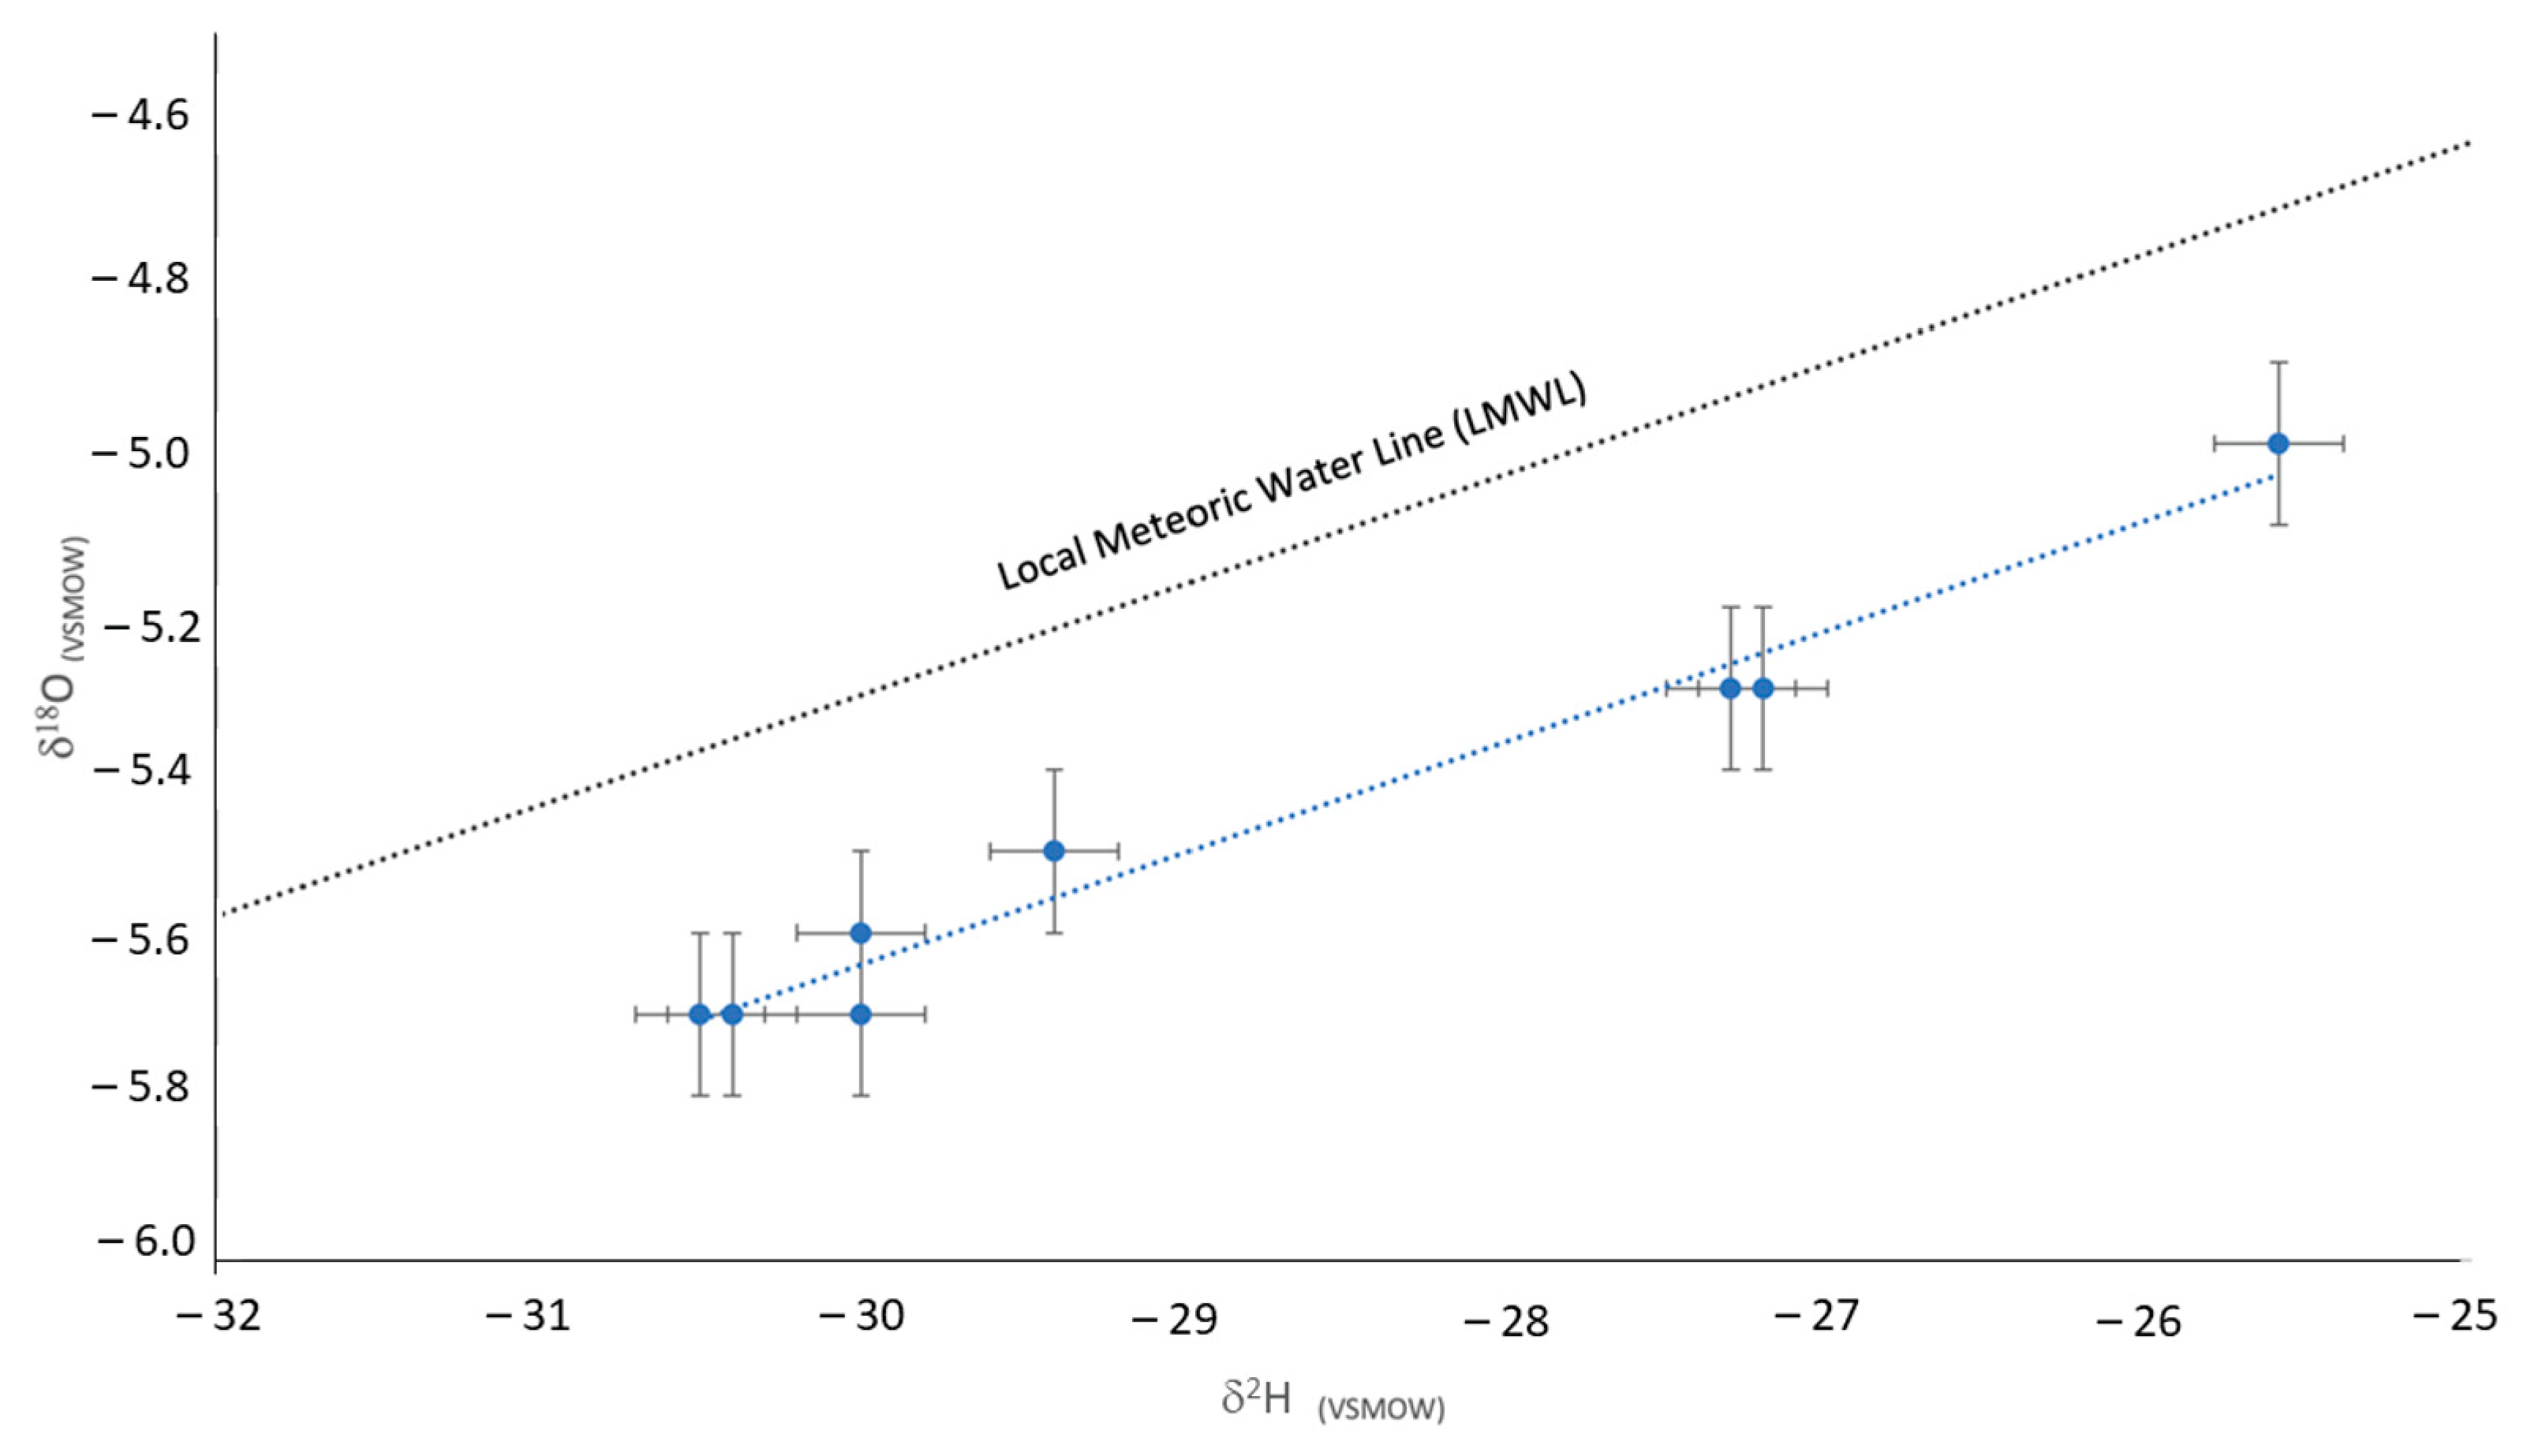
The bulk sediment δ13C and δ15N and water δ13CDIC and δ13CDOC, δ2H and δ18O were measured at 6 and 8 sites, respectively (Table 1). The sediment samples range from 2.5 to 5.7‰ for δ15N and −28 to −25.5‰ for δ13C. δ13CDIC ranged from −12.5 to −6.9‰, with δ13CDOC ranging from −33 to −25‰ (Figure 4). The isopod samples were slightly enriched in δ13CDOC relative to both the sediment and water samples measured. Little variation was seen in δ15N between sediment and isopods, with the exception of one isopod sample that was enriched compared to all other samples. Finally, δ2H ranged from −30.5 to −25.6‰ and δ18O from −5.7 to −5‰ (Figure 5). All samples were plotted on a line parallel and slightly below the local meteoric water line.

3.4. Genetic Analysis

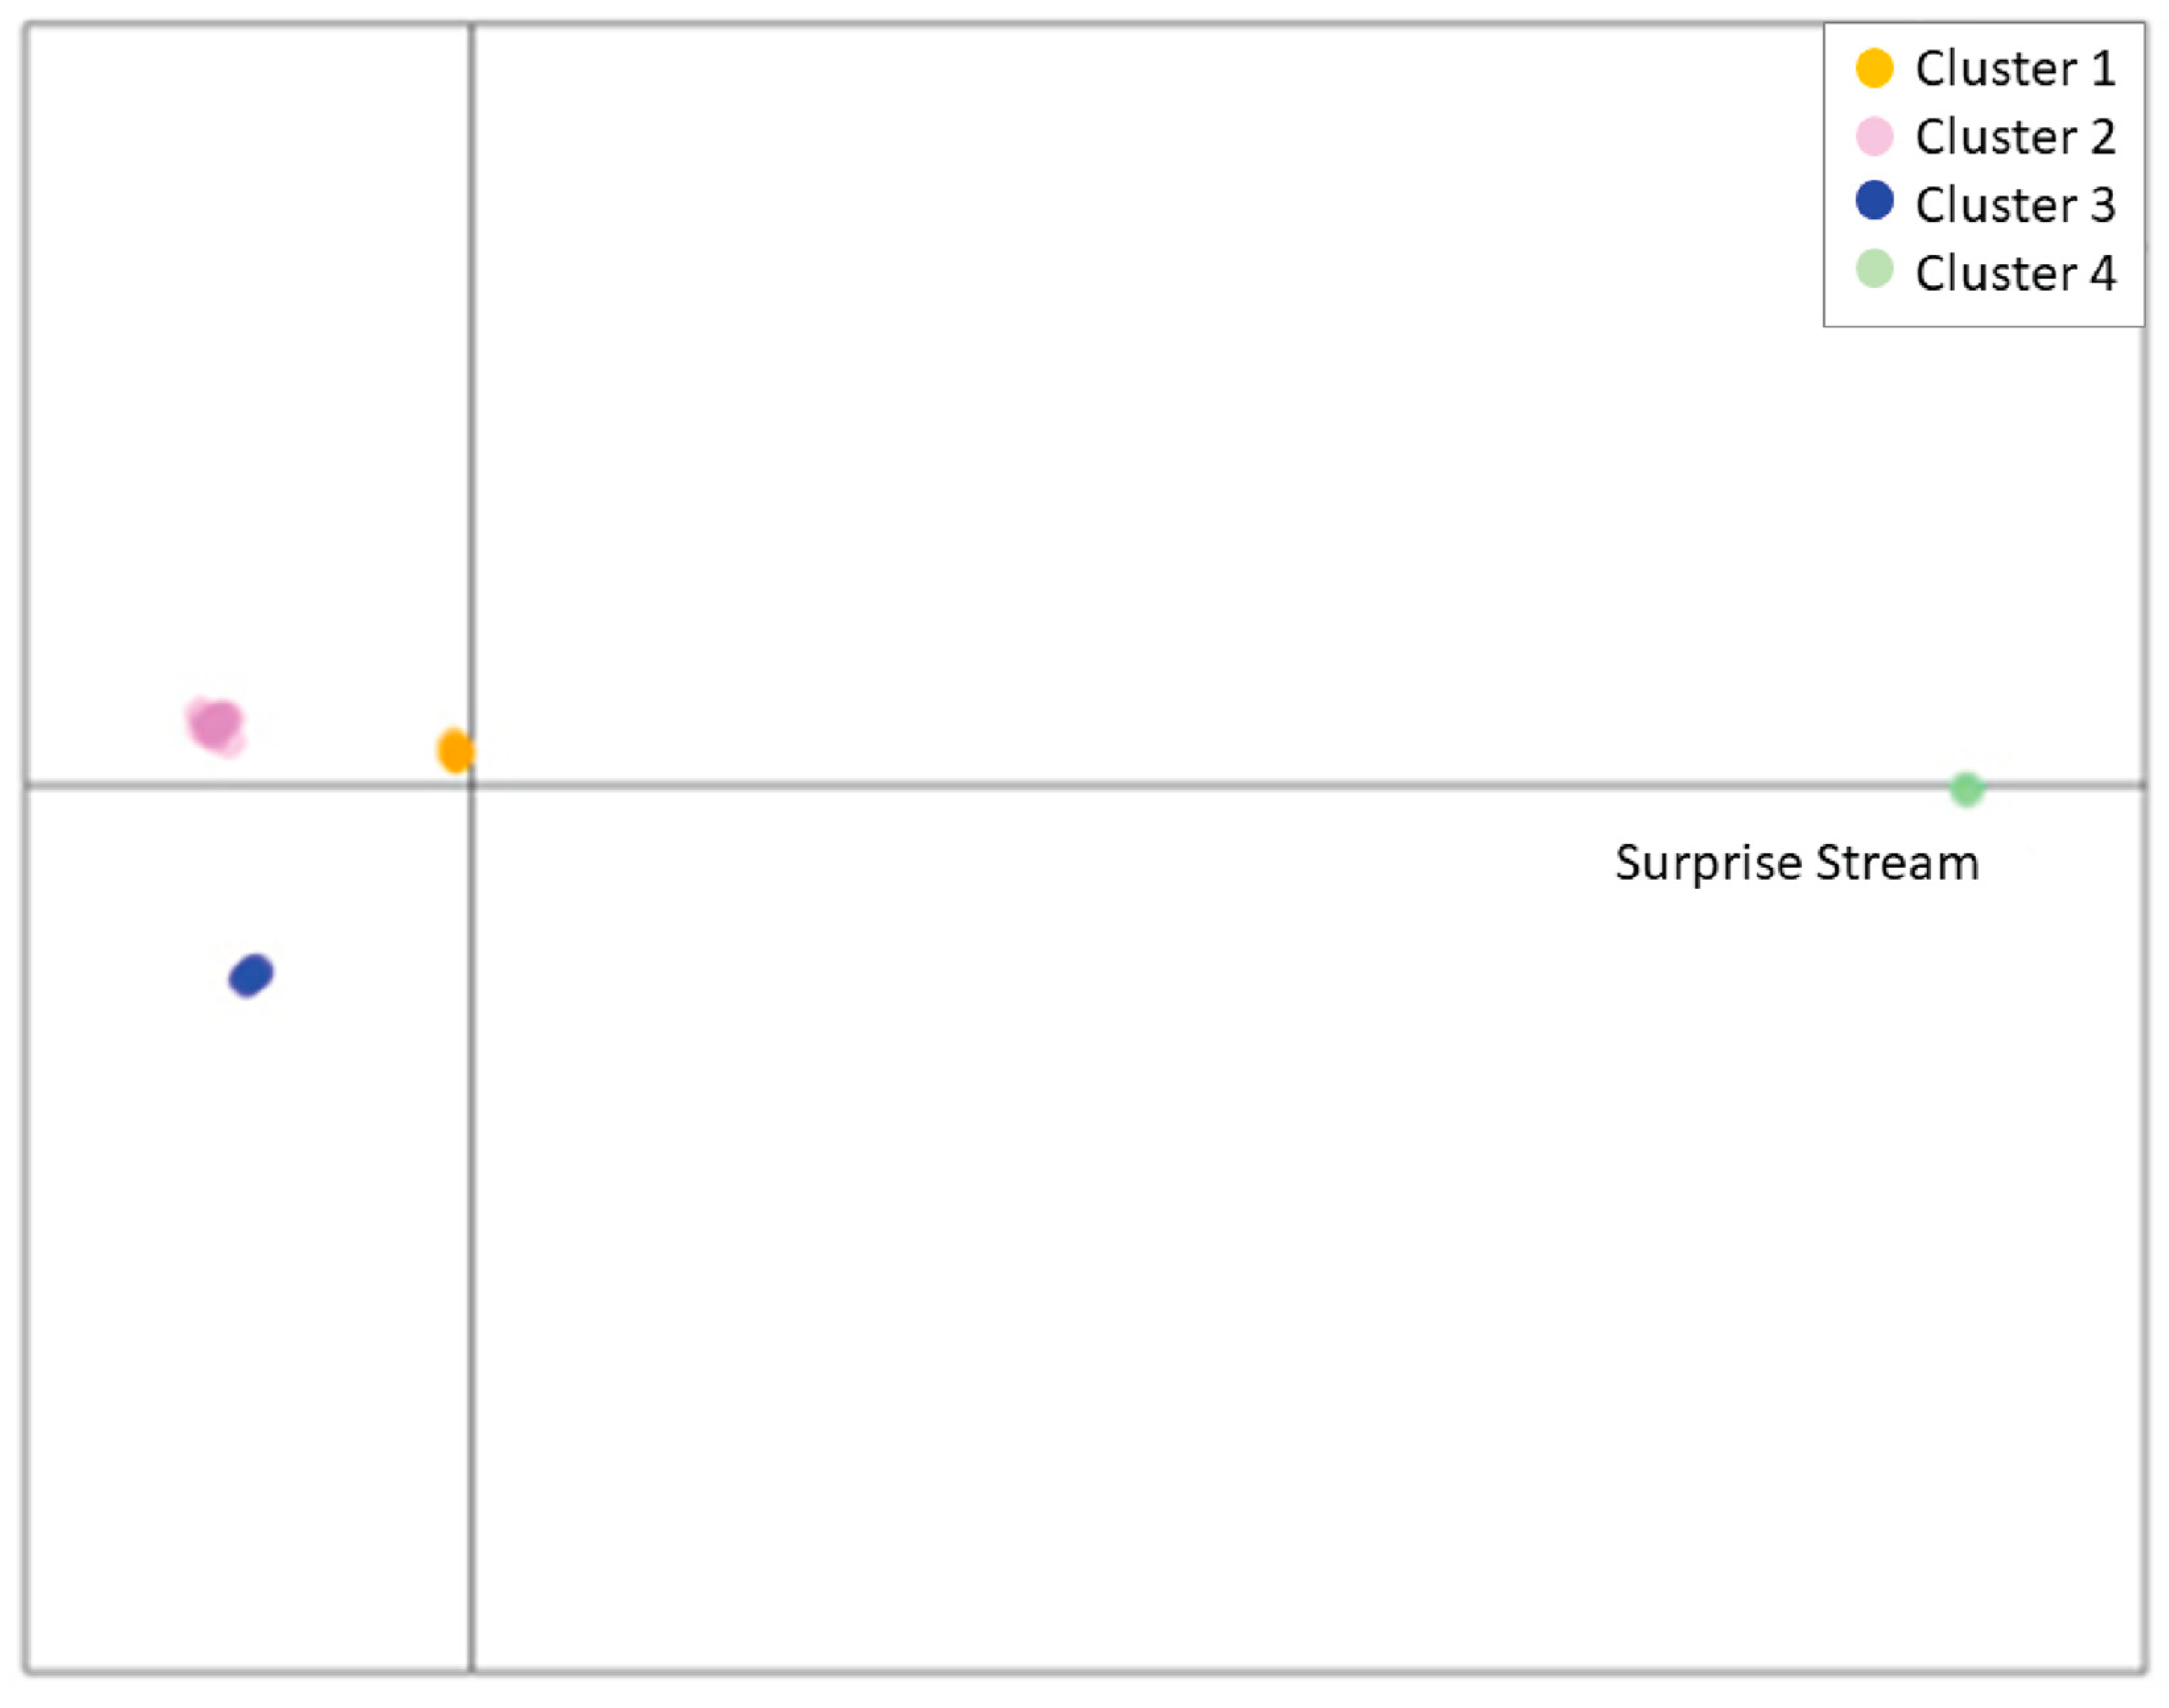
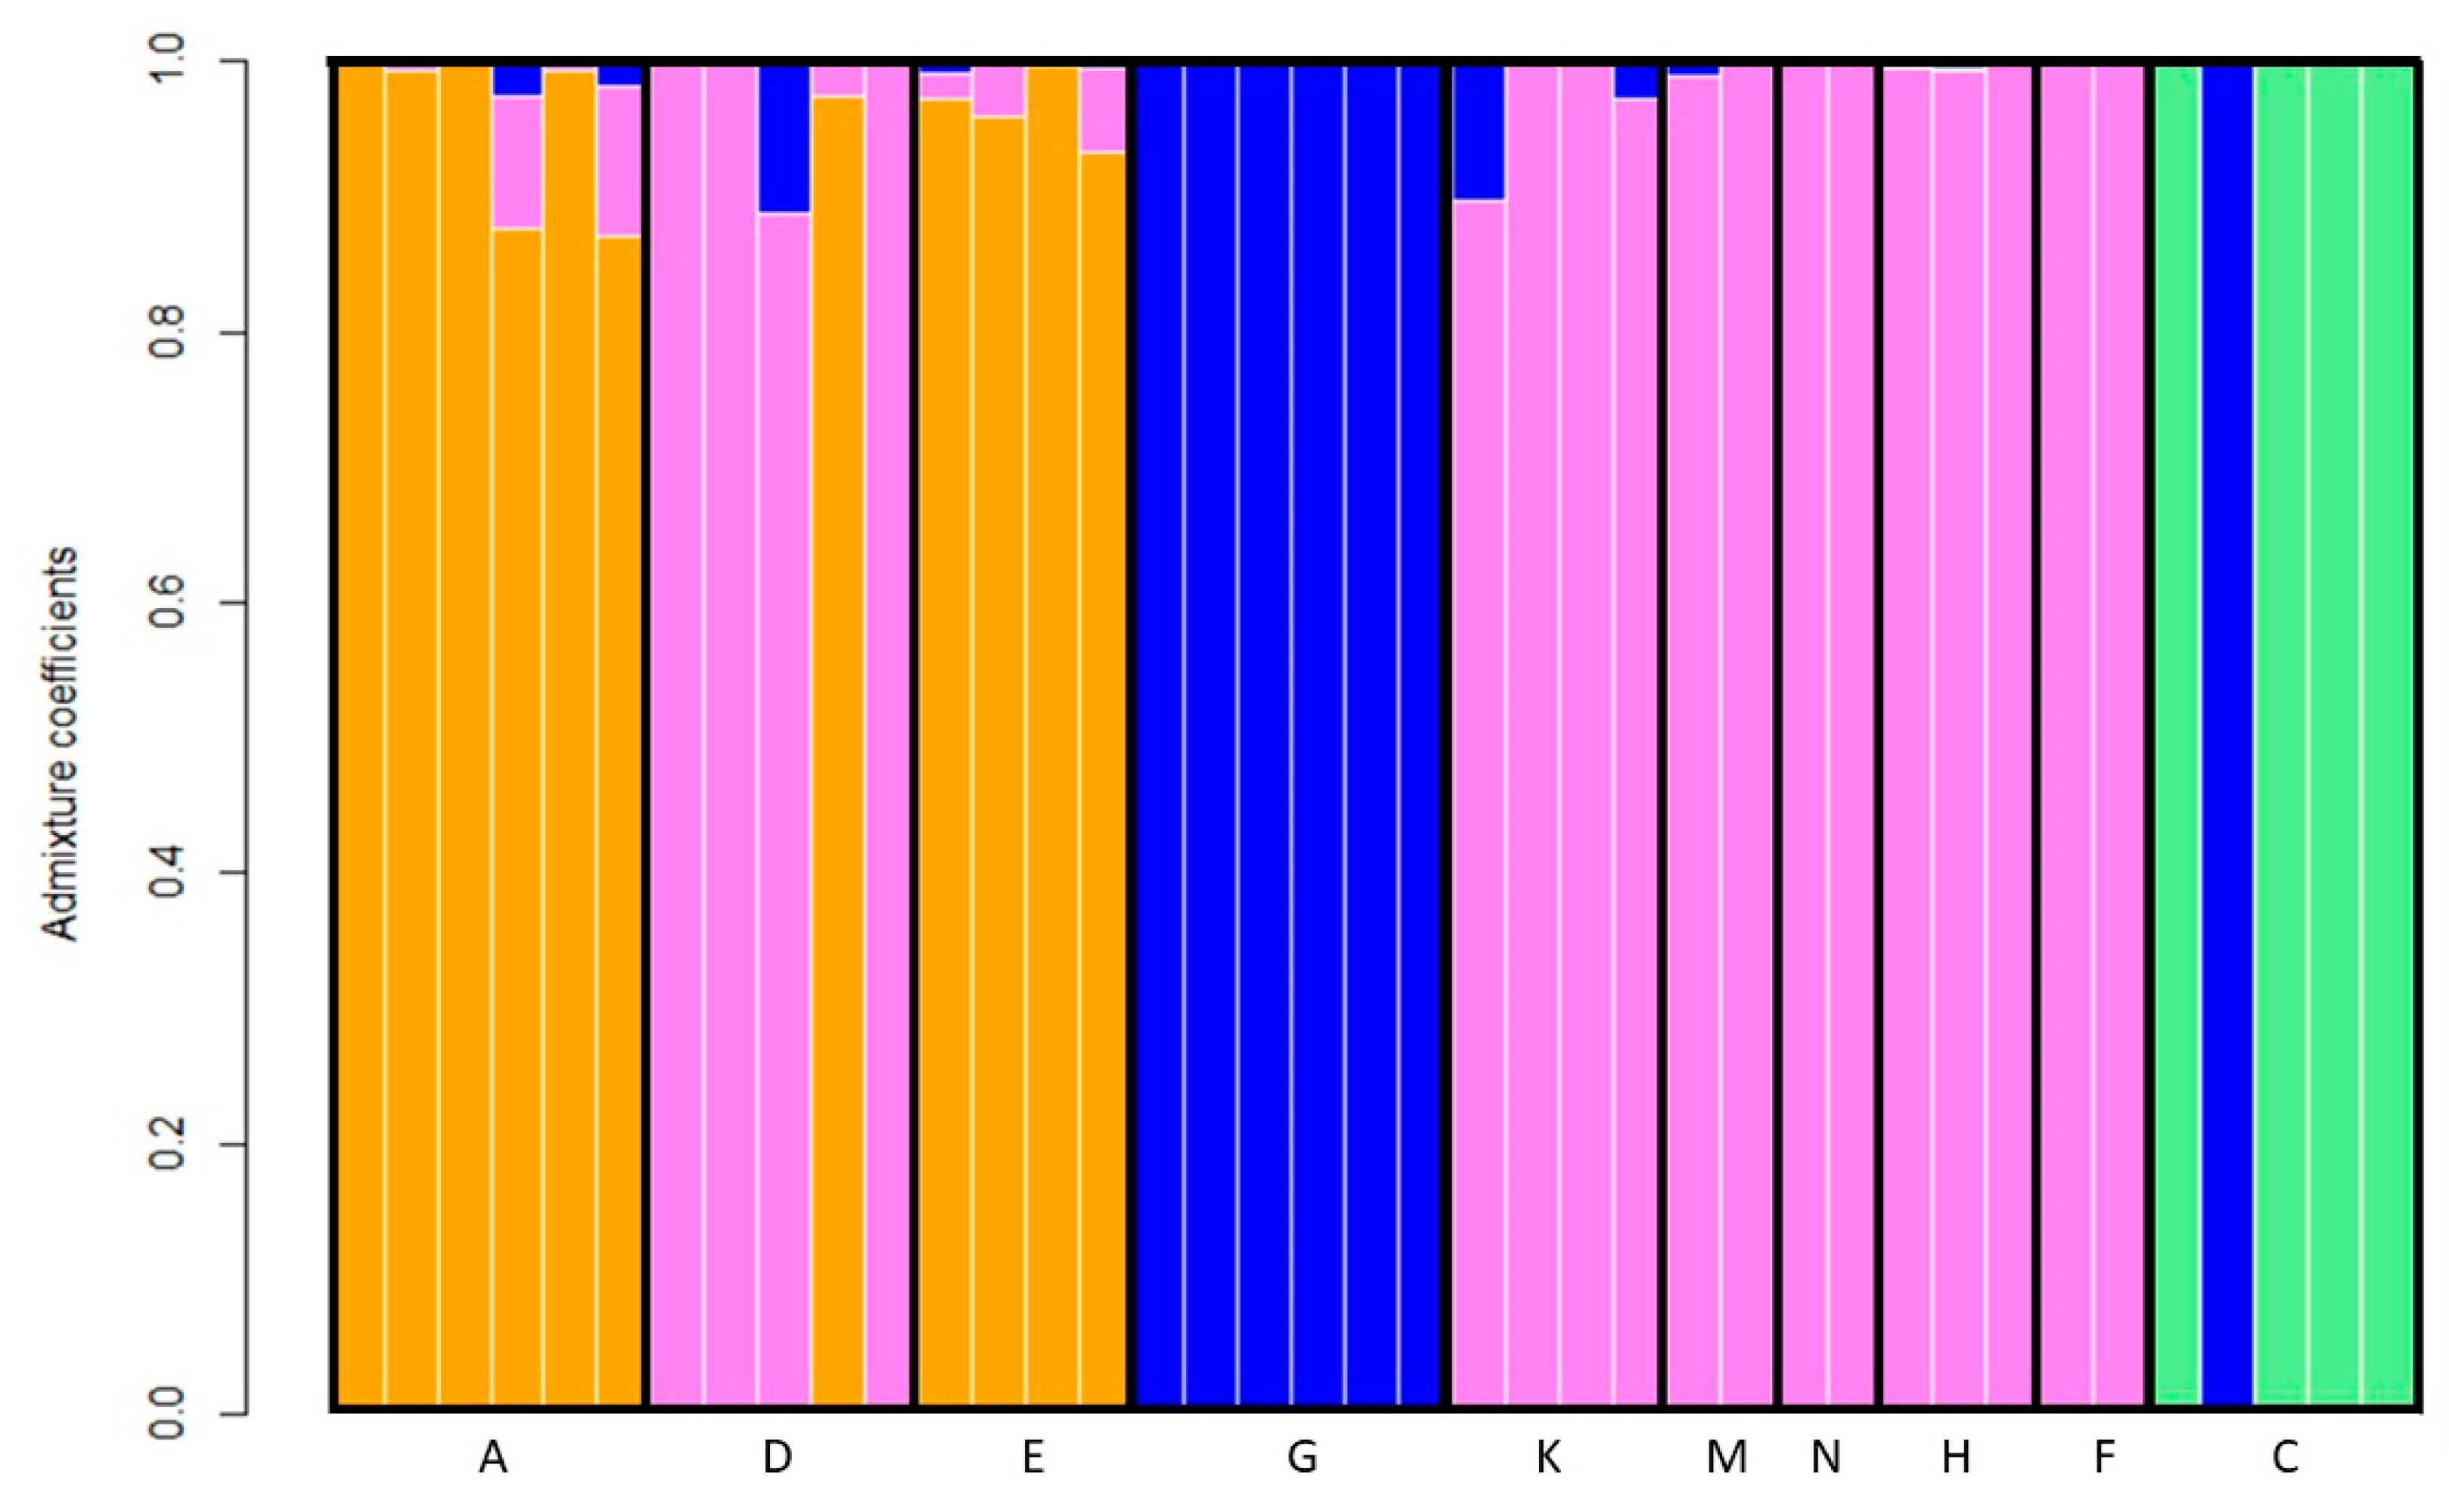
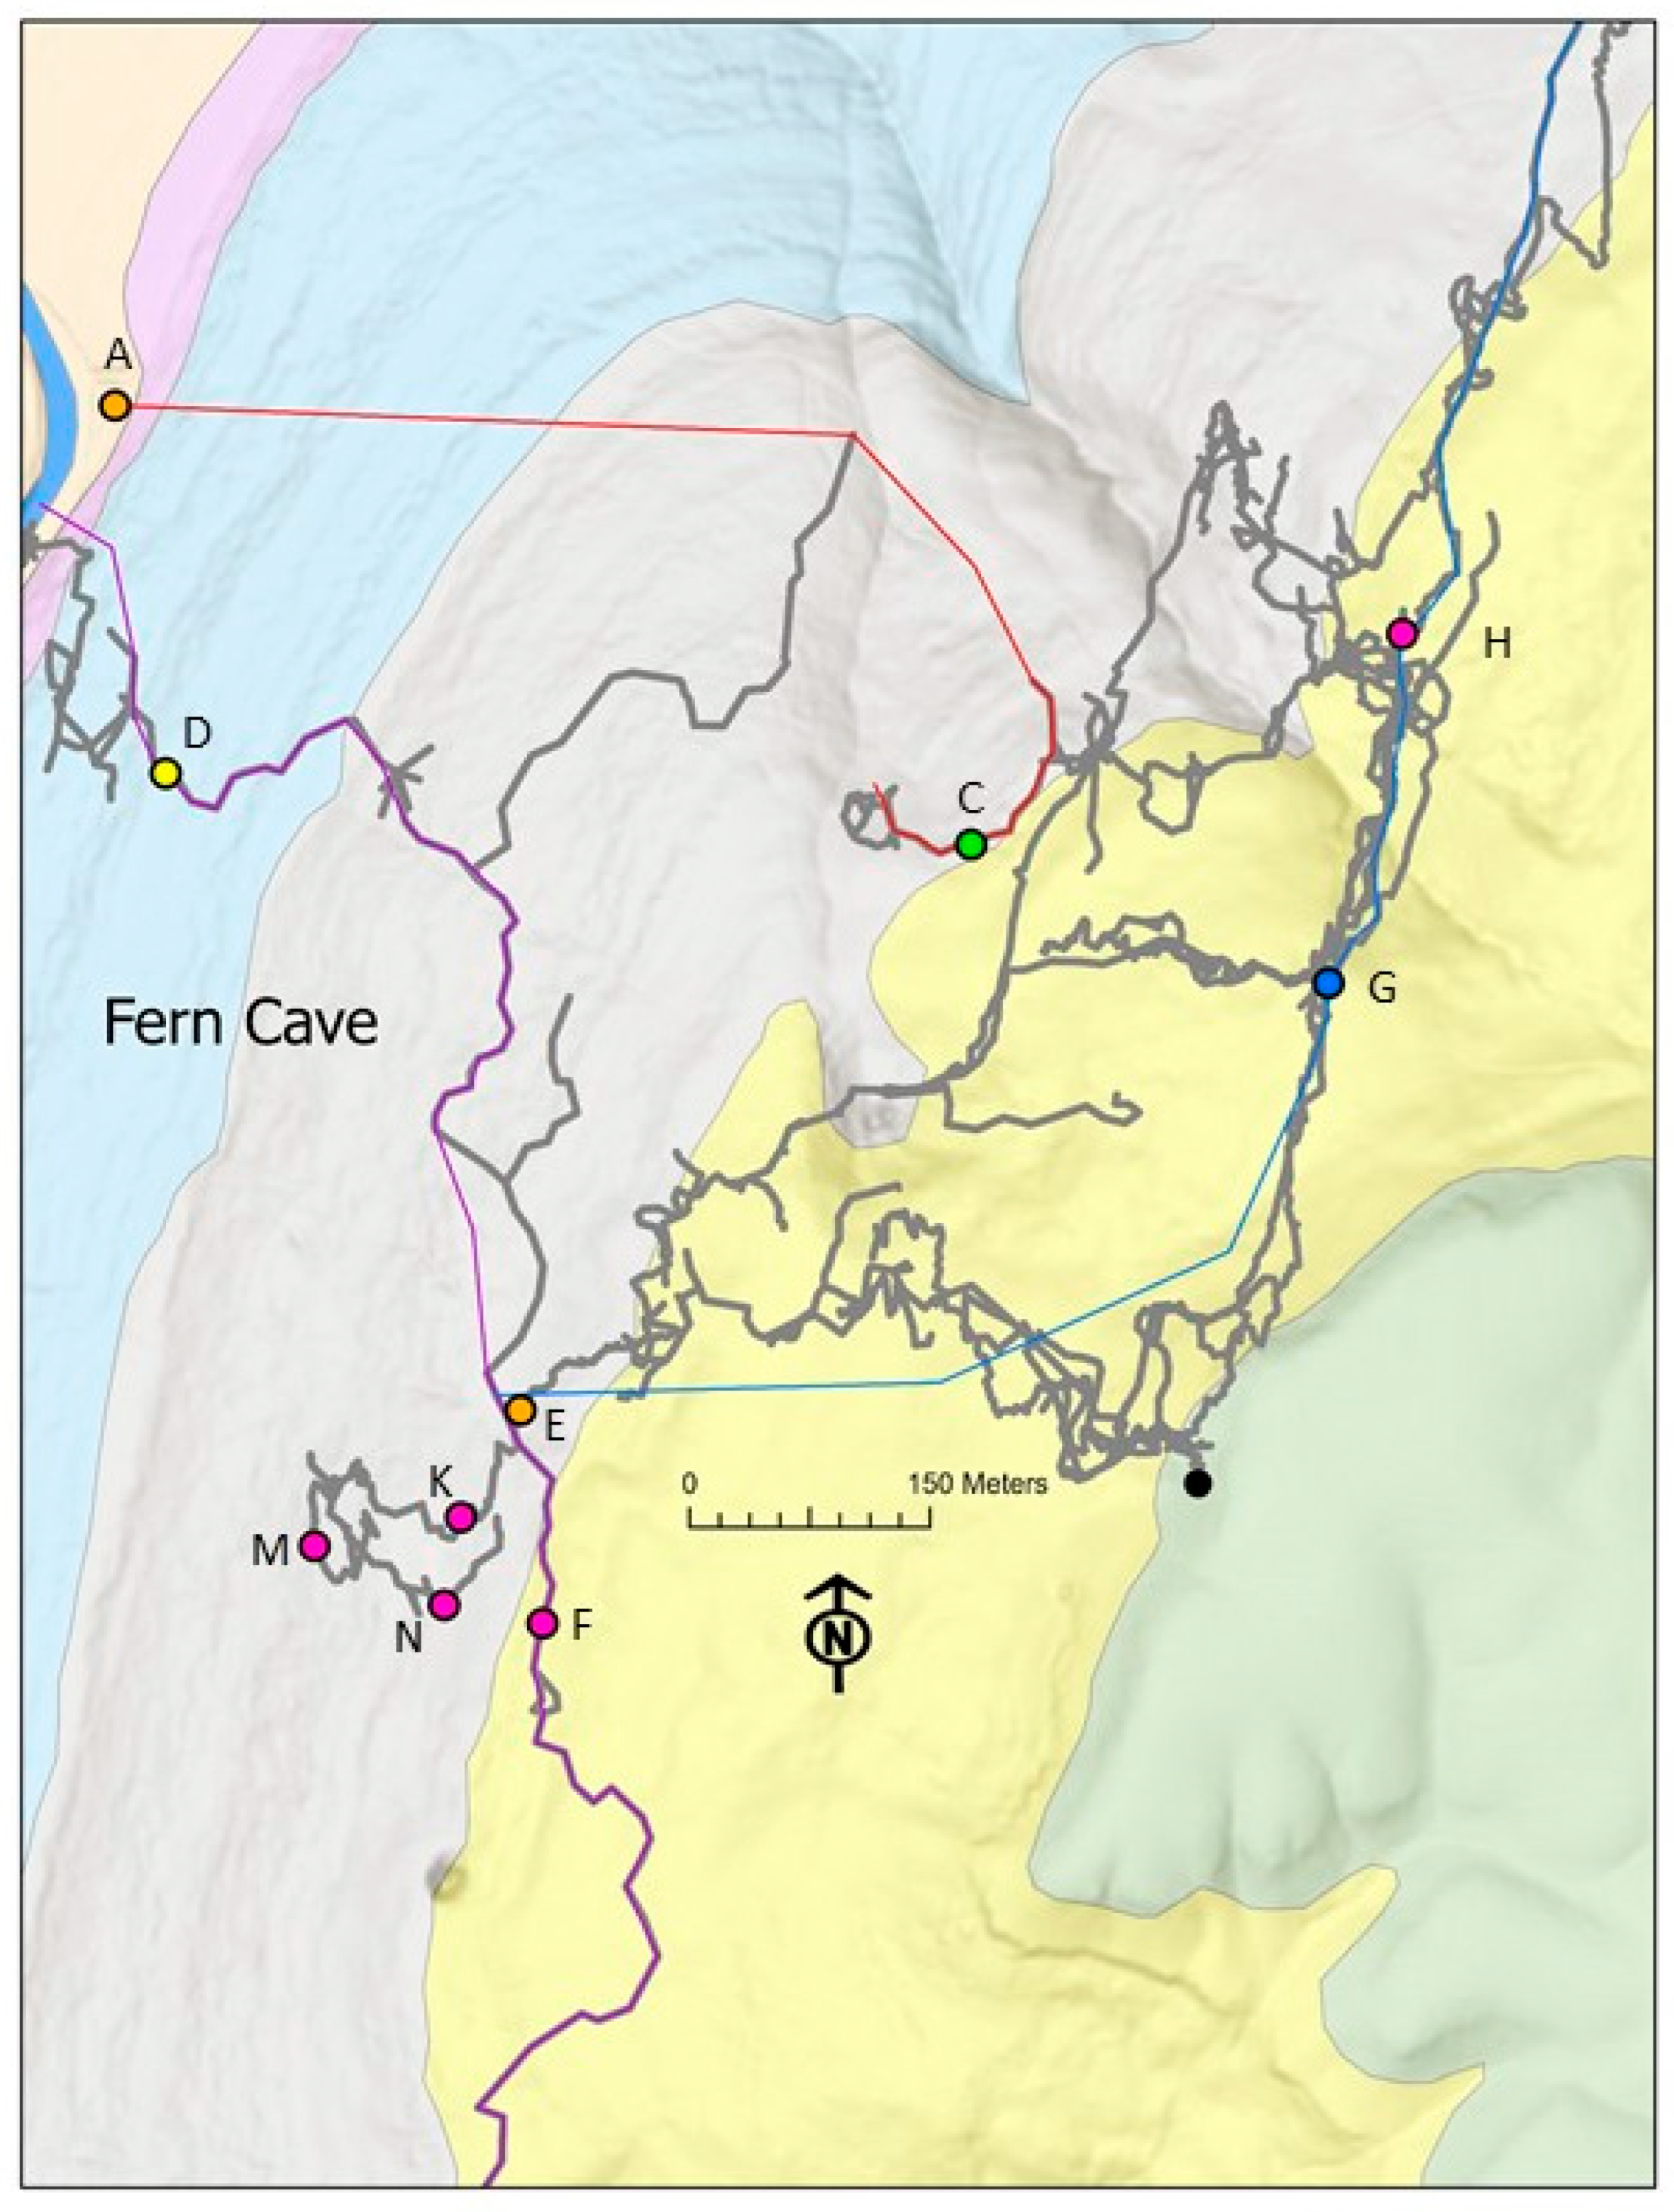
After filtering, our RADseq dataset included 5393 SNPs across 39 individuals from 10 sites in the Fern Cave system. DAPC analysis shows clear distinctions between each group (Figure 6). Individual assignment to clusters was consistent across the sNMF and DAPC analyses (Figure 7). Individuals from most sites were all assigned to the same cluster, except for Site C (Surprise Stream) and Site D (Bottom Cave—downstream), in which one individual at each site did not cluster with other individuals from the same site (Figure 7 and Supplemental Figure S1). Individuals from sites A and E and one individual from Site D belonged to the same cluster (cluster 1), while individuals from sites F, H, K, M, and N and most individuals from Site D clustered together (cluster 2). All individuals from Site G and one individual from Site C formed a cluster (cluster 3). Additional individuals from Site C formed a cluster (cluster 4) distinct from the other three clusters based on DAPC (Figure 6). Low levels of admixture between clusters 1, 2, and 3 were detected in some individuals from sites A, D, E, K, M, and H (Figure 7).
When groupings are combined with the dye trace results from Miller and Tobin [31], they show two distinct but overlapping flow systems. The recharge area for Surprise Stream is within the larger recharge area for Fern Cave, though this stream remains separate from the Lower-North–Bottom-Cave system in normal flow conditions (Figure 8). The recharge feeding the Surprise Karst Window traverses over portions of the Lower North Stream, and then the stream ultimately discharges from Haley Spring, remaining distinct from the other streams. However, genetic data suggest that this separation may not exist during high flow conditions at the downstream ends of the systems. The similarity of isopod populations in Bottom Cave with those in Haley Spring indicates that there is enough connectivity between these portions of the basins to maintain genetic similarity (Figure 8).

4. Discussion

While the dye trace data show two distinct but overlapping hydrologic systems, the population genetic and isotopic data suggest a more complex relationship between these two systems. A potential ephemeral connection between these two flow systems and the complex non-conservative behavior of isotopic traces provides more insights into this than traditional techniques otherwise show.

4.1. Genetic Tracers

The population genetic analyses suggested a hydrological connectivity between several sites that was not expected based on the dye trace data alone. First, the downstream sites in both groundwater basins are represented by a single group of isopods, indicating that these habitats are connected often enough to maintain connectivity. This may be the result of back flooding from the Paint Rock River resulting in the activation of flow paths between these two low-gradient portions of the system, which is supported by the hydrograph behavior at the downstream site in Bottom Cave that indicates potential back flooding behavior (Figure 3). These results suggest that the water quality of the river may impact habitats in the most downstream reaches of the cave system. The hydrograph data and observed flood debris in the cave indicate that the river can influence the lower 1 km of traversable conduit. These combined factors indicate that flood conditions are frequent enough to maintain a similar population of isopods in what dye tracing shows are two distinct flow paths, under low flow conditions.
Additionally, the hydrological connectivity based on groundwater isopod genetic data was not always concordant with the patterns of connectivity inferred from dye tracing: some of the genetic groupings did not follow the flow paths identified through dye tracing. The lack of habitat connections between some groups suggests that there are likely population barriers, such as large waterfalls, along these flow paths, which prevent connectivity between isopod populations. Even with this limitation, population genetics adds some detail to flow-path connections that otherwise are not apparent from the dye traces. The grouping of sites H, K, M, and N, which are all small infeeding streams, and site F likely indicates a continuous unsaturated storage zone in the overlying limestone that is feeding the mainstream system (Figure 8). Site D contains individuals from the same cluster as the infeeder sites, as well as individuals from the Bottom Cave cluster (sites A and E), suggesting connectivity between the unsaturated zone system and the base stream in Bottom Cave (Figure 9). Likewise, the genetic similarity between Sites C and G suggests that there may be some unsaturated zone connectivity between the Surprise Stream and Lower North Cave. However, dye trace results did not show this potential connection as dye-tracing efforts focused on the point recharge to the system rather than local-scale unsaturated zone systems that can have different flow behaviors, i.e., [53]. The Surprise Stream (Site C) also has individuals unique to this location, indicating there is an additional storage area that feeds this stream without connectivity to other sites in the Fern Cave System. Sites A and E, and one individual from Site D, formed a cluster, suggesting connectivity between these sites (Figure 8). Hydrologic connectivity between Sites B and C has been identified via dye tracing; however, Site A is in a separate groundwater system based on dye trace results. However, the hydrograph data show that back flooding from the Paint Rock River influences the downstream section of Bottom Cave (Figure 3), which may result in occasional habitat connectivity between these portions of the system, allowing for dispersal between these sites in the lower section of the base-level streams.

4.2. Isotopic Tracers

While genetic data provided clearer insights into potential flow connections, isotope data provide greater insights into processes occurring along the flow paths; however, our results show significant limitations based on (1) our limited dataset, (2) our existing knowledge of the dietary patterns of stygian species, and (3) the multiple potential drivers of fractionation. Based on the general similarities between the isotopic values of the isopods and sediment, it is likely that the isopods are consuming carbon sources similar to those in the water and sediment. However, there is not constant trophic discrimination between the isopods and either the dissolved organic carbon or the bulk organic carbon sediment isotope values, making the actual carbon food source uncertain. While detailed trophic dietary studies have not been completed for this species to our knowledge, it is unlikely for a discrimination factor to have a range of 8‰ between the isopod and the DOC or 3‰ between the isopods and the sediment organic matter. In this study, carbon isotopes provided limited value in understanding this groundwater system; in regions with a wider variability in plant types, these still have the potential to be utilized as a tracer in karst systems [54].
Higher δ15N values at the location with observed bat guano support a localized food source (Site M). The isotopic measurement of a guano core from Fern Cave reports values of ~14‰ δ15N and ~−25‰ δ13C [55], similar to our sample with a 12.6‰ δ15N. Given that this high value is not observed in other samples, the contribution of guano to the nitrogen supply further down the cave flow path appears limited. More information is needed on dietary patterns to use isotopes as a reliable proxy for isopod food sources, though this sample highlights the sensitivity of isotope measurements in localized diet variations.
Water isotope values, while generally similar, may also provide some insight into flow paths and storage duration. The sampling site at Bottom Cave US (Site F) had the most positive water isotope values. These values show a trend toward summer precipitation values, while the remaining sites are more similar to October average precipitation values. These differences might indicate either more mixing with older waters or longer and slower flow paths. Future seasonal sampling would allow for better distinction between these alternatives and potentially illuminate regions of rapid flow.
Additionally, the mineralization of the dissolved organic carbon within the watershed are likely driving changes in the δ13CDOC. Based on the negative relationship between alkalinity and δ13CDIC, a more negative inorganic source is being added to the system and/or an isotopically heavier fraction is being removed. The dissolution of the local carbonate rocks and the associated changes in the HCO3 content would push the system to being more isotopically positive, counter to the trends observed. Photosynthesis is also excluded, given the subterranean environment. The most likely scenario, therefore, is the mineralization of isotopically light organic matter. This process has the potential to augment the isotopic value of the remaining dissolved organic matter carbon food source for the isopods, along with providing a rough relationship with the water residence time; however, further work is needed to constrain the drivers of fractionation.

4.3. Updated Groundwater Behavior

The dye tracing results show a relatively simple, if not novel, groundwater system at Fern Cave (Figure 3): a small groundwater basin embedded within a larger system, without any overlap between the flow paths [31]. The addition of population genetic and isotopic data offers three critical modifications to our knowledge of this system: both systems are fed by a combination of three hydrologically separate zones of storage in the unsaturated zone, the downstream ends of these basins are hydrologically connected due to back flooding from the adjacent base-level stream, the Paint Rock River, and nutrient flow in this system is complex and does not inherently follow the traced flow paths. This updated model highlights the complexity and ephemeral nature of flow behaviors present in karst groundwater systems.
While other researchers have focused on similar inter-basin flow behavior, e.g., [6,56], there work has often used water budget calculations and hydrograph behavior exclusively. Previous work has also mentioned the potential value of biological data for understanding aquifer behavior, e.g., [11,16,19]. Here, our work expands on these ideas through adding population genetics to the existing toolbox of tracer techniques to allow for a more nuanced assessment of the connectivity between two systems.

5. Conclusions

While we were unable to find similar studies to this, our results highlight the potential value of incorporating population genetics and further isotope geochemistry into karst basin analysis. The combination of traditional methods of karst groundwater tracing with these new approaches has the potential to improve our understanding of karst systems In the Fern Cave system, population genetic data indicate three distinct zones of storage in the unsaturated zone above the cave and a zone of back flooding that results in ephemeral connectivity between two groundwater basins (Figure 9). When nitrogen isotopic data are added to the interpretation, it shows that one of the unsaturated zone sites likely contributes minimal nutrients to the base-level stream. Additionally, water isotope data suggest substantial seasonal storage due to the relative similarity to fall precipitation. These added details are critical in both understanding the dynamics of flow behavior and improving the management of these systems.
Our diverse datasets highlight the importance of a multi-pronged approach to understanding karst groundwater systems. In particular, these results indicate that the population genetic information of stygian species can provide a critical new perspective on groundwater behavior.

Supplementary Materials

The following supporting information can be downloaded at: https://www.mdpi.com/article/10.3390/hydrology11020023/s1, Figure S1: Discriminant analysis of principal components (DAPC) membership probabilities for the best supported number of clusters (K = 4).

Author Contributions

Conceptualization, B.W.T. and B.V.M.; methodology, A.M.E., M.L.N. and B.V.M.; formal analysis, B.W.T., B.V.M., M.L.N. and A.M.E.; field investigation, B.W.T., B.V.M. and M.L.N.; data curation, B.W.T. and B.V.M.; writing—original draft preparation, B.W.T., B.V.M., M.L.N. and A.M.E.; writing—review and editing, B.W.T., B.V.M., M.L.N. and A.M.E.; project administration, B.W.T.; funding acquisition, B.W.T., B.V.M., M.L.N. and A.M.E. All authors have read and agreed to the published version of the manuscript.

Funding

This research was funded by United States Fish and Wildlife Service, grant number F19AC00628.

Data Availability Statement

Data are available, as described in the text, via the USGS [32] and KGS [42] data archives.

Acknowledgments

The authors would like to thank Brian Ham, Tommy Inebnit, and Lee Anne Bledsoe for assistance with fieldwork.

Conflicts of Interest

The authors declare no conflicts of interest. The funders had no role in the design of the study; in the collection, analyses, or interpretation of data; in the writing of the manuscript; or in the decision to publish the result.

References

  1. Goldscheider, N.; Chen, Z.; Auler, A.; Bakalowicz, M.; Broda, S.; Drew, D.; Hartmann, J.; Jiang, G.; Moosdorf, N.; Stevanovic, Z.; et al. Global distribution of carbonate rocks and karst water resources. Hydrogeol. J. 2020, 28, 1661–1677. [Google Scholar] [CrossRef]
  2. Gutierrez, F.; Parise, M.; De Waele, J.; Jourde, H. A review on natural and human-induced geohazards and impacts in karst. Earth-Sci. Rev. 2014, 138, 61–88. [Google Scholar] [CrossRef]
  3. Guo, F.; Yuan, D.; Qin, Z. Groundwater contamination in karst areas of southwestern China and recommended countermeasures. Acta Carsologica 2010, 39, 389–399. [Google Scholar] [CrossRef]
  4. Green, R.T.; Painter, S.L.; Sun, A.; Worthington, S.R.H. Groundwater Contamination in Karst Terranes. Water Air Soil Pollut. Focus 2006, 6, 157–170. [Google Scholar] [CrossRef]
  5. Zhou, Y.; Guo, H.; Lu, H.; Mao, R.; Zheng, H.; Wang, J. Analytical methods and application of stable isotopes in dissolved organic carbon and inorganic carbon in groundwater: Analytical methods for carbon isotopes in DIC and DOC. Rapid Commun. Mass Spectrom. 2015, 29, 1827–1835. [Google Scholar] [CrossRef] [PubMed]
  6. Morrissey, P.J.; McCormack, T.; Naughton, O.; Johnston, P.M.; Gill, L.W. Modelling groundwater flooding in a lowland karst catchment. J. Hydrol. 2020, 580, 124361. [Google Scholar] [CrossRef]
  7. Basu, B.; Morrissey, P.; Gill, L.W. Application of nonlinear time series and machine learning algorithms for forecasting groundwater flooding in a lowland karst area. Water Resour. Res. 2022, 58, e2021WR029576. [Google Scholar] [CrossRef]
  8. Goldscheider, N. Overview of methods applied in karst hydrogeology. In Karst Aquifers—Characterization and Engineering, Professional Practice in Earth Sciences; Springer International Publishing: Cham, Switzerland, 2015; pp. 127–145. [Google Scholar] [CrossRef]
  9. Benischke, R. Review: Advances in the methodology and application of tracing in karst aquifers. Hydrogeol. J. 2021, 29, 67–88. [Google Scholar] [CrossRef]
  10. Kambesis, P. The importance of cave exploration to scientific research. J. Cave Karst Stud. 2007, 69, 46–58. [Google Scholar]
  11. Sovie, A.R.; Tobin, B.W.; Farmer, B. Understanding Karst Landscape Evolution Through Ecosystems: Cave Connectivity and Isolation. Carbonates Evaporites 2022, 37, 8. [Google Scholar] [CrossRef]
  12. Saccò, M.; Blyth, A.; Bateman, P.W.; Hua, Q.; Mazumder, D.; White, N.; Humphreys, W.F.; Laini, A.; Griebler, C.; Grice, K. New light in the dark—A proposed multidisciplinary framework for studying functional ecology of groundwater fauna. Sci. Total Environ. 2019, 662, 963–977. [Google Scholar] [CrossRef]
  13. Culver, D.C.; Christman, M.C.; Elliott, W.R.; Hobbs, H.H., III; Reddell, J.R. The North American obligate cave fauna: Regional patterns. Biodivers. Conserv. 2003, 12, 441–468. [Google Scholar] [CrossRef]
  14. Barr, T.C. Observations on the Ecology of Caves. Am. Nat. 1967, 101, 475–491. [Google Scholar] [CrossRef]
  15. Goldscheider, N.; Meiman, J.; Pronk, M.; Smart, C. Tracer tests in karst hydrogeology and speleology. Int. J. Speleol. 2008, 37, 27–40. [Google Scholar] [CrossRef]
  16. Jordan, S.; Hand, B.K.; Hotaling, S.; Delvecchia, A.G.; Malison, R.; Nissley, C.; Luikart, G.; Stanford, J.A. Genomic data reveal similar genetic differentiation in aquifer species with different dispersal capabilities and life histories. Biol. J. Linn. Soc. 2020, 129, 315–322. [Google Scholar] [CrossRef]
  17. Krejca, J.K.; Weckerley, B. Detection probabilities of karst invertebrates. In Proceedings of the Eighteenth National Cave and Karst Management Symposium, St. Louis, MI, USA, 8–12 October 2008; Elliott, W.R., Ed.; NCKMS Steering Committee: Albuquerque, NM, USA, 2008; pp. 283–289. [Google Scholar]
  18. Culver, D.C.; Pipan, T. Shifting paradigms of the evolution of cave life. Acta Carsologica 2015, 44, 415–425. [Google Scholar] [CrossRef]
  19. Johns, T.; Jones, J.I.; Knight, L.; Maurice, L.; Wood, P.; Robertson, A. Regional-scale drivers of groundwater faunal distributions. Freshw. Sci. 2015, 34, 316–328. [Google Scholar] [CrossRef]
  20. Krejca, J.K. Stygobite Phylogenetics as a Tool for Determining Aquifer Evolution. Ph.D. Dissertation, The University of Texas at Austin, Austin, TX, USA, 2005. [Google Scholar]
  21. Niemiller, M.L.; Near, T.J.; Fitzpatrick, B.M. Delimiting species using multilocus data: Diagnosing cryptic diversity in the southern cavefish, Typhlichthys subterraneus (Teleostei: Amblyopsidae). Evolution 2012, 66, 846–866. [Google Scholar] [CrossRef]
  22. Devitt, T.J.; Wright, A.M.; Cannatella, D.C.; Hillis, D.M. Species delimitation in endangered groundwater salamanders: Implications for aquifer management and biodiversity conservation. Proc. Natl. Acad. Sci. USA 2019, 116, 2624–2633. [Google Scholar] [CrossRef] [PubMed]
  23. Maurice, L.; Bloomfield, J. Stygobitic invertebrates in groundwater—A review from a hydrogeological perspective. Freshw. Rev. 2012, 5, 51–71. [Google Scholar] [CrossRef]
  24. Iannella, M.; Fiasca, B.; Di Lorenzo, T.; Biondi, M.; Di Cicco, M.; Galassi, D.M.P. Spatial Distribution of stygobitic crustacean harpacticoids at the boundaries of groundwater habitat types in Europe. Sci. Rep. 2020, 10, 19043. [Google Scholar] [CrossRef]
  25. Datry, T.; Malard, F.; Gibert, J. Response of invertebrate assemblages to increased groundwater recharge rates in a phreatic aquifer. J. N. Am. Benth. Soc. 2015, 24, 461–477. [Google Scholar] [CrossRef]
  26. Wilson, G.D.F. Global diversity of Isopod crustaceans (Crustacea; Isopoda) in freshwater. Hydrobiologia 2008, 595, 231–240. [Google Scholar] [CrossRef]
  27. Steeves, H.R. The troglobitic Asellids of the United States: The stygius group. Am. Midl. Nat. 1963, 69, 470–481. [Google Scholar] [CrossRef]
  28. Lewis, J.J. Systematics of the troglobitic Caecidotea (Crustacea: Isopoda: Asellidae) of the southern interior low plateaus. Brimleyana 1982, 8, 65–74. [Google Scholar]
  29. Hess, A.; Bonett, R. Utilizing native isopods to assess the connectivity and quality of Oklahoma groundwater. In Oklahoma Water Resources Center 2018 Annual Research Report; Oklahoma Water Resources Center: Stillwater, OK, USA, 2019. [Google Scholar]
  30. Osborne, W.E.; Ward, W.E., II; Irvin, G.D. Geologic Map and Cross Sections of the Paint Rock 7.5-Minute Quadrangle, Jackson and Madison Counties, Alabama. In Geological Survey of Alabama Quadrangle Series Map QS59, Scale 1, 24,000; Geological Survey of Alabama: Tuscaloosa, AL, USA, 2013. [Google Scholar]
  31. Miller, B.V.; Tobin, B.W. Mapping karst groundwater flow paths and delineating recharge areas for Fern Cave, Alabama through the use of dye tracing. In United States Geological Survey Scientific Investigation Maps; USGS: Reston, VA, USA, 2023. [Google Scholar] [CrossRef]
  32. Miller, B.V.; Tobin, B.W.; Hourigan, A.M. Mapping Karst Groundwater Flow Paths and Delineating Recharge Areas for Fern Cave, Alabama through the Use of Dye Tracing; U.S. Geological Survey Data Release; USGS: Reston, VA, USA, 2023. [Google Scholar] [CrossRef]
  33. Shelton, L.R. Field Guide for Collecting and Processing Stream-Water Samples for the National Water-Quality Assessment Program; U.S. Geological Survey Open-File Report 94-455; USGS: Reston, VA, USA, 1994. [Google Scholar]
  34. Francois, C.M.; Mermillod-Blondin, F.; Malard, F.; Fourel, F.; Lécuyer, C.; Douady, C.J.; Simon, L. Trophic ecology of groundwater species reveals specialization in a low-productivity environment. Funct. Ecol. 2016, 30, 262–273. [Google Scholar] [CrossRef]
  35. Aggarwal, P.K.; Araguas-Araguas, L.; Groning, M.; Kulkarni, K.M.; Kurttas, T.; Newman, B.D.; Tanweer, A. Laser Spectroscopic Analysis of Liquid Water Samples for Stable Hydrogen and Oxygen Isotopes; IAEA: Wien, Austria, 2009; p. 49. [Google Scholar]
  36. Coplen, T.B.; Wassenaar, L.I. LIMS for lasers 2015 for achieving long-term accuracy and precision of δ2H, δ17O, and δ18O of waters using laser absorption spectrometry: LIMS for lasers 2015. Rapid Commun. Mass Spectrom. 2015, 29, 2122–2130. [Google Scholar] [CrossRef] [PubMed]
  37. Rivé, K.; Ader, M.; Jézéquel, D.; Agrinier, P. Improved method for isotopic and quantitative analysis of dissolved inorganic carbon in natural water samples. Rapid Commun. Mass Spectrom. 2006, 20, 2243–2251. [Google Scholar] [CrossRef]
  38. Wilson, J.W.; Munizzi, J.; Erhardt, A.M. Preservation methods for the isotopic composition of dissolved carbon species in non-ideal conditions. Rapid Commun. Mass Spectrom. 2020, 34, e8903. [Google Scholar] [CrossRef] [PubMed]
  39. Lang, S.Q.; Bernasconi, S.M.; Früh-Green, G.L. Stable isotope analysis of organic carbon in small (μg C) samples and dissolved organic matter using a GasBench preparation device: δ13C of organic compounds by GasBench. Rapid Commun. Mass Spectrom. 2012, 26, 9–16. [Google Scholar] [CrossRef] [PubMed]
  40. Zhou, W. Drainage and flooding in karst terranes. Environ. Geol. 2007, 51, 963–973. [Google Scholar] [CrossRef]
  41. Midwood, A.J.; Boutton, T.W. Soil carbonate decomposition by acid has little effect on δ13C of organic matter. Soil Biol. Biochem. 1998, 30, 1301–1307. [Google Scholar] [CrossRef]
  42. Kim, M.-S.; Lee, W.-S.; Kumar, K.S.; Shin, K.-H.; Robarge, W.; Kim, M.; Lee, S.R. Effects of HCl pretreatment, drying, and storage on the stable isotope ratios of soil and sediment samples. Rapid Commun. Mass Spectrom. 2016, 30, 1567–1575. [Google Scholar] [CrossRef]
  43. Tobin, B.; Miller, B.V.; Niemiller, M.; Erhardt, A. Hydrology Data for Fern Cave, Alabama (2020–2022); Kentucky Geological Survey: Lexington, KY, USA, 2023. [Google Scholar] [CrossRef]
  44. Baird, N.A.; Etter, P.D.; Atwood, T.S.; Currey, M.C.; Shiver, A.L.; Lewis, Z.A.; Selker, E.U.; Cresko, W.A.; Johnson, E.A. Rapid SNP discovery and genetic mapping using sequenced RAD markers. PLoS ONE 2008, 3, e3376. [Google Scholar] [CrossRef] [PubMed]
  45. Bayona-Vásquez, N.J.; Glenn, T.C.; Kieran, T.J.; Pierson, T.W.; Hoffberg, S.L.; Scott, P.A.; Bentley, K.E.; Finger, J.W.; Louha, S.; Troendle, N.; et al. Adapterama III: Quadruple-indexed, double/triple-enzyme RADseq libraries (2RAD/3RAD). PeerJ 2019, 7, e7724. [Google Scholar] [CrossRef]
  46. Rohland, N.; Reich, D. Cost-effective, high-throughput DNA sequencing libraries for multiplexed target capture. Genome Res. 2005, 22, 939–946. [Google Scholar] [CrossRef]
  47. Eaton, D.A.R.; Overcast, I. Ipyrad: Interactive Assembly and Analysis of RADseq Data Sets. 2016. Available online: https://ipyrad.readthedocs.io/ (accessed on 1 May 2022).
  48. Jombart, T.; Devillard, S.; Balloux, F. Discriminant analysis of principal components: A new method for the analysis of genetically structured populations. BMC Genet. 2010, 11, 94. [Google Scholar] [CrossRef]
  49. Jombart, T.; Kamvar, Z.N.; Collins, C.; Lustrik, R.; Beugin, M.P.; Knaus, B.J.; Jombart, M.T. Package ‘Adegenet’. Github Repository. 2018. Available online: https://github.com/thibautjombart/adegenet (accessed on 1 May 2022).
  50. R Core Team. R: A Language and Environment for Statistical Computing; R Foundation for Statistical Computing: Vienna, Austria, 2021; Available online: https://www.R-project.org/ (accessed on 1 May 2022).
  51. Frichot, E.; François, O. LEA: An R package for landscape and ecological association studies. Methods Ecol. Evol. 2015, 6, 925–929. [Google Scholar] [CrossRef]
  52. Frichot, E.; Mathieu, F.; Trouillon, T.; Bouchard, G.; François, O. Fast and efficient estimation of individual ancestry coefficients. Genetics 2014, 196, 973–983. [Google Scholar] [CrossRef] [PubMed]
  53. Carrière, S.D.; Chalikakis, K.; Danquigny, C.; Davi, H.; Mazzilli, N.; Ollivier, C.; Emblanch, C. The role of porous matrix in water flow regulation within a karst unsaturated zone: An integrated hydrogeophysical approach. Hydrogeol. J. 2016, 24, 1905–1918. [Google Scholar] [CrossRef]
  54. Wilson, J.W.; Erhardt, A.M.; Tobin, B.W. Isotopic and geochemical tracers of groundwater flow in the Shivwits Plateau, Grand Canyon National Park, USA. Hydrogeol. J. 2022, 30, 495–510. [Google Scholar] [CrossRef]
  55. Campbell, J.W.; Waters, M.N.; Rich, F. Guano core evidence of palaeoenvironmental change and Woodland Indian inhabitance in Fern Cave, Alabama, USA, from the mid-Holocene to present. Boreas 2017, 46, 462–469. [Google Scholar] [CrossRef]
  56. Le Mesnil, M.; Charlier, J.-B.; Moussa, R.; Caballero, Y. Interbasin groundwater flow: Characterization, role of karst areas, impact on annual water balance and flood processes. J. Hydrol. 2020, 585, 1245583. [Google Scholar] [CrossRef]
Figure 2. Piper diagram of ion geochemistry samples. Samples are represented by (+), all samples are Ca-CO3-dominant water types.
Hydrology 11 00023 g002
Figure 3. Hydrograph behavior for sites in Fern Cave indicating the typical storm responses for Site C, Surprise Stream, (gray), and Site E, Bottom Cave Waterfall (black). Bottom Cave downstream, Site D (red) shows a differing storm response, which may suggest back flooding from the Paint Rock River. Data for Site G, Lower North Cascade were not available during this period.
Hydrology 11 00023 g003
Figure 4. Carbon and nitrogen isotope values for water, sediment, and isopods in Fern Cave. All error bars are less than the symbol at <0.2‰ for all analyses.
Hydrology 11 00023 g004
Figure 5. Water isotopes from sampling locations (blue dots) in comparison to the local meteoric water line (waterisotopes.org, accessed 15 November 2023). More positive values typify summer precipitation, with values of ~−29‰ δ2H and −5‰ δ18O predicted for average October precipitation.
Hydrology 11 00023 g005
Figure 6. Discriminant analysis of principle components (DAPC) scatterplot of individual samples colored by cluster assignment. The axes represent the first two principal components (PCs).
Hydrology 11 00023 g006
Figure 7. Estimates of admixture proportions inferred with sNMF for the best supported number of groups (K = 4). Letters represent sites in Table 1. Colors represent clusters from Figure 6.
Hydrology 11 00023 g007
Figure 8. Plan-view map of Fern Cave showing the sampled sites for population genetic groupings with dye trace flow paths from Miller et al. [32]. Colors represent distinct groups, as shown in Figure 6 and Figure 7. Two sites included individual isopods that belonged to two groups, sites D and C. Site C contained a group that was unique to the site and individuals that belonged to the same group as site G. Site D had individuals that belonged to the orange group (sites A and E) and pink group (sites F, H, K, M, and N).
Hydrology 11 00023 g008
Figure 9. Profile of the cave system showing the cave passage (black). Vertical representation of isopod populations and associated groundwater flow paths (colored circles matching colors in Figure 7). Non-intersecting flow paths are noted in red and blue. Blue, yellow, and purple ovals represent likely unsaturated zone connections based on isopod groupings. Arrows indicate likely flow connections between the unsaturated zone and cave.
Hydrology 11 00023 g009
Table 2. Hydrograph data-recording periods for each monitored site.
Site IDSite NameInstallationRemoval
DBottom Cave—downstream17 February 202011 August 2021
EBottom Cave—waterfall17 February 202011 August 2021
CSurprise Stream15 March 20207 February 2021
GLower North—cascade27 July 202010 August 2021
Disclaimer/Publisher’s Note: The statements, opinions and data contained in all publications are solely those of the individual author(s) and contributor(s) and not of MDPI and/or the editor(s). MDPI and/or the editor(s) disclaim responsibility for any injury to people or property resulting from any ideas, methods, instructions or products referred to in the content.