Article

Sensitivity of Groundwater Recharge Assessment to Input Data in Arid Areas

by
Salah Basem Ajjur
* and
Emanuele Di Lorenzo
*
Department of Earth, Environmental & Planetary Sciences, Brown University, Providence, RI 02912, USA
*
Authors to whom correspondence should be addressed.
Hydrology 2024, 11(2), 28; https://doi.org/10.3390/hydrology11020028
Submission received: 13 January 2024 / Revised: 8 February 2024 / Accepted: 12 February 2024 / Published: 14 February 2024
(This article belongs to the Special Issue Hydrological Processes in Agricultural Watersheds)

Abstract

:
Natural groundwater recharge (GR) assessment depends on several hydrogeological and climatic inputs, where uncertainty is inevitable. Assessing how inputs’ uncertainty affects GR estimation is important; however, it remains unclear in arid areas. This study assesses inputs’ uncertainty by examining the changes in GR simulations resulting from modifications in climatic, land use, and soil inputs. A physical-based hydrological model was built to estimate GR from 18 different GR scenarios across Qatar. Scenarios S1–S7 were created from different climatic inputs but identical land use and soil maps. Scenarios S8–S14 were created from different land use maps (analyzed from historical Landsat satellite images) but similar climatic and soil inputs. In S15–S18, the soil parameters were changed while the climatic and land use maps were kept the same. The results show that climatic inputs are key factors controlling the GR in arid areas, followed by land use inputs and soil classification. A strong correlation was observed between the GR values and precipitation, while moderate (non-significant) correlations were observed between the GR values and potential evapotranspiration and wind speed. Soil changes affected the GR simulations but inconsiderably compared with climatic and land use inputs. Since GR estimation is fundamental but uncertain in arid areas, the study findings contribute to narrowing the uncertainty in GR estimation.

1. Introduction

The absence of surface water in arid areas necessitates aquifer management and augmentation for fulfilling water requirements and sustaining life [1,2]. A fundamental process for aquifer management and augmentation is groundwater recharge (GR) [2,3]. GR helps increase aquifers’ storage and improve their quality. However, GR is a less understood and complex process in arid areas [3]. It cannot be measured on a large scale. It also differs in time and space, depending on several hydrogeological factors such as land use, topography, and soil type and climatic factors such as precipitation, temperature, and evapotranspiration [4,5,6].
A growing body of literature has developed several methods to estimate GR. These methods depend on satellite observations, soil and energy water balance, chloride mass balance, water table fluctuation, and numerical simulations [3,5,7,8]. Using satellite, meteorological, and land surface data, López Valencia, Johansen [9] quantified groundwater abstraction from irrigated crop water needs in the Al-Kharj and Al-Jawf regions in the Kingdom of Saudi Arabia. They found the groundwater abstraction calculations in 2015 to far exceed the GR values, showing a pressing need for comprehensive water resource management plans. Using an assimilation method, Khaki and Hoteit [10] combined multiple satellite remote sensing estimates and hydrological modeling results to investigate land–hydrologic water storage components across the Middle East between 1980 and 2019. They found a significant depletion of groundwater resources over arid regions in the Arabian Peninsula and Iran. Frequent drought events were mainly responsible for such depletion [10]. Using the water budget concept, Mazzoni, Heggy [11] forecasted groundwater conditions in the main aquifer systems in the Arabian Peninsula and North Africa through the mid-21st century. They concluded that there was a substantial deficit in the water budget, leading to a significant increase in food prices and potential socio-economic instabilities in Egypt, Libya, and Yemen, under current climatic and socio-economic conditions.
Deciding on an appropriate method for estimating GR in all circumstances is often a challenge. This challenge is more difficult in arid areas. Arid areas often suffer from a lack of long-term climatic data. Even if climatic data are readily available, there might be unreliable recording practices, which hinders relying on these data. Additionally, arid areas are likely to have heterogeneous geological conditions. For instance, numerous aquifer systems in the Arabian Peninsula are karst with high heterogeneity, e.g., Umm Radhuma, the W. Mountain aquifer, and the Jezira Tertiary Limestone aquifer. Knowledge is still limited about the hydrogeological characteristics of these systems [12]. Hydrogeologists tend to estimate missing data, introducing uncertainty to the GR results. Therefore, there is a pressing need for the reliable assessment of GR simulations in arid areas.
Previous studies investigated the uncertainty associated with GR assessment. In a semi-arid environment, Martos-Rosillo, González-Ramón [13] studied GR measurement in 51 carbonate aquifers in southern Spain. They used six measurement approaches and found significant differences in GR estimations from these approaches. Jackson, Meister [14] utilized a distributed recharge model to examine GR uncertainty resulting from climatic components in chalk aquifers in central-southern England. They concluded that the uncertainty in temperature and rainfall projections might lead to substantial uncertainty in future GR estimations. In Qatar, GR estimates have varied widely, with a clear discrepancy between them. For example, Kimrey [15] assessed the annual GR at 27 million cubic meters (Mm3), while Eccleston, Pike [16] specified this value (27 Mm3) for the northern aquifer only. Findings from Harhash and Yousif [17] proposed that the annual GR ranged between 21 and 166 Mm3 during 1972–1983. According to the Qatar General Electricity and Water Corporation (KAHRAMAA) and the Ministry of Municipality and Environment, the long-term annual average GR, between 1998 and 2017, was 71.6 Mm3. The changes in GR assessments are evident in the recent literature as well. While Baalousha, Barth [18] estimated an annual GR of 14.4 Mm3 in 2013/2014, the local authority recorded a value of 35 Mm3 for the same year (Qatar Planning and Statistics Authority [19].
Accordingly, there is high uncertainty in GR assessment across Qatar. The challenge is that aquifer management and augmentation plans depend on GR assessment. This challenge exhibits the dire necessity of reducing the uncertainty in GR assessments based on understanding the sensitivity of GR assessments to input data. Thus far, this uncertainty has not been narrowed; there is a need to determine how inputs’ uncertainty affects GR assessment. If the inputs’ uncertainty was evaluated, then further in-ground measurements could be carried out to improve the reliability of the most influential inputs and hence obtain more accurate GR measurements. This study aims to evaluate the contribution of inputs to the estimation of GR in arid areas. Taking Qatar as an example, this study comprises two objectives. First, it quantifies the GR across Qatar, providing important estimates for stakeholders and the decision-making framework. Second, it determines the main factors that control the GR distribution in arid areas. Since Qatar has witnessed significant climatic and anthropogenic changes in recent decades (see Section 1.1), it offers a good opportunity to explore the sensitivity of GR assessment to the changes in input data. The GR estimate is fundamental but uncertain in arid areas, and findings from the study contribute to narrowing the uncertainty in GR estimation.

1.1. Case Study

Qatar is a small country in the eastern Arabian Peninsula, between 24°16′ and 26°6′ North and 50°27′ and 51°24′ East, as Figure 1 shows. It has a total area of 11,650 km2. The climate is hyper-arid, characterized by minimal precipitation (<77 mm per year), scorching temperature (>39 °C in summer), and a very high humidity [2,20,21]. Qatar’s precipitation is mostly heterogeneous, intense, and falls in a short duration [20]. Current and future projections tell further precipitation and temperature extremes over Qatar throughout the 21st century [20,22]. Ajjur and Al-Ghamdi [23] investigated the future evolution of absolute temperature extremes from recent global climate models. They found the Arabian Peninsula to be a global warming hotspot that is largely projected to further increase in terms of the warmest and coldest days and nights. Tahir, Ajjur [20] also concluded there would be extreme heatwaves and increasing wet-bulb temperatures that could damage the human habitability of vital urban centers in the Arabian Peninsula by the end of the 21st century. Climatic extremes in the Arabian Peninsula might be influenced by global modes of climate variability [24].
Qatar has three principal aquifers representing the primary source for agricultural water requirements (see Figure 2) [16]. These aquifers are the northern, southern, and Allat basins [16]. In the early 1970s, the groundwater abstraction balanced GR [15,16,17]. However, recent anthropogenic and climatic changes have amplified the pressure on aquifer systems, disturbing the hydrologic balance of these systems. In recent decades, Qatar’s population increased rapidly, increasing the groundwater requirements. The population increased by ~500% between 2000 and 2019 [25]. Also, there was an increase in the annual per-capita water consumption during the last two decades. It grew from 500 L in 2011 to 557 L in 2018 [26]. The built environment of Doha (the capital city of Qatar) also transformed significantly toward a highly urbanized dominant hub with high-ranking living standards. This transformation aimed to make the country ready for hosting the Asia Games in 2006 and the FIFA World Cup in 2022. Shandas, Makido [27] studied the huge transformation of the Doha built environment between 1987 and 2013. Doha’s urbanization increased the impervious surfaces, limiting the GR, with the expectation of harmful consequences on the environment due to this transformation. Therefore, climate change and anthropogenic factors put aquifers under immense pressure. As a result, the storage in aquifers decreased, and the groundwater quality deteriorated, especially in the Northern aquifer, where most wells are located [28]. Aquifer deterioration hinders the current expansion of agricultural activities and food security and, therefore, threatens a critical development pillar of the Qatar National Vision 2030: stop the enduring depletion of aquifers and improve their conditions.

2. Data and Methods

This study obtained soil, land use, and topography data from the Qatar Ministry of Municipality and groundwater levels from the Schlumberger Water Service. Climatic data, including maximum, minimum, and average air temperatures, wind speed, and precipitation, were acquired from six meteorological stations distributed across the country. Figure 1 depicts the location of these stations, while their coordinates are tabulated in Table 1. The Qatar Civil Aviation Authority manages these stations, and their data are screened regularly to ensure data homogeneity and quality.
To estimate the potential evapotranspiration (PET), this study used the Hargreaves and Samani [29] equation. Hargreaves and Samani [29] is a common method that can provide reliable PET estimations in different environments [29,30]. It calculates the daily PET from the daily average temperature (Tmean), maximum temperature (Tmax), and minimum temperature (Tmin) as per Equation (1):
P E T d a i l y = 0.0023   R a   T m e a n + 17.8   s q r t   T m a x T m i n ,
where all temperatures have the unit of °C. The Ra corresponds to the water equivalent of the extra-terrestrial radiation in mm per day. It is computed from the latitude and daily data of the year [30]. Daily PETs are multiplied by the number of days in each month to obtain monthly PETs. Monthly PETs are then summed up to obtain seasonal and annual PETs. Summer is represented by the months between April and September, while the other months (October to March) represent the winter season. After data preparation, these data are input into the WetSpass model.

WetSpass

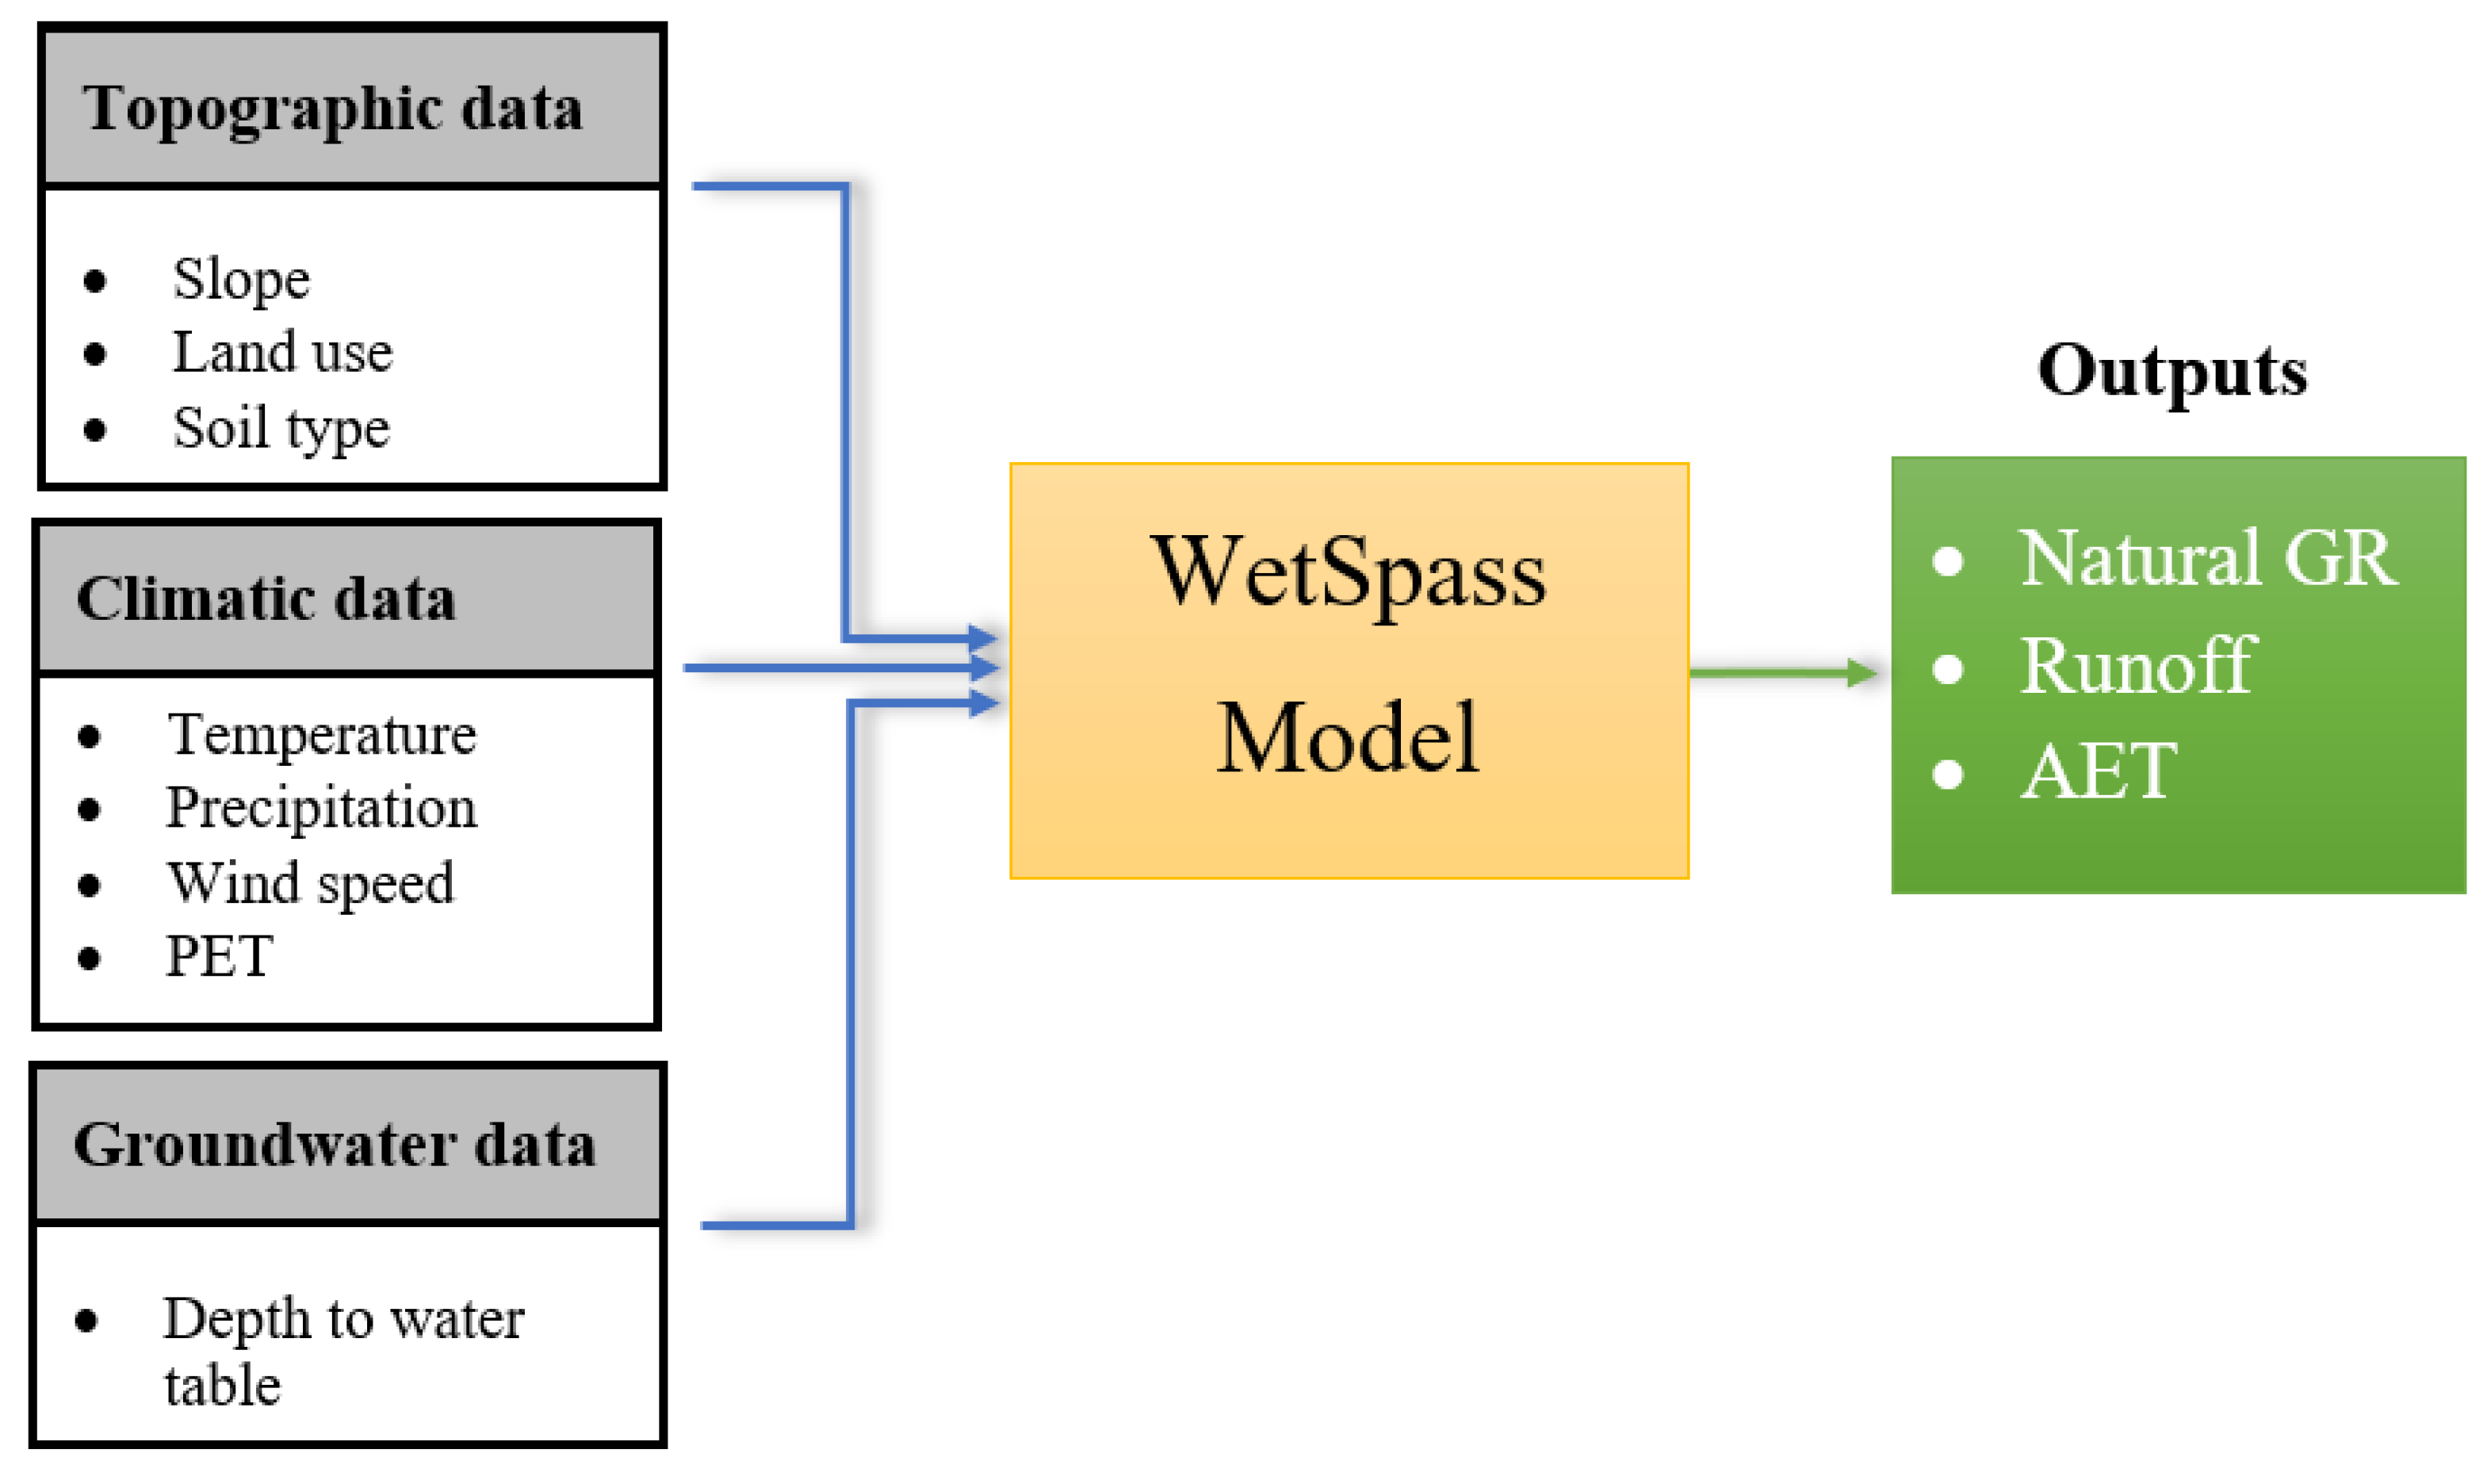
The WetSpass is a physically-based spatially distributed hydrological model that computes hydrological cycle components under quasi-steady state conditions [4]. Relying on the water balance concept, WetSpass partitions precipitation between surface runoff, GR, and actual evapotranspiration (AET). As shown in Figure 3, WetSpass requires several inputs to estimate the GR, surface runoff, and AET losses. These include the physical catchment parameters (slope, soil, and land use categories), the groundwater level depth, and climatic parameters (precipitation, air temperature, wind speed, and PET). The land use and soil type maps are linked with WetSpass as attribute tables. WetSpass is fully integrated with ArcView, which enables the preparation of the model’s inputs using the ArcGIS environment.
Four parts represent the non-uniformity of the land cover for each grid cell in WetSpass. These parts are vegetated areas, bare-soil, open-water surfaces, and impervious surfaces. Considering the vegetated area as an example, the monthly water balance is estimated using a raster cell as per Equation (2):
P = S + T + I + GR,
where P is the precipitation, S is the surface runoff, T is the transpiration, and I is the interception fraction. The S relates to precipitation characteristics such as the amount and intensity, the interception fraction, and the soil infiltration capacity. The interception fraction varies according to the land cover and represents a constant percentage of annual precipitation. AET is estimated as the sum of T and E (evaporation). The GR is the residual term of the water balance. All components have the unit of mm year−1. Similarly, the water balance is calculated in bare soil, open-water surfaces, and impervious surfaces, although, the interception and transpiration terms are omitted for bare soil, open-water, and impervious surfaces. For more information about WetSpass, including computational equations, model calibration, and validation, the reader can refer to Batelaan and De Smedt [4].

3. Methods

The research methodology was implemented in three steps. The first step was to calculate the GR using WetSpass. To this end, Qatar land use categories were grouped into three primary categories. These are urban areas, vegetation areas, and bare land. Urban areas involve built-up surfaces like domestic and business buildings, roads, and industrial districts. Vegetation areas consist of green agricultural spaces such as farms and parks. The last category (bare lands) consists mainly of lithosols, which represent most parts of Qatar [16]. The soil maps were categorized into lithosols, Sabkha, sand, and agricultural areas. The slope map was derived from the surface topography. Observations of water level depths were utilized for both seasons. Regarding the climatic parameters, the inverse distance weighted interpolation was used to weigh the impact of each station on the entire country. The mean values of the temperature and wind speed climatic parameters were calculated by averaging the monthly data, whereas rainfall observations were accumulated to obtain the seasonal sums. All maps were re-gridded into a uniform identical resolution of 30 m, and WetSpass was executed for summer and winter. The summer and winter GRs were added to obtain the annual GR.
Second, the GR computations were repeated using inputs from 18 scenarios, as Table 2 shows. We created these scenarios to examine how the GR would change in response to differences in climatic parameters to quantify the GR’s uncertainty. Scenarios S1–S7 represented the changes in climatic inputs as the averages of seven periods between 1986 and 2020. The land use and soil parameters were identical in S1–S7 (i.e., considered for 2020). In Scenarios S8–S14, the land use maps were changed, while the climatic and soil inputs were kept the same to investigate how land use changes would affect GR distribution. The land use maps were defined as those for seven periods incremented equally between 1986 and 2020. Historical land use maps were prepared and processed from the US Geological Survey (USGS) Landsat satellite images https://www.usgs.gov/, accessed on 12 November 2023. The USGS Landsat images were acquired at a resolution of 30 m and a cloudiness ratio of below 5%. Scenarios S15–S18 comprised soil changes under identical climatic and land use impacts. In S15–S18, the soil classes were perturbed, so that one different class had the largest coverage in each scenario.
Lastly, the study applied Pearson’s correlation to verify the possible relationships between the mean GR values and other inputs. The mean values of the climatic inputs and GR maps were prepared, and only significant correlations were chosen for S1–S7. For S8–S14, correlations were investigated between the GR values and land use classes, whereas in S15–S18, correlations were investigated between the GR values and soil categories.

4. Results

The results are presented in two subsections. Section 4.1 shows the spatial variations in the annual GR resulting from changing climatic, land use, and soil components. Section 4.2 discusses the correlation between the mean GR estimations and the changes in input components.

4.1. GR Variations Due to Changes in Input Parameters

Figure 4 depicts the spatial distribution of the annual GR in scenarios involving changing climatic parameters (i.e., S1–S7), that is, the climate variability between 1986 and 2020. The periods of temporal coverage are tabulated in Table 2. These periods are 1986–1990, 1991–1995, 1996–2000, 2001–2005, 2006–2010, 2011–2015, and 2016–2020. The results showed that the annual GR varied significantly according to the changes in climatic inputs. The annual GR varied from 10.9 million cubic meters (Mm3) in S16 to 60.17 Mm3 in S4. Considering the mean value over the entire area, the GR differed among the seven scenarios, showing large differences. The mean values of the annual GR were ~1 mm in S1 and S6, 5.4 mm in S2, ~10 mm in S4 and S5, and 2.47 in S7; whereas the largest mean value of annual GR was recorded in S3 (65.6 mm). The maximum values of the annual GR varied up to 73 mm in all scenarios, except S3. In S3 (1996–2000), the maximum value of the annual GR was 104 mm in the northern urban parts. The maximum values of the annual GR were found to be small in scenarios S1–S2 and S5–S7, compared to the other scenarios, since they did not exceed 33 mm. Therefore, changes in climatic inputs significantly changed the GR estimations.
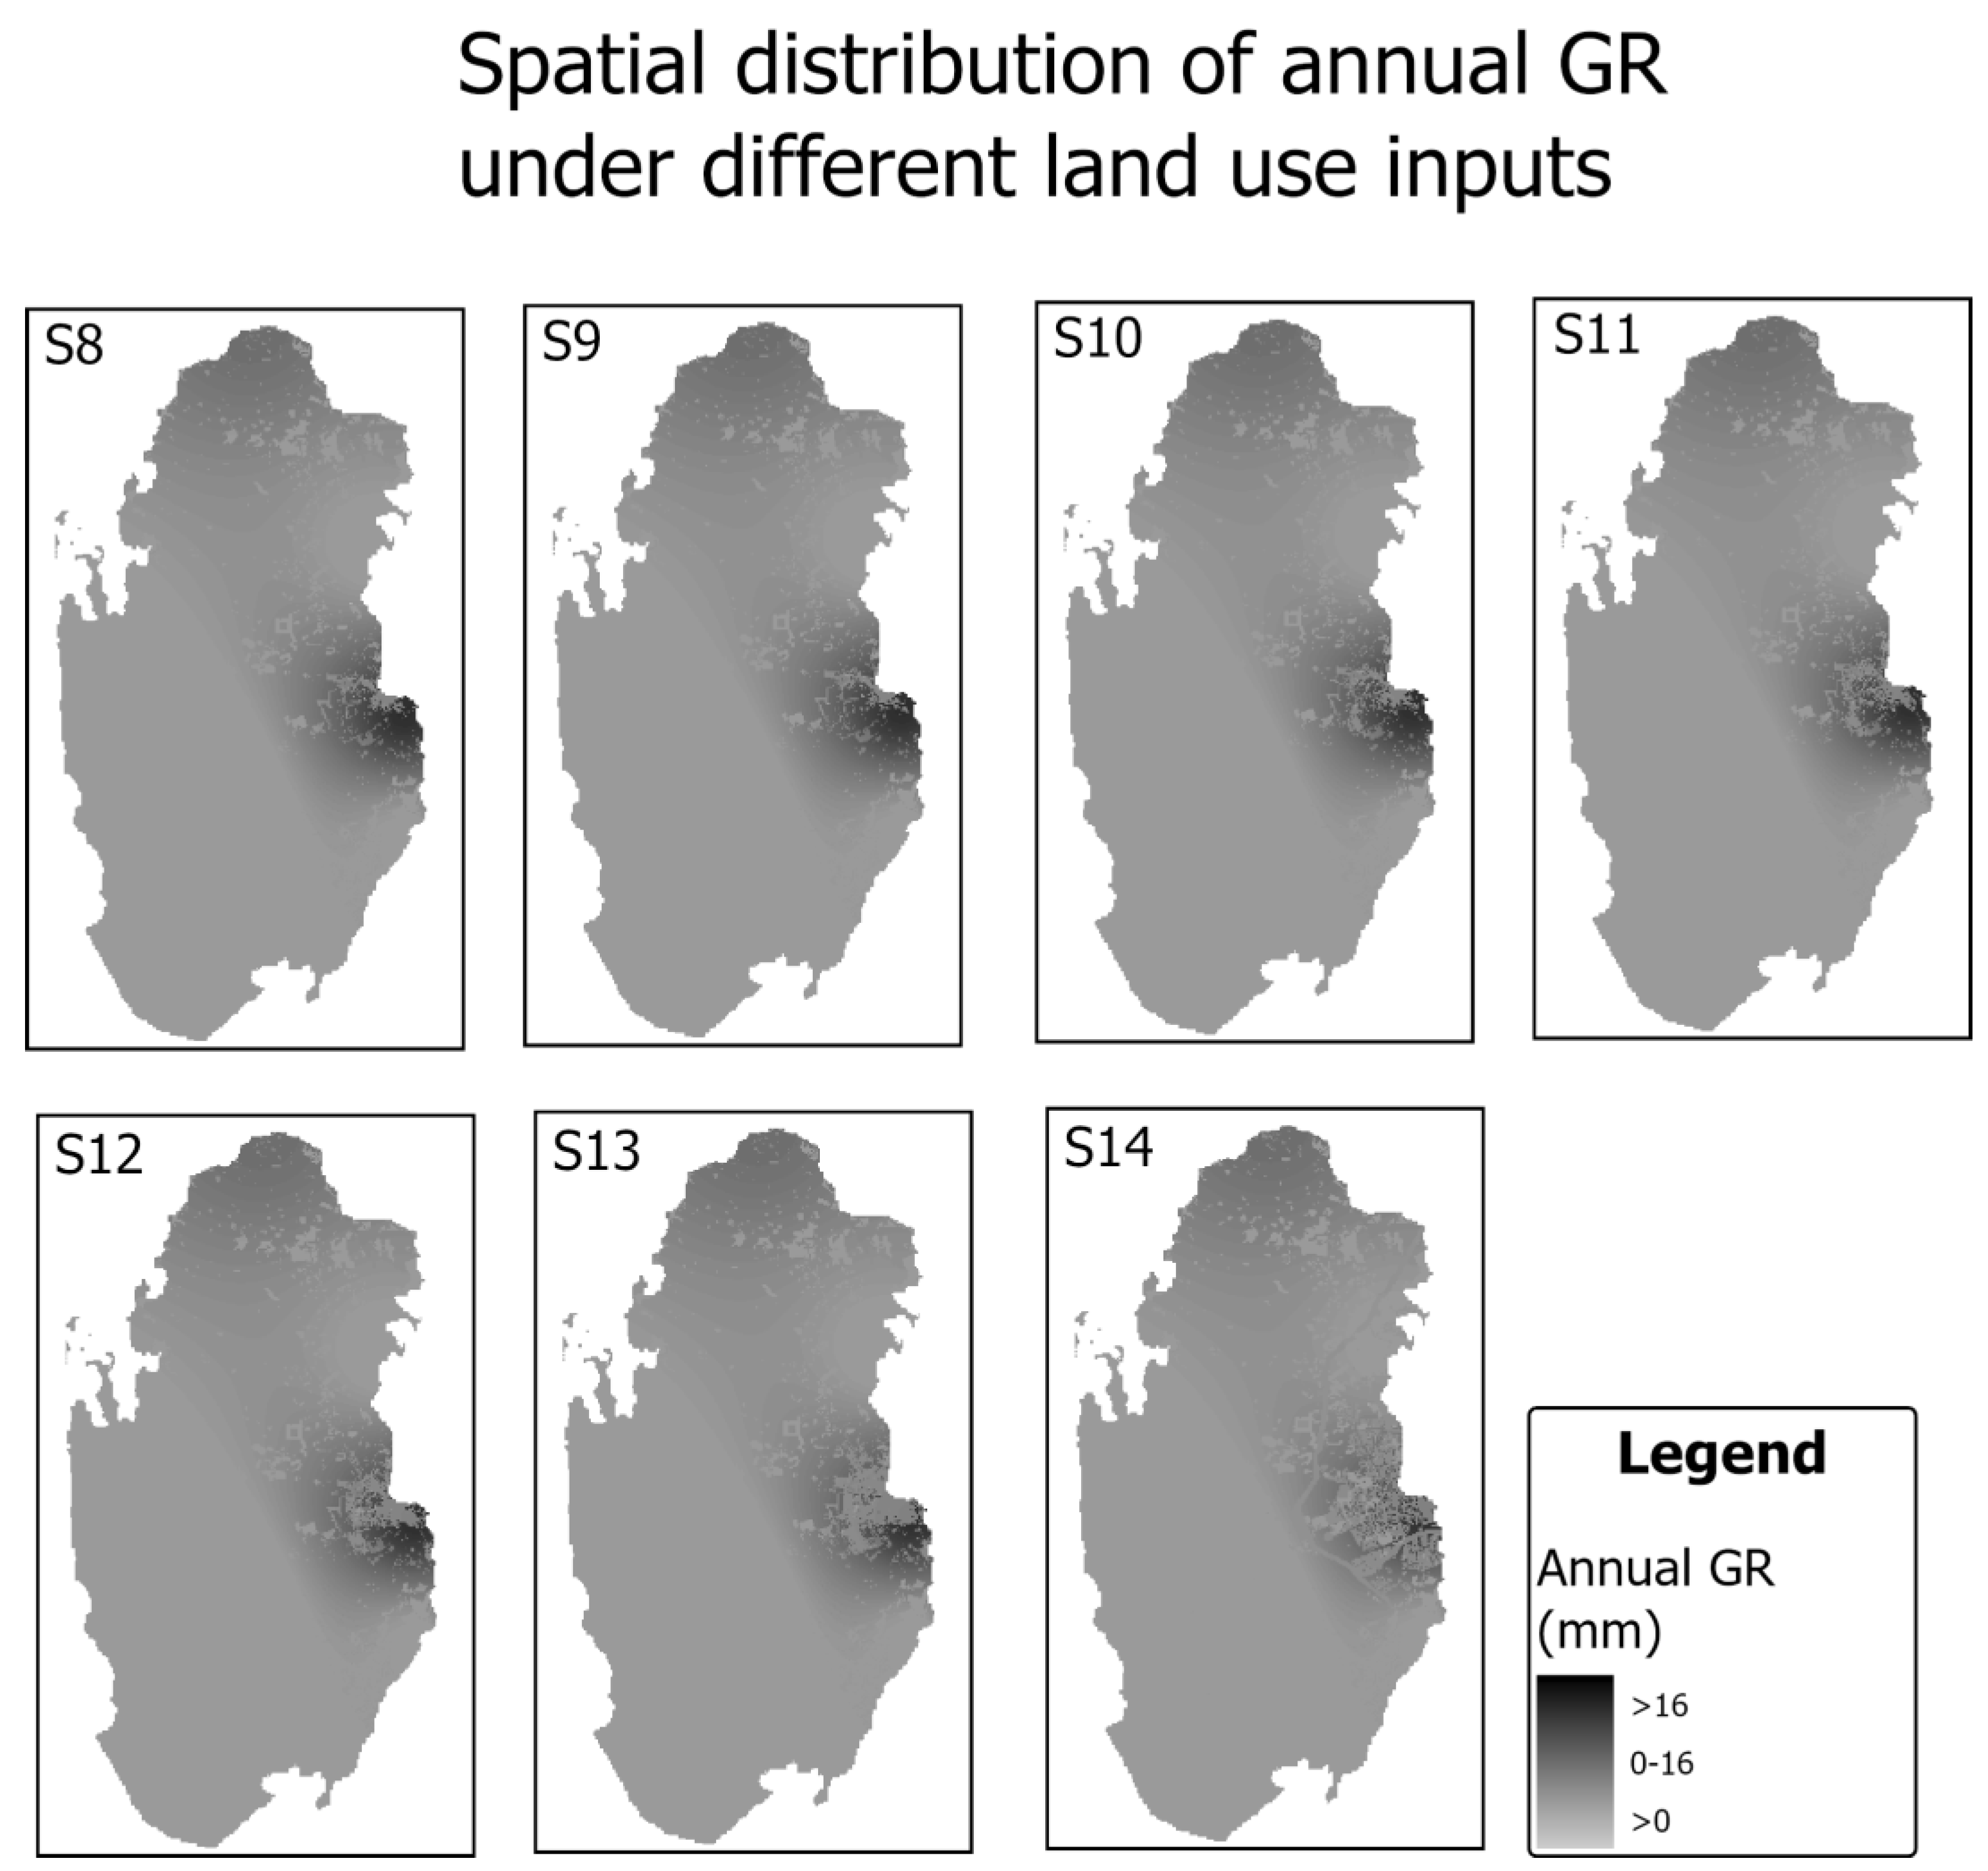
Figure 5 illustrates the spatial distribution of the annual GR in scenarios involving changing land use parameters. The GR variations resulting from the changing land use components were not considerable, compared to the variations among S1–S7. In S8–S14, the annual GRs varied up to 32 mm. The mean values of the annual GR varied slightly among S8–S14 (between 2.47 mm in S14 and 3.05 mm in S8 and S9). Among all the scenarios between S8 and S14, similar GR changes were observed due to the changes in the land use distribution. Urban areas in the country’s eastern parts have higher runoff and hence a lower GR.
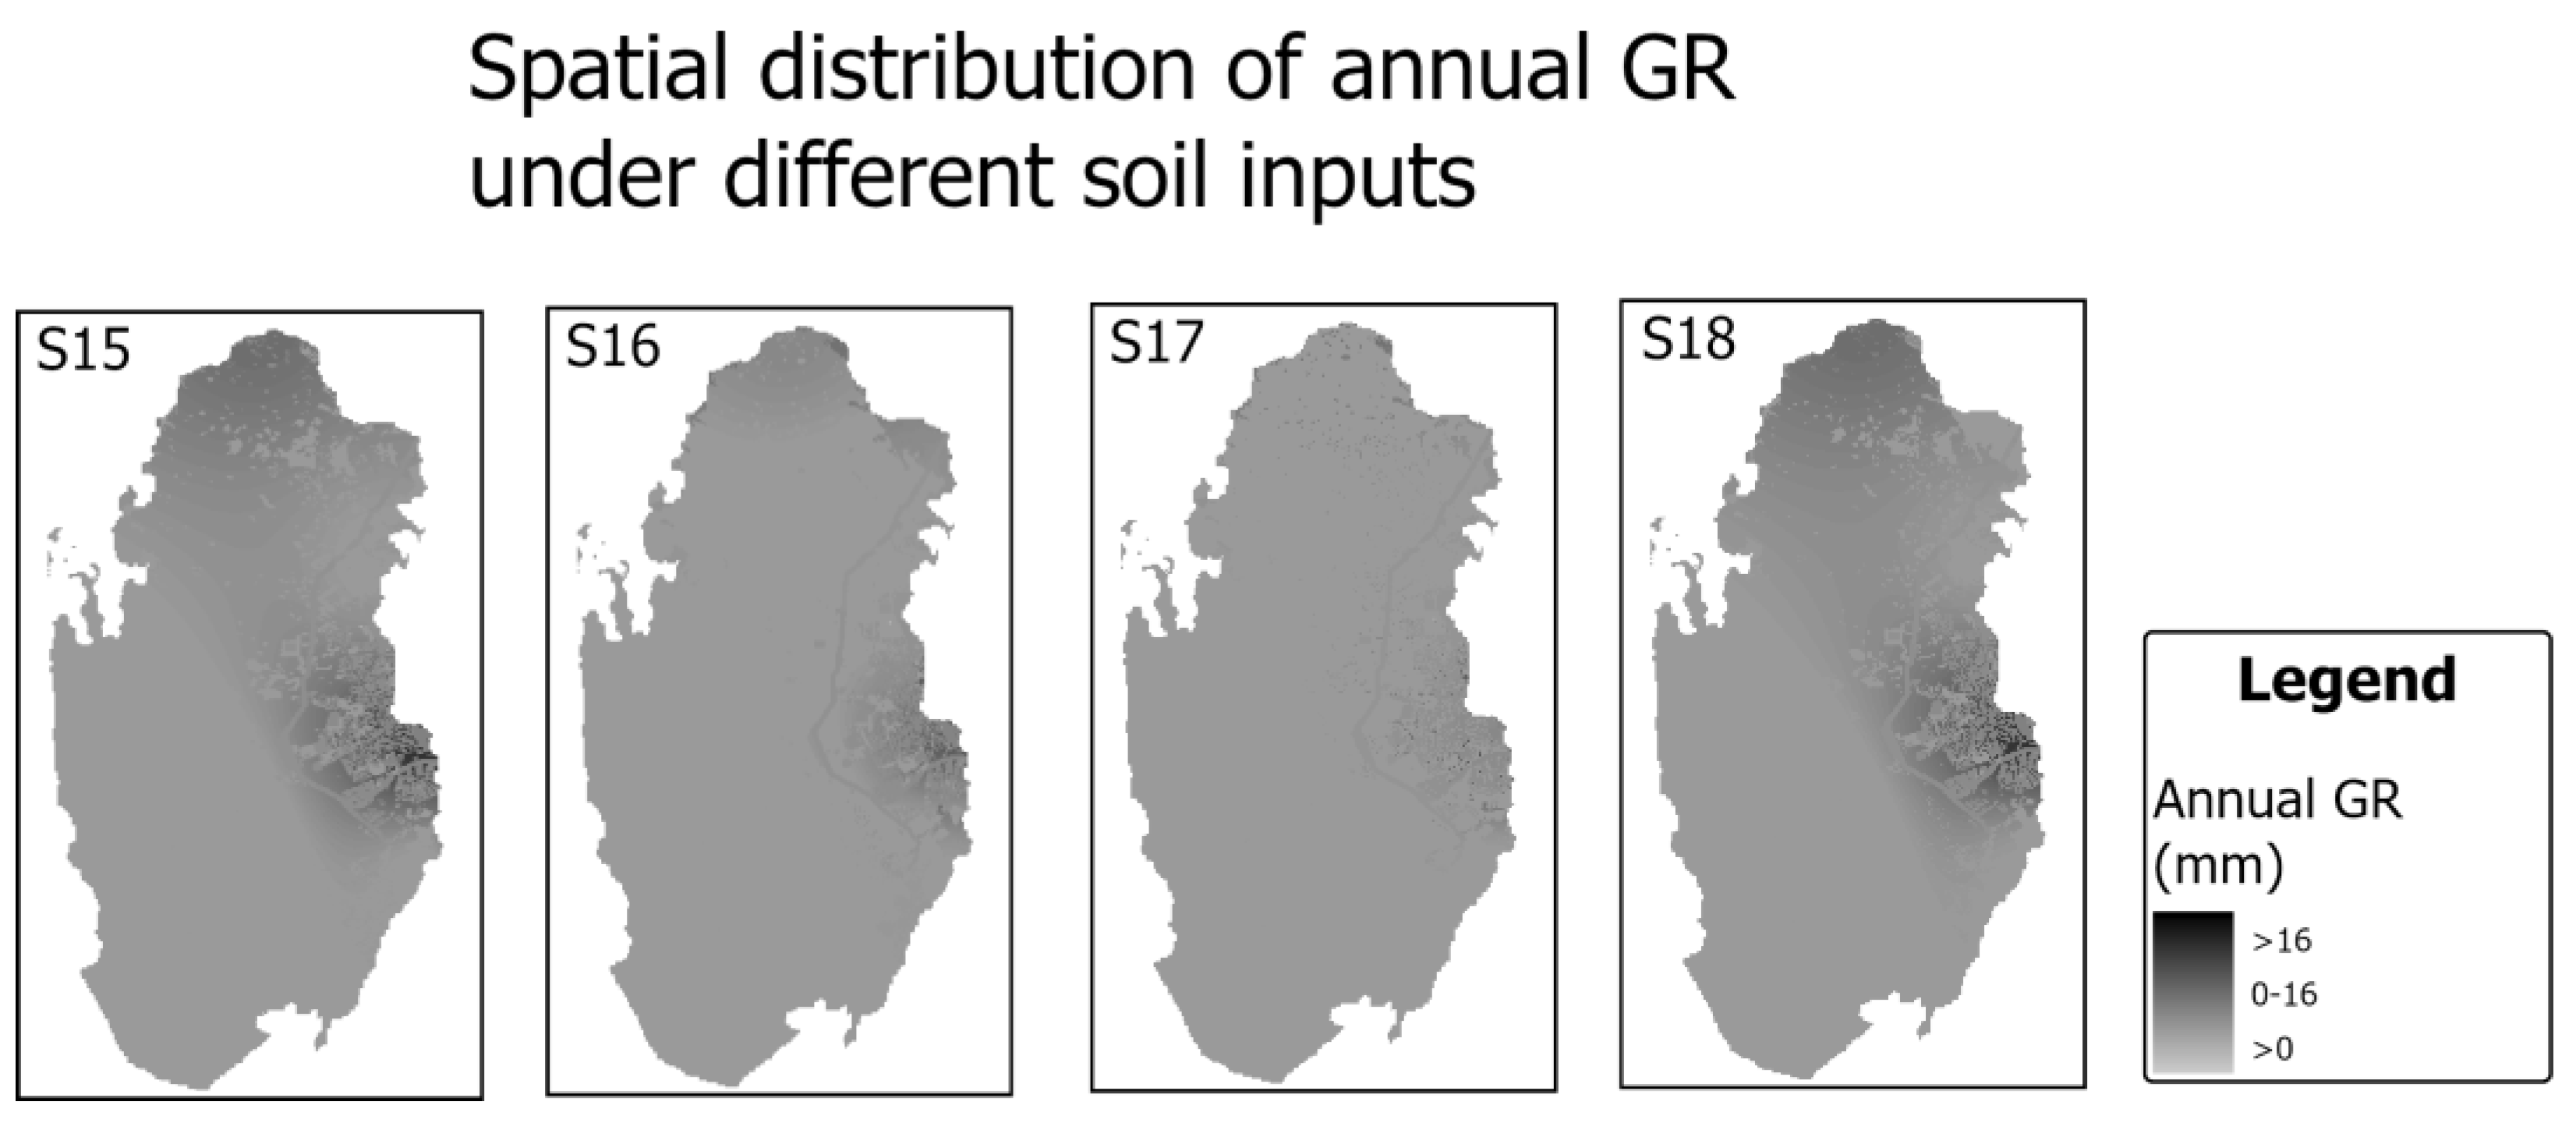
The soil parameters changed in S15–S18, resulting in different spatial distributions for the GR (see Figure 6). The annual GR estimations varied up to 32 mm, with slight variations among scenarios. The mean values of the annual GR varied between 0.34 mm in S17 and 2.7 mm in S18. There were apparent spatial changes in S15–S18, following the perturbation in the soil input parameters. In general, the GR variations in S15–S18 were lower compared with the variations in S1–S7.

4.2. Correlation Analysis

To measure the strength of the relationships between the GR and climatic, land use, and soil inputs, this study used Pearson’s correlation coefficients. The indices correlated were the spatial mean of the GR and the spatial mean of the climatic parameters in S1–S7, the spatial mean of the land use parameters in S8–S14, and the spatial mean of the soil parameters in S15–S18. A correlation coefficient that exceeded 0.75 was considered to be strong, while a correlation coefficient that was between 0.3 and 0.75 was considered to be moderate. A correlation coefficient of less than 0.3 was considered as weak. The results revealed a positive correlation between the annual GR and precipitation. On the other hand, negative moderately insignificant correlations were found between the annual GR and the PET (−0.45) and wind speed (−0.31), meaning that as the PET losses and wind speed increase, the GR values decrease. The GR correlations were weak with other climatic parameters. The GR values had strong correlations with land use inputs in Doha (this trend was not evident in other parts of Qatar). As the land use maps changed in S8–S14, the GR values and their spatial distribution changed correspondingly. The percentage of urban areas had a strong negative correlation with the GR, which was significant at the 99% confidence level. Bare land percentages had a significant positive correlation with GR at the 99% confidence level. This means urbanization growth can substantially decrease the GR values and increase the surface runoff if other climatic and soil inputs are kept the same. For S15–S18, the correlations between the annual GR and soil inputs were non-significant, implying that changes in soil inputs would not change the GR simulations substantially as compared to climatic inputs.

5. Summary and Discussion

Recent climate and anthropogenic changes (e.g., urbanization, population increase, and the growth in per-capita water consumption) has exacerbated the pressure on Qatar’s aquifers, leading to a severe water shortage and a high deterioration in quality. As a result, the water table declined, storage was lost, and seawater intruded inland. This paper quantified the GR across Qatar, providing important estimates regarding the spatial distribution. It also investigated how the GR could change according to the changes in input components, i.e., climatic parameters, land use maps, and soil distributions. Overall, there were some differences among the GR distributions. In S1–S7, the study only changed the climatic parameters. As a result, the annual GR varied from 10.9 Mm3 in S16 to 60.17 Mm3 in S4, implying a strong relationship between climatic inputs and GR estimation. S7–S14 investigated the impact of land use changes on GR values. They showed some differences but fewer than those observed in S1–S7. Changing soil inputs slightly affected the GR simulations. These findings provided a sound understanding of the primary factors that control the GR in arid areas. The change in the climatic parameters in S1–S7 shows the spatial distribution of the GR varied significantly following the perturbation of these parameters. On the other hand, changing soil and land use parameters had less impact on the GR assessment.
The study findings agree with Zhang, Liu [7], who assumed that changes in land use types can considerably affect the spatial distribution of GR in Beijing, China. Similar to this study, Zhang, Liu [7] found a negative correlation between the GR and impervious proportions. Zomlot, Verbeiren [3] also concluded that GR is strongly influenced by land use in Flanders. Nevertheless, the results from this study are inconclusive if the correlation is not significant. Zomlot, Verbeiren [3] found a strong correlation between the soil categories and the GR and noticed a positive correlation between the GR and the PET in non-arid climates. In this study, the correlation between the GR and PET was moderate and negative (−0.45).
Qatar has experienced several floods in recent years, causing substantial losses in assets and properties, as well as human injuries in 2014, 2015, and 2018. Within a day, some areas in Qatar received more than 80 mm of rain in November 2015 and October 2018 [31]. Therefore, urban planners must consider the consequences of urbanization on aquifers and the built environment. They have to include more green areas in their designs to allow more water to feed the aquifers and alleviate runoff quantities, which cause floods over impervious surfaces. While urbanization is required to meet population needs, urbanization’s consequences on aquifers and the built environment must be managed.
Lower values of GR were simulated during the summer compared to the winter because precipitation is lower and AET losses are higher in the summer. However, during the last decade, higher precipitation was observed in summer, implying a large disruption in seasonal characteristics. In most scenarios (i.e., S1–S5), the summer rains did not exceed 6 mm, whereas these rains were 13.9 mm and 21.7 mm in S6 and S7. These findings encourage implementing a more precise objective definition of the seasonal characteristics in further research.

6. Conclusions

This study highlights the urgent need for improving groundwater quality and enhancing water security in Qatar. This can be achieved through landscape modification to improve the GR, increasing the pervious surfaces, implementing managed aquifer recharge, and alleviating the flood risk. The GR analysis produced in this study can serve as a stepping stone for such a purpose. Further studies may also research managed aquifer recharge solutions to improve aquifer quality and increase storage. This study also shows that the aquifer management goal is impossible when the GR assessments are uncertain. To assess the uncertainty in the GR that resulted from the input data, this study modified climatic, land use, and soil inputs and investigated the corresponding changes in GR simulations. It concluded that hydrogeologists should pay more attention to climatic data accuracy since uncertainty in climatic components could result in a higher GR uncertainty, compared with land use and soil components.

Author Contributions

Conceptualization, S.B.A. and E.D.L.; methodology, data curation, and analysis, S.B.A.; writing—original draft preparation, S.B.A.; writing—review and editing, S.B.A. and E.D.L.; project administration and funding acquisition, E.D.L. All authors have read and agreed to the published version of the manuscript.

Funding

This research received no external funding.

Data Availability Statement

The soil, land use, and DEM data were acquired from the Qatar Ministry of Municipality. Climatic data were obtained from the Qatar Meteorological Department in the Civil Aviation Authority. The water table depth observations were obtained from Kahramaa.

Conflicts of Interest

The authors declare no conflicts of interest.

References

  1. Abotalib, A.Z.; Heggy, E. Groundwater mounding in fractured fossil aquifers in the Saharan-Arabian desert. In CAJG 2018: Advances in Sustainable and Environmental Hydrology, Hydrogeology, Hydrochemistry and Water Resources; Chaminé, H.I., Barbieri, M., Kisi, O., Chen, M., Merkel, B.J., Eds.; Advances in Science, Technology & Innovation (IEREK Interdisciplinary Series for Sustainable Development); Springer: Cham, Switzerland, 2019; pp. 359–362. [Google Scholar]
  2. Ajjur, S.B.; Al-Ghamdi, S.G. Is managed aquifer recharge a feasible solution for groundwater deterioration in Qatar? In Proceedings of the World Environmental and Water Resources Congress, Atlanta, GA, USA, 5–8 June 2022; pp. 168–175. [Google Scholar] [CrossRef]
  3. Zomlot, Z.; Verbeiren, B.; Huysmans, M.; Batelaan, O. Spatial distribution of groundwater recharge and base flow: Assessment of controlling factors. J. Hydrol. Reg. Stud. 2015, 4, 349–368. [Google Scholar] [CrossRef]
  4. Batelaan, O.; De Smedt, F. GIS-based recharge estimation by coupling surface–subsurface water balances. J. Hydrol. 2007, 337, 337–355. [Google Scholar] [CrossRef]
  5. Yenehun, A.; Dessie, M.; Nigate, F.; Belay, A.S.; Azeze, M.; Van Camp, M.; Fenetie Taye, D.; Kidane, D.; Adgo, E.; Nyssen, J.; et al. Spatial and temporal simulation of groundwater recharge and cross-validation with point measurements in volcanic aquifers with variable topography. Hydrol. Earth Syst. Sci. Discuss. 2021, 2021, 1–37. [Google Scholar] [CrossRef]
  6. Zhang, Y.; Liu, S.; Cheng, F.; Shen, Z. WetSpass-Based Study of the Effects of Urbanization on the Water Balance Components at Regional and Quadrat Scales in Beijing, China. Water 2018, 10, 5. [Google Scholar] [CrossRef]
  7. Ajjur, S.B.; Al-Ghamdi, S.G. Assessment of the Climate Change Impact on the Arabian Peninsula Evapotranspiration Losses. In Proceedings of the World Environmental and Water Resources Congress 2022, Atlanta, Georgia, USA, 5–8 June 2022. [Google Scholar]
  8. Wang, P.; Yu, J.; Pozdniakov, S.P.; Grinevsky, S.O.; Liu, C. Shallow groundwater dynamics and its driving forces in extremely arid areas: A case study of the lower Heihe River in northwestern China. Hydrol. Process. 2014, 28, 1539–1553. [Google Scholar] [CrossRef]
  9. López Valencia, O.M.; Johansen, K.; Aragón Solorio, B.J.L.; Li, T.; Houborg, R.; Malbeteau, Y.; AlMashharawi, S.; Altaf, M.U.; Fallatah, E.M.; Dasari, H.P.; et al. Mapping groundwater abstractions from irrigated agriculture: Big data, inverse modeling, and a satellite–model fusion approach. Hydrol. Earth Syst. Sci. 2020, 24, 5251–5277. [Google Scholar] [CrossRef]
  10. Khaki, M.; Hoteit, I. Monitoring water storage decline over the Middle East. J. Hydrol. 2021, 603, 127166. [Google Scholar] [CrossRef]
  11. Mazzoni, A.; Heggy, E.; Scabbia, G. Forecasting water budget deficits and groundwater depletion in the main fossil aquifer systems in North Africa and the Arabian Peninsula. Glob. Environ. Chang. 2018, 53, 157–173. [Google Scholar] [CrossRef]
  12. UN-ESCWA (United Nations Economic and Social Commission for Western Asia); BGR (Bundesanstalt für Geowissenschaften und Rohstoffe). Inventory of Shared Water Resources in Western Asia; United Nations Economic and Social Commission for Western Asia: Beirut, Lebanon, 2013. [Google Scholar]
  13. Martos-Rosillo, S.; González-Ramón, A.; Jiménez-Gavilán, P.; Andreo, B.; Durán, J.J.; Mancera, E. Review on groundwater recharge in carbonate aquifers from SW Mediterranean (Betic Cordillera, S Spain). Environ. Earth Sci. 2015, 74, 7571–7581. [Google Scholar] [CrossRef]
  14. Jackson, C.R.; Meister, R.; Prudhomme, C. Modelling the effects of climate change and its uncertainty on UK Chalk groundwater resources from an ensemble of global climate model projections. J. Hydrol. 2011, 399, 12–28. [Google Scholar] [CrossRef]
  15. Kimrey, J. Proposed Artificial Recharge Studies in Northern Qatar. United States Department of the Interior Geological Survey. 1985. Available online: https://pubs.er.usgs.gov/publication/ofr85343 (accessed on 5 October 2023).
  16. Eccleston, B.L.; Pike, J.G.; Harhash, I. The Water Resources of Qatar and Their Development; Food and Agricultural Organization of the United Nations: Rome, Italy, 1981. [Google Scholar]
  17. Harhash, I.; Yousif, A. Groundwater Recharge Estimates for the Period 1972–1983; Department of Agricultural and Water Research, Ministry of Industry and Agriculture: Doha, Qatar, 1985. [Google Scholar]
  18. Baalousha, H.M.; Barth, N.; Ramasomanana, F.H.; Ahzi, S. Groundwater recharge estimation and its spatial distribution in arid regions using GIS: A case study from Qatar karst aquifer. Model. Earth Syst. Environ. 2018, 4, 1319–1329. [Google Scholar] [CrossRef]
  19. Qatar Planning and Statistics Authority. Water Statistics in the State of Qatar, 2017. 2018. Available online: https://www.psa.gov.qa/en/statistics/Statistical%20Releases/Environmental/Water/2017/Water-Statistics-2017-EN.pdf (accessed on 5 October 2023).
  20. Tahir, F.; Ajjur, S.B.; Serdar, M.Z.; Al-Humaiqani, M.; Kim, D.; Al-Thani, S.K.; Al-Ghamdi, S.G. Qatar Climate Change Conference 2021: A Platform for Addressing Key Climate Change Topics Facing Qatar and the World; Hamad bin Khalifa University Press (HBKU Press): Doha, Qatar, 2021. [Google Scholar] [CrossRef]
  21. Ajjur, S.B.; Al-Ghamdi, S.G. Quantifying the uncertainty in future groundwater recharge simulations from regional climate models. Hydrol. Process. 2022, 36, e14645. [Google Scholar] [CrossRef]
  22. Tuel, A.; Choi, Y.-W.; AlRukaibi, D.; Eltahir, E.A.B. Extreme storms in Southwest Asia (Northern Arabian Peninsula) under current and future climates. Clim. Dyn. 2021, 58, 1509–1524. [Google Scholar] [CrossRef]
  23. Ajjur, S.B.; Al-Ghamdi, S.G. Global Hotspots for Future Absolute Temperature Extremes from CMIP6 Models. Earth Space Sci. 2021, 8, e2021EA001817. [Google Scholar] [CrossRef]
  24. Ajjur, S.B.; Al-Ghamdi, S.G. Variation in Seasonal Precipitation over Gaza (Palestine) and Its Sensitivity to Teleconnection Patterns. Water 2021, 13, 667. [Google Scholar] [CrossRef]
  25. World Bank. Population and Urbanization Indicators. 2023. Available online: https://www.worldbank.org/ (accessed on 12 December 2023).
  26. Lambert, L.A.; Lee, J. Nudging greywater acceptability in a Muslim country: Comparisons of different greywater reuse framings in Qatar. Environ. Sci. Policy 2018, 89, 93–99. [Google Scholar] [CrossRef]
  27. Shandas, V.; Makido, Y.; Ferwati, S. Rapid Urban Growth and Land Use Patterns in Doha, Qatar: Opportunities for Sustainability? Eur. J. Sustain. Dev. Res. 2017, 1, 11. [Google Scholar] [CrossRef]
  28. Ajjur, S.B.; Al-Ghamdi, S.G.; Baalousha, H.M. Sustainable Development of Qatar Aquifers under Global Warming Impact. Int. J. Glob. Warm. 2021, 25, 323–338. [Google Scholar] [CrossRef]
  29. Hargreaves, G.H.; Samani, Z.A. Reference Crop Evapotranspiration from Temperature. Appl. Eng. Agric. 1985, 1, 96–99. [Google Scholar] [CrossRef]
  30. Allen, R.G.; Pereira, L.S.; Raes, D.; Smith, M. Crop Evapotranspiration—Guidelines for Computing Crop Water Requirements; FAO Irrigation and Drainage Paper 56; FAO: Rome, Italy, 1998; p. D05109. [Google Scholar]
  31. FloodList. Qatar Flash Floods after Years Worth of Rain in One Day. 2021. Available online: https://floodlist.com/?s=qatar&submit= (accessed on 5 October 2023).
Figure 1. (a) The general location of Qatar, (b) meteorological stations used in this study, (c) soil map, and (d) land use maps for the metropolitan Doha.
Hydrology 11 00028 g001
Figure 2. The location of Qatar’s shallow aquifers and groundwater levels according to the mean sea level.
Hydrology 11 00028 g002
Figure 3. Schematic view of the WetSpass model.
Hydrology 11 00028 g003
Figure 4. The spatial distribution of the annual GR according to changes in climatic inputs (Scenarios S1–S7).
Hydrology 11 00028 g004
Figure 5. The spatial distribution of the annual GR according to changes in land use inputs (Scenarios S8–S14).
Hydrology 11 00028 g005
Figure 6. The spatial distribution of the annual GR according to changes in soil inputs (Scenarios S15–S18).
Hydrology 11 00028 g006
Table 1. The x and y coordinates for the six rain gauge stations.
StationX CoordinatesY Coordinates
Doha Airport51°34′8″ E25°14′47″ N
Dukhan50°45′27″ E25°24′23″ N
Umm Said51°34′7″ E24°56′32″ N
Al Khor51°30′31″ E25°37′35″ N
Al Ruwais 51°12′37″ E26°8′41″ N
Al Karannah51°2′9″ E25°0′25″ N
Table 2. Climatic, land use, and soil inputs that were used in the 18 scenarios simulated in this study.
Scenarios Climatic MapsLand Use MapsSoil Map
S1Average 1986–1990Land use 2020Soil 2020
S2Average 1991–1995
S3Average 1996–2000
S4Average 2001–2005
S5Average 2006–2010
S6Average 2011–2015
S7Average 2016–2020
S8Average 2016–2020Land use 1990
S9Land use 1995
S10Land use 2000
S11Land use 2005
S12Land use 2010
S13Land use 2015
S14Land use 2020
S15Land use 2020Larger lithosols
S16Larger agricultural areas
S17Larger sabkha
S18Larger sand
Disclaimer/Publisher’s Note: The statements, opinions and data contained in all publications are solely those of the individual author(s) and contributor(s) and not of MDPI and/or the editor(s). MDPI and/or the editor(s) disclaim responsibility for any injury to people or property resulting from any ideas, methods, instructions or products referred to in the content.