
Influence of Slope Aspect and Vegetation on the Soil Moisture Response to Snowmelt in the German Alps

 , , ,
, , ,
Abstract
1. Introduction
2. Materials and Methods
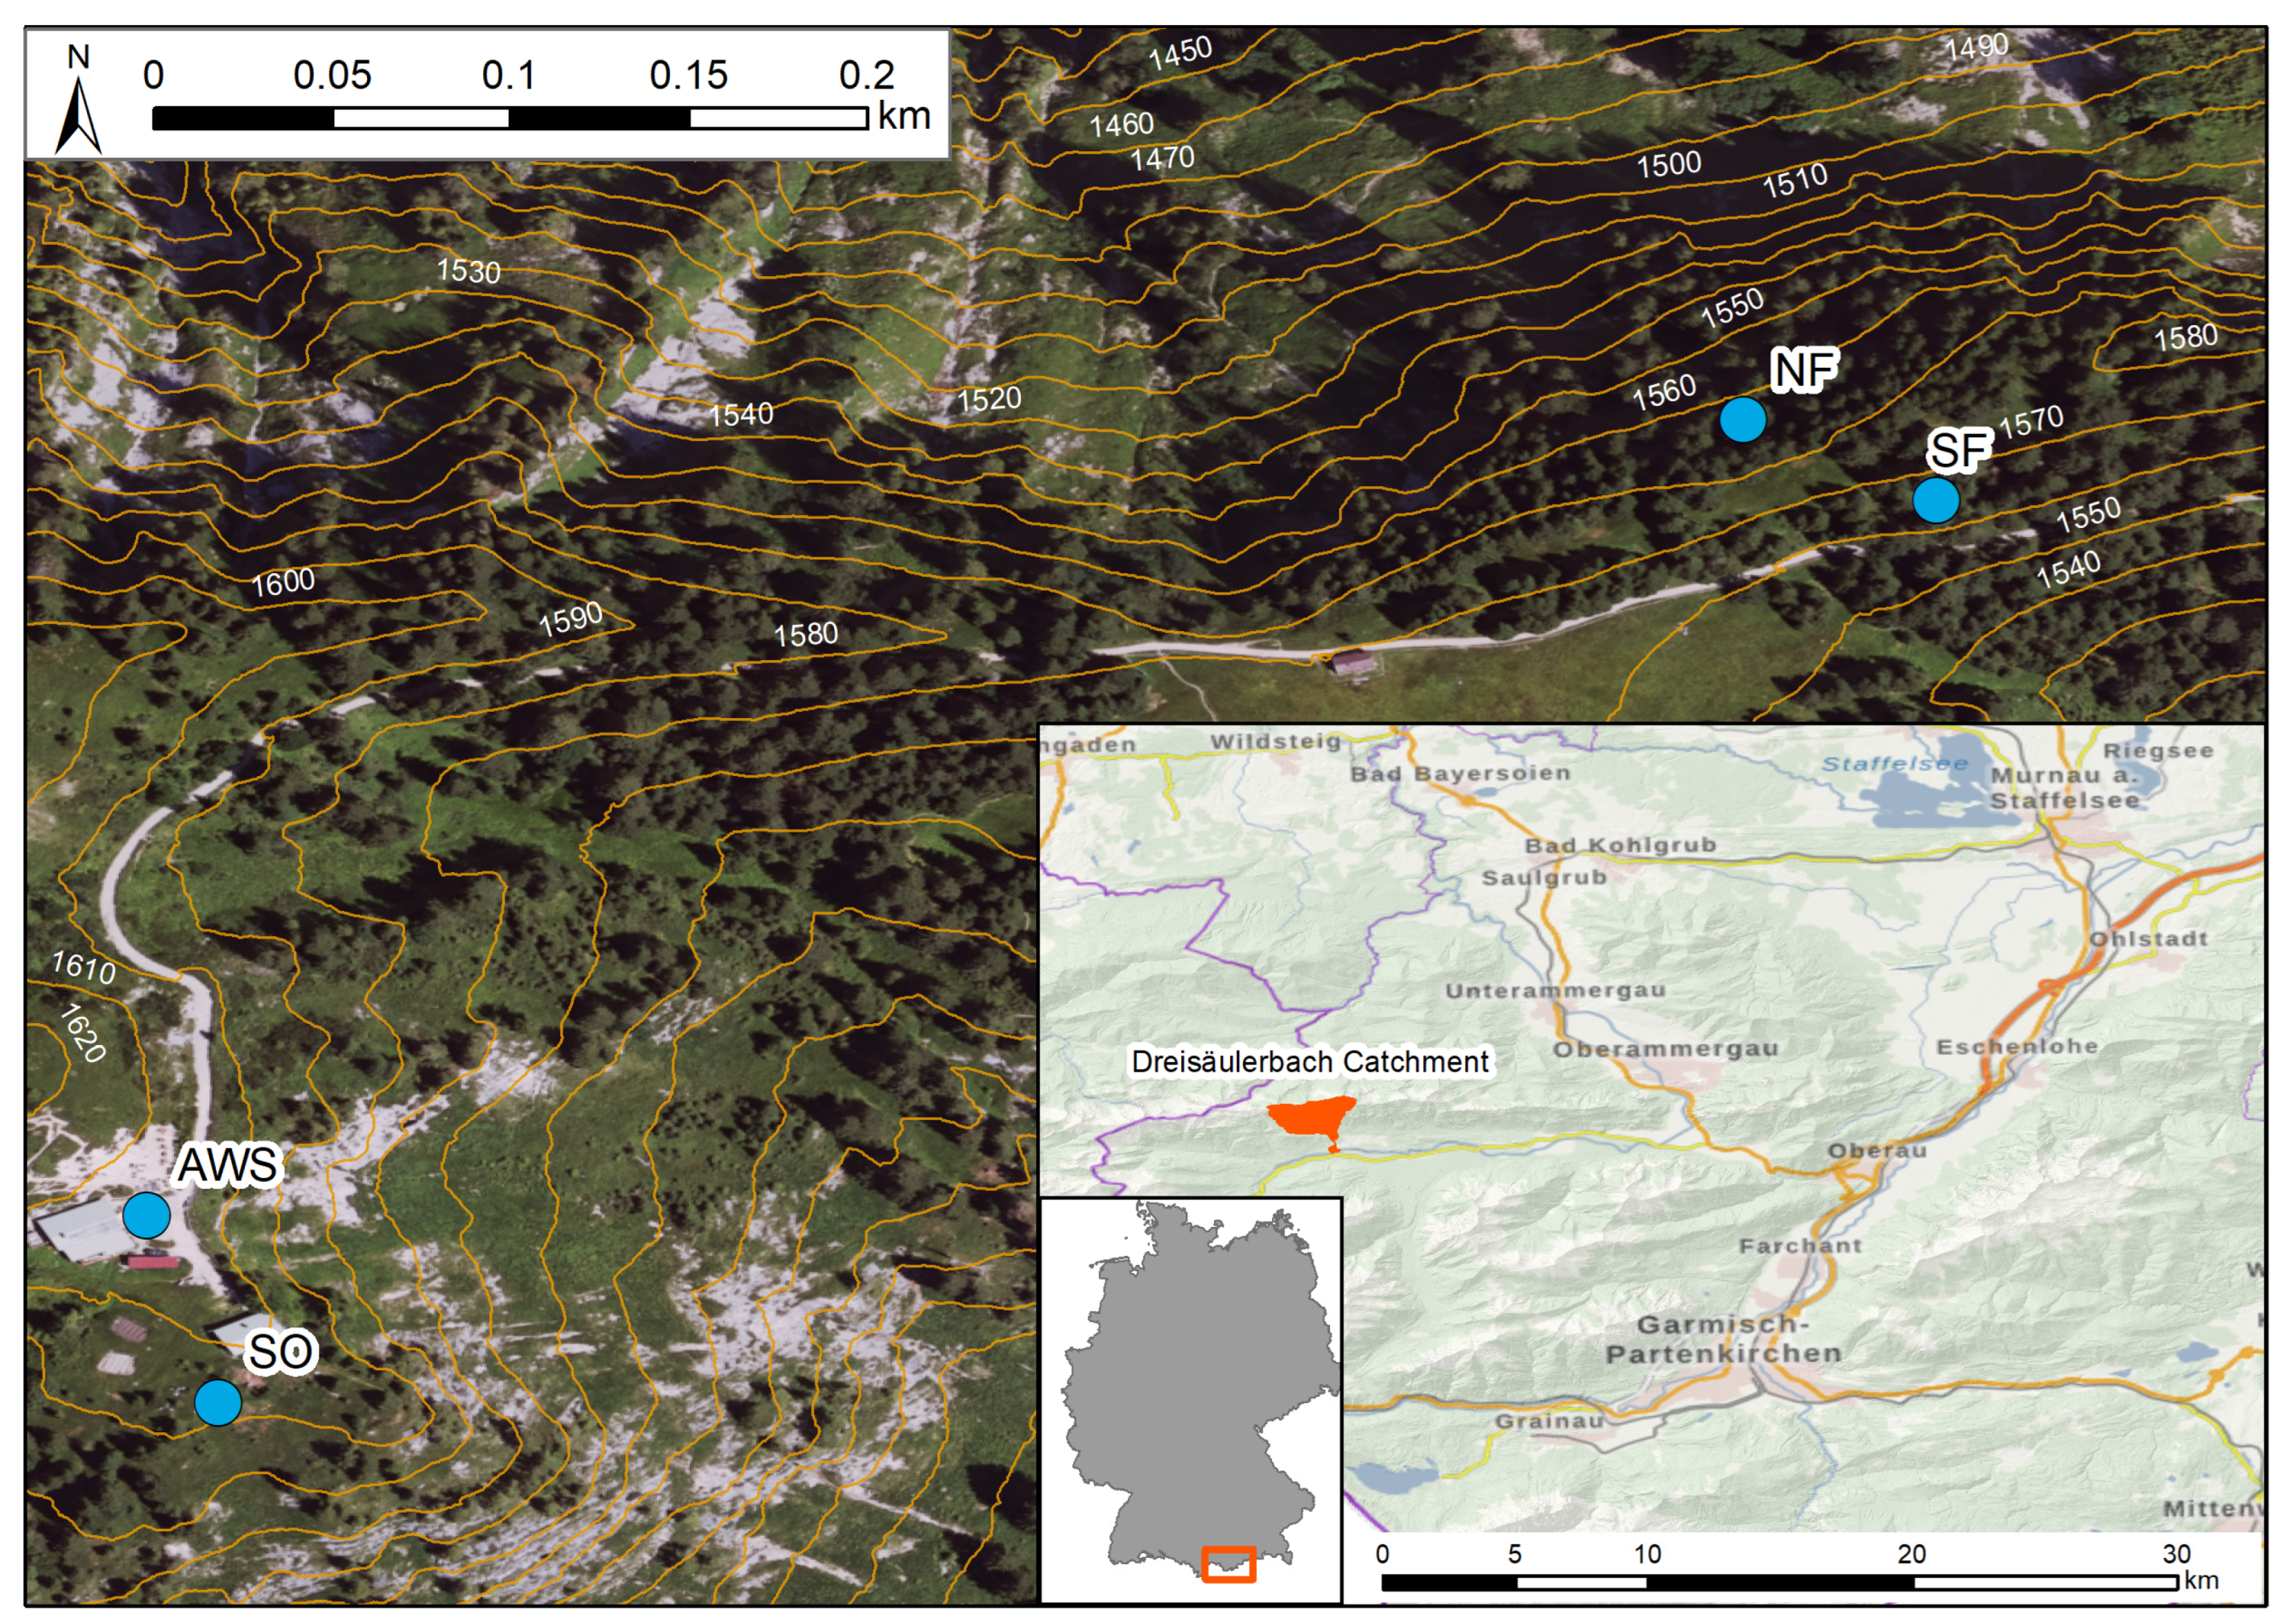
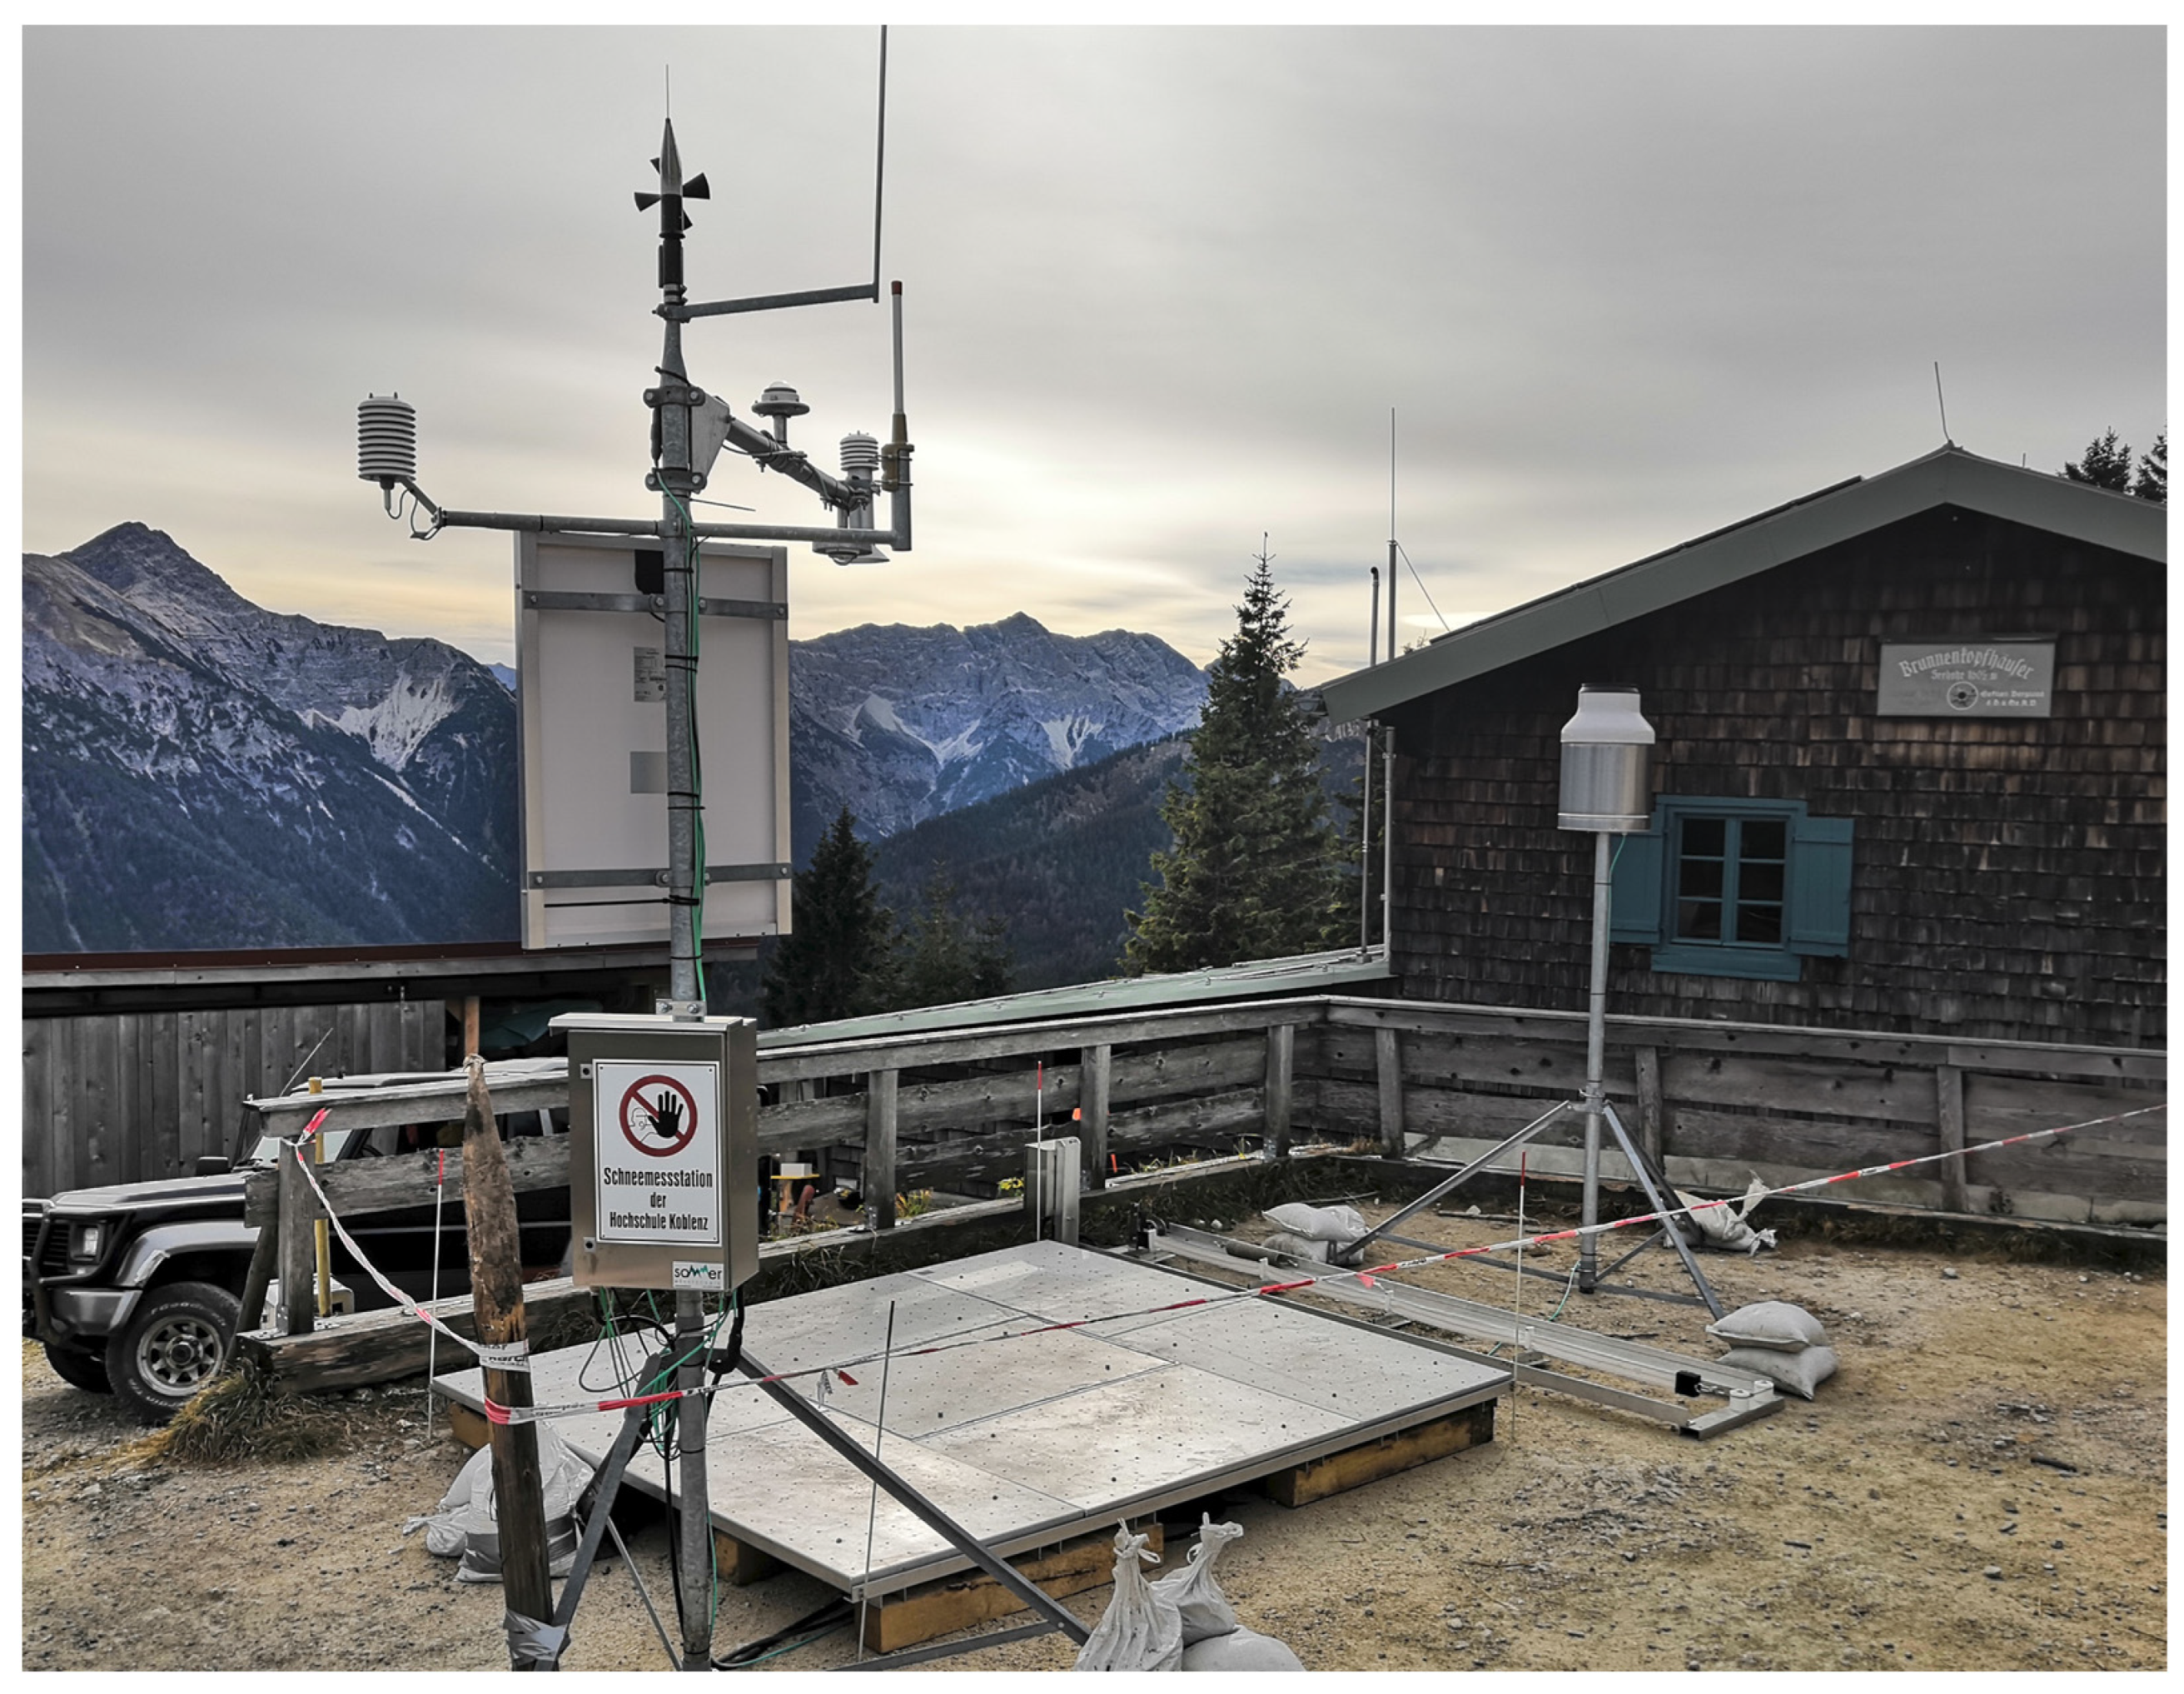
2.1. Study Site
2.2. Data
3. Results
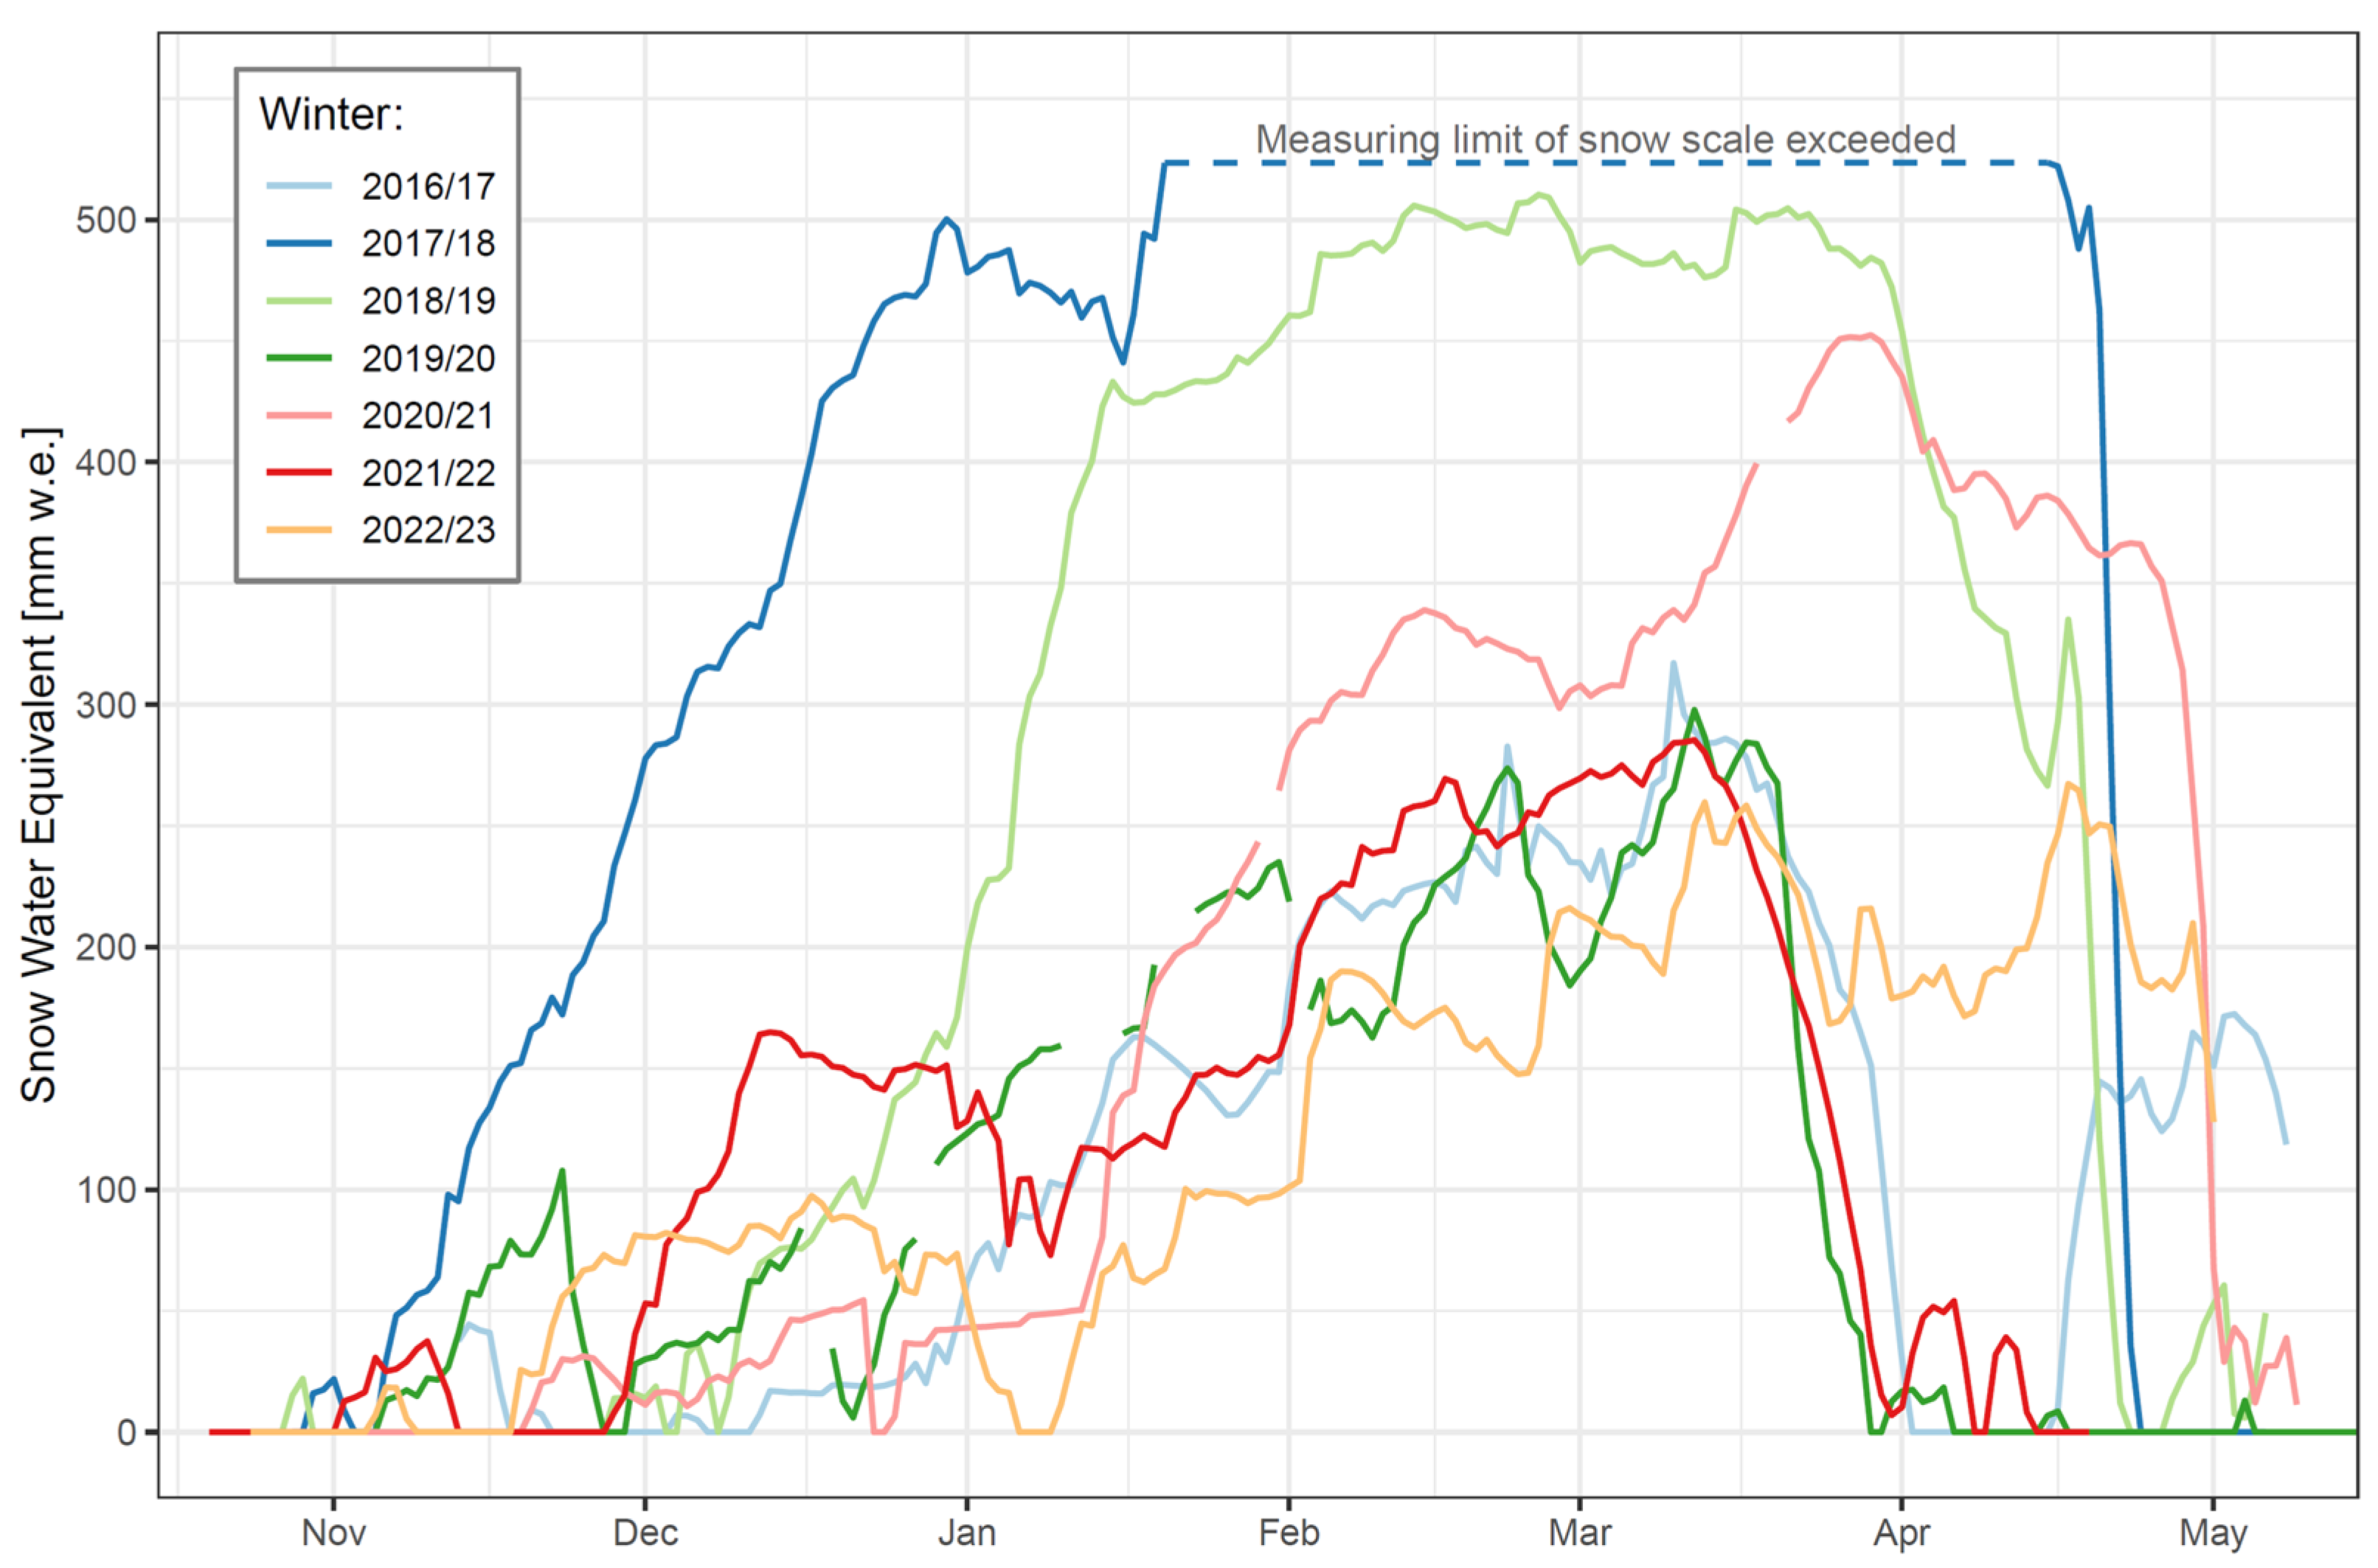
3.1. Winter Regime
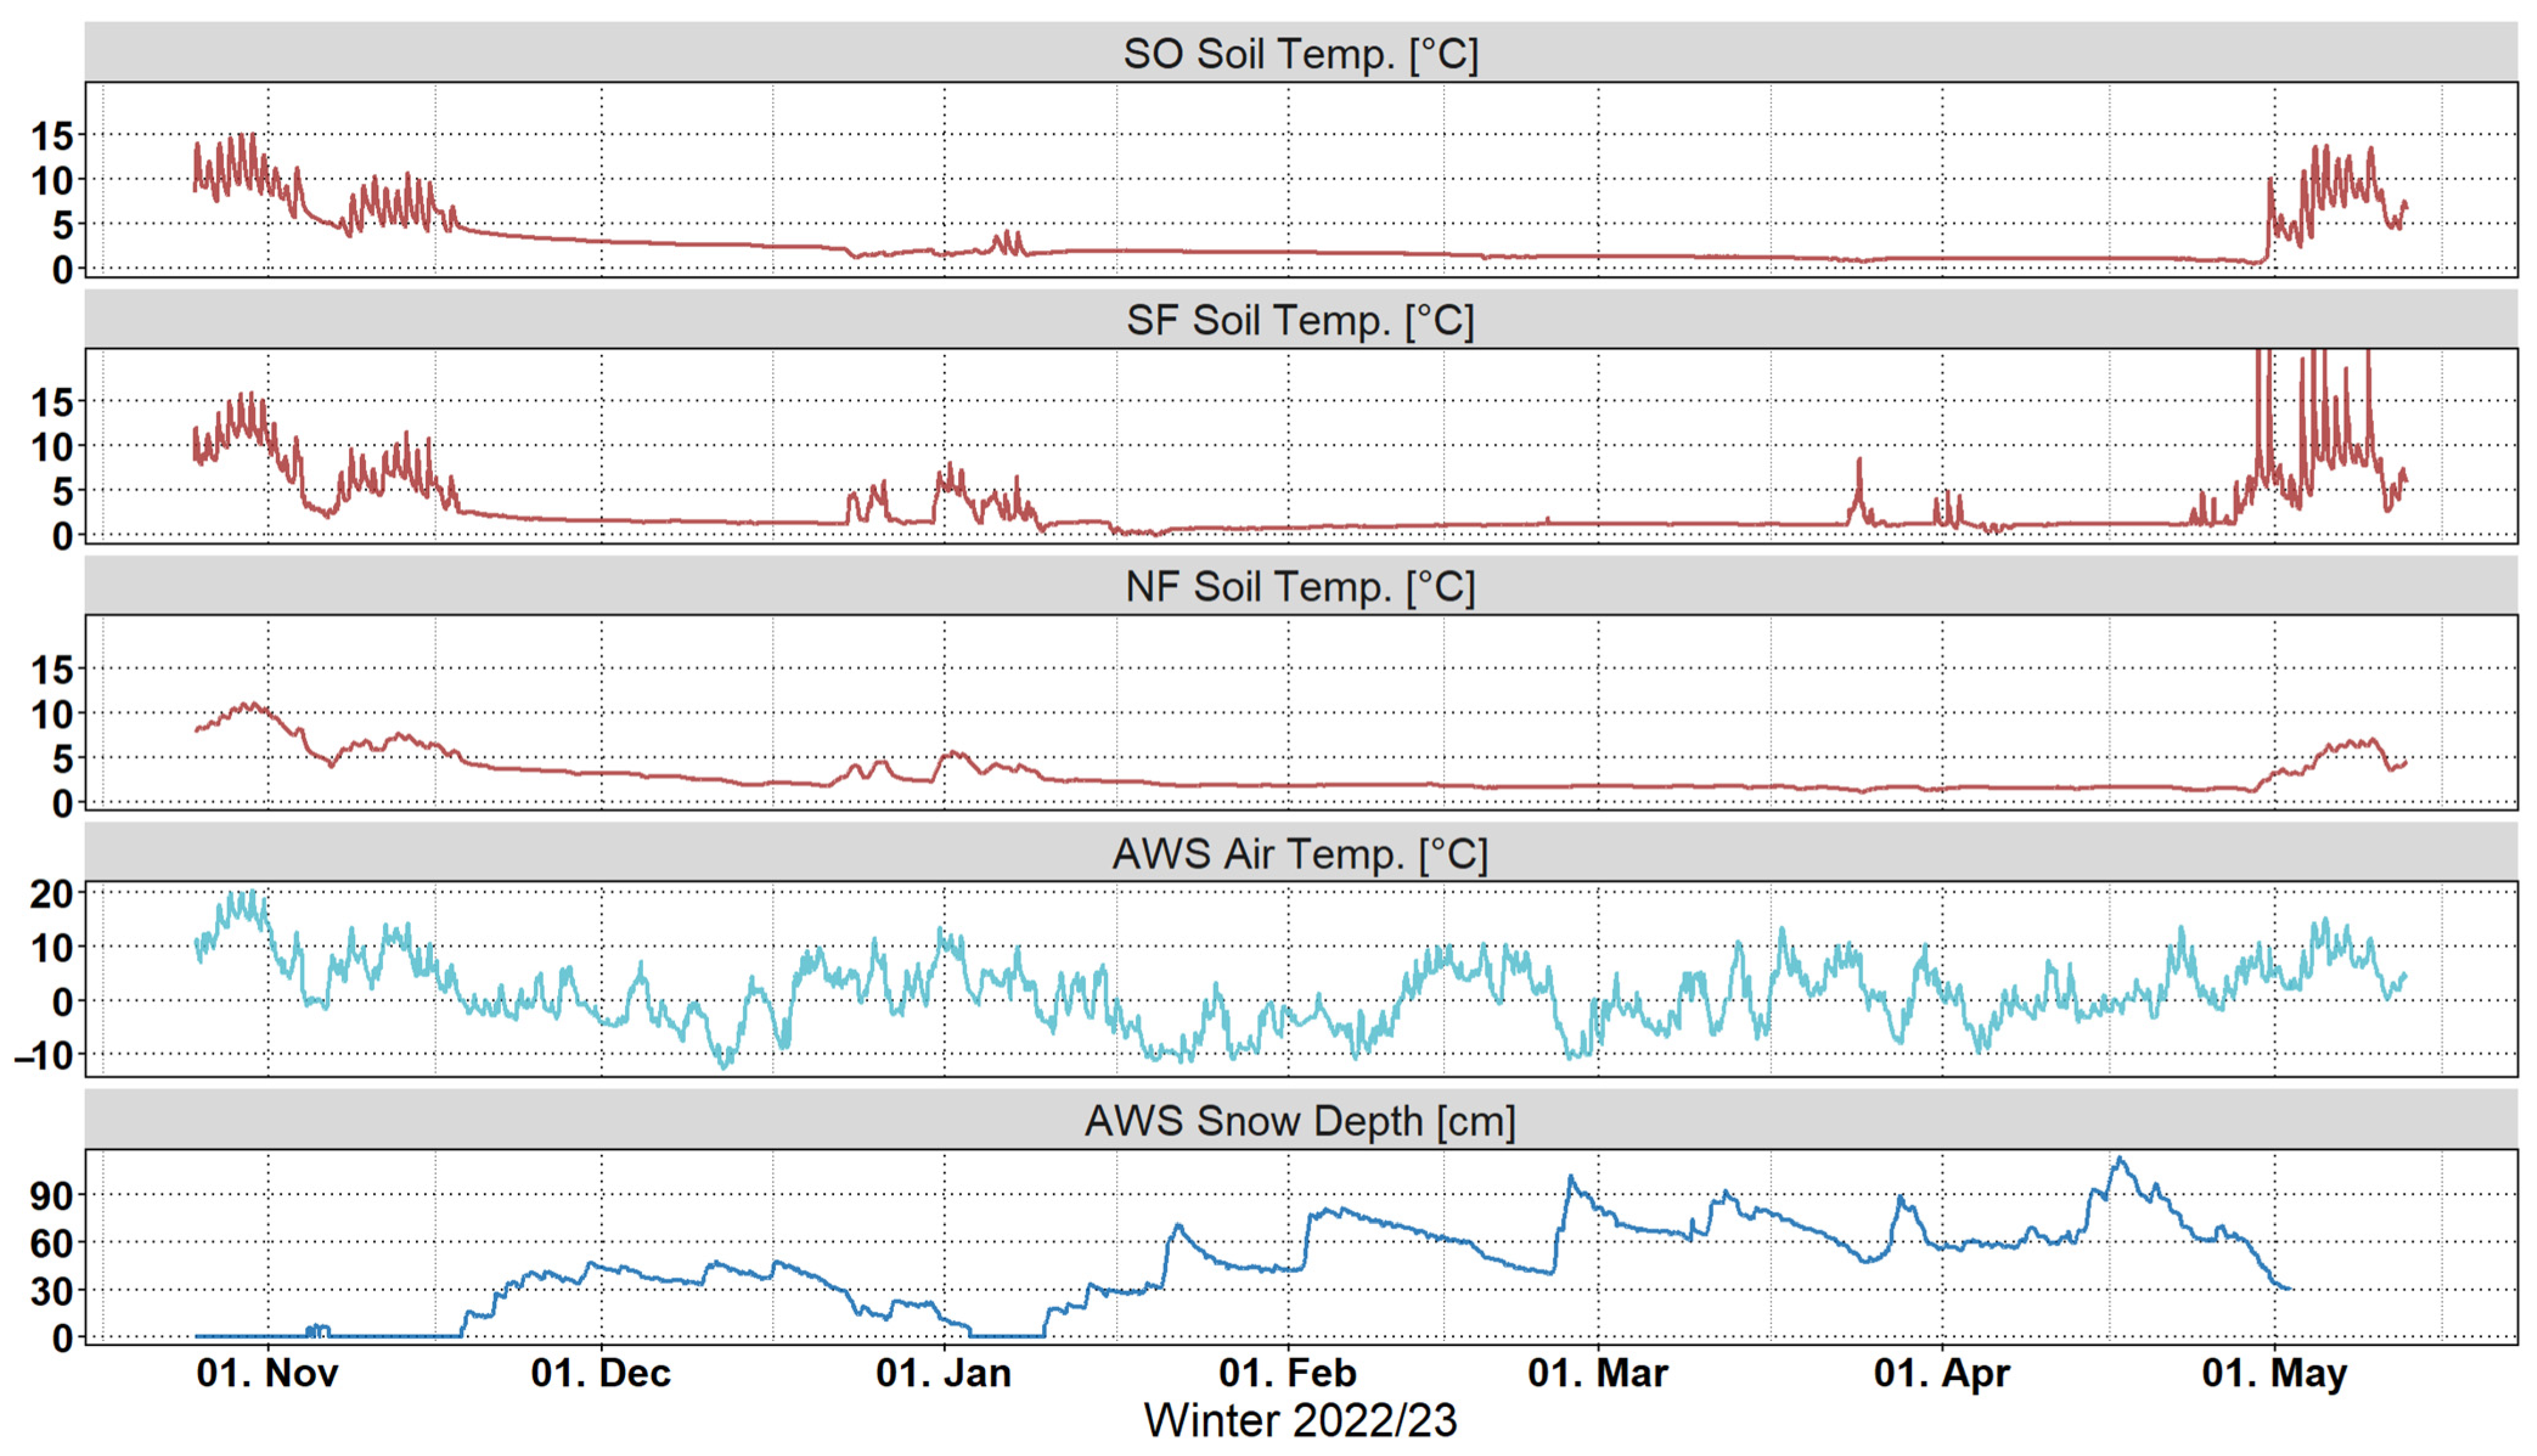
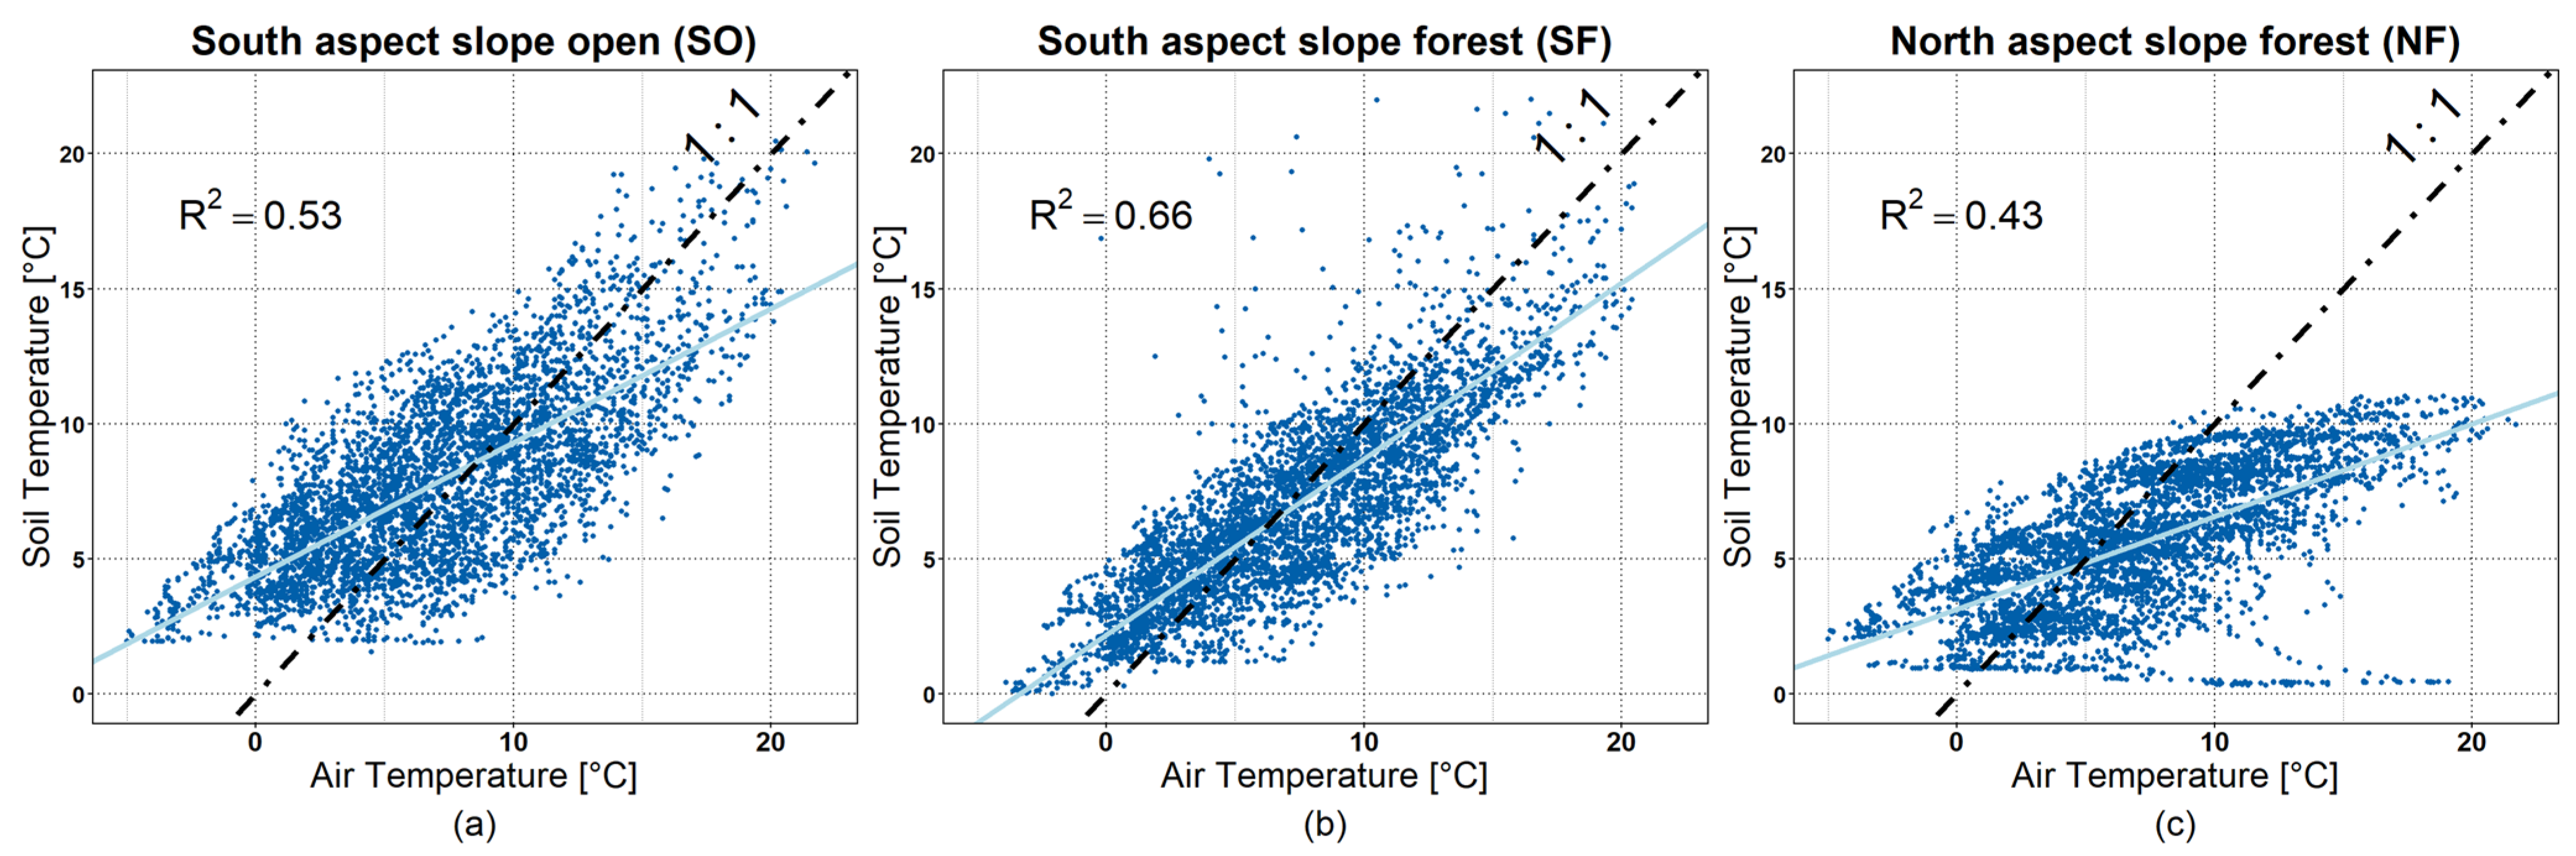
3.2. Air and Soil Temperatures
3.3. Snow Cover
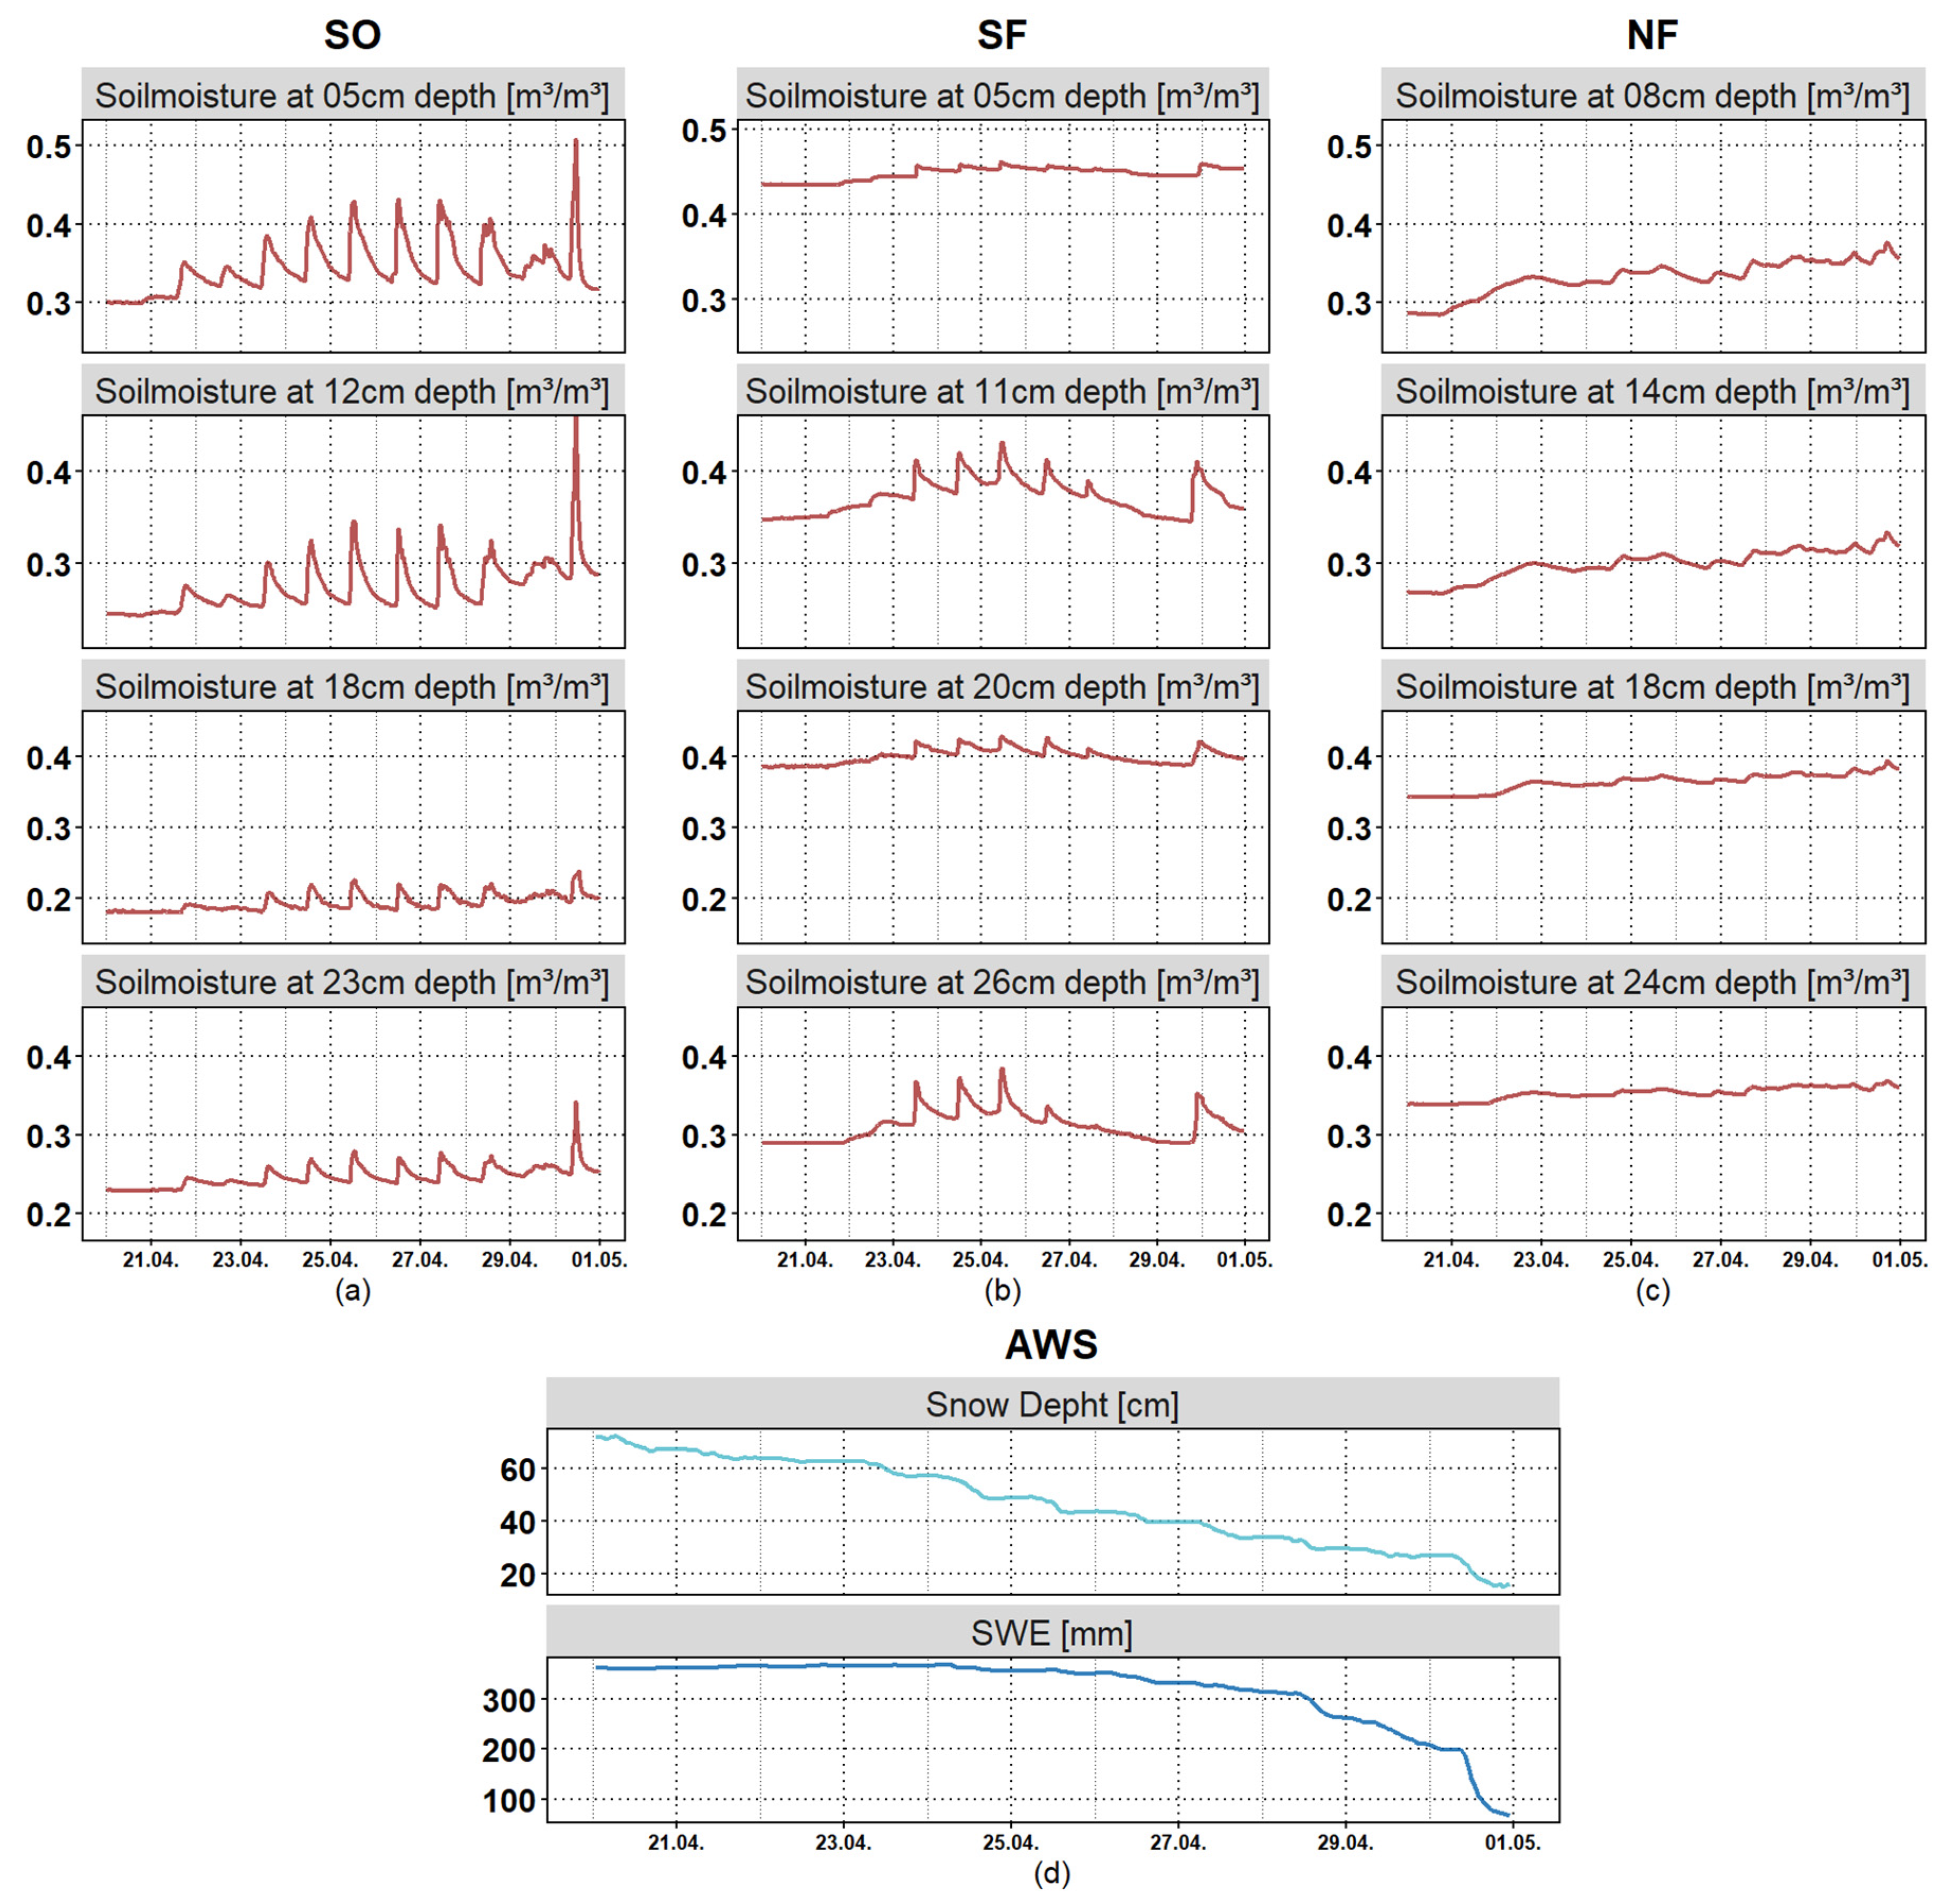
3.4. Soil Moisture Response
4. Discussion
5. Conclusions
Author Contributions
Funding
Data Availability Statement
Acknowledgments
Conflicts of Interest
Appendix A

References
- Jansson, P.; Hock, R.; Schneider, T. The concept of glacier storage: A review. J. Hydrol. 2003, 282, 116–129. [Google Scholar] [CrossRef]
- Lana-Renault, N.; Alvera, B.; García-Ruiz, J.M. Runoff and Sediment Transport during the Snowmelt Period in a Mediterranean High-Mountain Catchment. Arct. Antarct. Alp. Res. 2011, 43, 213–222. [Google Scholar] [CrossRef]
- Chang, M. Forest Hydrology: An Introduction to Water and Forests, 3rd ed.; CRC Press: Hoboken, NJ, USA, 2012; ISBN 978-1-4398-7994-8. [Google Scholar]
- Zare, M.; Azam, S.; Sauchyn, D. Evaluation of Soil Water Content Using SWAT for Southern Saskatchewan, Canada. Water 2022, 14, 249. [Google Scholar] [CrossRef]
- Ismail, M.F.; Bogacki, W.; Disse, M.; Schäfer, M.; Kirschbauer, L. Estimating degree-day factors based on energy flux components. Cryosphere Discuss. 2022; preprint. [Google Scholar]
- Hock, R. Temperature index melt modelling in mountain areas. J. Hydrol. 2003, 282, 104–115. [Google Scholar] [CrossRef]
- Ding, J.; Wang, Y.; Cao, C.; Sun, W. Improvement of the Soil and Water Assessment Tool Model and Its Application in a Typical Glacial Runoff Watershed: A Case Study of the Qarqan River Basin, China. Sustainability 2023, 15, 16046. [Google Scholar] [CrossRef]
- Aranda, F.; Medina, D.; Castro, L.; Ossandón, Á.; Ovalle, R.; Flores, R.P.; Bolaño-Ortiz, T.R. Snow Persistence and Snow Line Elevation Trends in a Snowmelt-Driven Basin in the Central Andes and Their Correlations with Hydroclimatic Variables. Remote Sens. 2023, 15, 5556. [Google Scholar] [CrossRef]
- Li, Y.; Chen, Y.; Li, Z. Dry/wet pattern changes in global dryland areas over the past six decades. Glob. Planet. Chang. 2019, 178, 184–192. [Google Scholar] [CrossRef]
- López-Moreno, J.I.; Revuelto, J.; Gilaberte, M.; Morán-Tejeda, E.; Pons, M.; Jover, E.; Esteban, P.; García, C.; Pomeroy, J.W. The effect of slope aspect on the response of snowpack to climate warming in the Pyrenees. Theor. Appl. Clim. 2014, 117, 207–219. [Google Scholar] [CrossRef]
- Saydi, M.; Ding, J. Impacts of topographic factors on regional snow cover characteristics. Water Sci. Eng. 2020, 13, 171–180. [Google Scholar] [CrossRef]
- Brauchli, T.; Trujillo, E.; Huwald, H.; Lehning, M. Influence of Slope-Scale Snowmelt on Catchment Response Simulated With the Alpine3D Model. Water Resour. Res. 2017, 53, 10723–10739. [Google Scholar] [CrossRef]
- Abudu, S.; Sheng, Z.; Cui, C.; Saydi, M.; Sabzi, H.-Z.; King, J.P. Integration of aspect and slope in snowmelt runoff modeling in a mountain watershed. Water Sci. Eng. 2016, 9, 265–273. [Google Scholar] [CrossRef]
- Fu, Q.; Hou, R.; Li, T.; Jiang, R.; Yan, P.; Ma, Z.; Zhou, Z. Effects of soil water and heat relationship under various snow cover during freezing-thawing periods in Songnen Plain, China. Sci. Rep. 2018, 8, 1325. [Google Scholar] [CrossRef] [PubMed]
- Cline, D.W. Snow surface energy exchanges and snowmelt at a continental, midlatitude Alpine site. Water Resour. Res. 1997, 33, 689–701. [Google Scholar] [CrossRef]
- Zhang, Y. Soil temperature in Canada during the twentieth century: Complex responses to atmospheric climate change. J. Geophys. Res. 2005, 14. [Google Scholar] [CrossRef]
- Skaggs, R.H.; Baker, D.G.; Ruschy, D.L. Interannual variability characteristics of the eastern Minnesota (USA) temperature record: Implications for climate change studies. Clim. Res. 1995, 5, 223–227. [Google Scholar] [CrossRef]
- Zheng, D.; Hunt, E.R., Jr.; Running, S.W. A daily soil temperature model based on air temperature and precipitation for continental applications. Clim. Res. 1993, 2, 188. [Google Scholar] [CrossRef]
- Moriana-Armendariz, M.; Nilsen, L.; Cooper, E.J. Natural variation in snow depth and snow melt timing in the High Arctic have implications for soil and plant nutrient status and vegetation composition. Arct. Sci. 2022, 8, 767–785. [Google Scholar] [CrossRef]
- Singh, S. Understanding the role of slope aspect in shaping the vegetation attributes and soil properties in Montane ecosystems. Trop. Ecol. 2018, 59, 425. [Google Scholar]
- Müller, M.; Schickhoff, U.; Scholten, T.; Drollinger, S.; Böhner, J.; Chaudhary, R.P. How do soil properties affect alpine treelines? General principles in a global perspective and novel findings from Rolwaling Himal, Nepal. Prog. Phys. Geogr. Earth Environ. 2016, 40, 135–160. [Google Scholar] [CrossRef]
- Brandt, A.C.; Zhang, Q.; Lopez Caceres, M.L.; Murayama, H. Soil temperature and soil moisture dynamics in winter and spring under heavy snowfall conditions in North-Eastern Japan. Hydrol. Process. 2020, 34, 3235–3251. [Google Scholar] [CrossRef]
- Osumi, K.; Ikeda, S.; Okamoto, T. Vegetation patterns and their dependency on site conditions in the pre-industrial landscape of north-eastern Japan. Ecol. Res. 2003, 18, 753–765. [Google Scholar] [CrossRef]
- Musselman, K.N.; Molotch, N.P.; Brooks, P.D. Effects of vegetation on snow accumulation and ablation in a mid-latitude sub-alpine forest. Hydrol. Process. 2008, 22, 2767–2776. [Google Scholar] [CrossRef]
- Andreadis, K.M.; Storck, P.; Lettenmaier, D.P. Modeling snow accumulation and ablation processes in forested environments. Water Resour. Res. 2009, 45, 10. [Google Scholar] [CrossRef]
- Helbig, N.; Moeser, D.; Teich, M.; Vincent, L.; Lejeune, Y.; Sicart, J.-E.; Monnet, J.-M. Snow processes in mountain forests: Interception modeling for coarse-scale applications. Hydrol. Earth Syst. Sci. 2020, 24, 2545–2560. [Google Scholar] [CrossRef]
- Moeser, D.; Stähli, M.; Jonas, T. Improved snow interception modeling using canopy parameters derived from airborne L i DAR data. Water Resour. Res. 2015, 51, 5041–5059. [Google Scholar] [CrossRef]
- Harpold, A.A.; Molotch, N.P.; Musselman, K.N.; Bales, R.C.; Kirchner, P.B.; Litvak, M.; Brooks, P.D. Soil moisture response to snowmelt timing in mixed-conifer subalpine forests. Hydrol. Process. 2015, 29, 2782–2798. [Google Scholar] [CrossRef]
- Lopez Caceres, M.L.; Takakai, F.; Iwahana, G.; Fedorov, A.N.; Iijima, Y.; Hatano, R.; Fukuda, M. Snowmelt and the hydrological interaction of forest-grassland ecosystems in Central Yakutia, eastern Siberia. Hydrol. Process. 2015, 29, 3074–3083. [Google Scholar] [CrossRef]
- Webb, R.W.; Fassnacht, S.R.; Gooseff, M.N. Hydrologic flow path development varies by aspect during spring snowmelt in complex subalpine terrain. Cryosphere 2018, 12, 287–300. [Google Scholar] [CrossRef]
- Ewald, J.; von Heßberg, A.; Diewald, W.; Rösler, S. Erfassung dre Farn-und Blütenpfanzenarten auf der Wiederbeweidungsfläche am Brunnenkopf-Südhang (Ammergebirge). Ber. Bayer. Bot. Ges. 2018, 88, 129. [Google Scholar]
- Vidal, A.; Schucknecht, A.; Toechterle, P.; Linares, D.R.A.; Garcia-Franco, N.; von Heßberg, A.; Krämer, A.; Sierts, A.; Fischer, A.; Willibald, G.; et al. High resistance of soils to short-term re-grazing in a long-term abandoned alpine pasture. Agric. Ecosyst. Environ. 2020, 300, 107008. [Google Scholar] [CrossRef]
- Kopp, M.; Tuo, Y.; Disse, M. Fully automated snow depth measurements from time-lapse images applying a convolutional neural network. Sci. Total Environ. 2019, 697, 134213. [Google Scholar] [CrossRef] [PubMed]
- Bayerische Vermessungsverwaltung. GeodatenOnline. Available online: https://geodatenonline.bayern.de/geodatenonline/seiten/wms_liste (accessed on 21 June 2024).
- LfU Bayern. Übersichtsbodenkarte 1:25.000—LfU Bayern. Available online: https://www.lfu.bayern.de/boden/karten_daten/uebk25/index.htm (accessed on 29 September 2023).
- European Environment Agency. Tree Cover Density 2018 (Raster 10 m), Europe, 3-Yearly; European Environment Agency: Copenhagen, Denmark, September 2020. [Google Scholar]
- Sieck, L.C.; Burges, S.J.; Steiner, M. Challenges in obtaining reliable measurements of point rainfall. Water Resour. Res. 2007, 19. [Google Scholar] [CrossRef]
- Sakaki, T.; Limsuwat, A.; Smits, K.M.; Illangasekare, T.H. Empirical two-point α-mixing model for calibrating the ECH2O EC-5 soil moisture sensor in sands. Water Resour. Res. 2008, 44. [Google Scholar] [CrossRef]
- Kraft, M.; McNamara, J.P.; Marshall, H.-P.; Glenn, N.F. Forest impacts on snow accumulation and melt in a semi-arid mountain environment. Front. Water 2022, 4, 17. [Google Scholar] [CrossRef]
- Müller, M.; Schwab, N.; Schickhoff, U.; Böhner, J.; Scholten, T. Soil Temperature and Soil Moisture Patterns in a Himalayan Alpine Treeline Ecotone. Arct. Antarct. Alp. Res. 2016, 48, 501–521. [Google Scholar] [CrossRef]
- Pomeroy, J.W.; Toth, B.; Granger, R.J.; Hedstrom, N.R.; Essery, R.L.H. Variation in Surface Energetics during Snowmelt in a Subarctic Mountain Catchment. J. Hydrometeorol. 2003, 4, 717. [Google Scholar] [CrossRef]
- Kankaanpää, T.; Skov, K.; Abrego, N.; Lund, M.; Schmidt, N.M.; Roslin, T. Spatiotemporal snowmelt patterns within a high Arctic landscape, with implications for flora and fauna. Arct. Antarct. Alp. Res. 2018, 50, 11. [Google Scholar] [CrossRef]
- Pomeroy, J.W.; Schmidt, R.A. The Use of Fractal Geometry in Modelling Intercepted Snow Accumulation and Sublimation. In Proceedings of the 50th Eastern Snow Conference, Quebec City, QC, Canada, 8–10 June 1993. [Google Scholar]
- Lundberg, A.; Halldin, S. Evaporation of intercepted snow: Analysis of governing factors. Water Resour. Res. 1994, 30, 2587–2598. [Google Scholar] [CrossRef]
- Pomeroy, J.W.; Gray, D.M. Snowcover Accumulation, Relocation and Management; National Hydrology Research Institute: Saskatoon, SK, Canada, 1995; ISBN 0-660-15816-7. [Google Scholar]
- Roth, T.R.; Nolin, A.W. Forest impacts on snow accumulation and ablation across an elevation gradient in a temperate montane environment. Hydrol. Earth Syst. Sci. 2017, 21, 5427–5442. [Google Scholar] [CrossRef]
- Kropp, H.; Loranty, M.M.; Rutter, N.; Fletcher, C.G.; Derksen, C.; Mudryk, L.; Todt, M. Are vegetation influences on Arctic–boreal snow melt rates detectable across the Northern Hemisphere? Environ. Res. Lett. 2022, 17, 104010. [Google Scholar] [CrossRef]
- Makoto, K.; Templer, P.H.; Katayama, A.; Seki, O.; Takagi, K. Early snowmelt by an extreme warming event affects understory more than overstory trees in Japanese temperate forests. Ecosphere 2022, 13, 9. [Google Scholar] [CrossRef]
- Guan, X.; Guo, S.; Huang, J.; Shen, X.; Fu, L.; Zhang, G. Effect of seasonal snow on the start of growing season of typical vegetation in Northern Hemisphere. Geogr. Sustain. 2022, 3, 268–276. [Google Scholar] [CrossRef]
- John, C.; Miller, D.; Post, E. Regional variation in green-up timing along a caribou migratory corridor: Spatial associations with snowmelt and temperature. Arct. Antarct. Alp. Res. 2020, 52, 416–423. [Google Scholar] [CrossRef]
- Christianson, K.R.; Johnson, B.M. Combined effects of early snowmelt and climate warming on mountain lake temperatures and fish energetics. Arct. Antarct. Alp. Res. 2020, 52, 130–145. [Google Scholar] [CrossRef]
- Blankinship, J.C.; Meadows, M.W.; Lucas, R.G.; Hart, S.C. Snowmelt timing alters shallow but not deep soil moisture in the Sierra Nevada. Water Resour. Res. 2014, 50, 1448–1456. [Google Scholar] [CrossRef]
- Bai, Y.; Fernald, A.; Tidwell, V.; Gunda, T. Reduced and Earlier Snowmelt Runoff Impacts Traditional Irrigation Systems. J. Contemp. Water Res. Educ. 2019, 168, 10–28. [Google Scholar] [CrossRef]
- Adla, S.; Bruckmaier, F.; Arias-Rodriguez, L.F.; Tripathi, S.; Pande, S.; Disse, M. Impact of calibrating a low-cost capacitance-based soil moisture sensor on AquaCrop model performance. J. Environ. Manag. 2024, 353, 120248. [Google Scholar] [CrossRef]
- Pereira, R.M.; Sandri, D.; Da Silva Júnior, J.J. Evaluation of low-cost capacitive moisture sensors in three types of soils in the Cerrado, Brazil. Reveng 2022, 30, 262–272. [Google Scholar] [CrossRef]
- Seeber, J.; Newesely, C.; Steinwandter, M.; Rief, A.; Körner, C.; Tappeiner, U.; Meyer, E. Soil invertebrate abundance, diversity, and community composition across steep high elevation snowmelt gradients in the European Alps. Arct. Antarct. Alp. Res. 2021, 53, 288–299. [Google Scholar] [CrossRef]
- Aalto, J.; Le Roux, P.C.; Luoto, M. Vegetation Mediates Soil Temperature and Moisture in Arctic-Alpine Environments. Arct. Antarct. Alp. Res. 2013, 45, 429–439. [Google Scholar] [CrossRef]


| Variable | Jan | Feb | Mar | Apr | May | Jun | Jul | Aug | Sep | Oct | Nov | Dec |
|---|---|---|---|---|---|---|---|---|---|---|---|---|
| T [°C] | −2.21 | −0.54 | 0.85 | 3.49 | 7.06 | 12.75 | 13.61 | 13.70 | 9.67 | 8.00 | 2.75 | −0.02 |
| P [mm] | 154.3 | 119.3 | 124.8 | 125.3 | 243.9 | 158.6 | 233.0 | 245.1 | 177.9 | 148.6 | 89.6 | 152.1 |
| Spot | Elevation | Aspect | Slope Angle | Vegetation | Canopy Cover 1 | Soil Texture | Soil Type 2 |
|---|---|---|---|---|---|---|---|
| SO | 1592 m.a.s.l. | S | 24° | Grass | 0% | Su2 | Ah, cC |
| SF | 1564 m.a.s.l. | S | 29° | Spruce | 74% | Su3 | Ah, cC |
| NF | 1562 m.a.s.l. | N | 27° | Spruce | 92% | Su3 | Ah, cC |
| Variable | Abbreviation | Unit | Available Time | Monitoring Site |
|---|---|---|---|---|
| Air Temperature | TAir | °C | 2016–2023 | AWS |
| Soil Temperature | TSoil | °C | 2020–2023 1 | SO, SF, and NF |
| Precipitation | P | mm | 2016–2023 | AWS |
| Snow Water Equivalent | SWE | mm | 2016–2023 1 | AWS |
| Snow Depth | dsnow | cm | 2016–2023 1 | AWS |
| Soil Moisture | θv | m3/m3 | 2020–2023 1 | SO, SF, and NF |
| Season | First Snow Day | Date of Max. Snow | Max. Snow Depth [cm] | Last Snow Day 1 |
|---|---|---|---|---|
| 2016/17 | 2016-11-13 | 2017-03-08 | 108 | 2017-05-08 |
| 2017/18 | 2017-11-06 | 2018-01-25 2 | >160 2 | 2018-05-06 |
| 2018/19 | 2018-11-28 | 2019-02-04 | 159 | 2019-05-06 |
| 2019/20 | 2019-11-06 | 2019-12-11 | 108 | 2020-05-03 |
| 2020/21 | 2020-11-21 | 2021-03-21 | 140 | 2021-05-09 |
| 2021/22 | 2021-11-03 | 2022-02-16 | 104 | 2022-04-13 |
| 2022/23 | 2022-11-06 | 2023-04-17 | 113 | 2023-05-01 |
Disclaimer/Publisher’s Note: The statements, opinions and data contained in all publications are solely those of the individual author(s) and contributor(s) and not of MDPI and/or the editor(s). MDPI and/or the editor(s) disclaim responsibility for any injury to people or property resulting from any ideas, methods, instructions or products referred to in the content. |
© 2024 by the authors. Licensee MDPI, Basel, Switzerland. This article is an open access article distributed under the terms and conditions of the Creative Commons Attribution (CC BY) license (https://creativecommons.org/licenses/by/4.0/).
Share and Cite
Schaefer, M.L.; Bogacki, W.; Lopez Caceres, M.L.; Kirschbauer, L.; Kato, C.; Kikuchi, S.-i. Influence of Slope Aspect and Vegetation on the Soil Moisture Response to Snowmelt in the German Alps. Hydrology 2024, 11, 101. https://doi.org/10.3390/hydrology11070101
Schaefer ML, Bogacki W, Lopez Caceres ML, Kirschbauer L, Kato C, Kikuchi S-i. Influence of Slope Aspect and Vegetation on the Soil Moisture Response to Snowmelt in the German Alps. Hydrology. 2024; 11(7):101. https://doi.org/10.3390/hydrology11070101
Chicago/Turabian StyleSchaefer, Michael Leopold, Wolfgang Bogacki, Maximo Larry Lopez Caceres, Lothar Kirschbauer, Chihiro Kato, and Shun-ichi Kikuchi. 2024. "Influence of Slope Aspect and Vegetation on the Soil Moisture Response to Snowmelt in the German Alps" Hydrology 11, no. 7: 101. https://doi.org/10.3390/hydrology11070101
APA StyleSchaefer, M. L., Bogacki, W., Lopez Caceres, M. L., Kirschbauer, L., Kato, C., & Kikuchi, S.-i. (2024). Influence of Slope Aspect and Vegetation on the Soil Moisture Response to Snowmelt in the German Alps. Hydrology, 11(7), 101. https://doi.org/10.3390/hydrology11070101