Article

Assessment of Multiple Trace Metal Fluxes in a Semi-Arid Watershed Containing Mine Tailing, Using a Multiple Tool Approach (Zaida Mine, Upper Moulouya Watershed, Morocco)

by
Yassine Mimouni
1,2,
Abdelhafid Chafi
2,
Abdelhak Bouabdli
3,
Bouamar Baghdad
4 and
Jean-François Deliege
1,*
1
PeGIRE Laboratory, Aquapôle Research Center, Unit FOCUS Research Freshwater and Oceanic Sciences Unit of Research, University of Liège, Quartier Polytech 1, Allée de la Découverte, 11, 4000 Liège, Belgium
2
Laboratory for Agricultural Productions Improvement, Biotechnology and Environment, Department of Biology, Faculty of Sciences, University Mohammed First, BP-717, Oujda 60000, Morocco
3
Laboratory of Geosciences, Department of Geology, Faculty of Science, Ibn Tofail University, Avenue de L’Université, Kenitra 14000, Morocco
4
Casablanca School of Architecture and Landscape—Honoris United Universities, Boulevard Abou Hanifa Al Noâman, Sidi Bernoussi, Casablanca 20100, Morocco
*
Author to whom correspondence should be addressed.
Hydrology 2024, 11(7), 105; https://doi.org/10.3390/hydrology11070105
Submission received: 24 June 2024 / Revised: 10 July 2024 / Accepted: 15 July 2024 / Published: 17 July 2024

Abstract

:
Few studies have quantified the complex flux of trace metals from mine tailings to rivers through water erosion, especially in the semi-arid region of North Morocco (Zaida mine) where soil erosion is a severe issue. This study applies (i) methods to understand and estimate the complex flux of trace metals from mine tailings to rivers, using the RUSLE model combined with the concentration of trace metals in the soil and additionally (ii) pollution indices and statistical analyses to assess the sediment contamination by Cd, Cu, Pb, and Zn. Our study revealed that the basin has a low erosion rate, with an average of 9.1 t/ha/yr. Moreover, the soil contamination is particularly high at the north of the mine tailings, as prevailing winds disperse particles across the basin. The assessment of the sediments indicated that Pb is the main contaminant, with concentrations exceeding 200 mg/kg specifically downstream of the tailings. This study also identified high a concentration of trace elements 14 km away from the tailings alongside the Moulouya river, due to the specific hydrological transport patterns in the area. This research contributes to a better understanding of the transport and fate of the trace metals in mining areas. It proposes a replicable method that can be applied in other regions to assess the contamination flows and thereby assist water resource management.

1. Introduction

Soil is one of the most important resources for human development (including food production while taking into account climate changes) [1]. Topsoil is currently considered as a non-renewable resource that is subject to intense degradation worldwide [2].
Mediterranean areas are strongly impacted by soil erosion due to their hilly topography and prolonged periods of dryness followed by irregular, stormy rainfall [3]. Several researchers have studied the water erosion in Mediterranean regions. They used different methodologies, including, among others, radioactive isotope dating and bathymetry [4,5]. Other researchers have chosen to estimate soil erosion using modelling approaches such as USLE, SWAT, STREAM, etc. [6,7,8]. The Revised Universal Soil Loss Equation (RUSLE) is one of the most widely used empirical models for predicting the average annual soil loss worldwide [9]. RUSLE is a combination of five key factors for erosion, such as rainfall erosivity R, slope length and steepness LS, soil erodibility K, soil management C, and conservation practices P. Its strength lies in its ability to provide good results despite its limited use of input data compared to other mathematical models [10].
Soil erosion has a negative impact on water resources. Water erosion carries a large number of fertilizers, pesticides, and trace metals (TMs) to the surface and groundwater. This leads in turn to the pollution of water bodies [11]. These processes affect agricultural soils, disrupt aquatic ecosystems, and present challenges for the sustainable management of water resources.
Human activities such as agriculture, deforestation, and mining activities make corresponding soils more vulnerable to excessive soil erosion [12]. Specifically, opencast mining is a significant contributor to erosion [13]. The soil removed during this process is often stored into hills, forming mining tailings [14]. In general, mining tailings are a source of environmental contamination due to their high concentrations in trace metals. These sites are subject to erosion, particularly during periods of high water. The trace metals present in the tailings are then gradually released into the environment, mainly via the fine particles bonded to these metals [15,16].
This is the case of the Zeïda mine, located in the Upper Moulouya, which started operating in 1972 and closed in 1986 [17]. Mining was mainly conducted in quarries, and the cerussite (PbCO3) ore was processed on site via gravimetry and flotation. This process generating around 12 Mt of tailings abandoned without any rehabilitation [18]. These tailings are a significant source of pollution for the river and surrounding soils [19,20].
Table S1 contains a summary of the studies conducted on the transport of trace metals from the basin to the river. These studies have focused either on measuring the trace metal flows from mining areas or on assessing the sediment contamination by mine tailings (assessment of sediment, water, soil, etc.). However, none of them (Cf. the table in Table S1) have simultaneously integrated these two perspectives.
Our study, on the other hand, aims at (i) estimating the trace metal load linked to soil erosion. This involves quantifying the amount of trace metals that are mobilized from the soil surface due to erosive forces, particularly in the areas affected by anthropogenic activities like mining, and (ii) assess the resulting contamination of sediments in a semi-arid climatic context. This assessment is important for determining how mobilized trace metals accumulate in riverbeds and downstream of the basin. To achieve these objectives, we used a spatial superposition method based on the RUSLE model and data on trace metal concentrations in the soil. We also evaluated the level of sediment contamination in the river using contamination indices. The river acts as a sink for soil particles eroded from contaminated lands, where trace metal concentrations (in sediments) can exceed the threshold limits. These high levels of trace metals’ concentration are potentially hazardous to the river ecosystem, mainly its sediments.
In conclusion, our study makes a significant contribution by filling this gap in the literature, by integrating the assessments of metal fluxes through erosion with those of environmental impacts, thus providing a better understanding of the metal transport processes in semi-arid watersheds.

2. Material and Methods

Study area
The abandoned Zeïda mine is located in the Upper Moulouya watershed in northeastern Morocco, as presented in Figure 1. The basin covers an area of 1218 km2, with altitudes ranging from 1313 to 2401 m. The Upper Moulouya forms the southwestern part of the eastern Meseta. It is bordered to the southwest by the High Atlas and to the northwest by the Middle Atlas [21]. Geologically, the basin consists of a Paleozoic basement composed mainly of granite. It is covered in discordance by Triassic formations (arkoses, sandstones, conglomerates, and argillite’s) and Jurassic formations (limestone and dolomite). The mineralization found in Zeïda is a stratiform deposit, located in Triassic arkoses and microconglomerates [22]. The main mineral species exploited at Zaida mine include well-crystallized cerussite (PbCO3) and galena (PbS) [23].
The climatic conditions in the basin are semi-arid. The annual precipitation ranges from 100 to 400 mm, and the average annual temperatures vary between 12 and 14 °C. The rainfall in the basin is usually short and violent, which emphasizes the erosion and leads to severe inundation [24]. The Moulouya, which extends for around 520 km, is the main river in the basin. The flow of the Moulouya in the Zaida station is characterized by high floods during the rainy periods and low water levels in the summer [25]. In addition to the Ansegmir river, the Moulouya is the main tributary of the Hassan II dam. The dam has a capacity of 400 Mm3 dedicated to drinking water supply and irrigation [26].

2.1. Data Source and Pre-Processing

The data used in this study are derived from various origins. To ensure a clear representation, they have been categorized into two types: primary and secondary data. Table 1 provides a summary of the different datasets and their respective sources.
Primary data
To measure the concentrations of trace metals (Cd, Cu, Pb, and Zn) and major elements (Na, K, Ca, Mg, and Al) in the river sediments, a sampling campaign was carried out in March 2022. A total of 10 sediment samples (1–10 cm depth from the surface) were collected (Figure 1). This depth reflects the recently eroded material deposited on the riverbed. These deposits illustrate the risk of contamination of the sediment by loads coming from the basin. Samples were taken from the main Moulouya River (MS1, MS2, MS3, MS4, MS5, MS6, and MS7), its tributary Ansegmir (AS1 and AS2), and a reference sample RF located 35 km from the mining area. The stations were located to cover the entire catchment area (Cf Figure 1), positioned upstream and downstream of the mining area and alongside the major tributaries. This placement allows a precise assessment of the contaminant inputs from the catchment.
For each sampling location, 1 kg of sediment was collected using a mini shovel, then preserved in polyethylene bags at a temperature of 4 °C. In the laboratory, samples were dried in ambient air, ground into powder, and sieved through a 0.25 mm mesh.
The pH of the soil was measured in a soil–solution mixture with a 1:1 ratio, using a pH meter (Hach HQ4300, Hach Company, Berlin, Germany) [28]. The soil conductivity was measured using an electronic conductivity meter (Hach HQ4300, Hach Company, Berlin, Germany)), following the method of [29]. Meanwhile, the CaCO3 was measured by using the method of Bernard [30]. The samples for the trace metal and major element analysis were digested according to the three acid protocol [31]. For this, 1 g of dry matter was placed in a pre-cleaned flask. A mixture of nitric acid (68%), hydrochloric acid (35%), and hydrogen peroxide was added to the flask. The blend was then placed on a sand-bath hot plate to boil lightly for digestion. In the final step, the mixture was diluted with 100 mL of ultra-pure water and filtered through an ashless cellulose membrane. The filtrate was then sent to the Regional University Interface Centre (CURI) for analysis via Inductively Coupled Plasma-Atomic Emission Spectrometry HORIBA Jobin Yvon (ICP-AES). Blank samples were also prepared with ultra-pure water, following the same protocol and under the same conditions.
ICP-AES analyses were carried out for 11 trace metals (As, Ca, Cd, Co, Cr, Cu, Ni, Pb, Si, Ti, and Zn). However, in this study, only the trace metals, Pb, Zn, Cu, and Cd, were retained. The concentrations of the other metals were below the detection threshold of the ICP-AES.
Secondary data
In addition to the sampling campaign already conducted, supplementary data were carefully collected from secondary sources. These included trace metal concentrations in the soil around the mine tailings, rainfall, digital elevation models, satellite imagery, and soil texture.
The concentrations of trace elements (Pb, Cu, Zn, Cd) in the soil were obtained from the study of [27]. A total of 51 soil samples located around the mine tailings were collected and analyzed via ICP-AES (for more details, see [27]). The various trace metal concentrations, together with the coordinates of the sampling points from [27], were collected and used in this study.
Several preliminary data processing operations were carried out in the study. The data on the metal concentrations in the soils and sediments were normalized. The satellite images and maps at different resolutions were matched using techniques such as resampling, geometric correction, and alignment.

2.2. Soil Erosion Estimation via the RUSLE Model

The average annual rate of soil erosion in the watershed was estimated via the RUSLE model [32] using Equation (1).
A = R × K × L × S × C × P
where A is the average annual soil loss ( t · ha 1 · yr 1 ) ; R is the rainfall erosivity factor ( MJ · mm · ha 1 · h 1 · yr 1 ) ; K is the soil erodibility factor ( t · ha · h · ha 1 · MJ 1 · mm 1 ) ; L is the slope length factor; S is the slope steepness factor; C is the cover-management practice factor; and P is the support practice factor. L, S, C, and P are all dimensionless.

2.2.1. The Rainfall Erosivity Factor (R)

The rainfall erosion factor estimates the precipitation erosion capacity, considering the features like raindrop characteristics and rainfall properties [33]. In this study, to estimate the R factor, we used the Modified Fournier Index (MFI) as calculated by Equation (2) and developed by [34]. The studies conducted in the Mediterranean regions confirm the efficacy of MFI in estimating the R factor compared to alternative indices such as the Precipitation Concentration Index (PCI), and the Seasonality Index (SI) [35].
R = i = 1 12 p i 2 P
where R represents the annual rainfall erosivity factor, pi is the cumulated rainfall of the month i, and P is the cumulated annual rainfall.
The Kriging interpolation method was implemented to generate a map (Figure 2a) representing the spatial distribution of the rainfall erosivity in the Zaïda watershed.

2.2.2. The Topographical Factor (LS)

The topographical factor (LS) is a ratio of the soil loss under specific conditions that occur at a “standard” slope steepness of 9% and a slope length of 22.6 m [36]. In this study, the topographical factor was calculated according to Equations (3) and (4) developed by [37]. The LS factor was calculated through QGIS 3.28 software.
L = A i , j + D 2 m + 1 A i , j m + 1 D m + 2 × x i , j m × 22.13 m
m = b b + 1
b = sin β 0.0896 056 + 3 × sin β 0.8
S = 10.8 × sin β + 0.03 , s < 9 % 16.8 × sin β 0.50 , s 9 %
where L is the slope length factor, S is the slope steepness factor, Ai,j is the contribution area at the inlet mesh in (m2), D is the size of the mesh in (m), xi, j is the sum of the sine and cosine orientations, m represents the slope length exponent, b is the ratio between rill and inter-rill erosion, and β is the slope angle in degrees.

2.2.3. The Soil Erodibility Factor (K)

The erodibility factor (k) represents the soil loss rate affected by physical soil properties such as soil structure, soil texture, organic content, and hydraulic conductivity [38]. The erodibility factor was determined using equations (5, 6, 7, 8, and 9). These equations were developed by [39].
K = f c s a n d · f c l s i · f o r g C · f h i s a n d
f c s a n d = 0.2 + 0.3 · e x p 0.256 · m s · 1 m s l i t 100
f c l s i = m s l i t m c + m s l i t 0.3
f o r g C = 1 0.25 · o r g C o r g C + e x p 3.72 2.95 · o r g C
f h i s a n d = 1 0.7 · 1 m s 100 1 m s 100 + e x p 5.51 + 22.9 · 1 m s 100
where K is the soil erodibility factor. ms, mslit, mc, and orgC are the proportion (%) of sand, silt, clay, and organic carbon content, respectively.

2.2.4. The Cover Management Factor (C)

The (C) factor is an estimate of the ratio between the soil loss from land cultivated under specific conditions and the corresponding loss from continuous clean-tilled fallow [40]. The (C) factor was determined using Equations (10) and (11) developed by [41], using an approach based on the Normalized Difference Vegetation Index (NDVI).
N D V I = N I R R N I R + R
C = e x p α · N D V I β N D V I
where N I R is near infra-red band (band 5), and R is red band (band 4). The values chosen for α and β are 2 and 1, respectively, as they provide good results [41].

2.2.5. The Support Practice Factor (P)

Due to the lack of detailed data on the soil conservation measures applied in the Zaïda watershed, the factor (P) was kept constant at a value of 1.
To calculate the erosion in the 1218 km2 Zaïda catchment, the RUSLE model was applied using a spatial discretization per 30 m2 grid cell. The calculations were carried out at the annual temporal resolution using ArcMap 10.8.1 and RStudio 2023.06.1 + 524 software.

2.3. Trace Elements’ Load Due to the Soil Erosion Model

To calculate the amount of trace metals transported with the eroded soil, Equation (12) proposed by [42] was used.
M T M = C T M A S D R E f
where MTM is the particulate trace metal load due to erosion in ( g · ha 1 · yr 1 ) , CTM is the trace metal concentration in soil ( mg · kg 1 ) , A is the average annual soil loss in ( t · ha 1 · yr 1 ) calculated by RUSLE, SDR is the sediment delivery ratio, and Ef is the trace metal enrichment factor.
To obtain a complete spatial representation of trace metals’ concentration in soils ( C T M ) , we applied the inverse distance spatial interpolation method to the available data [43].
The SDR is the ratio between the sediment delivery at the watershed outlet and the total erosion in the entire watershed. In this study, the SDR was determined using Equation (13) developed by [44].
S D R = 0.51 A 0.11
where A represents the drainage area in mi2.
During erosion episodes, small particles are the easiest to be carried away, leading to a phenomenon of particle selection via erosion, especially for clays. Trace metals mainly attached to the fine fraction of the soil are more concentrated in the sediments than in the original soil [45]. Therefore, an enrichment factor is calculated using Equation (14) developed by [46].
ln E f = 2 0.2 ln s e d
where Sed is the amount of eroded soil in Kg · ha 1 .

2.4. Sediment Assessment

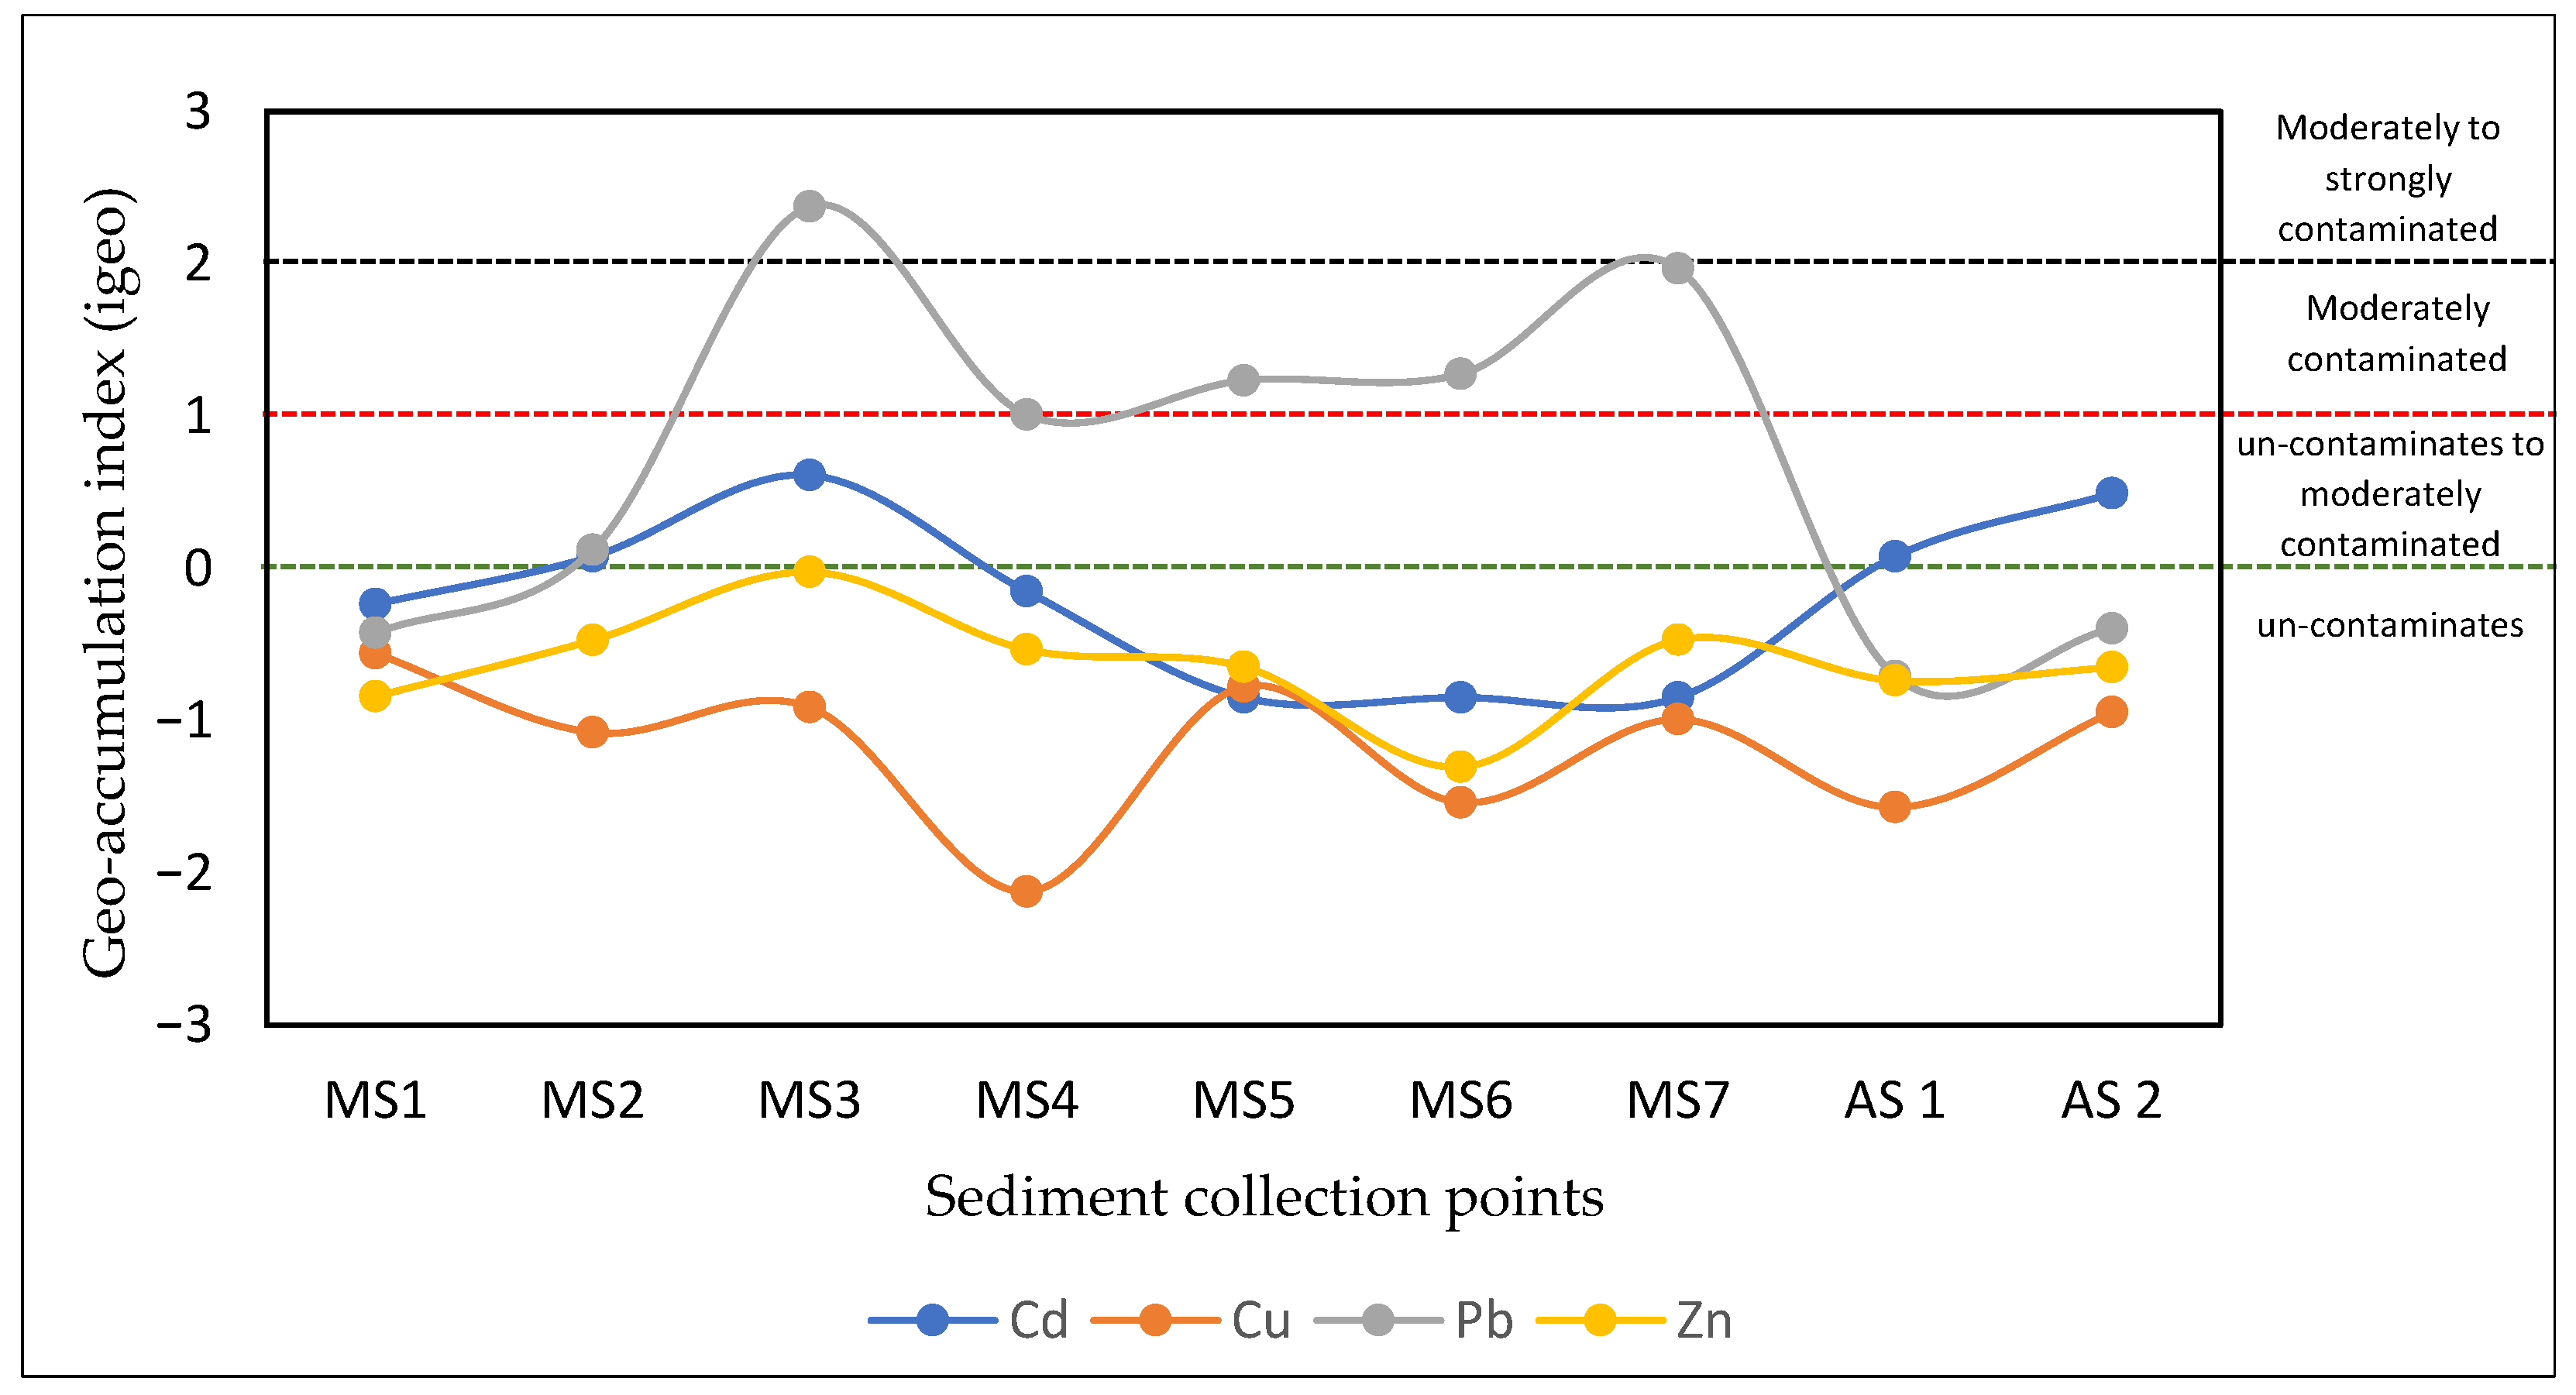
2.4.1. Geo-Accumulation Index

To determine the contamination levels in the sediment, we used the geo-accumulation index (Igeo) developed by [47]. It is calculated by Equation (15) as follows:
I g e o = l o g 2 C n 1.5 B n
where Cn represents the concentration of the n metal in the sediment, and Bn represents the geochemical background value of the n metal. Given the absence of a geochemical background for the study area, reference sediment concentrations were adopted. Table S2 shows the classification of metal contamination levels according to the geo-accumulation index (Igeo) [48].

2.4.2. Pollutant Load Index (PLI)

The PLI is a useful tool to assess the multi-metallic contamination of a single sample [49]. It is calculated using the contamination factor (CF) according to Equations (16) and (17) developed by Tomlinson [49]:
P L I = C F 1 × C F 2 × C F 3 × C F n n
C F i = C i C i 0
where Ci and Ci0 are the concentration of the ith trace element in the collected sample and in the geochemical background, respectively. Based on the obtained results, the soil can be classified as unpolluted when PLI ≈ 1 or polluted when PLI > 1.

2.4.3. Sediment Quality Guidelines

To determine the potential risks posed by trace elements on the benthic ecosystem, a comparison is proposed. This involves comparing the Probable Effect Concentration (PEC) and Threshold Effect Concentration (TEC) with the trace element concentrations found in samples [50]. The TEC refers to levels below which adverse effects on benthic organisms are not expected to occur. In addition, the PEC indicates the concentrations above which adverse effects are expected.

3. Results and Discussion

3.1. Soil Erodibility and Trace Metal Load

3.1.1. RUSLE Factors

The spatial distribution maps of the four factors influencing erosion are illustrated in Figure 2. These factors were calculated using ArcGIS and R Studio.
The R factor results value ranges from 31 to 58, with an average of 38 MJ · mm · ha 1 · h 1 · yr 1 (CF Figure 2a). The data analysis revealed that the highest R values were calculated during the months of November to January. This period of the year is characterized by intense thunderstorm events leading to significant erosion. The lowest values are located in the centre and east of the basin, while the highest values are calculated in the north of the basin, where the Middle Atlas Mountains dominate.
The LS factor in the watershed ranges from 0.03 to 25, as shown in Figure 2b. The highest values of this factor are found mainly in the northern part of the watershed, characterized by hilly slopes and rugged topography. In contrast, most LS factor values of the watershed fall in the range of 0.03 to 4. This distribution of LS factor values is due to the geomorphological nature of the watershed, which is essentially composed of the Oriental Meseta. This region is characterized by uplands surrounded by medium-altitude mountain ranges [21]. In these uplands, the slopes are less marked, leading to relatively low values of the LS factor.
The spatial distributions of the K factor are shown in Figure 2c. The erodibility of the soils in the watershed is classified into four categories according to soil type. In the northwestern part of the watershed, the K factor values are the lowest, fluctuating between 0.01 and 0.18. This is due to the presence of an important amount of organic matter attributable to the forest cover [51]. Furthermore, the mining areas exhibit the highest K factor values, which range from 0.22 to 0.27.
These high values for the erodibility factor are due to the alteration of the soil resulting from anthropogenic mining activities [52]. In fact, the crushing and grinding of ores increase the amount of silt and clay in the tailings, contrasting with the surrounding soils, which are mainly composed of sand (Figure S3).
The average C factor values range from 0.02 to 0.95 as shown in Figure 2d. The spatial distribution of the values reveals that the highest values are observed in bare lands and grasslands. These areas are characterized by a lack of dense vegetation coverage, which contributes to the accentuation of the erosive processes. In contrast, the lowest values are calculated in agricultural areas. This is due to the region’s reputation for arboriculture and interplant cropping, practices that preserve the soil and maintain the vegetation cover throughout the year [53].

3.1.2. Distribution and Classification of Soil Erosion

The examination of the soil erosion in the watershed of the Zaida mine reveals a significant variability. The erosion rate ranges from 0.01 to 158   ( t · ha 1 · yr 1 ) , with an average annual soil loss of 9.1   ( t · ha 1 · yr 1 ) . The statistical data on soil loss in the watershed are given in Figure 3. The distribution of soil erosion was categorized into five distinct classes: <7, 7–15, 15–30, 30–70, 70–160, as illustrated in Figure 4.
The statistical results indicate that the low erosion class covers 64% of the total basin area. However, its contribution to the total erosion remains low, representing only 24% of the total erosion. In contrast, the classes associated with high and very high erosion rates occupy only 12% and 5% of the total surface area, respectively, but despite this, they contribute to 55% of the total erosion in the basin.
The assessment of soil erosion according to the land use indicates that bare soil, urban areas, and agricultural zones are mainly associated with erosion levels classified as low. Meanwhile, high and very high erosion classes are more frequent in steppe and forest areas, respectively (further information on this observation is provided in the following section). Figure 3 shows that the steppe is the major contributor to soil erosion, accounting for 52% of the total erosion. Moreover, the forest, contributes to 22% of the total soil erosion, although it only covers 10% of the total surface area of the basin.
The analysis of the mining area was conducted within the boundaries of the tailings zone, which is a significant source of metallic pollution in the watershed. The erosion rates in this area vary from 0.16 to 46 ( t · ha 1 · yr 1 ) , with an average of around 10.6   ( t · ha 1 · yr 1 ) . This value exceeds the average erosion rate of 4.2 ( t · ha 1 · yr 1 ) observed in bare soils, including the mine tailings. Additionally, it surpasses the watershed’s average erosion rate of 9.1   ( t · ha 1 · yr 1 ) . These observations highlight the considerable erosive potential associated with the mining area, which raises a serious environmental issue.
The observation of erosion rates presents some unusual results. The erosion averages estimated in the forest and steppe environments exceed those estimated in the bare soil areas. This occurs even though the bare soils are devoid of vegetation that usually protects the soil. Indeed, research has revealed that increasing the percentage of vegetation cover helps dissipate the kinetic energy of water drops, thereby reducing the speed of runoff [54]. This situation can be explained by the degradation of vegetation cover being in forest and steppe areas, leaving a large part of the soil unprotected. Indeed, forests in the basin are characterized by sparse vegetation that does not completely cover the soil, contrary to forests in temperate or equatorial areas, which offer dense and continuous coverage [55]. Furthermore, an analysis of the factors influencing soil erosion, using Pearson’s correlation, is shown in Table 2. The result indicates that the soil erosion in the region is strongly linked to the topographical LS factor, with a correlation of 0.94. The correlation between the LS factor and the soil erosion clarifies the results observed in the watershed. The topographical factor is highly dominant in the forest and steppe areas, whereas it is less marked in the bare land areas. This difference explains the average erosion in forests and steppes even in the presence of vegetation cover.

3.1.3. Spatial Distribution of Trace Metals in Soil

The statistical data from the trace metal analyses in 51 samples are summarized in Table 3. The average metal concentrations follow the decreasing order, Pb > Zn > Cu > Cd. In fact, cerussite was the main mineral species extracted in the mine, composed mainly of lead carbonate. This composition explains the high concentrations of lead contamination in the soils.
A comparison between the average trace metal concentrations and the thresholds established by [56] highlights the contamination of the soil surrounding the tailing (Table 3). Furthermore, among the 51 soil samples analyzed, over 23% exceeded the limits set by the World Health Organization (WHO) for Pb, 47% for Zn, 15% for Cu, and 37% for Cd. These findings suggest that the inappropriate management of mine tailings after extraction activities have stopped has significantly polluted the soil with trace metals. The spatial distribution of trace metals in the soils of the Upper Moulouya catchment was analyzed using digital mapping techniques, based on the ordinary kriging interpolation. The results indicate that the presence of trace metals is mainly localized around the mine tailings, with a significant decrease in concentrations occurring 4 to 6 km away.
In the context of arid climates, research has shown that wind transport is the main factor influencing the transport of fine particles from mine tailings to the surrounding soils [49]. The results obtained in the neighbourhood of the Zaida mine indicate a high dispersion of contamination towards the eastern, northeastern, and southwestern sectors of the tailings. This dispersion is correlated with the prevailing wind directions observed in the Zaida watershed [31]. These results highlight the importance of wind transport in the propagation of metal pollution around the Zaida mine watershed.

3.1.4. Spatial Distribution of the Trace Metal Loads Caused by Soil Erosion

The spatial distribution of trace metal loads reveals similar trends among the various metals studied (Pb, Zn, Cu, Cd). However, we paid particular attention to the distribution of Pb. Pb shows the highest concentrations in soils, thus representing a major source of concern in terms of contamination in the catchment.
The Pb load distribution model presents a different pattern compared to that of soil erosion (Figure 5). In fact, soil erosion in the basin is mainly concentrated in areas with a high topography. However, the distribution of the Pb load is mainly located around the mine tailings. The rate of water erosion of Pb in the watershed shows a significant variation, ranging from 0.4 to over 5000 g/ha/yr, with an annual average flux of 166 g/ha. The highest Pb transport rates were observed in the eastern region of the mine tailings, over a distance of 2 km. The results also show that soils with an average annual Pb transport of 200 g/ha extended up to 6 km from the mine tailings, mainly along the Moulouya riverbed. This wide distribution along the river promotes the migration of Pb into the aquatic system during storm events.
The soil erosion and Pb load according to different types of land occupation are shown in Table S4. The land occupation in the watershed is classified into five categories according to their increasing surface area: steppe > bare land > forest > cropland > urban. This hierarchy based on surface area has no influence on the Pb transport rates. In fact, the distribution of the Pb transport rate to the river as a function of land use depends mainly on the nearness of the tailings to the land use. Bare land, which contains mine tailings, is the most contaminated land via metal pollution. These areas are also the main sources of Pb release, with a total migration rate of 9803 kg/yr. They are followed by the steppes, which account for a total transport of 2941 kg/yr of Pb. As regards the urban class, the city of Zaida is located 1.5 km from the mine tailings and is directly affected by the pollution that they generate. However, because of their small surface area, they only contribute 49 kg/yr to the Pb migration rate.

3.2. Assessment of Sediment Contamination by Trace Metals

3.2.1. Physiochemical Properties of Sediment

The physiochemical properties of the sediments (pH, electrical conductivity, and carbonate content) are shown in Table S5. The characteristics of the sediments analyzed in this study (pH, electrical conductivity, and carbonate content), together with the percentage of organic matter and particle size, represent the important factors controlling the speciation and adsorption of trace metals in the environment [58,59].
Naturally (without any consideration of mining activities), the pH ranged from 8.12 to 9.3, with a mean of 8.61. The spatial variation in pH is limited, with a standard deviation of 0.42, indicating that the sediment is alkaline in nature. The alkaline pH of the sediments is mainly the result of the abundance of limestone bedrock and dolomite in the watershed. This is reflected in the high percentage of calcite (on average 32%), which acts as a counterbalancing factor against the acidification of the environment [60]. The electrical conductivity (EC) depends on the dissolved ions that conduct the electrical current in the solution. In this study, the high conductivity values in the Moulouya River may be attributed to the abundant carbonate substratum in the region. Alternatively, they could locally result from the input of untreated wastewater from urban agglomerations.

3.2.2. Trace Metal Spatial Distribution in Sediments

The trace element concentrations in the collected sediment samples varied significantly between the different locations. As shown in Figure 6, the ranges of variation in concentrations are as follows: 1.2–2.75 mg/kg for Cd, 12–32.5 mg/kg for Cu, 25.38–215.21 mg/kg for Pb, and 50.93–110.32 mg/kg for Zn. In addition, the concentrations of As, Co, Cr and Ni remained below the ICP-AES detection limit set at 0.01 mg/L. The average concentrations of trace elements show a decreasing order as follows: Zn (83.30 mg/kg) > Pb (81.9 mg/kg) > Cu (20.1 mg/kg) > Cd (1.64 mg/kg), indicating that Pb and Zn have the highest concentrations. This could be due to the dominant extraction of cerussite, containing significant amounts of Pb and Zn. Consequently, these two trace metals were found in very high concentrations in the mine tailings, with values of 4822.90 and 112.7 mg/kg for Pb and Zn, respectively.
Furthermore, the analysis of the distribution of trace elements clearly reveals the contamination of the sediment quality due to the mine tailings. The highest concentrations were observed at sampling point MS3, immediately downstream of the tailings zone. More specifically, the concentrations of Pb and Zn reached more than 200 and 100 mg/kg, respectively. Additionally, a comparison of trace element concentrations reveals a significant increase in all elements (except for Cu) between the samples taken at point MS3 and the reference sample. For example, the concentrations determined for Cd, Pb, and Zn were 2.3, 7.7, and 1.4 times higher, respectively, than the reference sample. Considering that the region is devoid of any industrial activities likely to generate metal pollution (particularly lead pollution), these results indicate that the sediments in the vicinity of the mine tailings were significantly polluted by trace metals, transported from the tailings via erosion.
The river sediments were locally contaminated by the mine tailings. The concentrations of trace metals significantly decreased after point MS3 (except for MS7, which will be explained in Section 3.2.3). This observation is consistent with the sediment properties previously discussed, such as pH and CaCO3. These environmental characteristics increase the adsorption and limit the mobility of trace metals. In fact, the abundance of carbonates in the sediment acts as a buffer, enhancing the complexation of trace metals. This leads to the formation of secondary minerals such as carbonates and hydroxides, which adsorb the metals dissolved in water [61]. In addition, the typical low flow of the Moulouya River upstream of the watershed enhances the sedimentation of particles contaminated with trace metals and limits their transport downstream.

3.2.3. Assessment of the Sediment Pollution via Indexes

To assess the level of the metallic contamination of sediments, the Igeo index was applied (Figure 7). In the absence of the geochemical background, reference site values were used in this study. According to the Igeo index classification, the values range from −0.8 for Zn (uncontaminated) to 2.3 for Pb (moderately to heavily contaminated). At most locations, the metal indexes were either negative or nearly zero, indicating an absence of sediment contamination. However, for Pb, the contamination levels were higher, with a Igeo exceeding zero for six samples along the Moulouya. In addition, sampling points MS3 and MS7 showed the highest contamination indexes which was expected for MS3 given its proximity to the mine tailings. These results are similar to those obtained in different parts of the world, where the highest concentrations are determined in the vicinity of mine tailings [62,63].
Furthermore, the watershed is devoid of industrial activities that could lead to the discharge of metal pollutants into the river, and the main activities in the area are agriculture (located upstream) and grazing. In addition, the mine tailings contain very high concentrations of trace metals (Table S6) and are subject to significant erosion, as shown in the previous results. Overall, these observations highlight the spread of contaminated particles from the tailings to the corresponding sediments.
In addition, we used the PLI, another contamination assessment index, which considers the multi-metallic contamination for each sediment sample. The PLI is calculated based on the contamination factors (CFs), providing a better understanding of the enrichment intensity. The results obtained using the CFs and PLI are shown in Table 4. The CF results reveal that most of the sediment samples show a low contamination of Cu, Zn, and Cd, except for two samples moderately contaminated with Cd. On the other hand, for Pb, the range of contamination factors extends from “low” to “very high”, highlighting the contamination caused by the anthropogenic activities for this metal. The PLI ranges from 0.90 to 2.14, with an average of 1.24. The sediment samples located near mining tailings show the highest levels (MS3 = 2.14), revealing a significant trace metal contamination. This finding is consistent with our previous results, which show a high level of pollution around mining areas.
However, despite the decrease in pollution as we move downstream from the mining areas, sampling point MS7, located 14 km from these wastes, shows significant pollution. The MS7 reveals a high concentration of metals, classifying it as the second most contaminated point in the river. It has a geo-accumulation index of 2 for Pb (moderately contaminated) and a metal load pollution index of 1.41. The abnormal pollution index values observed at this point can be attributed to two combined factors. Firstly, it is possible that this point is receiving pollution from contaminated soils located to the east of the tailings. As mentioned earlier, wind action carries particles from the unprotected tailings, contaminating the soil in that area. Additionally, the network of creeks drains this part of the basin and transports contaminated particles to this point in the river. Secondly, this area acts as a deposition and sedimentation zone for particles transported by the river during rainy periods. Indeed, the elevation profile (Figure 8) shows a very slight slope (0.16%) between points MS6 and MS7. This slope is significantly less than the gradient found between points MS3 and MS6. This difference in slope reduces the velocity of the flow, thereby increasing the deposition of particles released by the tailings in this location (MS7). Although the research in the Upper Moulouya suggests that contaminated particles will accumulate in the sediments around the tailings [18], it also highlighted the fact that flash floods can lead to the transport and deposition of sediments downstream of mining areas. Indeed, several studies [64,65] highlight the partial correlation between the migration of trace metals in sediments and the flow rate. This mechanism can lead to the resuspension of these particles, thereby affecting the spatial distribution of trace metals downstream of the river system.
The impact of trace metal accumulation in sediments on the benthic fauna was assessed using SQGs. The results in Table S7 show that Cu and Zn levels in most samples did not exceed the Threshold Effect Concentration (TEC). This suggests that these two metals have a negligible impact on the benthic fauna. Furthermore, all the points show Cd concentrations ranging between the PEC and the TEC values. This indicates a potential risk of toxicity for bottom-dwelling organisms. On the other hand, Pb exceeded the PEC at 20% of the sampling points, surpassing the threshold above which negative effects are likely to occur. Furthermore, 40% of the sampling sites fall between the PEC and TEC values, indicating that Pb remains the most hazardous metal for the ecological system surrounding the tailings. A high level of toxicity indicated by the PEC can disrupt the ecological food chain by decreasing the abundance of primary organisms. These organisms are crucial suppliers of energy for the entire ecosystem [66].

3.2.4. Statistical Data Analysis

The results of the Shapiro–Wilk test [67], presented in Table S8, indicate that most of the data follow a normal distribution. These findings indicate that multivariate statistical methods could be used to analyze the relationships between trace metals and examine the similarities between their sources. In order to include the various factors that could influence the distribution of trace metals in sediments, a Pearson correlation analysis was carried out on trace metals, major elements, and physicochemical parameters (Table 5).
The correlations (p < 0.05) between variables and factors are classified as highly significant for 0.7 < r < 1 and significant for 0.5 < r < 0.7 [43]. The result of the study shows a positive correlation between the physicochemical parameters, pH and CaCO3 (r = 0.660), while no significant correlation is observed between the pH/CaCO3% and the EC. Regarding the trace elements, significant correlations were observed between them: a very strong correlation between Cd and Cu (r = 0.901), as well as a strong correlation between Cd, Cu, and CaCO3. There was also a strong correlation between Pb and EC (r = 0.731). Zn showed strong correlations with Cd and Pb (r = 0.601 and r = 0.622, respectively), as well as a moderate correlation with Cu and CaCO3 (r = 0.558 and r = 0.518, respectively). However, no correlation was found between Cu/Pb and Cd/Pb. Several studies have shown that a positive correlation between the variables may suggest that they follow the same transport mechanism, or come from the same source [68,69]. In addition, the Pearson matrix reveals a strong positive correlation between the major elements (Fe, Mn, Na, K, Mg, Al, Ca). Finally, negative correlations are mainly observed between Cd, Cu, and most of the major elements.
To better understand the mechanisms underlying the trace metal enrichment in sediments and to identify the common sources of contamination, a Principal Component Analysis (PCA) was carried out (Figure 9). The PCA was performed on a dataset consisting of 14 variables and nine sampling points. The Kaiser–Meyer–Olkin (KMO) result of 0.612 indicates that the data were suitable for principal component analysis. According to the eigenvalue criterion, only factors with an eigenvalue greater than one have been retained in this study. The F1 and F2 factors were selected, with eigenvalues of 7.4 and 2.5, respectively. Together, they account for 71.2% of the variability in the data.
The first factorial plane is mainly correlated with Cu, Cd, and CaCO3 (correlation > 0.613) and shows a negative correlation with the major elements present in the sediments. The F2 is mainly influenced by Pb and electrical conductivity (EC), with values greater than 0.867. Zn, on the other hand, shows a moderate correlation with F1 (0.496) and a much higher correlation with F2 (0.643).
The correlation circle reveals that Cd and Cu involve a similar positive orientation, suggesting a potential common source for these metals. However, Pb does not show a positive correlation with these metals. This implies that mine tailings might not be the main source of metallic contamination for Cu and Cd. Indeed, it is possible that cadmium and copper originate from different sources unrelated to mining activities. Previous studies have indicated that cadmium and copper contamination may be linked to agricultural practices and the discharge of untreated wastewater [70,71]. Moreover, the primary ore extracted from the Upper Moulouya is cerussite, which naturally contains significant amounts of Cu, Cd, and Zn [24]. The contamination by Cu and Cd seems to be attributed to the rock alteration within the basin and anthropogenic sources of contamination. This suggests that Factor 1 is associated with non-mining-related metallic contamination. The F2 factor can be defined as the principal mining component, mainly due to the significant correlation with Pb. The high concentrations of lead in mine tailings, along with the contamination indices of sediments heavily affected by lead (Igeo, CF, and PLI), confirm that F2 is mainly correlated with the contamination from mine tailings. In addition, zinc showed a positive and moderate correlation with F1 and F2, which means that it is coming from multiple sources that are affected by both lithogenic and anthropogenic factors.
The positive correlation between CaCO3 and trace metals highlights the major role played by CaCO3 in the adsorption and the increase in trace metals’ concentration in sediments. The positive correlation between EC and Pb on F2 suggests that their sources are common. This could be explained by the discharge of mine tailings loaded with minerals, which also leads to an increase in electrical conductivity. The major elements were negatively correlated with trace metals, indicating a competition pattern between them in the sediment adsorption sites.
The results of the PCA performed on the stations are shown in Figure 10. A zonation based on the physicochemical properties is observed, with four groups of stations identified. The first group, consisting of stations MS1, MS2, and MS4, is characterized by low metal pollution and represents non-contaminated sediments. The second group, composed of stations MS7, MS6, and MS5, has high concentrations of major elements but low concentrations of Cd and Cu. As a result, they are negatively positioned on the F1 axis, which reflects the Cd and Cu contamination. The third group is positively correlated with the F1 axis and includes two stations located on the Ansegmir (tributary of the Moulouya river). These stations are characterized by high Cd and Cu concentrations, which can be attributed to the intense agricultural activity prevalent in this region of the basin. Further studies carried out in the watershed have revealed that Cu and Cd may come from different sources than Pb and Zn [18,72]. The results are consistent with the Midelt province report, which identifies the Ansegmir sub-catchment as one of the most extensive irrigated croplands in the watershed with an irrigated area of 1030 ha and a volume of 6 Mm/yr of water abstracted [53]. These explanations support the suggestion that part of the Cd and Cu contamination in the watershed comes from agricultural activities or naturel sources. Finally, the last group consists of station MS3, located between both F1 and F2, indicating high contamination by all trace metals. Station MS3 is located downstream of the mine tailings, receiving large quantities of metals transported via erosion to the river.

4. Conclusions

At the first stage, the main objective of this research was to examine the transport flows of trace metals from a watershed containing mine tailings to the river, to determine their effect on the sediment quality. Our study also revealed that the basin has a low average erosion rate. This rate is mainly influenced by the topographical LS factor, which correlates strongly with soil erosion, as shown by the correlation coefficient of 0.94. In addition, the evaluation of the soil samples indicated that contamination is particularly severe in the vicinity of the mine tailings. Additionally, this contamination pattern aligns with the northeast and southwest directions, which are influenced by the prevailing winds.
Regarding the transport of metals to the river, it was observed that Pb exhibited an average transport rate of 166 g/ha/yr, with the highest concentrations detected 2 km from the mine tailings. Moreover, bare soil, identified as the primary land use impacting this flow, accounted for a significant contribution of 9803 kg/yr. The average concentrations of trace metals in the sediments were in an increasing order: Zn, Pb, Cu, then Cd. The levels of Pb and Zn exceeded concentrations of 200 mg/kg and 100 mg/kg, respectively. This contamination extended over more than 14 km from the mine tailings site. Contamination indices such as Igeo, PLI, and CF show that Pb is the most hazardous metal, particularly downstream of the tailings. Furthermore, statistical analysis shows that the sources of Cu and Cd pollution were different from those of Pb. This suggests that these metals are influenced by a variety of sources, both natural and anthropogenic, such as agriculture. This methodology demonstrates its ability to describe the complex transport of trace metals, providing useful explanations and a replicable approach for water resources management while addressing water quality surveys (which have potability purposes) and monitoring. Further analyses of sediments, water, and suspended solids are also planned, to identify the contamination caused by tailings in different parts of the ecosystem. These additional analyses will also be used to validate our model.

Supplementary Materials

The following supporting information can be downloaded at: https://www.mdpi.com/article/10.3390/hydrology11070105/s1, Table S1: Comparative Analysis of Trace Metal Flux Assessment Studies; Table S2: Geo-accumulation index classification; Figure S3: Texture triangle for the mine tailings, surrounding soil, and Upper Moulouya watershed; Table S4: Soil erosion and Lead migration flux under various land use types; Table S5: Variation of physicochemical parameters, pH, EC and CaCO3% in the sediments; Table S6: Average traces metals concentrations in the tree mine tailings at Zaida abandoned mine (mg/kg); Table S7: Comparison of Sampling Points Relative to PEC and TEC Values; Table S8: Shapiro-Wilk test for physicochemical parameters, chemical elements, and trace metals. References [11,18,31,42,73] used in the Supplementary Materials are listed in the article.

Author Contributions

Investigation, Y.M.; conceptualization, Y.M. and J.-F.D.; visualization, J.-F.D.; validation, B.B. and J.-F.D.; formal analysis, Y.M.; software, Y.M.; methodology, Y.M., A.C. and J.-F.D.; writing—original draft preparation, Y.M.; writing—reviewing and editing, Y.M. and J.-F.D.; supervision, A.C., A.B. and J.-F.D.; funding acquisition J.-F.D.; project administration, J.-F.D. All authors have read and agreed to the published version of the manuscript.

Funding

This research was conducted with the support of Wallonie-Bruxelles International (WBI).

Data Availability Statement

Most of the data presented in this study are available in the article. Additional information is available on request.

Acknowledgments

The authors would like to express their deep gratitude to the Moulouya Water Basin Agency (Oujda, Morocco) and the Oriental Centre for Water Science and Technology (COSTE, Mohammed First University, Oujda, Morocco) for their continuous support.

Conflicts of Interest

The authors declare no conflicts of interest.

References

  1. Alewell, C.; Borrelli, P.; Meusburger, K.; Panagos, P. Using the USLE: Chances, Challenges and Limitations of Soil Erosion Modelling. Int. Soil Water Conserv. Res. 2019, 7, 203–225. [Google Scholar] [CrossRef]
  2. Napoli, M.; Cecchi, S.; Orlandini, S.; Mugnai, G.; Zanchi, C.A. Simulation of Field-Measured Soil Loss in Mediterranean Hilly Areas (Chianti, Italy) with RUSLE. Catena 2016, 145, 246–256. [Google Scholar] [CrossRef]
  3. Aouichaty, N.; Bouslihim, Y.; Hilali, S.; Zouhri, A.; Koulali, Y. Estimation of Water Erosion in Abandoned Quarries Sites Using the Combination of RUSLE Model and Geostatistical Method. Sci. Afr. 2022, 16, e01153. [Google Scholar] [CrossRef]
  4. Moustakim, M.; Benmansour, M.; Nouira, A.; Benkdad, A.; Damnati, B. Caesium-137 Re-Sampling Approach and Excess Lead-210 Sediment Dating to Assess the Impacts of Climate Change and Agricultural Practices on Soil Erosion and Sedimentation in Northwest Morocco. Environ. Earth Sci. 2022, 81, 278. [Google Scholar] [CrossRef]
  5. Gourfi, A.; Daoudi, L.; Rhoujjati, A.; Benkaddour, A.; Fagel, N. Use of Bathymetry and Clay Mineralogy of Reservoir Sediment to Reconstruct the Recent Changes in Sediment Yields from a Mountain Catchment in the Western High Atlas Region, Morocco. Catena 2020, 191, 104560. [Google Scholar] [CrossRef]
  6. Briak, H.; Mrabet, R.; Moussadek, R.; Aboumaria, K. Use of a Calibrated SWAT Model to Evaluate the Effects of Agricultural BMPs on Sediments of the Kalaya River Basin (North of Morocco). Int. Soil Water Conserv. Res. 2019, 7, 176–183. [Google Scholar] [CrossRef]
  7. El Jazouli, A.; Barakat, A.; Ghafiri, A.; El Moutaki, S.; Ettaqy, A.; Khellouk, R. Soil Erosion Modeled with USLE, GIS, and Remote Sensing: A Case Study of Ikkour Watershed in Middle Atlas (Morocco). Geosci. Lett. 2017, 4, 25. [Google Scholar] [CrossRef]
  8. Echogdali, F.Z.; Boutaleb, S.; Taia, S.; Ouchchen, M.; Id-Belqas, M.; Kpan, R.B.; Abioui, M.; Aswathi, J.; Sajinkumar, K.S. Assessment of Soil Erosion Risk in a Semi-Arid Climate Watershed Using SWAT Model: Case of Tata Basin, South-East of Morocco. Appl. Water Sci. 2022, 12, 137. [Google Scholar] [CrossRef]
  9. Ahmad, W.S.; Jamal, S.; Taqi, M.; El-Hamid, H.T.A.; Norboo, J. Estimation of Soil Erosion and Sediment Yield Concentrations in Dudhganga Watershed of Kashmir Valley Using RUSLE & SDR Model. Environ. Dev. Sustain. 2022, 26, 215–238. [Google Scholar] [CrossRef]
  10. Mahoney, D.; Blandford, B.; Fox, J. Coupling the Probability of Connectivity and RUSLE Reveals Pathways of Sediment Transport and Soil Loss Rates for Forest and Reclaimed Mine Landscapes. J. Hydrol. 2021, 594, 125963. [Google Scholar] [CrossRef]
  11. Hao, G.R.; Li, J.K.; Li, S.; Li, K.B.; Zhang, Z.H.; Li, H.E. Quantitative Assessment of Non-Point Source Pollution Load of PN/PP Based on RUSLE Model: A Case Study in Beiluo River Basin in China. Environ. Sci. Pollut. Res. 2020, 27, 33975–33989. [Google Scholar] [CrossRef] [PubMed]
  12. Fressard, M.; Cossart, E.; Chaize, B. Pluri-Decennial Erosion Rates Using SUM/ISUM and Sediment Traps Survey in the Mercurey Vineyards (Burgundy, France). Geomorphology 2022, 403, 108181. [Google Scholar] [CrossRef]
  13. Wu, Q.; Wang, M. A Framework for Risk Assessment on Soil Erosion by Water Using an Integrated and Systematic Approach. J. Hydrol. 2007, 337, 11–21. [Google Scholar] [CrossRef]
  14. Shi, W.; Wang, J.; Li, X.; Xu, Q.; Jiang, X. Multi-Fractal Characteristics of Reconstructed Landform and Its Relationship with Soil Erosion at a Large Opencast Coal-Mine in the Loess Area of China. Geomorphology 2021, 390, 107859. [Google Scholar] [CrossRef]
  15. Tansel, B.; Rafiuddin, S. Heavy Metal Content in Relation to Particle Size and Organic Content of Surficial Sediments in Miami River and Transport Potential. Int. J. Sediment Res. 2016, 31, 324–329. [Google Scholar] [CrossRef]
  16. Ma, Y.; Qin, Y.; Zheng, B.; Zhang, L.; Zhao, Y. Seasonal Variation of Enrichment, Accumulation and Sources of Heavy Metals in Suspended Particulate Matter and Surface Sediments in the Daliao River and Daliao River Estuary, Northeast China. Environ. Earth Sci. 2015, 73, 5107–5117. [Google Scholar] [CrossRef]
  17. Elouadihi, N.; Laghlimi, M.; Moussadek, R.; Laghrour, M.; Bouabdli, A.; Baghdad, B. Phytoremediation Study of Mining Soils: Case of the Mibladen and Zaida Mine (High Moulouya, Morocco). J. Exp. Biol. Agric. Sci. 2022, 10, 1391–1400. [Google Scholar] [CrossRef]
  18. El Azhari, A.; Rhoujjati, A.; EL Hachimi, M.L. Assessment of Heavy Metals and Arsenic Contamination in the Sediments of the Moulouya River and the Hassan II Dam Downstream of the Abandoned Mine Zeïda (High Moulouya, Morocco). J. Afr. Earth Sci. 2016, 119, 279–288. [Google Scholar] [CrossRef]
  19. Bouabdli, A.; Saidi, N.; M’Rabet, S.; Escarre, J.; Leblanc, M. Heavy Metal Transport by the Moulouya River (Morocco). Rev. Sci. l’Eau 2005, 18, 199–213. [Google Scholar] [CrossRef]
  20. Ech-Charef, A.; Dekayir, A.; Jordán, G.; Rouai, M.; Chabli, A.; Qarbous, A.; El Houfy, F.Z. Soil Heavy Metal Contamination in the Vicinity of the Abandoned Zeïda Mine in the Upper Moulouya Basin, Morocco. Implications for Airborne Dust Pollution under Semi-Arid Climatic Conditions. J. Afr. Earth Sci. 2023, 198, 104812. [Google Scholar] [CrossRef]
  21. Hoepffner, C. La Tectonique Hercynienne Dans l’Est Du Maroc. PhD Thesis, Universite Louis Pasteur, Strasbourg, France, 1987. [Google Scholar]
  22. Iavazzo, P.; Adamo, P.; Boni, M.; Hillier, S.; Zampella, M. Mineralogy and Chemical Forms of Lead and Zinc in Abandoned Mine Wastes and Soils: An Example from Morocco. J. Geochemical Explor. 2012, 113, 56–67. [Google Scholar] [CrossRef]
  23. Jébrak, M.; Marcoux, É.; Nasloubi, M.; Zaharaoui, M. From Sandstone- to Carbonate-Hosted Strata Bound Deposits: An Isotope Study of Galena in the Upper-Moulouya District (Morocco). Miner. Depos. 1998, 33, 406–415. [Google Scholar] [CrossRef]
  24. Iavazzo, P.; Ducci, D.; Adamo, P.; Trifuoggi, M.; Migliozzi, A.; Boni, M. Impact of Past Mining Activity on the Quality of Water and Soil in the High Moulouya Valley (Morocco). Water Air Soil Pollut. 2012, 223, 573–589. [Google Scholar] [CrossRef]
  25. Hachimi, M.L.E.; Bouabdli, A.; Fekhaoui, M. Les Rejets Miniers de Traitement: Caractérisation, Capacité Polluante et Impacts Environnementaux, Mine Zeïda, Mine Mibladen, Haute Moulouya (Maroc). Environ. Ingénierie Dev. 2013, N°63-mars 2013, 23–42. [Google Scholar] [CrossRef]
  26. Chahboune, M.; Chahlaoui, A.; Zaid, A. Contribution to Comparative Study of the Physico-Chemical Quality of Waters of Moulouya and Ansegmir Rivers in Upstream of Hassan II Dam (Province of Midelt, Morocco). J. Biodivers. Environ. Sci. 2014, 2014, 278–288. [Google Scholar]
  27. Thomas, G. Soil PH and Soil Acidity. In Methods of Soil Analysis Part 3: Chemical Methods; Sparks, D.L., Page, A.L., Helmke, P.A., Loeppert, R.H., Eds.; John Wiley and Sons: Hoboken, NJ, USA, Soil Science Society of America and American Society of Agronomy, USA; 1996; pp. 475–489. ISBN 978-0-891-18825-4. [Google Scholar]
  28. Smith, J.; Doran, J. Measurement and Use of PH and Electrical Conductivity for Soil Quality Analysis. In Methods for Assessing Soil Quality; Doran, W., Jones, A.J., Eds.; Soil Science Society of America Special Publication: Madison, WI, USA, 1996; pp. 169–186. [Google Scholar]
  29. AFNOR NF P94-048 Sols; Reconnaissance et Essais-Détermination de La Teneur En Carbonate—Méthode Du Calcimètre. Association Française de Normalisation: Paris, France, 1996.
  30. Hoenig, M. Spectrométrie d’absorption Atomique Électrothermique: Contribution a l’établissement d’une Méthodologie Rationnelle Pour La Détermination Des Éléments Traces Dans Les Milieux Naturels. Ph.D. Thesis, L’université des Sciences et Techniques de Lille Flandres Artois, Lille, France, 1990. [Google Scholar]
  31. Laghlimi, M.; Douaik, A.; Baghdad, B.; Hassan, E.H.; Rachid, M.; Meryem, T. Spatial Distribution of Soil Heavy Metals in the Zaida Mine (Morocco) Based on Geostatistical Methods. Int. J. Adv. Res. 2015, 3, 337–349. [Google Scholar]
  32. Renard, K.G.; Foster, G.; Weesies, G.; McCool, D.; Yoder, D. Predicting Soil Erosion by Water: A Guide to Conservation Planning with the Revised Universal Soil Loss Equation (RUSLE); US Department of Agriculture, Agricultural Research Service: Washington, DC, USA, 1997. [Google Scholar]
  33. Panagos, P.; Ballabio, C.; Borrelli, P.; Meusburger, K.; Klik, A.; Rousseva, S.; Tadić, M.P.; Michaelides, S.; Hrabalíková, M.; Olsen, P.; et al. Rainfall Erosivity in Europe. Sci. Total Environ. 2015, 511, 801–814. [Google Scholar] [CrossRef] [PubMed]
  34. Arnoldus, H.M.J. An Approximation of the Rainfall Factor in the Universal Soil Loss Equation. In An Approximation of the Rainfall Factor in the Universal Soil Loss Equation; John Wiley and Sons Ltd.: Chichester, UK, 1980; pp. 127–132. [Google Scholar]
  35. Di Lena, B.; Curci, G.; Vergni, L. Analysis of Rainfall Erosivity Trends 1980–2018 in a Complex Terrain Region (Abruzzo, Central Italy) from Rain Gauges and Gridded Datasets. Atmosphere 2021, 12, 657. [Google Scholar] [CrossRef]
  36. Kayet, N.; Pathak, K.; Chakrabarty, A.; Sahoo, S. Evaluation of Soil Loss Estimation Using the RUSLE Model and SCS-CN Method in Hillslope Mining Areas. Int. Soil Water Conserv. Res. 2018, 6, 31–42. [Google Scholar] [CrossRef]
  37. Desmet, P.J.J.; Govers, G. A GIS Procedure for Automatically Calculating the USLE LS Factor on Topographically Complex Landscape Units. J. Soil Water Conserv. 1996, 51, 427–433. [Google Scholar]
  38. Zhu, M.; He, W.; Zhang, Q.; Xiong, Y.; Tan, S.; He, H. Spatial and Temporal Characteristics of Soil Conservation Service in the Area of the Upper and Middle of the Yellow River, China. Heliyon 2019, 5, e02985. [Google Scholar] [CrossRef]
  39. Sharpley, A.N.; Williams, J.R. (Eds.) EPIC—Erosion/Productivity Impact Calculator: 1. Model Documentation; U.S. Department of Agriculture Technical Bulletin No. 1768: Washington, DC, USA, 1990; 235p, Available online: https://epicapex.tamu.edu/media/h2gkyznv/epicmodeldocumentation.pdf (accessed on 16 June 2024).
  40. Neitsch, S.; Arnold, J.; Kiniry, J.; Williams, J. Soil & Water Assessment Tool Theoretical Documentation Version 2009; Texas Water Resources Institute Technical Report: College Station, TX, USA, 2011; pp. 1–647. [Google Scholar] [CrossRef]
  41. van der Knijff, J.; Jones, R.; Montanarella, L. Soil Erosion Risk Assessment in Italy; EPIC: Redwood City, CA, USA, 2000. [Google Scholar]
  42. Rendana, M.; Idris, W.M.R.; Rahim, S.A. The Variation of Riverine Heavy Metal Flux Using RUSLE Model in the Ranau Sub-Basins, Malaysia. Adjacent to Ultrabasic Soil. Water Air Soil Pollut. 2022, 233, 495. [Google Scholar] [CrossRef]
  43. Bella Atangana, M.S.; Dam Ngoupayou, J.R.; Deliege, J.F. Hydrogeochemistry and Mercury Contamination of Surface Water in the Lom Gold Basin (East Cameroon): Water Quality Index, Multivariate Statistical Analysis and Spatial Interpolation. Water 2023, 15, 2502. [Google Scholar] [CrossRef]
  44. USDA United States Department of Agriculture Soil Conservation Service. National Engineering Handbook; Section 3; USDA United States Department of Agriculture Soil Conservation Service: Washington, DC, USA, 1972. [Google Scholar]
  45. Zhang, H.; Luo, Y.; Makino, T.; Wu, L.; Nanzyo, M. The Heavy Metal Partition in Size-Fractions of the Fine Particles in Agricultural Soils Contaminated by Waste Water and Smelter Dust. J. Hazard. Mater. 2013, 248–249, 303–312. [Google Scholar] [CrossRef] [PubMed]
  46. Menzel, R.G. Enrichment Ratios For Water Quality Modeling. In CREAMS a Field Scale Model for Chemicals/Runoff, and Erosion from Agricultural Management Systems NATURAL; Forgotten Books: London, UK, 1980; pp. 486–492. ISBN 0364976101. [Google Scholar]
  47. Mueller, G. Schwermetalle in Den Sedimenten Des Rheins—Veranderungen Seit 1971. Umsch. Wissensch. Techn. 1979, 79, 778–783. [Google Scholar]
  48. Förstner, U.; Müller, G. Concentrations of Heavy Metals and Polycyclic Aromatic Hydrocarbons in River Sediments: Geochemical Background, Man’s Influence and Environmental Impact. GeoJournal 1981, 5, 417–432. [Google Scholar] [CrossRef]
  49. Tomlinson, D.L.; Wilson, J.G.; Harris, C.R.; Jeffrey, D.W. Problems in the Assessment of Heavy-Metal Levels in Estuaries and the Formation of a Pollution Index. Helgoländer Meeresunters. 1980, 33, 566–575. [Google Scholar] [CrossRef]
  50. MacDonald, D.D.; Ingersoll, C.G.; Berger, T.A. Development and Evaluation of Consensus-Based Sediment Quality Guidelines for Freshwater Ecosystems. Arch. Environ. Contam. Toxicol. 2000, 39, 20–31. [Google Scholar] [CrossRef] [PubMed]
  51. Radziuk, H.; Switoniak, M. Soil Erodibility Factor (K) in Soils under Varying Stages of Truncation. Soil Sci. Annu. 2021, 72, 134621. [Google Scholar] [CrossRef]
  52. Mhaske, S.N.; Pathak, K.; Dash, S.S.; Nayak, D.B. Assessment and Management of Soil Erosion in the Hilltop Mining Dominated Catchment Using GIS Integrated RUSLE Model. J. Environ. Manag. 2021, 294, 112987. [Google Scholar] [CrossRef]
  53. Royaume du Maroc, Ministère de l’Intérieur, Secrétariat Général, Division de l’Urbanisme et de l’Environnement. In Monographie de la Province de Midelt; Administration de la Province de Midelt: Midelt, Morocco, 2020; 45p.
  54. Zuazo, V.H.D.; Pleguezuelo, C.R.R. Soil-Erosion and Runoff Prevention by Plant Covers. A Review. Agron. Sustain. Dev. 2008, 28, 65–86. [Google Scholar] [CrossRef]
  55. Aguilar, F.J.; Nemmaoui, A.; Aguilar, M.A.; Chourak, M.; Zarhloule, Y.; García Lorca, A.M. A Quantitative Assessment of Forest Cover Change in the Moulouya River Watershed (Morocco) by the Integration of a Subpixel-Based and Object-Based Analysis of Landsat Data. Forests 2016, 7, 23. [Google Scholar] [CrossRef]
  56. Baize, D. Teneurs totales en éléments traces métalliques dans les sols (France): Références et stratégies d’interprétation. Programme ASPITET; INRA: Paris, France, 1997; ISBN 2-7380-0747-3. [Google Scholar]
  57. Essien, J.P.; Inam, E.D.; Ikpe, D.I.; Udofia, G.E.; Benson, N.U. Ecotoxicological Status and Risk Assessment of Heavy Metals in Municipal Solid Wastes Dumpsite Impacted Soil in Nigeria. Environ. Nanotechnol. Monit. Manag. 2019, 11, 100215. [Google Scholar] [CrossRef]
  58. Grard, A.; Deliège, J.F. Characterizing Trace Metal Contamination and Partitioning in the Rivers and Sediments of Western Europe Watersheds. Hydrology 2023, 10, 51. [Google Scholar] [CrossRef]
  59. Zamani-Ahmadmahmoodi, R.; Esmaili-Sari, A.; Mohammadi, J.; Bakhtiari, A.R.; Savabieasfahani, M. Spatial Distribution of Cadmium and Lead in the Sediments of the Western Anzali Wetlands on the Coast of the Caspian Sea (Iran). Mar. Pollut. Bull. 2013, 74, 464–470. [Google Scholar] [CrossRef] [PubMed]
  60. Parra, A.; Oyarzún, J.; Maturana, H.; Kretschmer, N.; Meza, F.; Oyarzún, R. Natural Factors and Mining Activity Bearings on the Water Quality of the Choapa Basin, North Central Chile: Insights on the Role of Mafic Volcanic Rocks in the Buffering of the Acid Drainage Process. Environ. Monit. Assess. 2011, 181, 69–82. [Google Scholar] [CrossRef] [PubMed]
  61. Ghorbel Ben Abid, M. Contamination Métallique Issue Des Déchets de L’ancien Site Minier de Jebel Ressas: Modélisation Des Mécanismes de Transfert et Conception de Cartes d’aléa Post-Mine Dans Un Contexte Carbonaté et Sous Un Climat Semi-Aride. Ph.D. Thesis, Evaluation Du Risque Pour La Sa, Université Paul Sabatier—Toulouse III, Toulouse, France, 2012. Volume 8. [Google Scholar]
  62. Jiménez-Oyola, S.; Valverde-Armas, P.E.; Romero-Crespo, P.; Capa, D.; Valdivieso, A.; Coronel-León, J.; Guzmán-Martínez, F.; Chavez, E. Heavy Metal(Loid)s Contamination in Water and Sediments in a Mining Area in Ecuador: A Comprehensive Assessment for Drinking Water Quality and Human Health Risk. Environ. Geochem. Health 2023, 45, 4929–4949. [Google Scholar] [CrossRef] [PubMed]
  63. Elvine Paternie, E.D.; Hakkou, R.; Ekengele Nga, L.; Bitom Oyono, L.D.; Ekoa Bessa, A.Z.; Oubaha, S.; Khalil, A. Geochemistry and Geostatistics for the Assessment of Trace Elements Contamination in Soil and Stream Sediments in Abandoned Artisanal Small-Scale Gold Mining (Bétaré-Oya, Cameroon). Appl. Geochem. 2023, 150, 105592. [Google Scholar] [CrossRef]
  64. Song, Y.; Ji, J.; Mao, C.; Yang, Z.; Yuan, X.; Ayoko, G.A.; Frost, R.L. Heavy Metal Contamination in Suspended Solids of Changjiang River—Environmental Implications. Geoderma 2010, 159, 286–295. [Google Scholar] [CrossRef]
  65. Liu, S.; Yu, F.; Lang, T.; Ji, Y.; Fu, Y.; Zhang, J.; Ge, C. Spatial Distribution of Heavy Metal Contaminants: The Effects of Water-Sediment Regulation in the Henan Section of the Yellow River. Sci. Total Environ. 2023, 892, 164568. [Google Scholar] [CrossRef]
  66. Zerizghi, T.; Yang, Y.; Wang, W.; Zhou, Y.; Zhang, J.; Yi, Y. Ecological Risk Assessment of Heavy Metal Concentrations in Sediment and Fish of a Shallow Lake: A Case Study of Baiyangdian Lake, North China. Environ. Monit. Assess. 2020, 192, 154. [Google Scholar] [CrossRef] [PubMed]
  67. Shapiro, S.S.; Wilk, M.B. An Analysis of Variance Test for Normality (Complete Samples). Biometrika 1965, 52, 591–611. [Google Scholar] [CrossRef]
  68. Ahouach, Y.; Baali, A.; Boushaba, A.; Hakam, O.; Azennoud, K.; Lyazidi, A.; Benmessaoud, S.; Assouguem, A.; Kara, M.; Alsaigh, M.A.; et al. Impact of the Controlled Dump of Fez City (Morocco): Evaluation of Metallic Trace Elements Contamination in the Sediments. Water 2023, 15, 1209. [Google Scholar] [CrossRef]
  69. Madyouni, H.; Almanza, V.; Benabdallah, S.; Joaquim-Justo, C.; Romdhane, M.S.; Habaieb, H.; Deliege, J.F. Assessment of Water Quality Variations and Trophic State of the Joumine Reservoir (Tunisia) by Multivariate Analysis. Water 2023, 15, 3019. [Google Scholar] [CrossRef]
  70. Sekabira, K.; Origa, H.O.; Basamba, T.A.; Mutumba, G.; Kakudidi, E. Assessment of Heavy Metal Pollution in the Urban Stream Sediments and Its Tributaries. Int. J. Environ. Sci. Technol. 2010, 7, 435–446. [Google Scholar] [CrossRef]
  71. Jiang, H.H.; Cai, L.M.; Hu, G.C.; Wen, H.H.; Luo, J.; Xu, H.Q.; Chen, L.G. An Integrated Exploration on Health Risk Assessment Quantification of Potentially Hazardous Elements in Soils from the Perspective of Sources. Ecotoxicol. Environ. Saf. 2021, 208, 111489. [Google Scholar] [CrossRef] [PubMed]
  72. Bouzekri, S.; El Hachimi, M.L.; Touach, N.; El Fadili, H.; El Mahi, M.; Lotfi, E.M. The Study of Metal (As, Cd, Pb, Zn and Cu) Contamination in Superficial Stream Sediments around of Zaida Mine (High Moulouya-Morocco). J. Afr. Earth Sci. 2019, 154, 49–58. [Google Scholar] [CrossRef]
  73. Dai, Z.H.; Feng, X.; Zhang, C.; Shang, L.; Qiu, G. Assessment of Mercury Erosion by Surface Water in Wanshan Mercury Mining Area. Environ. Res. 2013, 125, 2–11. [Google Scholar] [CrossRef]
Figure 1. Position, topography, and land use distribution within the Zaïda watershed.
Hydrology 11 00105 g001
Figure 2. Maps illustrating the factors used to calculate soil erosion in the Zaïda catchment area: (a) the R factor, (b) the LS factor, (c) the K factor, and (d) the C factor.
Hydrology 11 00105 g002aHydrology 11 00105 g002b
Figure 3. Statistical data on erosion based on land use in the Upper Moulouya Basin.
Hydrology 11 00105 g003
Figure 4. Spatial distribution of soil erosion in Zaida watershed.
Hydrology 11 00105 g004
Figure 5. Spatial distribution of the average annual Pb load in the Zaida watershed.
Hydrology 11 00105 g005
Figure 6. Spatial variation of Cd, Cu, Pb, and Zn contents in sediments of the Zaida watershed.
Hydrology 11 00105 g006
Figure 7. Geo-accumulation indexes for Cd, Cu, Pb, and Zn from various sediment samplings.
Hydrology 11 00105 g007
Figure 8. Altimetric profile of the Upper Moulouya River.
Hydrology 11 00105 g008
Figure 9. Graphical representation of variables projected on the F1–F2 plane.
Hydrology 11 00105 g009
Figure 10. The biplot correlation of variables and stations on the F1–F2 plane.
Hydrology 11 00105 g010
Table 1. Summary of the primary and secondary data used in this study.
Type of DataData VariablePeriod/FrequencyResolutionData SourceUsage in the Study
PrimaryTrace metal concentrations in sedimentOnce in March 202210 sampling stationsSampling campaign and laboratory analysis+ Sediment contamination assessment
+ Calculation of indices
+ Statistical analysis
SecondaryTrace metal concentrations in soilOnce in March 201551 sampling stationsThe study by [27]Estimating the trace metal flux originating from the watershed
SecondaryRainfallMonthly from 1997 to 20199 meteorological stationsMHBA 1
NMA 2
Calculating the rainfall erosion factor (R) for RUSLE
SecondaryASTER digital elevation model201430 m resolutionUSGS 3Calculating the topographical factor (LS) for RUSLE
SecondaryLandsat 8 satellite images201930 m resolutionUSGS 3
field surveys
Calculating the cover management factor (C) for RUSLE
SecondaryLand use map2019100
resolution
Copernicus programmeAssessing the land use and calculating the statistics
SecondarySoil texture2021250 m resolutionISRIC 4Calculating the erodibility factor (K) for RUSLE
1: Moulouya Hydraulic Basin Agency; 2: National Meteorological Agency; 3: United States Geological Survey website; 4: International Soil Reference and Information Centre website.
Table 2. Pearson correlation matrix of the RUSLE factors and annual soil erosion.
VariablesRLSKCSoil Erosion
R10.10−0.07−0.140.12
LS0.101−0.39−0.340.94
K−0.07−0.3910.36−0.25
C−0.14−0.340.361−0.14
Soil erosion0.120.94−0.25−0.141
Table 3. Statistical data on the concentration of four trace metals in the soil at the Zaida watershed.
VariableMean Min Max Median SD Ordinary Soils aWHO b
Pb89.81 0.36 830.95 17.82 162.87 9–5085
Zn47.60 0.13 206.00 49.97 45.76 10–10050
Cu14.93 0.11 77.2 8.98 20.04 2–2030
Cd0.99 0.03 3.00 0.4 1.01 0.05–0.450.8
a Cited by [56]; b World Health Organization (cited by [57]).
Table 4. Contamination factor (CF) and pollution load index (PLI) of different trace metals in sediment samples from the Upper Moulouya.
CF CdCF CuCF PbCF ZnPLI
MS11.280.621.120.840.93
MS21.580.711.631.081.19
MS32.290.747.791.472.10
MS41.350.493.021.041.20
MS50.830.433.530.961.05
MS60.830.373.630.610.91
MS70.830.495.871.081.27
AS 11.580.580.920.900.94
AS 22.110.781.140.961.16
Hakanson classificationCF < 1: low contamination;
1 ≤ CF < 3: moderate contamination;
3 ≤ CF < 6: considerable contamination;
CF ≥ 6: very high contamination.
Table 5. Pearson correlation matrix for physicochemical parameters, chemical elements, and trace metals.
VariablespHCaCO3%ECCdCuPbZnFeMnNaKMgAlCa
pH10.6600.0120.2990.004−0.2270.012−0.233−0.615−0.475−0.594−0.085−0.249−0.199
CaCO3%0.6601−0.0590.6320.542−0.1590.518−0.238−0.559−0.659−0.497−0.217−0.172−0.385
EC0.012−0.0591−0.089−0.3270.7310.403−0.047−0.1060.3770.2200.406−0.021−0.112
Cd0.2990.632−0.08910.9010.0250.601−0.712−0.771−0.801−0.828−0.718−0.690−0.834
Cu0.0040.542−0.3270.9011−0.1210.558−0.465−0.460−0.776−0.603−0.697−0.482−0.652
Pb−0.227−0.1590.7310.025−0.12110.622−0.133−0.2430.4490.2010.177−0.072−0.052
Zn0.0120.5180.4030.6010.5580.6221−0.296−0.497−0.281−0.192−0.205−0.334−0.462
Fe−0.233−0.238−0.047−0.712−0.465−0.133−0.29610.8130.4130.7800.5830.8510.900
Mn−0.615−0.559−0.106−0.771−0.460−0.243−0.4970.81310.5500.8590.5620.7580.734
Na−0.475−0.6590.377−0.801−0.7760.449−0.2810.4130.55010.8040.7330.6040.635
K−0.594−0.4970.220−0.828−0.6030.201−0.1920.7800.8590.80410.7670.8040.775
Mg−0.085−0.2170.406−0.718−0.6970.177−0.2050.5830.5620.7330.76710.7180.644
Al−0.249−0.172−0.021−0.690−0.482−0.072−0.3340.8510.7580.6040.8040.71810.887
Ca−0.199−0.385−0.112−0.834−0.652−0.052−0.4620.9000.7340.6350.7750.6440.8871
Disclaimer/Publisher’s Note: The statements, opinions and data contained in all publications are solely those of the individual author(s) and contributor(s) and not of MDPI and/or the editor(s). MDPI and/or the editor(s) disclaim responsibility for any injury to people or property resulting from any ideas, methods, instructions or products referred to in the content.

