Groundwater Characteristics’ Assessment for Productivity Planning in Al-Madinah Al-Munawarah Province, KSA
Abstract
1. Introduction
2. Site Description
3. Materials and Methodology
- Creating a list of the 113 currently drilled groundwater wells.
- Conducting measurements of groundwater depth in 113 wells from 2017 to 2022.
- Storing information from hydrological and drilling reports, such as screen and pump sizes and locations, in archives.
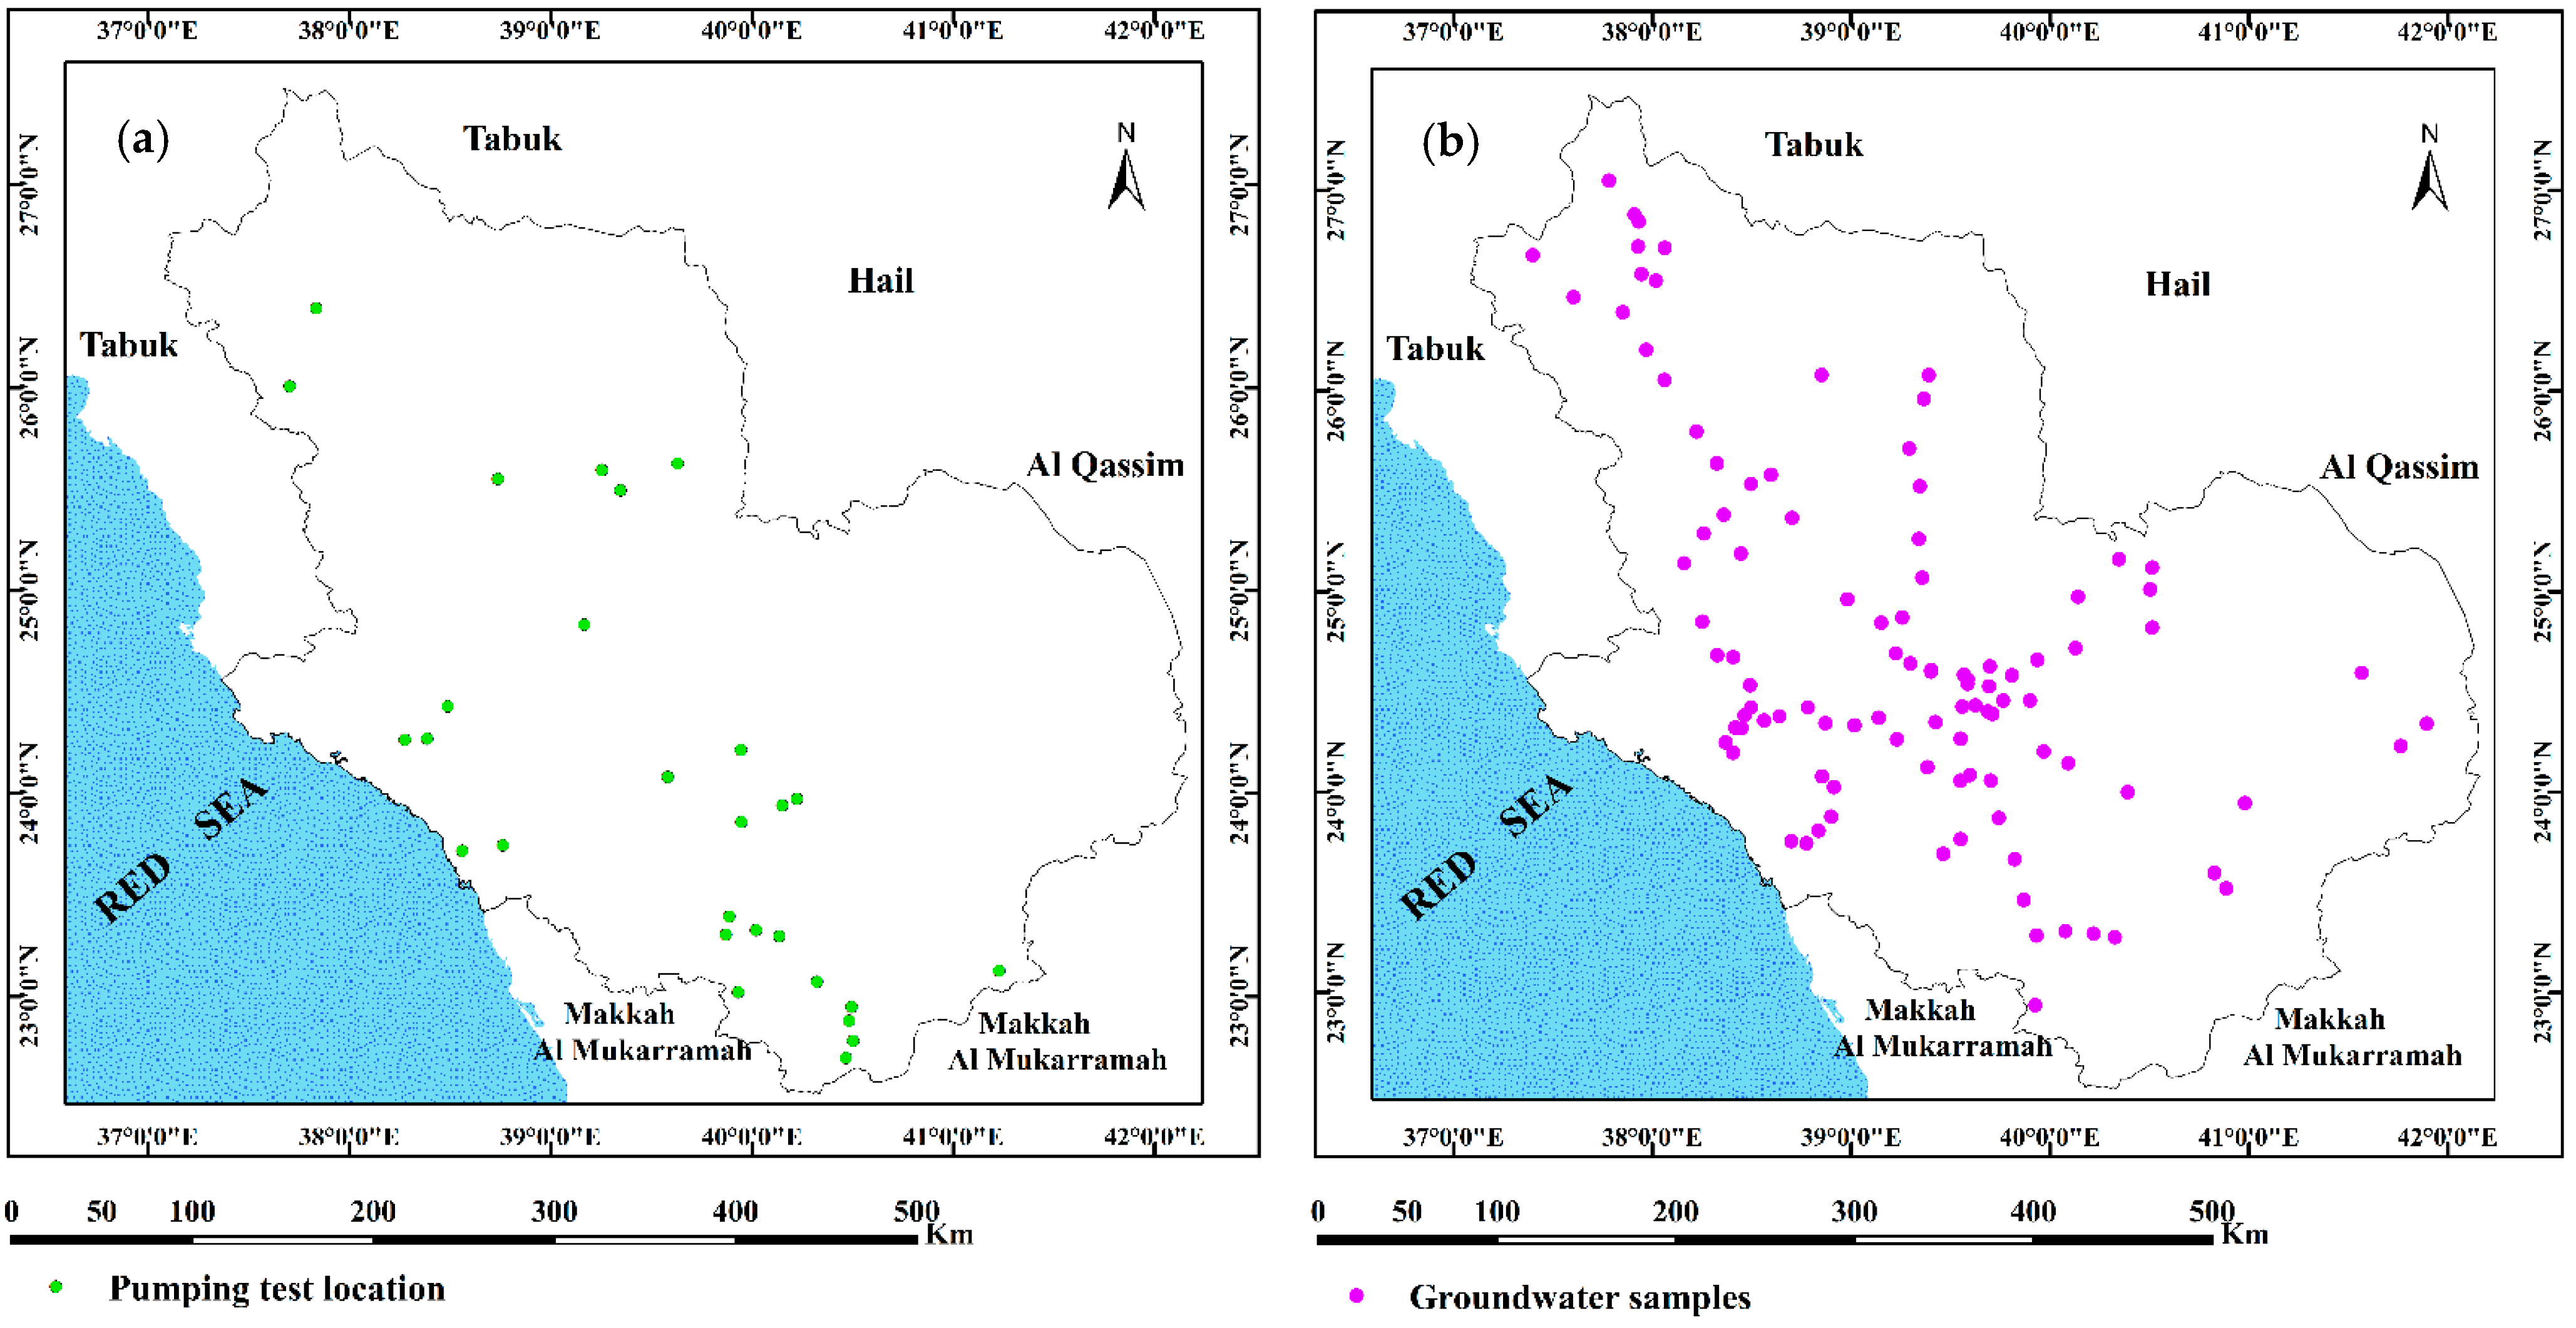
- Collecting 29 pumping tests data between step and long-duration tests by collaboration with the groundwater sectors and drilling companies in KSA (Figure 3a).
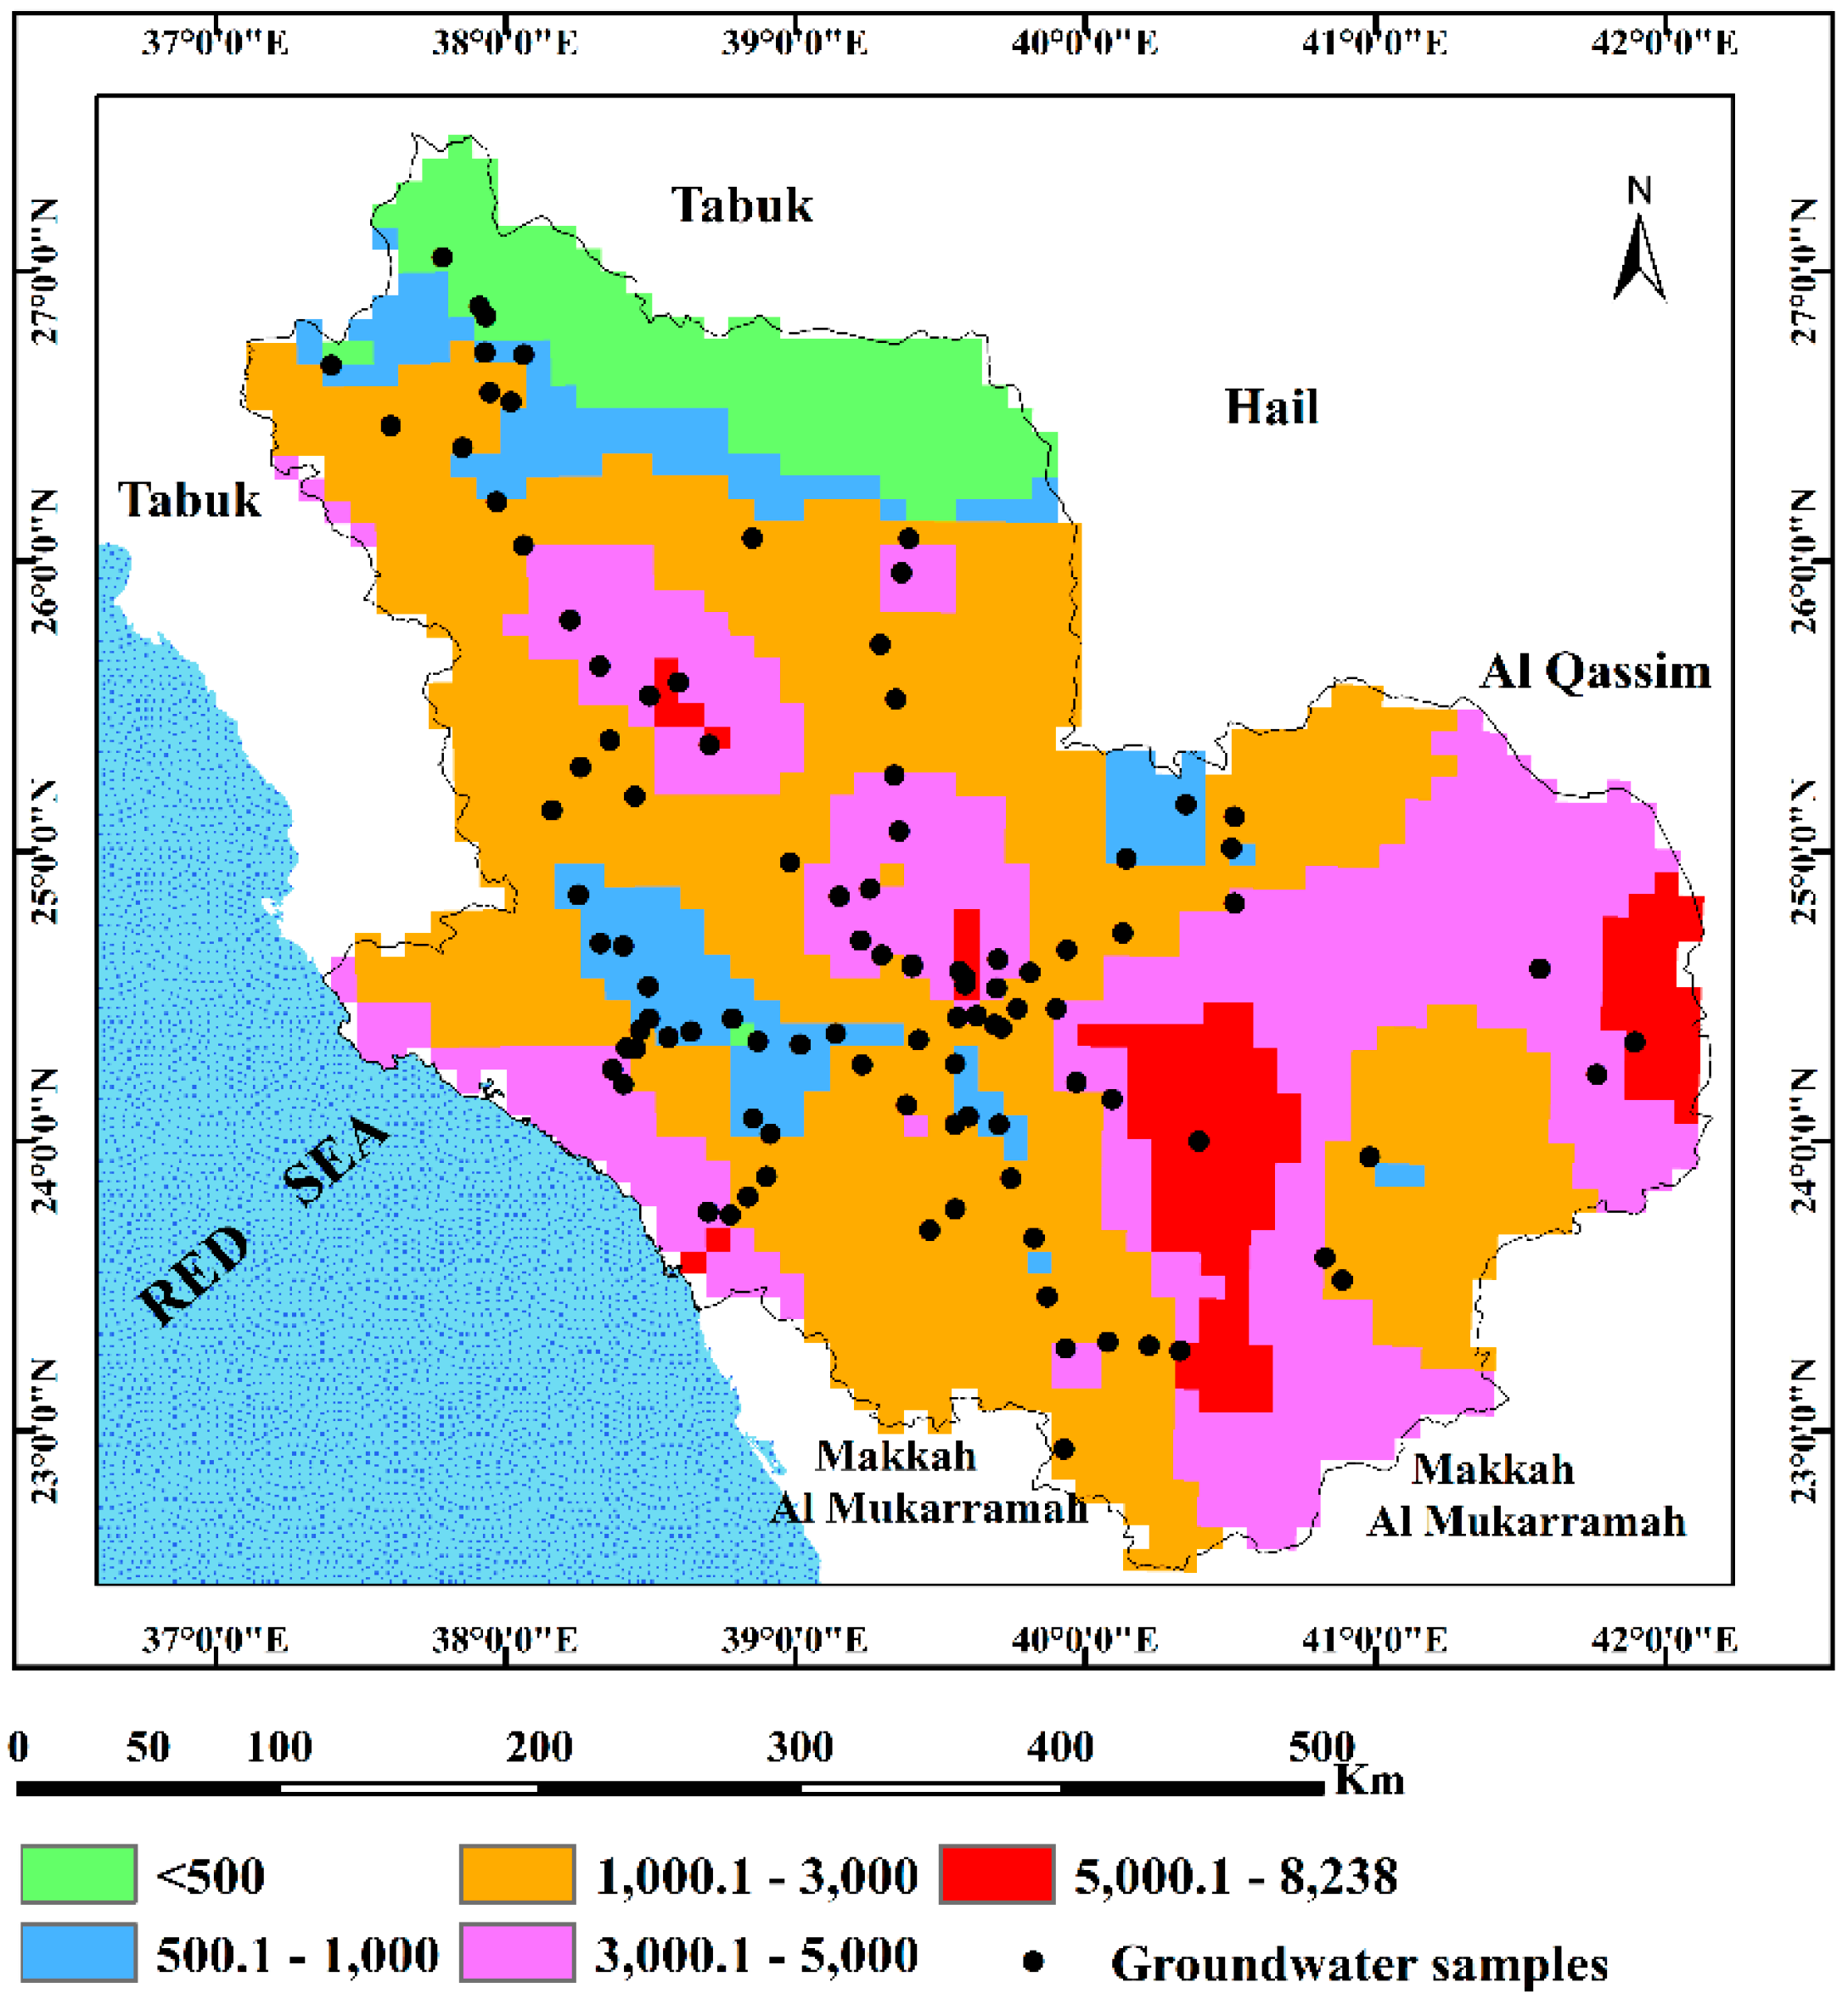
- Gathering 103 distinctive groundwater samples for chemical examination (Figure 3b).
- Performing field measurements of total dissolved solids (TDS), electrical conductivity (EC), pH, and temperature (T °C) with multi-parameter probes and devices.
- Conducting chemical analysis of 103 groundwater samples in an accredited laboratory using various methodologies. Major ions, minor and trace elements were obtained. Ion chromatography determined the concentrations of numerous parameters, whereas the amounts of CO3−2 and HCO3− were determined through titration; meanwhile, ICP-OES was utilized for the detection of trace and heavy elements. Equation (1) shows that the charge balance error (CBE) validates the analytical error of determined ion concentrations (meq/L−1) falling within a 5% range.
- The pumping tests data from 29 boreholes were analyzed using the AQUIFER TEST program to examine how withdrawals interact with flow and well behavior. Various hydraulic parameters such as well loss, formation loss, well efficiency (γ), transmissivity (T), hydraulic conductivity (K), and specific capacity (Sc) were calculated using different methods and equations by [19,20,21,22,23]:
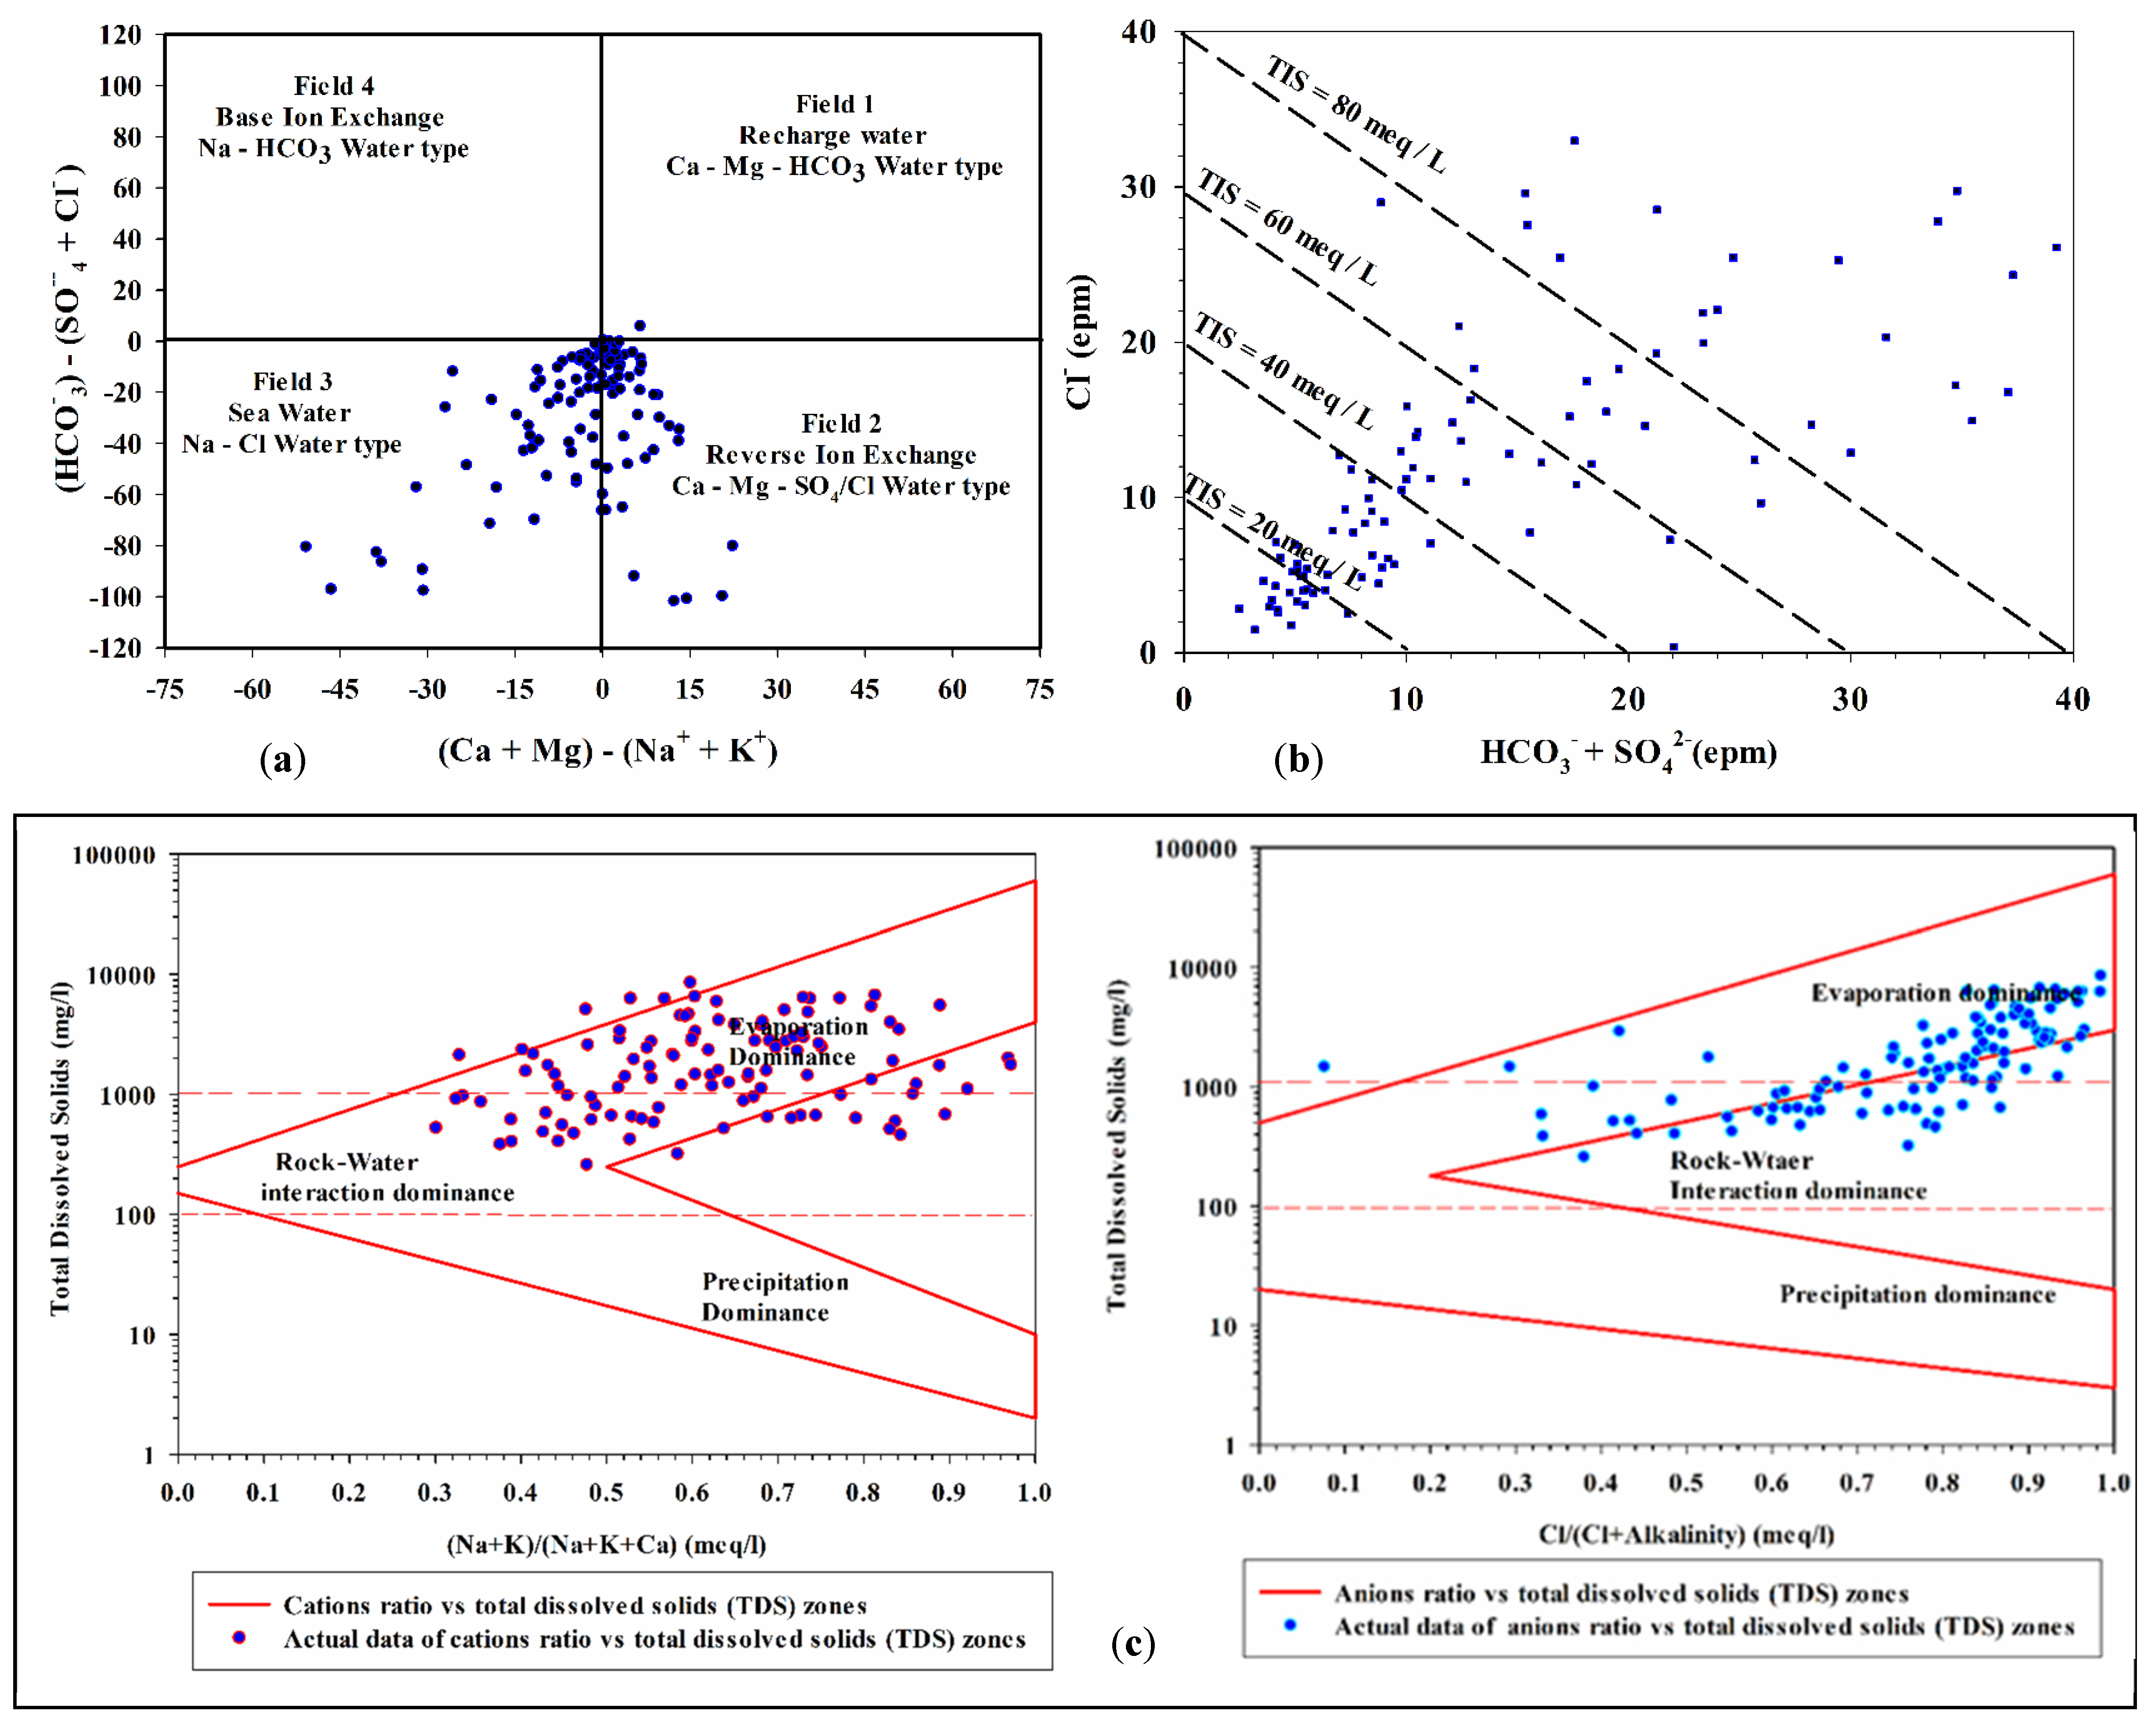
- In order to identify the chemical characteristics of groundwater and the primary mechanism influencing its chemistry, AquaChem (2014.2) software was utilized to create diagrams for Chadha, total ionic salinity (TIS), Gibbs, and US Salinity Laboratory Staff, as well as to evaluate hazards based on salinity and sodium adsorption ratio [24,25,26].
- Thematic maps are created using GIS (10.2) and Surfer (12), incorporating hydrogeological data such as water tables, salinity, and the aquifer resulted drawdown using the Kriging method. According to [27,28,29]., many types of interpolations have been applied to create these maps, and Kriging was the most suitable and matching method with the measured data.
4. Results and Discussion
4.1. Hydrogeological Characteristics
4.1.1. Groundwater Aquifer System
4.1.2. Groundwater Levels Distribution and Movement
4.1.3. Well Performance and Hydraulic Parameters
4.1.4. Resulted Drawdown Patterns and Aquifer System Potentiality
4.2. Descriptive Hydrochemistry of Groundwater
4.2.1. Assessment of the Physico-Chemical Parameters
4.2.2. Assessment of the Hydrogeo-Chemical Parameters
4.2.3. Hydrogeochemical Features and Regulating Mechanism
5. Conclusions
Author Contributions
Funding
Institutional Review Board Statement
Informed Consent Statement
Data Availability Statement
Conflicts of Interest
References
- FAO (Food and Agriculture Organization of the United Nations). The State of the World’s Land and Water Resources for Food and Agriculture: Systems at Breaking Point; Synthesis Report 2021; FAO: Rome, Italy, 2021. [Google Scholar] [CrossRef]
- WHO/UNICEF (World Health Organization/United Nations Children’s Fund). Progress on Household Drinking Water, Sanitation and Hygiene, 2000–2020: Five Years into the SDGs; WHO/UNICEF: Geneva, Switzerland, 2021; Available online: https://data.unicef.org/resources/progress-on-household-drinking-water-sanitation-and-hygiene-2000-2020 (accessed on 30 January 2024).
- El Osta, M.; Niyazi, B.; Masoud, M. Groundwater evolution and vulnerability in semi-arid regions using modeling and GIS tools for sustainable development: Case study of Wadi Fatimah, Saudi Arabia. Environ. Earth Sci. 2022, 81, 248. [Google Scholar] [CrossRef]
- Haq, M.A.; Jilani, A.K.; Prabu, P. Deep learning based modeling of groundwater storage change. Comput. Mater. Contin. 2022, 70, 4599–4617. [Google Scholar] [CrossRef]
- Guirado, E.; Tabik, S.; Alcaraz-Segura, D.; Cabello, J.; Herrera, F. Deep-learning versus OBIA for scattered shrub detection with google earth imagery: Ziziphus lotus as case study. Remote Sens. 2017, 9, 1220. [Google Scholar] [CrossRef]
- Lee, S.; Song, K.-Y.; Kim, Y.; Park, I. Regional groundwater productivity potential mapping using a geographic information system (GIS) based artificial neural network model. Hydrogeol. J. 2012, 20, 1511–1527. [Google Scholar] [CrossRef]
- Soupios, P.M.; Kouli, M.; Vallianatos, F.; Vafidis, A.; Stavroulakis, G. Estimation of aquifer hydraulic parameters from surficial geophysical methods: A case study of Keritis Basin in Chania (Crete—Greece). J. Hydrol. 2007, 338, 122–131. [Google Scholar] [CrossRef]
- Ahmed, S.; de Marsily, G. Comparison of geostatistical methods for estimating transmissivity-using data on transmissivity and specific capacity. Water Resour. Res. 1987, 23, 1717–1737. [Google Scholar] [CrossRef]
- Adiat, K.A.; Nawawi, M.N.; Abdullah, K. Application of multi-criteria decision analysis to geo electric and geologic parameters for spatial prediction of groundwater resources potential and aquifer evaluation. Pure Appl. Geophys. 2013, 170, 453–471. [Google Scholar] [CrossRef]
- El Osta, M.; Masoud, M.; Alqarawy, A.; Badran, O. Utilizing of aquifer hydraulic parameters to assess the groundwater sustainability in the new reclamation area of Moghra Oasis: Western Desert—Egypt. Appl. Water Sci. 2023, 13, 238. [Google Scholar] [CrossRef]
- Masoud, M.; El Osta, M.; Alqarawy, A.; Niyazi, B. Optimal management of the groundwater coastal aquifer based on the hydraulic characteristics in Wadi Al Marwani basin: KSA. Environ. Earth Sci. 2023, 82, 308. [Google Scholar] [CrossRef]
- Shinde, S.P.; Barai, V.N.; Al-Ansari, N.; Gavit, B.K.; Kadam, S.A.; Atre, A.A.; Bansod, R.D.; Elbeltagi, A. Characterization of basaltic rock aquifer parameters using hydraulic parameters, Theis’s method and aquifer test software in the hard rock area of Buchakewadi watershed Maharashtra, India. Appl. Water Sci. 2022, 12, 206. [Google Scholar] [CrossRef]
- Masoud, M. Groundwater Resources Management of the Shallow Groundwater Aquifer in the Desert Fringes of El Beheira Governorate, Egypt. Earth Syst. Environ. 2020, 4, 147–165. [Google Scholar] [CrossRef]
- El Osta, M.; Masoud, M.; Badran, O. Aquifer hydraulic parameters estimation based on hydrogeophysical methods in West Nile Delta, Egypt. Environ. Earth Sci. 2021, 80, 344. [Google Scholar] [CrossRef]
- Pellaton, C. Geologic Map of the Al Medinah Quadrangle, Sheet 24D, Ministry for Mineral Resources Geosciences Map GM-52, with Text. Saudi Arabia. 1981. Available online: https://pubs.usgs.gov/pp/0560a/plate-2_north.pdf (accessed on 21 May 2024).
- Moufti, M.R.H. The Geology of Harrat AI-Medinah Volcanic Field, Harrat Rabat, Saudi Arabia. Ph.D. Thesis, University of Lancaster, Lancaster, UK, 1985; p. 407, (Unpublished). [Google Scholar]
- Camp, V.E.; Roobol, M.J. Geologic Map of the Cenozoic Lava Field of Harrat Rahat, Kingdom of Saudi Arabia; Directorate General of Mineral Resources Geosciences map GM123 (with Text). 1991. Available online: https://www.mindat.org/reference.php?id=16086126 (accessed on 21 May 2024).
- Bayumi, T.H. Groundwater Resources of the Northern Part of Harrat Rahat Plateau, Saudi Arabia. Ph.D. Thesis, King Abdulaziz University, Jeddah, Saudi Arabia, 1992; p. 320, (Unpublished). [Google Scholar]
- Rorabaugh, M.J. Graphical and theoretical analysis of step drawdown test of artesian well. In Proceedings of the American Society of Civil Engineers; ASCE: Reston, VA, USA, 1953; Volume 79. [Google Scholar]
- Kruseman, G.P.; de Ridder, N.A. Analysis and Evaluation of Pumping Test Data, 2nd ed.; International Institute for Land Reclamation and Improvement: Wageningen, The Netherlands, 1990; 337p. [Google Scholar]
- Theis, C.V. The relation between the lowering of the Piezometric surface and the rate and duration of discharge of a well using ground-water storage. Trans. Am. Geophys. Union 1935, 16, 519–524. [Google Scholar] [CrossRef]
- Cooper, H.H., Jr.; Jacob, C.E. A generalized graphical method for evaluating formation constants and summarizing well-field history. Eos Trans. Am. Geophys. Union 1946, 27, 526–534. [Google Scholar] [CrossRef]
- Priebe, E.H.; Neville, C.J.; Rudolph, D.L. Enhancing the spatial coverage of a regional high-quality hydraulic conductivity dataset with estimates made from domestic water-well specific-capacity tests. Hydrogeol. J. 2017, 26, 395–405. [Google Scholar] [CrossRef]
- Chadha, D.K. A proposed new diagram for geochemical classification of natural waters and interpretation of chemical data. Hydrogeol. J. 1999, 7, 431–439. [Google Scholar] [CrossRef]
- Gibbs, R.J. Mechanisms controlling world water chemistry. Science 1970, 170, 1088–1090. [Google Scholar] [CrossRef]
- Richard, L.A. Diagnosis and Improvement of Saline and Alkali Soils; Agricultural Handbook No. 60; US Department of Agriculture: Washington, DC, USA, 1954; pp. 7–53. [Google Scholar] [CrossRef]
- Deutsch, C.V.; Journel, A.G. GSLIB Geostatistical Software Library and User’s Guide, 2nd ed.; Oxford University Press: New York, NY, USA, 1997; 375p. [Google Scholar]
- Thakur, J.K. Hydrogeological modeling for improving groundwater monitoring network and strategies. Appl. Water Sci. 2017, 7, 3223–3240. [Google Scholar] [CrossRef]
- Schiavo, M. Numerical impact of variable volumes of Monte Carlo simulations of heterogeneous conductivity fields in groundwater flow models. J. Hydrol. 2024, 634, 131072. [Google Scholar] [CrossRef]
- Al-Shaibani, A.; Lloyd, J.; Abokhodair, A.; Al-Ahmari, A. Hydrogeological and Quantitative Groundwater Assessment of the Basaltic Aquifer, Northern Harrat Rahat, Saudi Arabia. Arab. Gulf J. Sci. Res. 2007, 25, 39–49. [Google Scholar]
- Al-Omran, A.M.; Aly, A.A.; Sallam, A.S. A Holistic Ecosystem Approach for the Sustainable Development of Fragile Agro-Ecosystems: A Case Study of the Al-Kharj Ecosystem, Saudi Arabia. National Science, Technology and Innovation Plan, Kingdom of Saudi Arabia. 2019. Available online: http://rp.ksu.edu.sa/sites/rp (accessed on 2 February 2024).
- Metwaly, M.; Abdalla, F.; Taha, A.I. Hydrogeophysical Study of Sub-Basaltic Alluvial Aquifer in the Southern Part of Al-Madinah Al-Munawarah, Saudi Arabia. Sustainability 2021, 13, 9841. [Google Scholar] [CrossRef]
- Italconsult. Detailed Investigations of the Medinah Region; Final Report, Thematic Report No.7; Ministry of Agriculture and Water: Riyadh, Saudi Arabia, 1979. [Google Scholar]
- Risser, D.W. Factors Affecting Specific-Capacity Tests and Their Application—A Study of Six Low-Yielding Wells in Fractured-Bedrock Aquifers in Pennsylvania: U.S. Geological Survey Scientific Investigations Report 2010-5212. 2010; 44p. Available online: https://pubs.usgs.gov/sir/2010/5212/ (accessed on 21 May 2024).
- Şen, Z. Applied Hydrogeology for Scientists and Engineers; Lewis Publishers, CRC Press, Inco: Boca Raton, FL, USA, 1995; 310p. [Google Scholar]
- Abdel Mogith, S.M.; Ibrahim, S.M.; Hafiez, R.A. Groundwater potentials and characteristics of el-moghra aquifer in the vicinity of qattara depression. Egypt. J. Desert Res. 2013, 62–63, 1–20. [Google Scholar] [CrossRef]
- Gheorghe, A. Processing and Synthesis of Hydrogeological Data; Abacus Press: London, UK, 1979; 390p. [Google Scholar]
- Sattar, G.S.; Keramat, M.; Shahid, S. Deciphering transmissivity and hydraulic conductivity of the aquifer by vertical electrical sounding (VES) experiments in Northwest Bangladesh. Appl. Water Sci. 2013, 6, 35–45. [Google Scholar] [CrossRef]
- World Health Organization. Guidelines for Drinking-Water Quality, 4th ed.; Incorporating the first Addendum: Geneva, Switzerland, 2017. [Google Scholar]
- Wagh, V.M.; Panaskar, D.B.; Jacobs, J.A.; Mukate, S.V.; Muley, A.A.; Kadam, A.K. Influence of hydro-geochemical processes on groundwater quality through geostatistical techniques in Kadava River basin, Western India. Arab. J. Geosci. 2019, 12, 7. [Google Scholar] [CrossRef]
- Freeze, R.; Cherry, J.A. Groundwater; Prentice-Hall, Inc.: Upper Saddle River, NJ, USA, 1979. [Google Scholar]
- El Maghraby, M.M.S.; Abu El Nasr, A.K.O.; Hamouda, M.S.A. Quality assessment of groundwater at south Al Madinah Al Munawarah area, Saudi Arabia. Environ. Earth Sci. 2013, 70, 1525–1538. [Google Scholar] [CrossRef]
- El Osta, M.; Masoud, M.; Alqarawy, A.; Elsayed, S.; Gad, M. Groundwater Suitability for Drinking and Irrigation Using Water Quality Indices and Multivariate Modeling in Makkah Al-Mukarramah Province, Saudi Arabia. Water 2022, 14, 483. [Google Scholar] [CrossRef]
- Zhou, Y.; Li, P.; Xue, L.; Dong, Z.; Li, D. Solute geochemistry and groundwater quality for drinking and irrigation purposes: A case study in Xinle City, North China. Geochemistry 2020, 80, 125609. [Google Scholar] [CrossRef]
- Hem, J.D.; Cropper, W.H. Survey of Ferrous-Ferric Chemical Equilibria and Redox Potentials; U.S. Geological Survey Water-Supply, U.S. G.P.O., Paper 1459-A. 1959; 31p. Available online: https://pubs.usgs.gov/publication/wsp1459A (accessed on 21 May 2024).
- Alqarawy, A. Characterization of groundwater in Quaternary aquifer of the Yanbu Al-Nakhl Basin, Al-Madinah Al-Munawarah Province using pumping tests and hydrochemical techniques. Arab. J. Chem. 2023, 16, 105327. [Google Scholar] [CrossRef]
- Masoud, M.; El Osta, M.; Alqarawy, A.; Elsayed, S.; Gad, M. Evaluation of groundwater quality for agricultural under different conditions using water quality indices, partial least squares regression models, and GIS approaches. Appl. Water Sci. 2022, 12, 244. [Google Scholar] [CrossRef]
- Niyazi, B. Groundwater assessment for sustainable development in the Wadi Al-Hamd Basin, Al-Madinah Al-Munawarah, KSA. J. Afr. Earth Sci. 2024, 215, 105289. [Google Scholar] [CrossRef]
- Li, J.; Yang, G.; Zhu, D.; Xie, H.; Zhao, Y.; Fan, L.; Zou, S. Hydrogeochemistry of karst groundwater for the environmental and health risk assessment: The case of the suburban area of Chongqing (Southwest China). Geochemistry 2022, 82, 125866. [Google Scholar] [CrossRef]

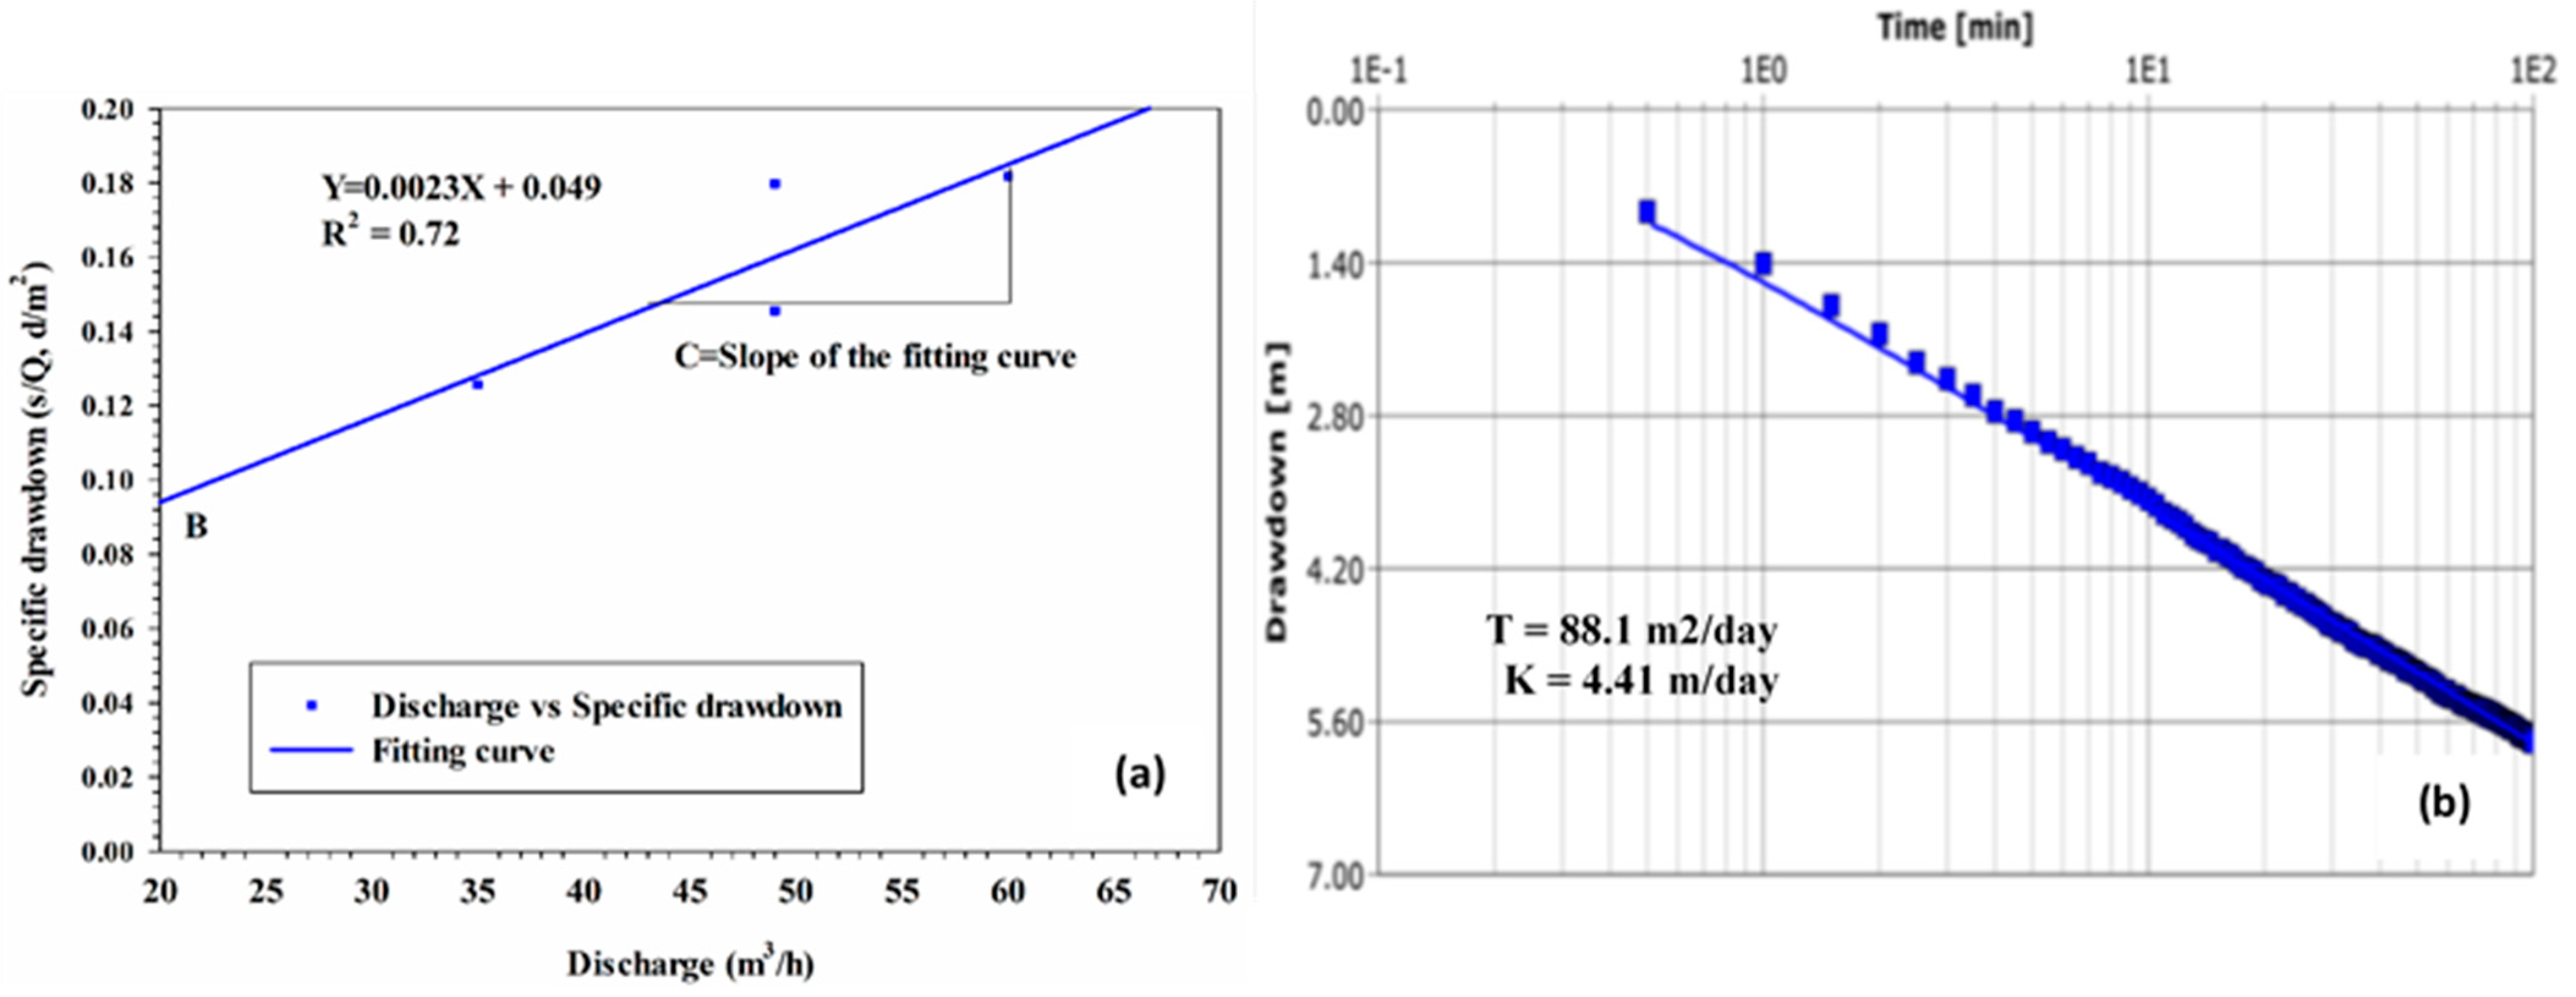
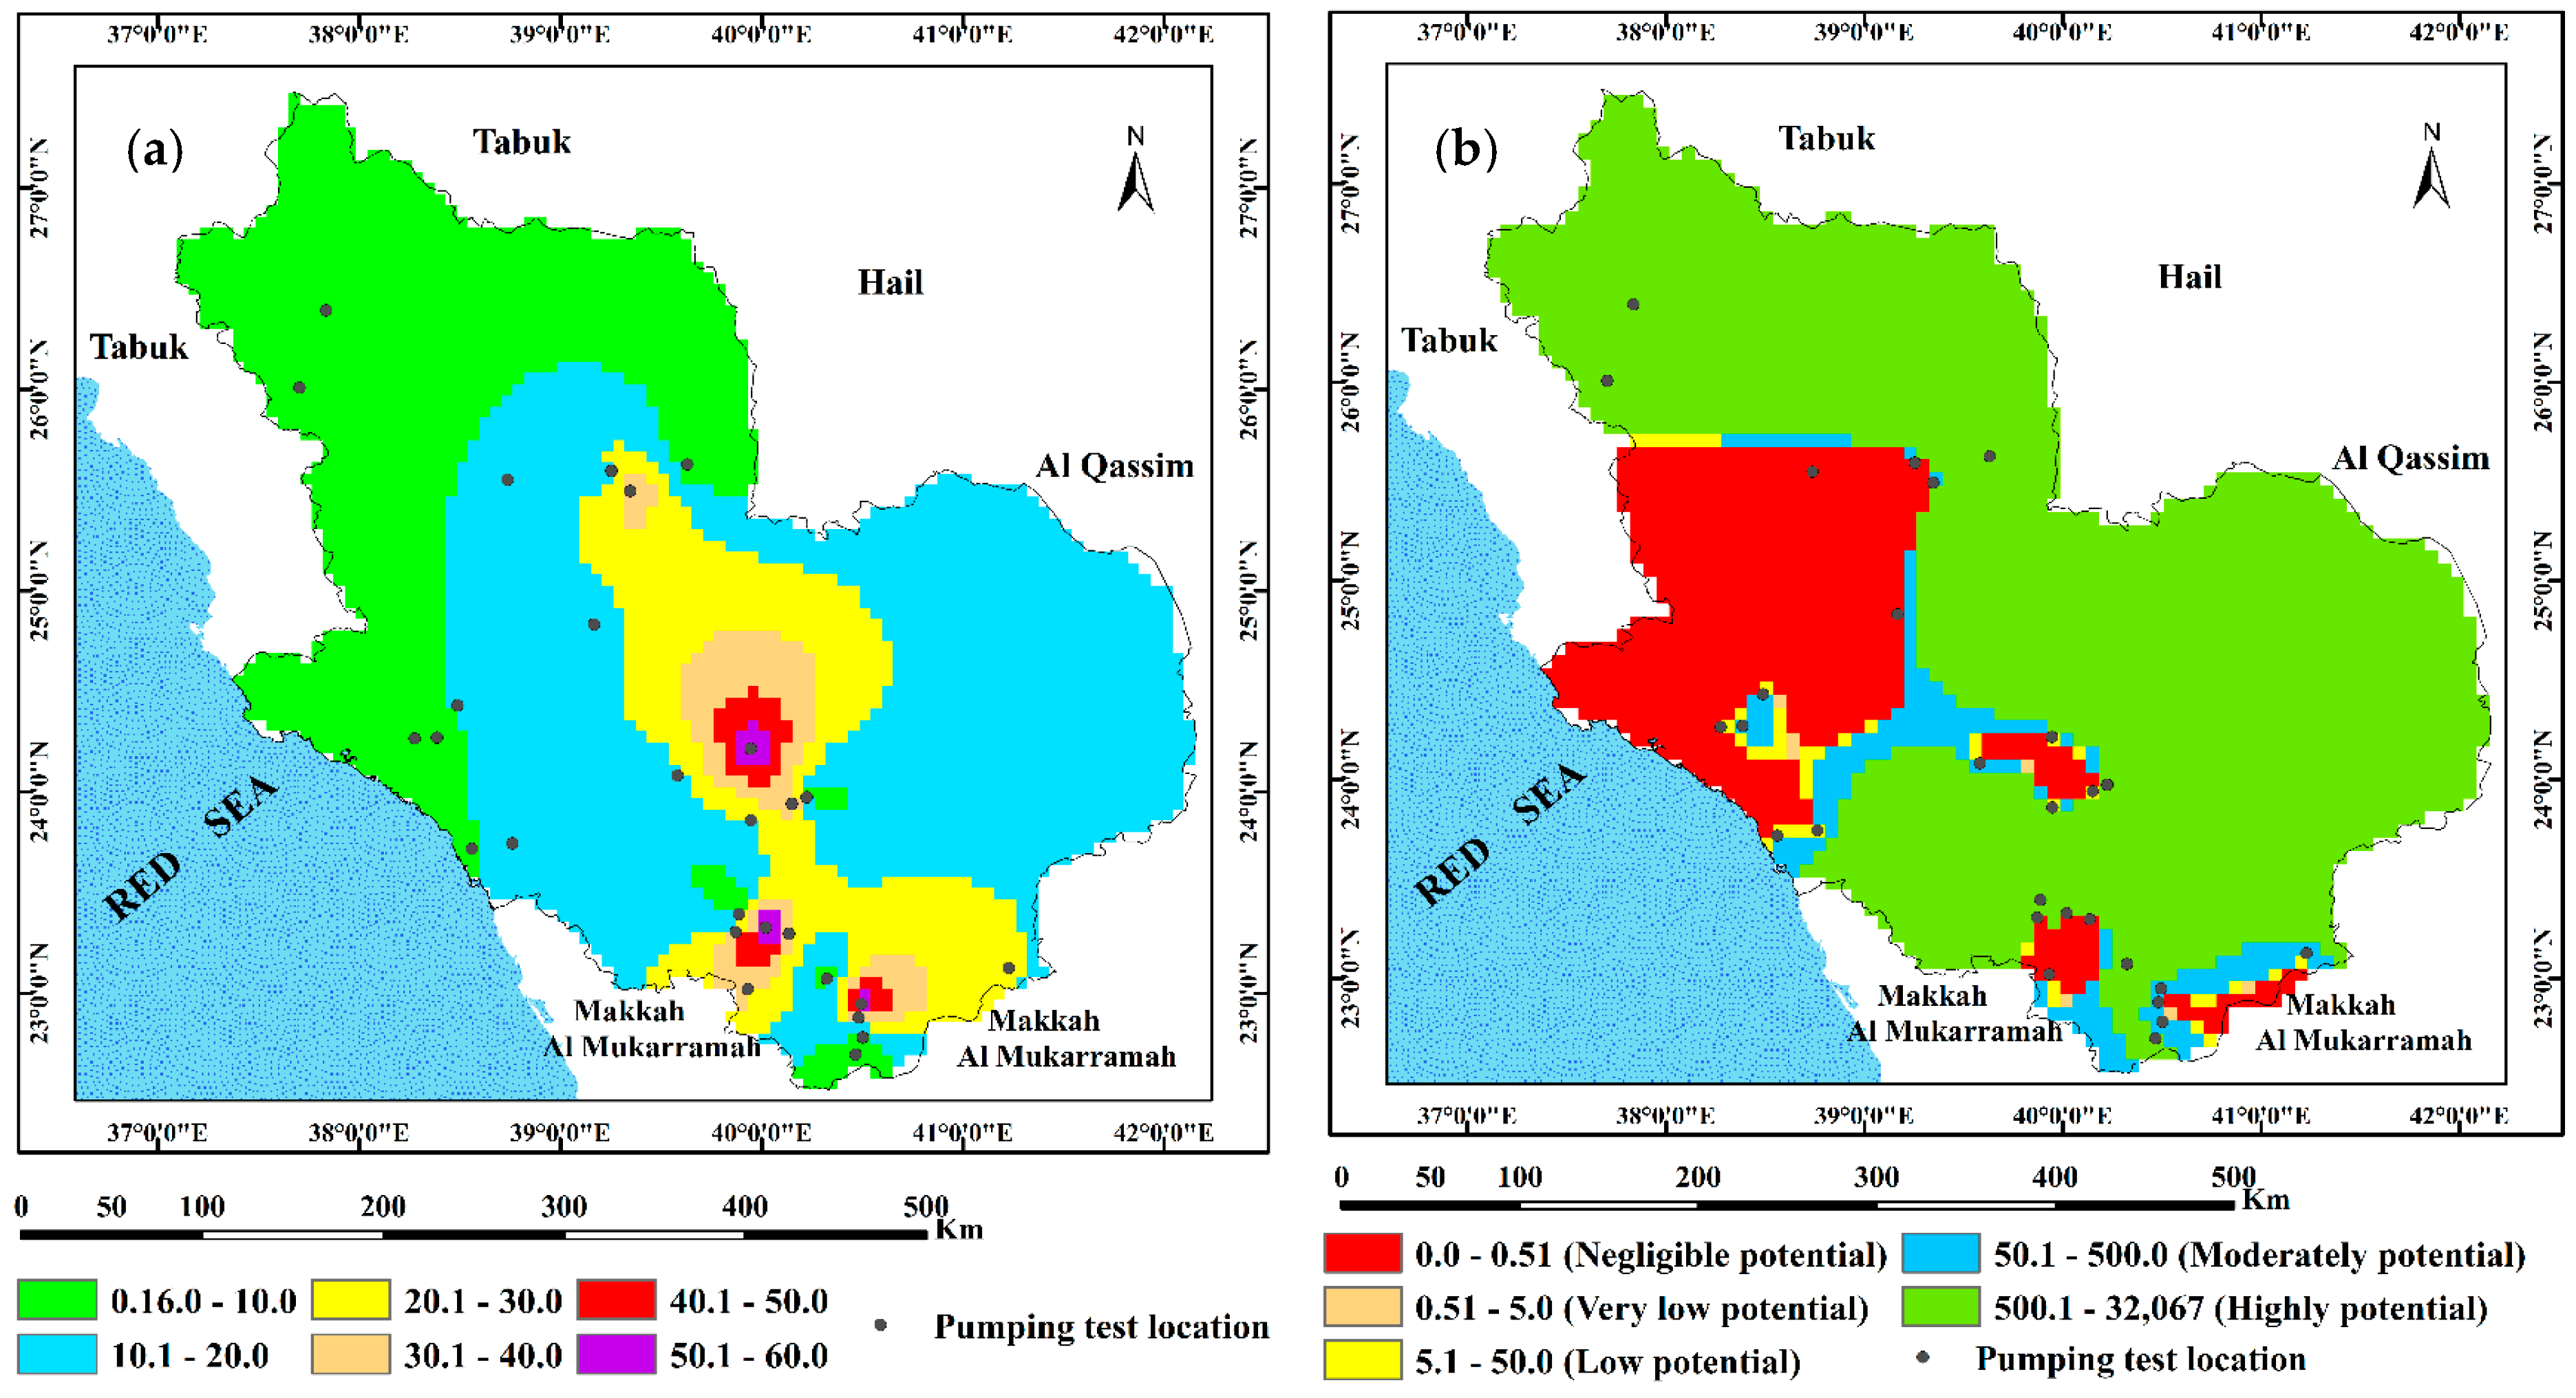


| (a) | ||||||||||
|---|---|---|---|---|---|---|---|---|---|---|
| Well No. | Step Pumping Test Analysis | |||||||||
| Step No. | Draw-Down S (m) | Discharge Q (m3/h) | Formation Loss Coef. B (h/m2) | Well Loss Coef. C (h2/m5) | Formation Loss (BQ) | Well Loss (CQ2) | Well Efficiency (γ) % | Average of (γ) % | Specific Capacity Sc (m2/h) | |
| 1 | 1 | 4.4 | 35.00 | 0.049 | 0.0023 | 1.72 | 2.82 | 38.98 | 31.71 | 6.47 |
| 2 | 7.13 | 49.00 | 0.049 | 0.0023 | 2.40 | 5.52 | 33.67 | |||
| 3 | 8.81 | 49.00 | 0.049 | 0.0023 | 2.40 | 5.52 | 27.25 | |||
| 4 | 10.91 | 60.00 | 0.049 | 0.0023 | 2.94 | 8.28 | 26.95 | |||
| 3 | 1 | 16.41 | 47.38 | 0.27 | 0.002 | 12.79 | 4.49 | 77.96 | 70.97 | 2.63 |
| 2 | 20.97 | 55.76 | 0.27 | 0.002 | 15.06 | 6.22 | 71.79 | |||
| 3 | 27.32 | 68.22 | 0.27 | 0.002 | 18.42 | 9.31 | 67.42 | |||
| 4 | 31.74 | 78.44 | 0.27 | 0.002 | 21.18 | 12.31 | 66.73 | |||
| 8 | 1 | 17.28 | 31.54 | 0.0119 | 0.0003 | 0.38 | 0.30 | 35.41 | 52.30 | 37.48 |
| 2 | 25.44 | 41.94 | 0.0119 | 0.0003 | 0.50 | 0.53 | 47.08 | |||
| 3 | 32.88 | 49.86 | 0.0119 | 0.0003 | 0.59 | 0.75 | 55.97 | |||
| 4 | 50.16 | 63.00 | 0.0119 | 0.0003 | 0.75 | 1.19 | 70.73 | |||
| 14 | 1 | 16.41 | 47.376 | 0.30 | 0.0019 | 14.21 | 4.49 | 86.61 | 78.86 | 2.63 |
| 2 | 20.97 | 55.764 | 0.30 | 0.0019 | 16.72 | 6.22 | 79.78 | |||
| 3 | 27.32 | 68.22 | 0.30 | 0.0019 | 20.47 | 9.31 | 74.91 | |||
| 4 | 31.74 | 78.444 | 0.30 | 0.0019 | 23.53 | 12.31 | 74.14 | |||
| 16 | 1 | 3.95 | 17.39 | 0.18 | 0.0027 | 3.13 | 0.82 | 79.25 | 75.00 | 4.17 |
| 2 | 5.60 | 23.22 | 0.18 | 0.0027 | 4.17 | 1.45 | 74.53 | |||
| 3 | 6.78 | 26.82 | 0.18 | 0.0027 | 4.82 | 1.94 | 71.11 | |||
| 17 | 1 | 0.57 | 42.876 | 0.01 | 0.0000 | 0.56 | 0.08 | 97.79 | 77.12 | 59.33 |
| 2 | 1.6 | 95.328 | 0.013 | 0.000043 | 1.24 | 0.39 | 77.45 | |||
| 3 | 2.12 | 99.72 | 0.013 | 0.000043 | 1.30 | 0.43 | 61.15 | |||
| 4 | 2.77 | 153.648 | 0.01 | 0.000043 | 2.00 | 1.02 | 72.11 | |||
| 21 | 1 | 1.2 | 24.012 | 0.02 | 0.0023 | 0.48 | 1.33 | 40.02 | 27.60 | 13.79 |
| 2 | 2.33 | 32.004 | 0.02 | 0.0023 | 0.64 | 2.36 | 27.47 | |||
| 3 | 3.43 | 38.988 | 0.02 | 0.0023 | 0.78 | 3.50 | 22.73 | |||
| 4 | 4.58 | 46.008 | 0.02 | 0.0023 | 0.92 | 4.87 | 20.09 | |||
| 22 | 1 | 0.98 | 24.98 | 0.0219 | 0.0007 | 0.55 | 0.44 | 55.83 | 51.13 | 23.35 |
| 2 | 1.29 | 29.99 | 0.0219 | 0.0007 | 0.66 | 0.63 | 50.91 | |||
| 3 | 1.69 | 36.00 | 0.0219 | 0.0007 | 0.79 | 0.91 | 46.65 | |||
| 23 | 1 | 1.05 | 60.012 | 0.0106 | 0.0001 | 0.01 | 0.0001 | 60.60 | 49.50 | 46.66 |
| 2 | 2.06 | 96.984 | 0.0106 | 0.0001 | 0.01 | 0.0001 | 49.90 | |||
| 3 | 2.63 | 119.592 | 0.0106 | 0.0001 | 0.01 | 0.0001 | 48.20 | |||
| 4 | 3.82 | 141.012 | 0.0106 | 0.0001 | 0.01 | 0.0001 | 39.13 | |||
| (b) | ||||||||||
| Well No. | Long-Duration Pumping Test Analysis | Aquifer Potentiality Based on T Values Gheorghe Classification [34] | ||||||||
| Discharge (Q) (m3/Day) | Resulted Drawdown (m) | Transmissivity T (m2/Day) | Hydraulic Cond. K (m/Day) | |||||||
| 1 | 1071.40 | 8.77 | 88.20 | 4.41 | Moderate potential | |||||
| 2 | 38.02 | 18.00 | 0.0198 | 0.08 | Negligible potential | |||||
| 3 | 36.30 | 12.00 | 105.40 | 9.30 | Moderate potential | |||||
| 4 | 26.00 | 3.44 | 0.30 | 0.25 | Negligible potential | |||||
| 5 | 52.70 | 6.43 | 95.40 | 8.30 | Moderate potential | |||||
| 6 | 570.30 | 16.00 | 3.60 | 0.14 | Very low potential | |||||
| 7 | 155.50 | 15.00 | 2.30 | 0.76 | Very low potential | |||||
| 8 | 1486.10 | 2.20 | 1330.00 | 32.10 | High potential | |||||
| 9 | 162.40 | 56.40 | 5.83 | 0.044 | Low potential | |||||
| 10 | 228.10 | 38.90 | 7.07 | 0.063 | Low potential | |||||
| 11 | 3652.10 | 2.03 | 1123.2 | 19.01 | High potential | |||||
| 12 | 174.50 | 33.40 | 7.14 | 0.0533 | Low potential | |||||
| 13 | 1007.40 | 27.20 | 6.48 | 0.051 | Low potential | |||||
| 14 | 3326.40 | 38.50 | 45.10 | 0.29 | Low potential | |||||
| 15 | 95.00 | 20.33 | 7.48 | 0.044 | Low potential | |||||
| 16 | 1512.00 | 29.90 | 45.10 | 0.29 | Low potential | |||||
| 17 | 1002.20 | 26.60 | 50.10 | 0.53 | Moderate potential | |||||
| 18 | 648.00 | 7.70 | 112.30 | 0.69 | Moderate potential | |||||
| 19 | 3378.30 | 3.20 | 1244.20 | 6.13 | High potential | |||||
| 20 | 3628.80 | 0.85 | 33,696.00 | 302.4 | High potential | |||||
| 21 | 1710.70 | 0.70 | 32,832.00 | 216.0 | High potential | |||||
| 22 | 1047.20 | 40.50 | 26.50 | 0.34 | Low potential | |||||
| 23 | 1105.90 | 4.30 | 915.80 | 18.66 | High potential | |||||
| 24 | 864.00 | 1.80 | 2505.60 | 23.33 | High potential | |||||
| 25 | 3404.20 | 4.20 | 2160.00 | 38.88 | High potential | |||||
| 26 | 155.50 | 69.90 | 5.70 | 0.042 | Low potential | |||||
| 27 | 3888.00 | 4.95 | 145.20 | 1.56 | Moderate potential | |||||
| 28 | 1451.50 | 58.14 | 178.00 | 1.89 | Moderate potential | |||||
| 29 | 561.60 | 20.70 | 32.74 | 0.23 | Low potential | |||||
| Parameter | Unit | Minimum | Maximum | Average | WHO Standard for Drinking [39] |
|---|---|---|---|---|---|
| pH | - | 6.64 | 8.50 | 7.61 | 6.50–8.50 |
| EC | µS/cm | 582 | 14,050 | 3631 | 1000 |
| TDS | mg/L | 261 | 8628 | 2236 | 500 |
| Na+ | mg/L | 41.90 | 1754.58 | 464.63 | 200 |
| Ca2+ | mg/L | 16.08 | 854.01 | 216.29 | 75.0 |
| Mg2+ | mg/L | 1.99 | 550.64 | 71.52 | 35.0 |
| K+ | mg/L | 6.39 | 75.60 | 11.55 | 12.00 |
| CO32− | mg/L | 3.00 | 51.00 | 15.2 | 100.00 |
| HCO3− | mg/L | 48.80 | 1256.60 | 185.18 | 120.00 |
| Cl− | mg/L | 13.42 | 3186.35 | 579.20 | 250.00 |
| SO42− | mg/l | 35.05 | 3143.55 | 789.07 | 250.00 |
| NO3− | mg/L | 0.07 | 359.47 | 65.08 | 45.00 |
| PO43− | mg/L | 0.01 | 5.16 | 0.37 | 6.00 |
| I− | mg/L | 0.011 | 1.27 | 0.076 | 0.001–0.07 |
| Br− | mg/L | 0.06 | 5.82 | 0.68 | Less than 1.0 |
| F− | mg/L | 0.02 | 3.90 | 0.61 | Less than 1.0 |
| SiO2 | mg/L | 5.45 | 130.22 | 26.08 | 5.00–25.00 |
| TH | mg CaCO3/L | 81.64 | 4395.00 | 833.76 | 500.00 |
| ALK. | mg/L | 44.99 | 1029.78 | 170.30 | 30.00–400.00 |
| SAR | meq/L | 1.337 | 30.09 | 7.075 | 10.00–26.00 |
| Category | TDS (mg/L) | Groundwater Samples |
|---|---|---|
| Fresh | <1000 | 35 samples (34%) |
| Brackish | 1000–10,000 | 68 samples (66%) |
| Saline | 10,000–100,000 | - |
| Brine | 100,000 | - |
Disclaimer/Publisher’s Note: The statements, opinions and data contained in all publications are solely those of the individual author(s) and contributor(s) and not of MDPI and/or the editor(s). MDPI and/or the editor(s) disclaim responsibility for any injury to people or property resulting from any ideas, methods, instructions or products referred to in the content. |
© 2024 by the authors. Licensee MDPI, Basel, Switzerland. This article is an open access article distributed under the terms and conditions of the Creative Commons Attribution (CC BY) license (https://creativecommons.org/licenses/by/4.0/).
Share and Cite
Masoud, M.; El Osta, M.; Al-Amri, N.; Niyazi, B.; Alqarawy, A.; Rashed, M. Groundwater Characteristics’ Assessment for Productivity Planning in Al-Madinah Al-Munawarah Province, KSA. Hydrology 2024, 11, 99. https://doi.org/10.3390/hydrology11070099
Masoud M, El Osta M, Al-Amri N, Niyazi B, Alqarawy A, Rashed M. Groundwater Characteristics’ Assessment for Productivity Planning in Al-Madinah Al-Munawarah Province, KSA. Hydrology. 2024; 11(7):99. https://doi.org/10.3390/hydrology11070099
Chicago/Turabian StyleMasoud, Milad, Maged El Osta, Nassir Al-Amri, Burhan Niyazi, Abdulaziz Alqarawy, and Mohamed Rashed. 2024. "Groundwater Characteristics’ Assessment for Productivity Planning in Al-Madinah Al-Munawarah Province, KSA" Hydrology 11, no. 7: 99. https://doi.org/10.3390/hydrology11070099
APA StyleMasoud, M., El Osta, M., Al-Amri, N., Niyazi, B., Alqarawy, A., & Rashed, M. (2024). Groundwater Characteristics’ Assessment for Productivity Planning in Al-Madinah Al-Munawarah Province, KSA. Hydrology, 11(7), 99. https://doi.org/10.3390/hydrology11070099


