Article

Assessing Groundwater Connection/Disconnection to Waterholes Along the Balonne River and in the Barwon–Darling River System in Queensland and New South Wales, Australia, for Waterhole Persistence

by
Harald Hofmann
1,2,* and
Jonathan Marshall
3,4
1
School of the Environment, The University of Queensland, Brisbane, QLD 4072, Australia
2
Commonwealth Scientific and Industrial Research Organisation, Brisbane, QLD 4102, Australia
3
Department of the Environment, Tourism, Science and Innovation, Brisbane, QLD 4102, Australia
4
Australian Rivers Institute, Griffith University, Brisbane, QLD 4111, Australia
*
Author to whom correspondence should be addressed.
Hydrology 2025, 12(1), 15; https://doi.org/10.3390/hydrology12010015
Submission received: 20 December 2024 / Revised: 10 January 2025 / Accepted: 11 January 2025 / Published: 14 January 2025

Abstract

:
Waterholes in semi-arid environment are sections of rivers that fill during high river flows or floods and keep water once flow ceases. They are essential water sources for rive ecosystems. Some waterholes remain even during prolonged droughts. The resilience of ecosystems in these environments depends on the persistence of the waterholes. While most semi-arid, ephemeral river systems are disconnected from regional groundwater and losing in most parts there may be some sections that can be connected to localised groundwater or parafluvial areas. To assess the persistence of waterholes the groundwater contribution to the water balance needs to be addressed. This study assesses groundwater connectivity to waterholes in a part of the Murray-Darling Basin, one of the largest watersheds in the world, using environmental tracers radon and stable isotopes. Approximately 100 samples were collected from 27 waterholes along the Narran, Calgoa, Barwon and Darling rivers, as well as 8 groundwater bore samples. The assessment of groundwater connectivity or the lack of is necessary from water balance modelling and estimation of persistence of these waterholes. As expected, the results indicate consistently low radon concentrations in the waterholes and very small deviation in stable isotopes δ 18 O and δ 2 H. In general, most of these waterholes are losing water to groundwater, indicated by low salinity (EC values) and low radon concentrations. While radon concentrations are small in most cases and indicative of little groundwater contributions, some variability can be assigned to bank return and parafluvial flow. It indicates that these contributions may have implications for waterhole persistence in ephemeral streams. The study demonstrates that in some cases local bank return flow or parafluvial flow may contribute to waterhole persistence.

1. Introduction

Ephemeral rivers and streams are common landscape features in arid and semi-arid environments across the globe. Approximately half of the global streams and rivers are ephemeral or non-perennial, which means that flow ceases for certain periods throughout the year, resulting in highly variable and transient storage in these systems [1,2,3,4]. Hence, there is a fine balance in sediment and nutrient transport and recycling as well as water storage across the hydrological compartments in these systems [5]. They consist of the stream channel, the banks, the floodplains and regional aquifers. The latter are of minor importance as groundwater levels are often below the riverbed in arid and semi-arid environments, and therefore, the stream is rather losing water to the regional groundwater than gaining. Local exceptions may occur where, for example, regional artesian aquifers out- or subcrop the riverbed or when flow along faults contribute to the stream discharge [6]. Most of the water storage in ephemeral streams is therefore concentrated in the channel itself, the river banks and the floodplain providing a temporal storage [7]. This is subsequently returned to the stream when river levels decline [8]. Waterholes on the other hand retain residual stream water after flow has ceased, building up series of pools along the stream network [9]. In arid and semi-arid environments, these waterholes are arguably one of the most important water sources as they provide water for riparian vegetation, native fauna as well as being refugia for aquatic ecosystems. Furthermore, they have significant economic and social value for the local population and are culturally important for indigenous populations [10].
The rivers of Australia are among the world’s most seasonal, many having more than 80% of their total annual streamflow during the peak flow periods [9]. During prolonged drought periods, rivers dry into a series of waterholes which are an important resource for agriculture, town water supplies, industry and other human consumptive uses. Similarly to other semi-arid locations globally, they also serve an important ecological function by providing refuge habitat for aquatic organisms during prolonged periods without surface flow. It is for these reasons that waterholes have been identified as important environmental assets in a number of locations, including the northern Murray–Darling Basin [11].
A key indicator for waterholes and their ability to serve as ecosystem refugia is their persistence time [12]. The persistence time is the duration waterholes retain water in the absence of flow [13]. It is a function of how much water is held as flow stops, the time since flow stopped, hydrological processes, such as water loss and gain through rainfall, groundwater inputs, seepage loss and evaporation and the morphology of the channel, especially the depth [12]. Quantifying these processes allows determining how long waterholes can persist through hydrological modelling. Anthropogenic activities and water resource development have altered the arid landscape hydrological systems and changed the frequency and magnitude of flow events through weirs and locks, thus impacting how often waterholes are formed and re-filled. Impacts from climate change are another factor altering the hydrology of the systems. As evaporation is one of the largest loss terms, increased evaporation will most likely lead to faster declines of waterholes in the future [10]. A large unknown in waterhole persistence is their connection to groundwater. Many ephemeral streams are losing streams but may be gaining in some parts of the stream network through processes described above [9]. Most importantly bank return flow and fresh water lenses within the floodplains have the potential to contribute to the water budget of waterholes [7,14].
An accurate understanding of groundwater contributions to the riverine water balance are especially necessary within dryland regions, where surface water resources may diminish during low flow to poorly connected (or disconnected) waterholes [15,16]. These are essentially enlarged channel segments capable of holding larger volumes of water; however, their persistence (and therefore vulnerability) during dry periods may greatly vary as a function of size, shading and potential groundwater connectivity [17]. A critical question is therefore the degree to which groundwater interacts with these waterholes, and the mechanisms by which this occurs. Cendon et al. (2010) [18] suggested that some interaction of waterholes with freshwater lenses and riparian groundwater is physically plausible; however, the absence of groundwater bores to determine local or regional groundwater gradients make it difficult to determine the degree of interaction between the waterhole and groundwater. Studies in dryland river systems in Australia have shown a wide variety of potential interactions with groundwater, from strongly losing to gaining conditions from perched aquifer systems [19], losing but connected [18], and even to gaining conditions [20]. These factors are little studied for waterholes.
While hydraulic gradients between riparian groundwater and the surface water body are good indications for exchange, geochemical tracers, such a major ions or isotopic tracers are excellent tools to determine groundwater contributions to streams. The different geochemical tracers have potential advantages and disadvantages, for example, major ion concentrations and stable isotope ratios are relatively easy to measure and are often measured as part of general water quality studies; hence, databases with time series measurements may exist for some regions [21]. The principle of these methods is that there are distinctly different concentrations of a tracer in the groundwater and the surface water which can be used to determine mass fluxes from one to the other. Physico-chemical processes in the waterhole, such as evaporation, mineral precipitation, or biogeochemical processes may also alter the water chemistry, which need to be assessed and corrections need to be applied. However, providing that groundwater and surface water have distinct geochemical concentrations, changes in concentration of that component in the river may be used to define the distribution of gaining and losing river reaches and to quantify groundwater inflows in gaining reaches [22,23].
Radon (222Rn), which is part of the Uranium (238U) to Lead (206Pb) decay series, is commonly used for quantifying groundwater inflows to rivers. Radon has a half-life of 3.8 days and the activities in groundwater reach secular equilibrium with its parent isotope radium (226Ra) over a few weeks [24]. As the concentration of radium in minerals is several orders of magnitude higher than dissolved radium concentrations in surface water, groundwater radon activities are commonly two or three orders of magnitude higher than those of surface water [23,24,25,26]. This makes radon a potentially useful tracer in catchments where groundwater and surface water have similar major ion concentrations or stable isotope ratios, which is often the case with regards to riparian groundwater or freshwater lenses as a potential source [27]. Due to the fact that radon activities reach secular equilibrium with the matrix radium within a few week, radon concentrations are generally high in even relatively recently recharged groundwater, whereas rainfall has very small radon activities.
Radon has been used as a tracer for surface water/groundwater interactions for decades but studies in arid and semi-arid environments are scarce. Cartwright et al. (2014) [28], for example, demonstrated sections of groundwater return flow to the Murray River in Victoria using radon. Bourke et al. (2014) [29] demonstrated the use of radon to assess parafluvial flow in ephemeral streams in Western Australia. Gilfedder et al. (2019) [30] showed on an example from the Avon River in Victoria, Australia, and a modelling approach the usefulness of radon as a mean residence time estimator for bank return flow. Zhou and Cartwright (2021) [31] demonstrated the use of radon to estimate baseflow fluxes to an intermittent stream in Victoria, Australia.
While radon is an important tracer for this purpose, radon concentrations alone are insufficient to separate different groundwater reservoirs. The distinction between groundwater from more regional aquifers compared to return flow from bank storage or shorter-term localised perched aquifer systems around the stream is important to determine in terms of long-term flow sustainability. The radon concentrations in the reservoirs are only dependant on the amount of uranium/thorium containing minerals or radium and the emanation rate and not on the residence time of the water once secular equilibrium is reached. Therefore, radon concentrations in riverbanks, perched aquifer systems, freshwater lenses or regional groundwater will be indistinguishable if radium concentrations in the host material are also the same.
Combining radon with other geochemical tracers such as major ions or stable isotopes, may allow the groundwater contributions from relatively short-term reservoirs (e.g., bank storage) and regional groundwater to be distinguished. Chloride concentrations for example often increase due to mixing with more evaporation enriched soil waters and significant increases can only be achieved over thousands of years. Hence, short or medium term reservoirs should only have small concentrations of chloride in the absence of mixing compared to some older, regional groundwater.
Here, we investigate the potential interaction of the surface water in waterholes with groundwater, in particular the potential role that groundwater discharge may play in waterhole persistence during low flow conditions within the Culgoa, the Narran and the Barwon-Darling rivers. This study will improve our understanding of groundwater interactions within waterholes across the Lower-Balonne and Barwon-Darling and inform modelling the water balances of these waterholes.

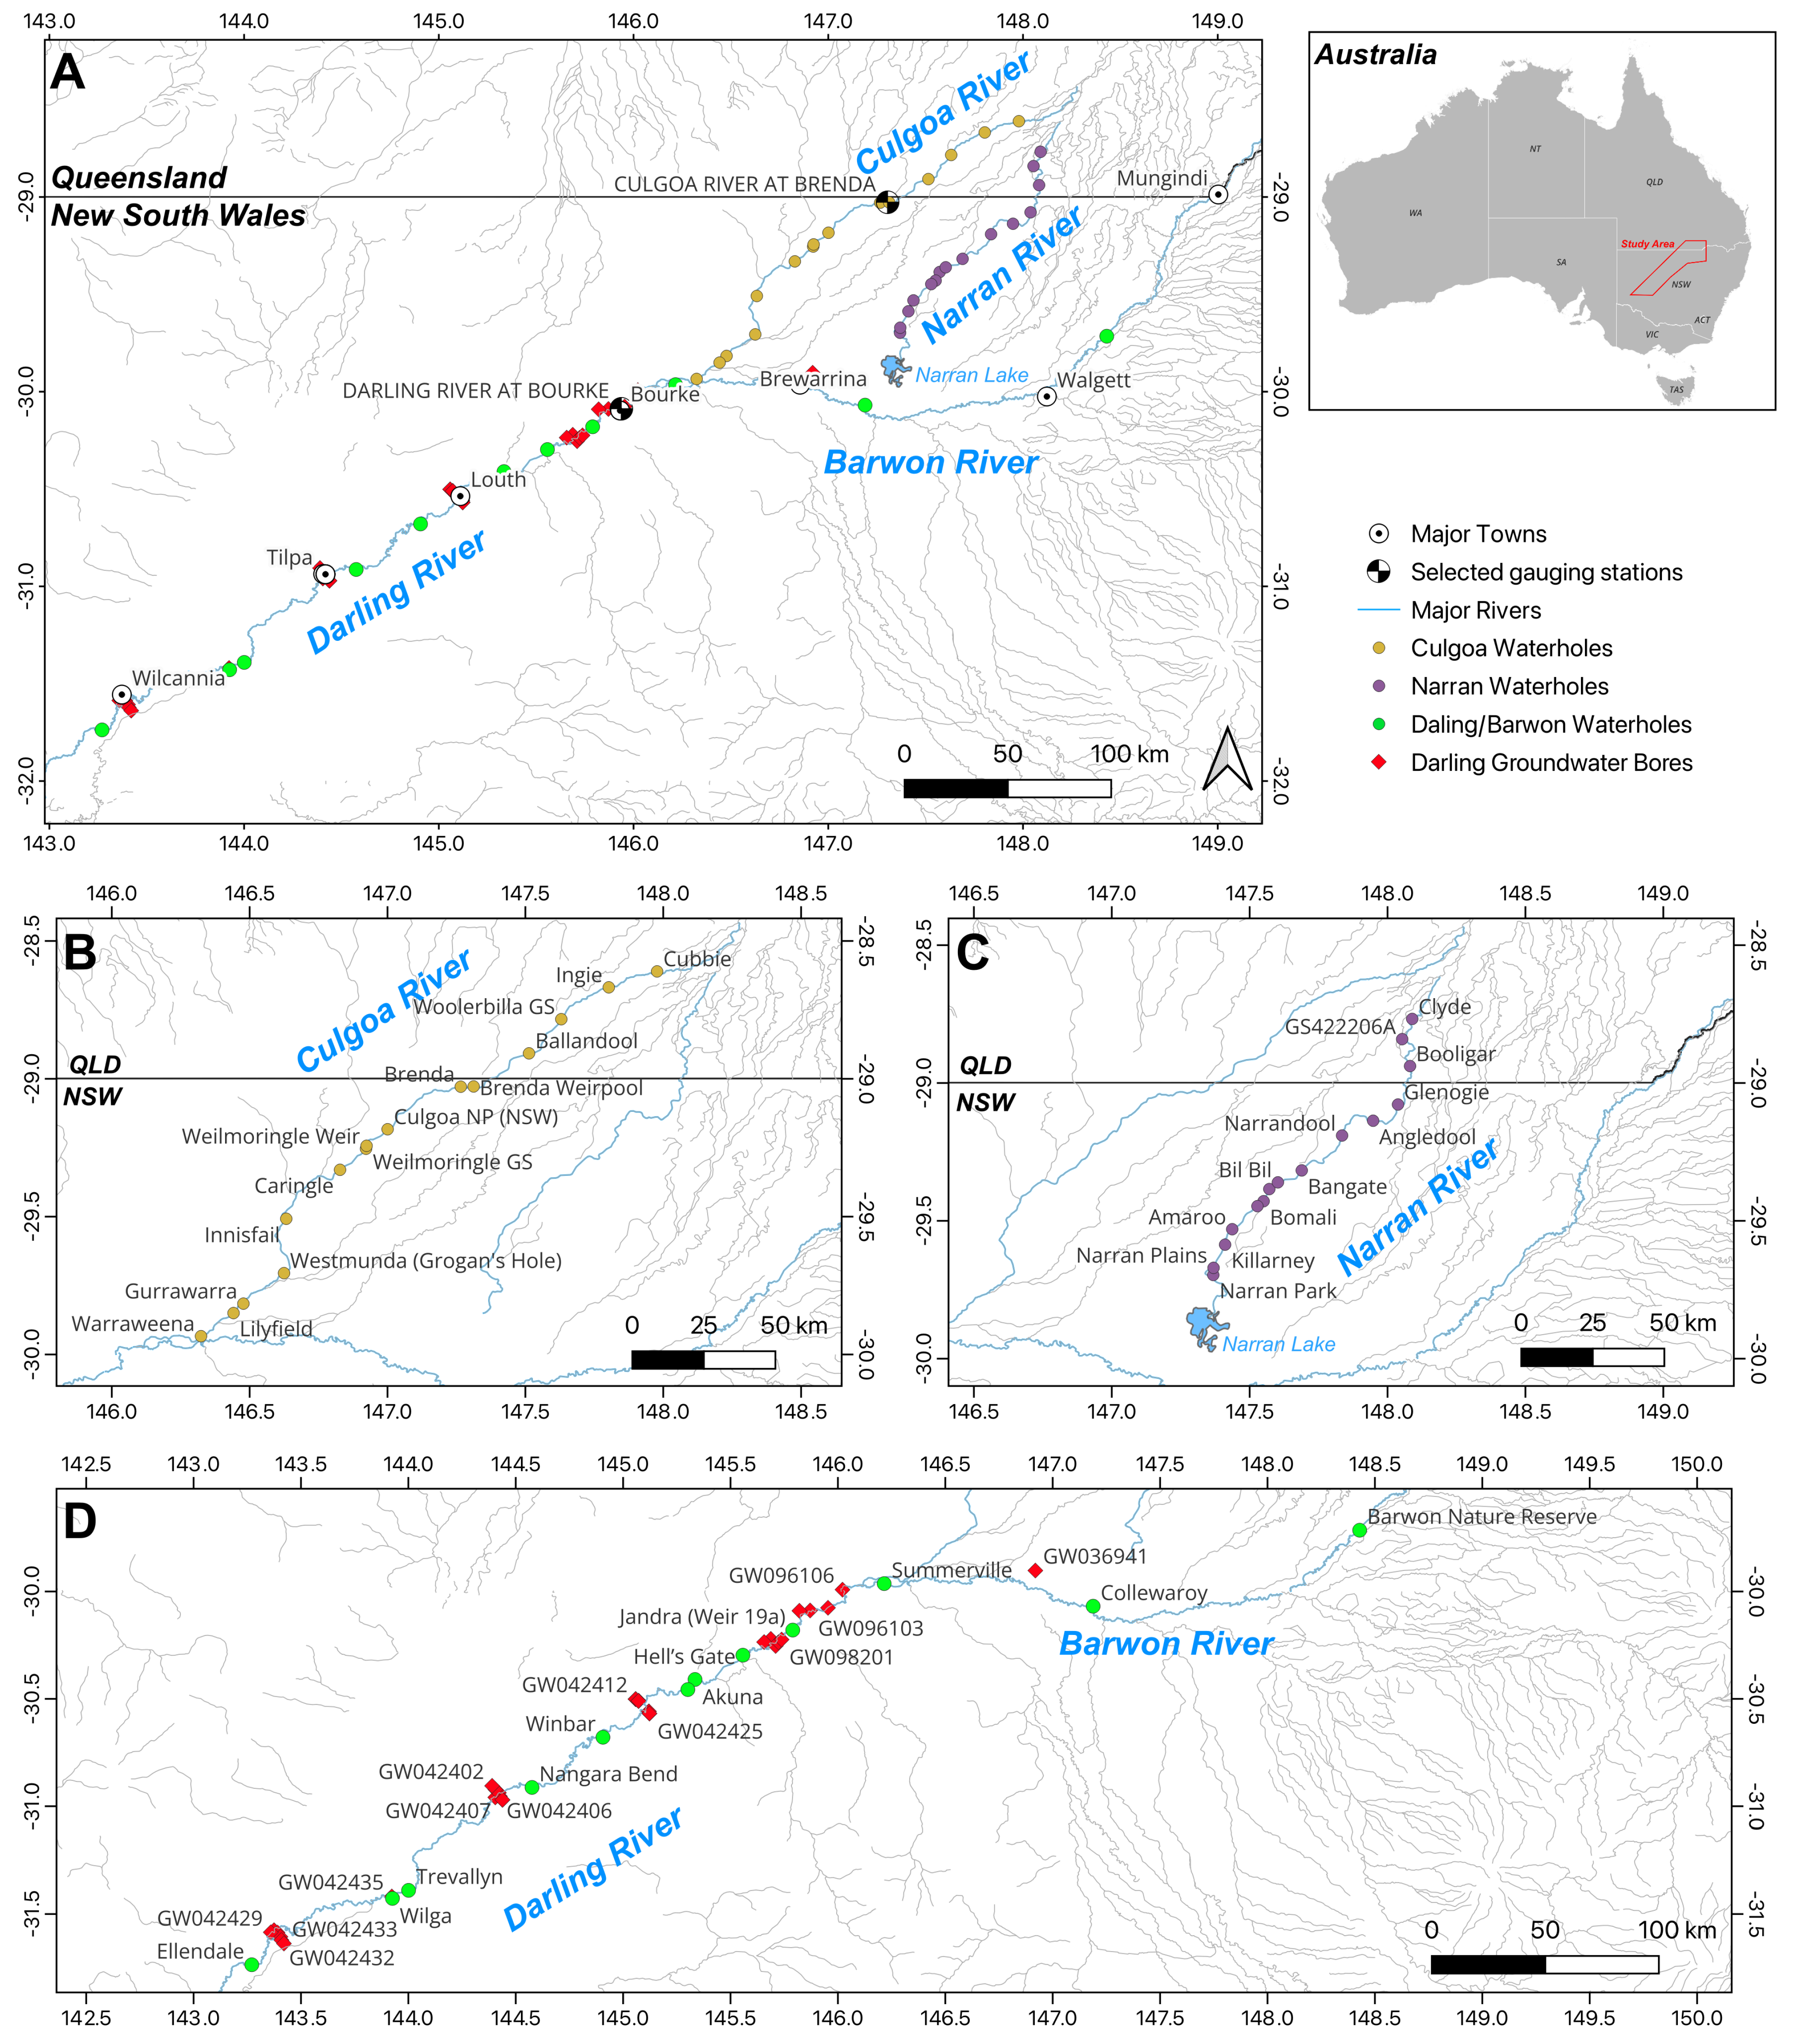
1.1. Geographical and Geological Background

The Narran, the Culgoa, the Barwon and the Darling river are part of the greater Barwon-Darling River system, located in the central northern part of the Murray-Darling River Basin in the border region between Queensland and New South Wales, Australia (Figure 1). The Narran and the Culgoa rivers have their headwaters in the Condamine-Balonne River catchments in Queensland and drain to the west. The Darling River is a confluent of most importantly the Barwon River and many smaller tributaries in the eastern and northern part of the Barwon-Darling River system at Brewarrina and also drains to the west.
The river systems are mostly ephemeral, especially in their upper reaches. They dry up during increased periods of low or no flow and result in a series of waterholes during times of drought [13]. The Lower Balonne floodplain system includes the channels, waterholes and floodplains of the Balonne, Culgoa, Birrie, Bokhara and Narran rivers to the confluence with the Barwon River in New South Wales (Figure 1). The floodplain systems have been identified as essential environmental asset [5,32]. The river/floodplain systems have series of in-channel waterholes, which provide important ecosystem services as habitats and act as refugia during drought [13]. Episodical in-channel flow events fill the waterholes, providing enough water to sustain aquatic biota during prolonged no-flow periods. These waterholes are also important resources of water for local agriculture, town water supplies and other industries in the region [33].
The rivers in the area are incised in larger floodplains comprised of Tertiary and Quaternary riverbed sediments. These sediments are underlain by a variety of Palaeozoic and Mesozoic bedrock formations from the New England Orogen, the Lachlan Orogen and the Gunnedah Basin [34]. The bedrock consists of consolidated, partly metamorphosed and fractured marine sand, silt and clay stones and volcanic and igneous intrusions. The Tertiary and Quaternary sediments provide the main aquifer systems in contact with the river systems. The aquifers in the western part of the study area along the Darling River comprise the Cubbaroo Formation (Miociene), the Gunnedah Formation (Pliocene) and the Narrabri Formation (Quaternary). All formations are terrestrial deposits of fluvio-lacustrine origin consisting of well sorted, quartzose and lithic sand and fine gravels, interbedded with predominantly yellow to brown clays [35].
A semi-arid climate dominates the river catchments with long-term average annual rainfall of ∼355 mm/year at Bourke, ∼399 mm/year at Cobar and ∼305 mm/year at Louth [36]. Long-term average rainfall in Bourke indicates generally higher rainfall in the summer months from November to April, which is in line with the general wet season patterns in southeast Queensland and northern New South Wales. Temperatures are also highest during these month and average temperatures range from 18 °C in July to 37 °C in January. The mean annual evaporation of ∼2400 mm/year, determined at Cobar, greatly exceeds rainfall for the area.
The area has a low topographic gradient (100/600,000 m) and the rivers developed large meander bends with flood plains more than 12 km wide. The rivers are deeply incised in the flat landscape with approximate bank heights of 6–8 m on the Narran and the Culgoa rivers and more than 10 m in parts of the Darling River [34]. The rivers are highly episodic with large flow increases during the main runoff events and cessation of flow during dry seasons, especially in the Narran and the Culgoa, when waterholes develop. This results in a highly variable flow regime, with significant implications for the way surface and groundwater interacts, as well as ecosystem dependance and adaptation. The Narran River ends in a series of terminal lakes, the Narran Lake (Figure 1A,B) and has an approximate length of 299 km. The Culgoa merges has a length of 489 km and merges with the Darling east of Bourke. The Bowen–Darling River system has a total length of more than 700 km and only the eastern and middle sections were investigated here.

1.2. Waterhole Selection and Extent

The waterholes were selected based on spatial distribution, a mix of natural waterholes and those resulting from weirs (Table 1). Access to waterholes was also an important consideration as well as choosing waterholes that had information from previous studies, e.g., Woods et al. (2012) [37]. Many waterholes have been made artificially deeper by installing weirs, locks and rock walls, which can have heights of up to two metres. Many weirs were installed almost a century ago and have, over time, become a significant part of ecosystem resilience in the region [13].
The size of the waterholes is variable across the river systems but generally increases downstream. Waterholes in the headwater catchments of the Narran and Culgoa rivers are generally smaller than those along the Darling River. The size of the waterholes was assessed by remote sensing in a separate study and details of the methodology can be found in DSITI (2015) [13], Danaher & Collett (2006) [38] and de Vries et al. (2007) [39]. In brief, surface water was identified on Landsat images for the period between 1988–2015 by using a modification of the Landsat-based Water Index threshold. This was combined with hydrological discharge data for gauging stations along the river systems to allow determining a maximum waterhole extent after 30 days of no flow. Waterholes along the Culgoa River range in size from approximately 0.2 km2 to 1.6 km2. Those along the Narran River range from 0.4 to approximately 3.1 km2. In comparison, the waterholes along the Barwon-Darling range in size from 1.4 to 10.8 km2. Maximum waterhole depth is also variable and ranges from 1.45 to 2.97 m for the Culgoa River and 1.29 to 3.05 m for the Narran River. Waterhole sizes and depths were not determined for the waterholes in the Darling River.

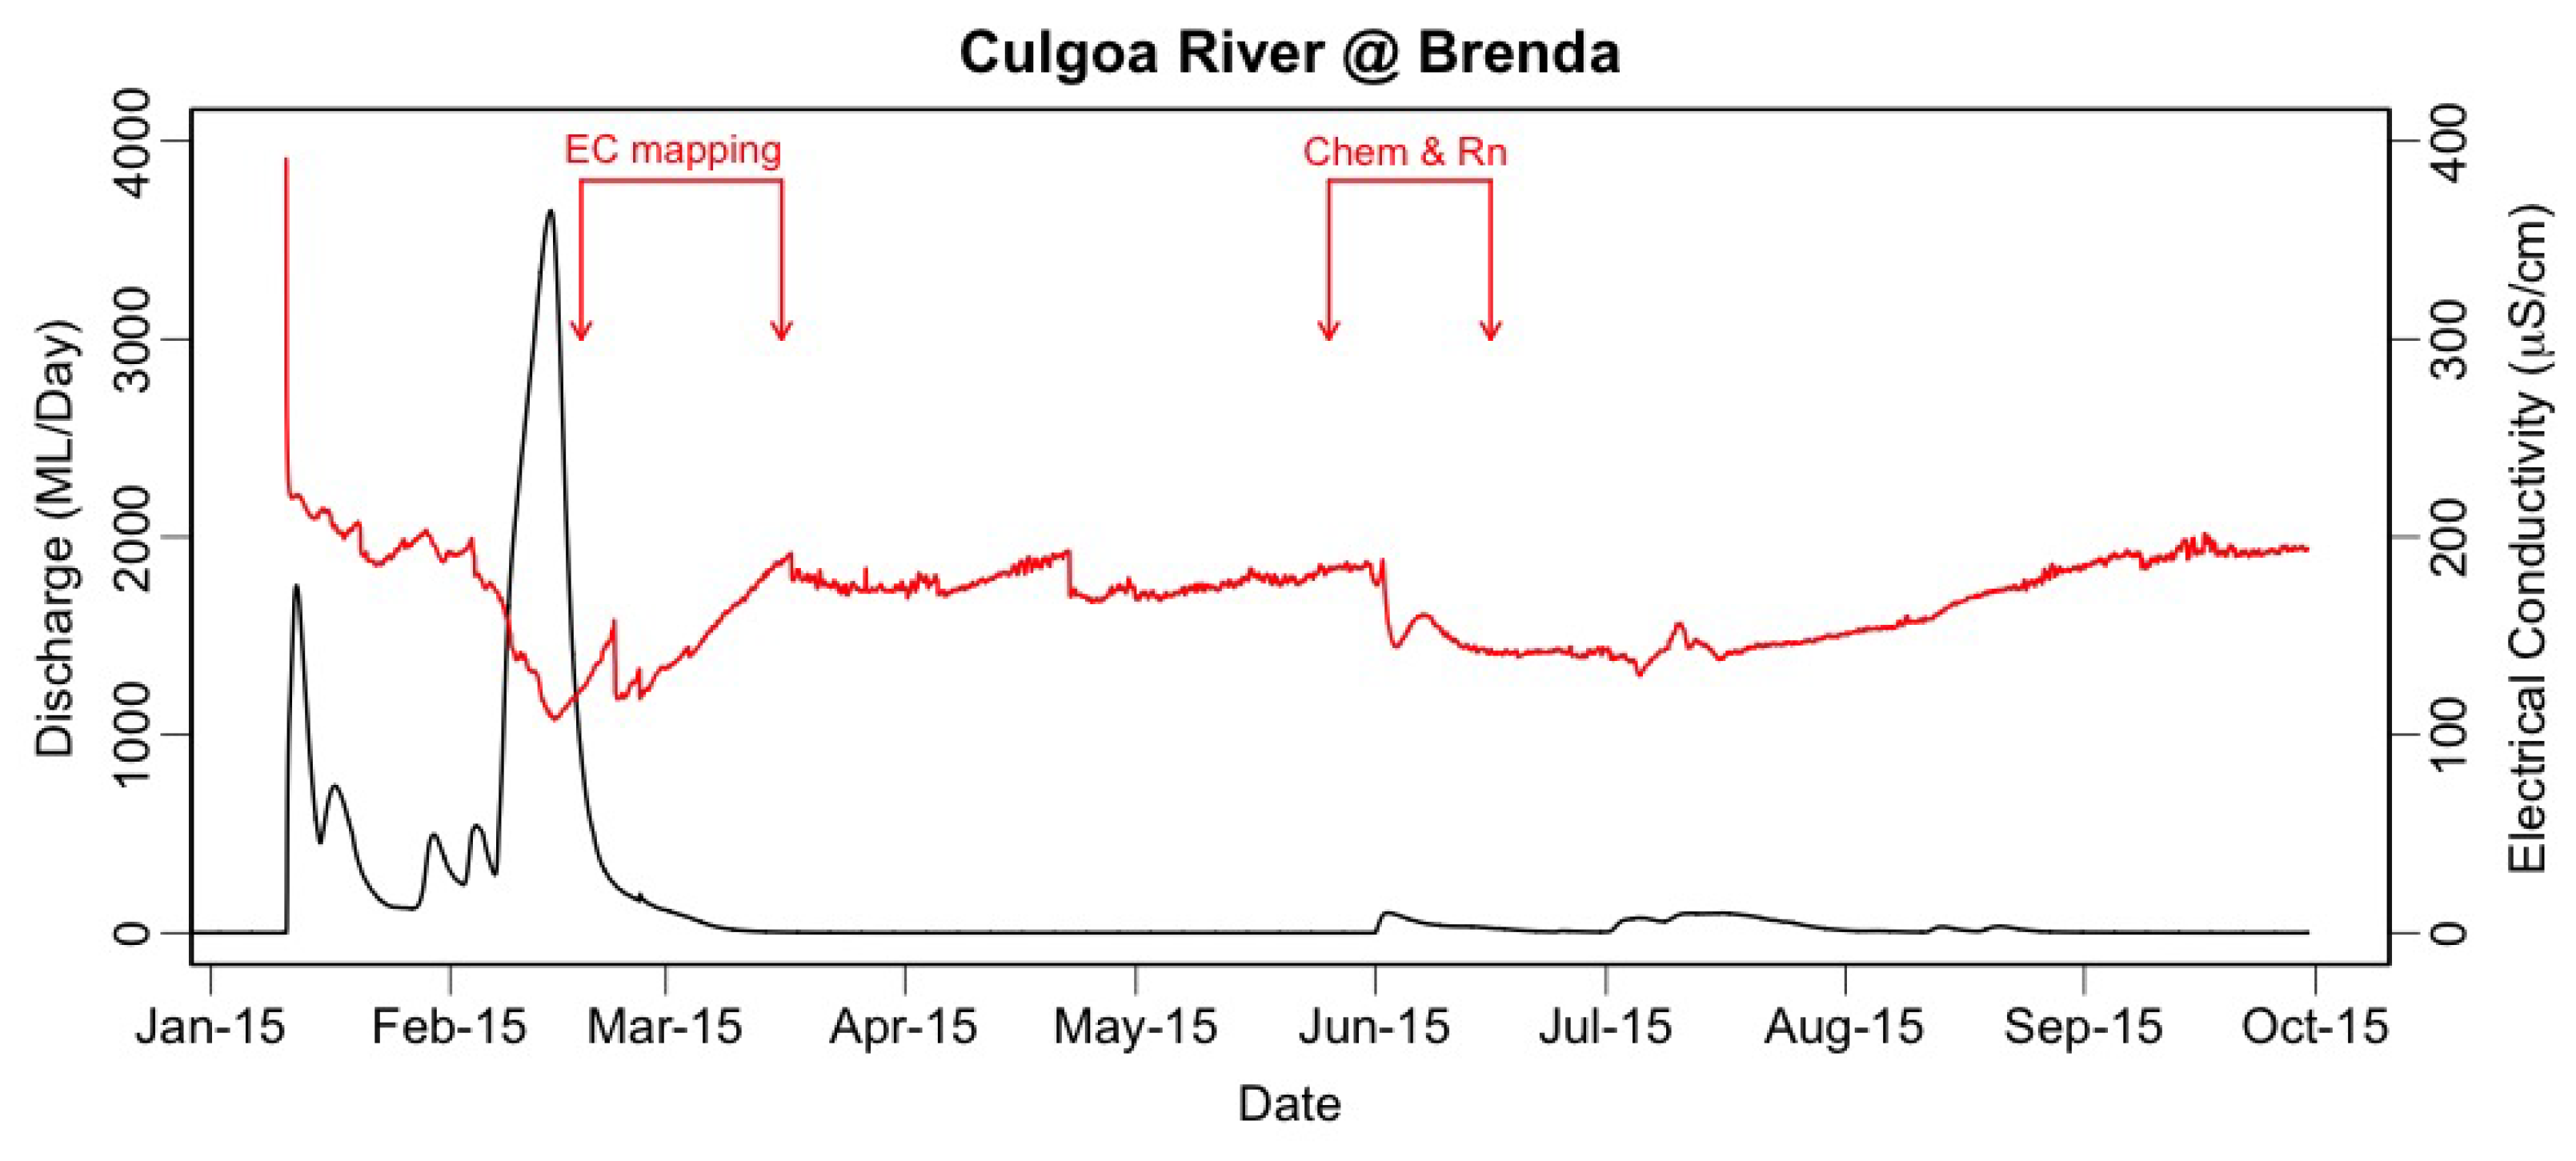
2. Materials and Methods

This study estimates groundwater inflows to the parts of the Darling and Barwon rivers, the Culgoa River and the Narran River between Dirranbandi and Lightning Ridge in the NE to Tilpa, NSW, in the SW, along a total river reach length of approximately 500 km (Figure 1 and Table 1). The study area is subdivided into upstream sites (the Culgoa River and the Narran River) and downstream sites (the Darling/Barwon River System) sites. Discharge data and semi-continuous electrical conductivity (EC) data in the river were used for two gauging stations, the gauging station at Brenda and the one at Bourke (Figure 1 and Table 1).
The preliminary mapping of the electrical conductivity (EC) in all representative waterholes of the Narran and the Culgoa River was undertaken during bathymetric survey in February/March 2015 [13] and had the purpose of finding potential groundwater discharge regions along the waterholes. A HOBO EC logger (Onset Computer Corporation) was attached to the front of the bathymetry vessel and programmed to record EC-readings every 10 s. A handheld GPS unit recorded the location.

Sampling and Analytical Methods

100 surface water samples from 27 representative waterholes along the Narran and Culgoa Rivers and one groundwater sample from the Narran Park waterhole were taken in two sampling campaigns during February–March 2015 and May–June 2015 (Table 1). 12 surface water samples from 10 representative waterholes along the Darling River and 8 groundwater samples adjacent to these waterholes were taken on a single campaign in September 2015 (Table 1). Surface water samples were taken using a sampling pole from the riverbanks or from a boat on the river by submerging the pole gently under water and filling the sampling cup close to the riverbed. Groundwater samples were obtained from New South Wales Department of Primary Industry (NSW DPI) groundwater monitoring bores by using a SuperTwister groundwater pump after adequate purging of > 5 bore volumes. The groundwater sample on the Narran River was taken from a bank in the waterhole by digging a hole of ∼1 m depth and purging it several times. All samples were prepared for major ion, stable isotope ( δ 2 H and δ 18 O ) and radon analysis.
Electrical Conductivity (EC), dissolved oxygen (DO), pH and Temperature were measured in the field using a calibrated Thermo-Fisher AquaRead Meter. Major cation concentrations were analysed filtration through 0.45 μm cellulose nitrate filters and acidification to pH < 2 (in the field) before using a PerkinElmer Optima 7300 DV inductively coupled plasma-optical emission spectroscopy (ICP-OES) (Advanced Water Management Centre at the University of Queensland) equipped with WinLab32 for ICP software after digestion using a CEM Mars Xpress Microwave. 9.0 ml of sample added to 1.0 mL concentrated HNO3. Samples were ramped for 10 min to 160 °C then held for 10 min. Major anion concentrations were analysed using a Thermo-Fisher Dionex ICS2100 Ion Chromatography System at the Advanced Water Management Centre at the University of Queensland. Samples with salinities over 300 mg/L total dissolved solids (TDS) were diluted prior to analysis. The precision of major ion concentrations based on replicate analyses is 2–5%.
Radon activities in groundwater and surface water were determined using a portable radon-in-air monitor (RAD-7, Durridge Co.) following methods described by Burnett [40] and are expressed in Bq/m3 water. 0.5 L of sample was collected by bottom-filling a glass flask and radon was degassed for 5 min into a closed air loop of known volume. Counting times were 4 × 30 min for surface water and 4 × 15 min for groundwater. Typical relative precision is b 3% at 10,000 Bq/m3 and ∼10% at 100 Bq/m3. Radon emanation rates were measured by sealing a known dry weight of sediment in airtight containers with water for more than 5 weeks by which time the rate of radon production and decay will have reached steady state. Subsequently, 40 mL of pore water was extracted and analysed for radon activities using the same method as above, but with counting times of 12 h.
Oxygen and hydrogen isotope ratios were measured on samples that were filtered and kept in cool in sample containers without headspace. Samples were analysed using an Isoprime dual inlet isotope ratio mass spectrometer (DI-IRMS) coupled to a multiprep bench for online analysis at the Stable Isotope Geochemistry Laboratory at the University of Queensland. δ 2 H values were analysed after online equilibration at 40 °C with Hokko coils. δ 18 O values were analysed as above, but after equilibration with carbon dioxide. δ 2 H and δ 18 O values (reported in per mil) were normalised to the standard mean ocean water (VSMOW-SLAP) scale, following a three point normalisation based on four replicate analyses of three laboratory standards per analytical cycle. All laboratory standards were calibrated against International Energy and Atomic Agency (IAEA) (VSMOW, SLAP, GISP) and USGS (USGS45, USGS46) international water standards. Accuracy and precision were better than ± 2 for δ 2 H and ± 0.1 for δ 18 O at 1 σ . Both compositions were measured as deviations relative to VSMOW.

3. Results

3.1. Narran and Culgoa Rivers
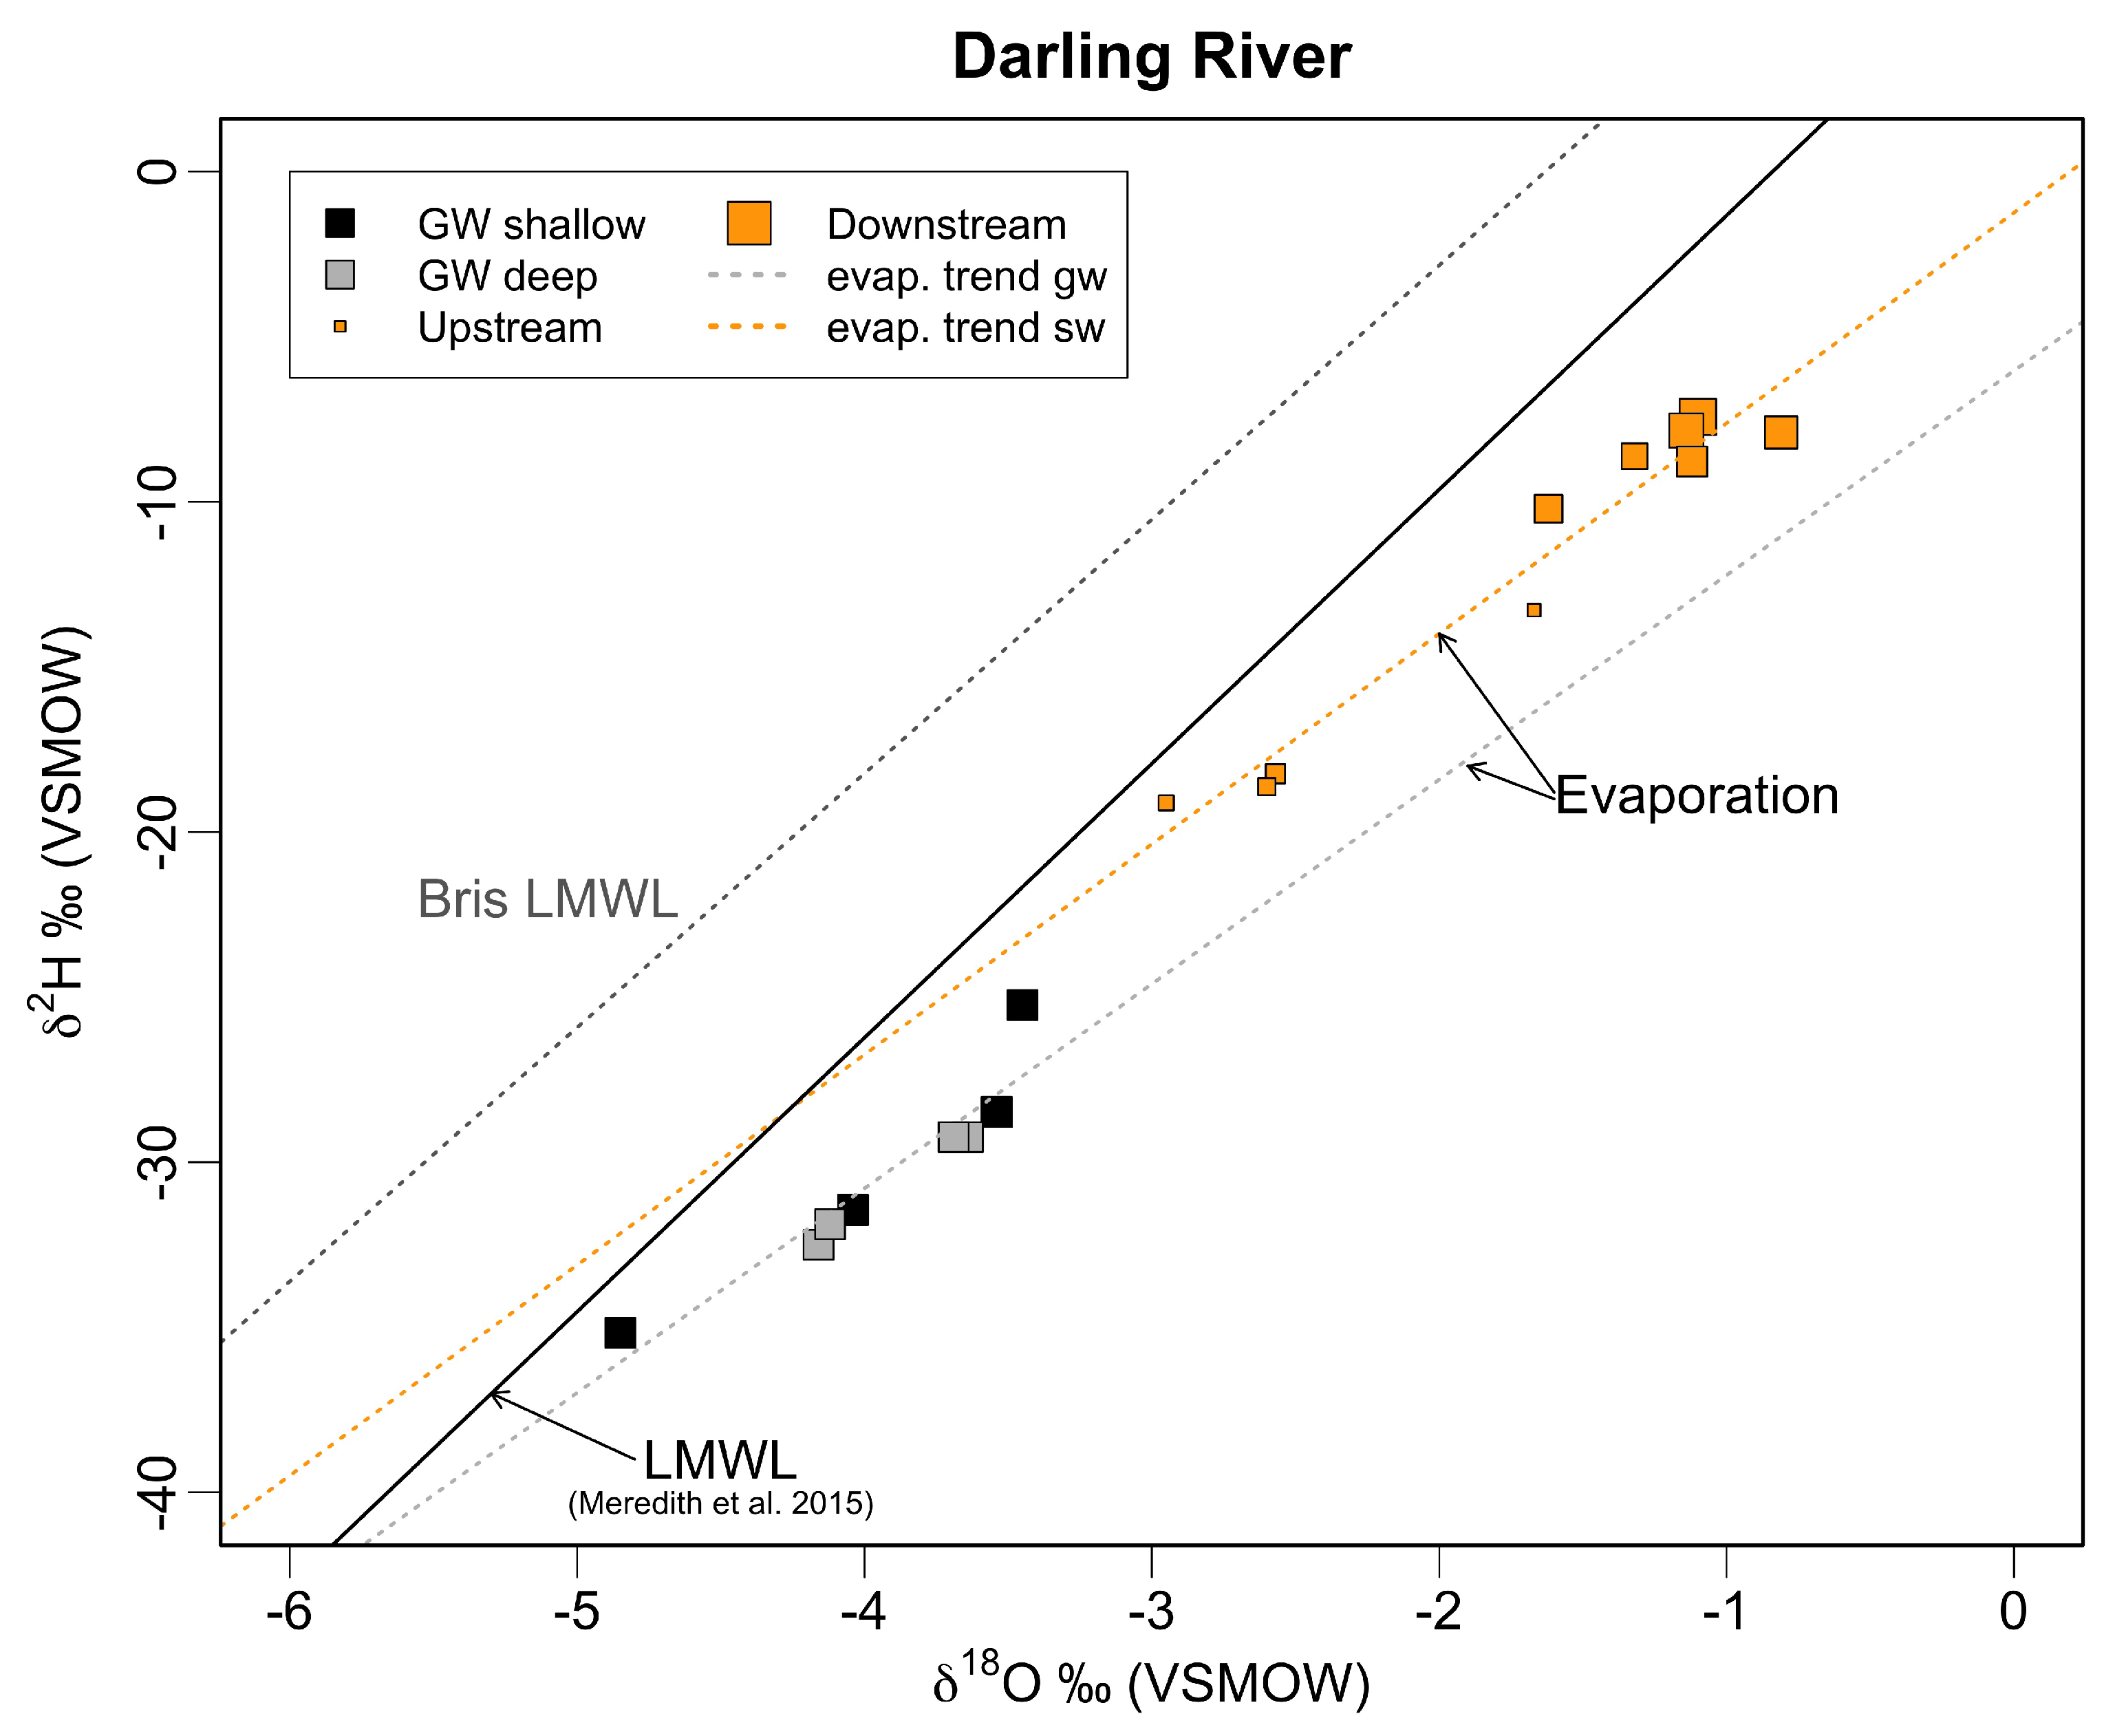
Quantifying groundwater fluxes to rivers using geochemical tracers requires knowledge of the groundwater composition for the tracers used. While groundwater bores from the local aquifers, river banks and parafluvial zones are used to constrain the ‘end member’ concentration for the potential groundwater sources, government monitoring bores in the vicinity of the Narran and Culgoa rivers are rare and weren’t sampled due to the lack of access. One shallow groundwater/parafluvial zone sample from a sand bank in the Narran Park waterhole was collected. This parafluvial water had an EC value of 2779 μS/cm and a radon concentration of 10,600 Bq/m3. In a regional sense, groundwater in the major aquifers is expected to have at least Total Dissolved Solids (TDS) > 500 mg/L (equivalent of approximately 780 μS/cm in EC). Groundwater data from the Australian Bureau of Meteorology [41] indicates a median EC value of 10,000 μS/cm, with a minimum of 184 μS/cm and a maximum of 89,000 μS/cm (n = 3455).
Sampling locations for radon were based on the results from EC mapping. The EC values during the mapping exercise were spread over a large range from waterholes with very low EC values of ∼30 μS/cm at Brenda waterhole, to ∼600 μS/cm at Cubbie waterhole (Table 2). Variability in waterhole EC-values may indicate potential groundwater discharges to the river due to mixing with the higher saline groundwater under the assumption that no change occurs as a result of nutrients or surface runoff, and tributary contributions. In perennial streams, the EC (TDS proxy) in rivers is generally expected to increase downstream due to increasing baseflow from higher salinity aquifer units. The variability of the EC-values was highest in the Gurrawarra, Golden Plains and Narran Park waterholes and lowest in Caringle, Weilmoringle Weir and Angledool waterholes. This only takes into consideration the upper and the lower quartiles. While higher variability can potentially indicate that the waterholes may have groundwater contributions, robust trends within the waterholes were not observed, and the variability might instead be the result of separated pools or contributions from tributaries rather than groundwater contributions. Furthermore, the variability could not be reproduced by hand measurements at selected points in a later campaign in May/June 2015. The reason for the discrepancy is likely due to the different discharge conditions during the EC-mapping survey at high flow (∼2000 ML/Day at Bourke) whereas the spot sampling was conducted at much lower discharges (∼100 ML/Day at Bourke) (Figure 2).
ECs in the Culgoa and the Narran Rivers range from 77 to 292 μS/cm during the sampling campaign in March/June 2015 (Table 2). The low flow conditions of ∼100 ML/Day allow a better distinction between the waterholes with respect to their EC content. Generally EC-values were higher in the Narran than in the Culgoa with values ranging from 101 to 292 μS/cm (median = 194) in the Narran and 77 to 217 μS/cm (median = 124) in the Culgoa River, respectively. The EC values indicated a small increase along flow paths in the Culgoa, while the EC increase in the Narran River was more pronounced. The EC in the Culgoa River drops from 155 to 96 μS/cm at Innisfalls but increase again towards the confluence with the Darling River (Figure 3).
Radon concentrations in the rivers ranged from 40 to 269 Bq/m3 (median = 139) and radon concentrations were slightly higher in the Narran River than the Culgoa River, ranging from 40 to 269 Bq/m3 and 40 to 234 Bq/m3, respectively. Similar to the EC values, radon concentrations also increased downstream in both rivers (Figure 3B). The radon concentrations also dropped at Innisfalls in the Culgoa River but increased again before the Culgoa merges with the Darling River. There was a general trend that radon concentrations increased when EC also increased (Figure 4A,B).
Stable isotope ratios of δ 18 O ranged from −3.18 to 5.14‰ and −16.28 to 19.32‰ for δ 2 H . Most isotope values were similar between the Culgoa and the Narran River with the only difference that the most downstream samples on the Narran were strongly enriched with δ 18 O values in between 4 and 6‰ and δ 2 H values between 12 and 20‰. The stable isotope values all plot along an evaporation trend (Figure 5A,B) with three major groupings. The first group is relatively depleted and plots close to the local meteroric water line, which is representative of rainfall. The second group has a slight evaporation signature with more enriched values, which is emphasised in the Culgoa River (Figure 5A). The third group indicates strong evaporation with highly enriched values.
The waterholes along the Narran River generally showed a trend towards higher enrichment downstream (Figure 3C). The stable isotope values were a lot more variable in the Culgoa and dropped towards much more depleted values at Innisfalls, which is in line with radon and EC values. There is a clear trend between the EC and stable isotope values, e.g., δ 18 O , in both rivers (Figure 6A,B) and the three groups with increasing enrichment correspond to increasing EC values.

3.2. Darling River

Along the Darling River, 12 surface water samples and 8 groundwater samples were taken at the end September 2015. The sample locations were predetermined from previous work by the NSW DPI Water. The locations are summarised in Table 1. Weir 19A was not part of the original sampling strategy but was included after reviewing a report on the salt interception scheme around Weir 19A (Glen Villa) [42]. Two aquifers were also targeted for sampling: the shallow Narrabri Formation (10 to 25 m depth) and the deeper Gunnedah Formation (30 to 50 m depth) (Table 3). The EC values were variable in the Narrabri formation with fresh groundwater of 541 μS/cm in bores B36842-1 and 377 μS/cm in B36853-1, but brackish to saline water with values of 12,700 μS/cm in B36937-1 and 34570 μS/cm in B56852-1. There was less variability in the groundwater bores in the Gunnedah formation with mostly saline groundwater in bores BB36852-2, B36937-2 and B36853-2 (EC = 35,089 to 40,370 μS/cm) with the exception of bore B36842-2, which had an EC of 1976 μS/cm (Table 3). Radon concentrations in the groundwater bores were orders of magnitude higher than in the surface water ranging from 74.5 to 13,236.1 Bq/m3 with a median concentration of 3769.4 Bq/m3. Bores with relatively fresh groundwater, Bore B36842-1 and B36853-1, also had reasonably high radon concentrations of 5343.8 and 13,236.1 Bq/m3, respectively.
River water EC ranged from 309 to 504 μS/cm and radon concentration were very low, ranging from 22.09 to 102.19 Bq/m3 at the time of sampling in September 2015 (Figure 7). EC values increased downstream from the confluent of the Darling River with the Culgoa River and reached a peak west of Louth, peaking at Winbar with a value of 495 Bq/m3, after which they declined again. Radon values are also highest in the area between Weir 19A and Louth (Figure 3A,B). Radon concentrations along the Darling River were generally low, ranging from 22.1 to 102.2 Bq/m3 with a median value of 45.6 Bq/m3 (Table 3 and Figure 7). The highest activity also occurred close to Louth, however, further upstream than the highest EC value. At Akuna, radon concentrations peaked at 102.2 Bq/m3.
The stable isotopes values of groundwater from both formations had average δ 18 O and δ 2 H of −3.93‰ and −30.39‰, respectively (Figure 8), which are close to local and regional long-term rainfall [20]. River δ 18 O and δ 2 H values ranged from −2.95 to −0.81‰ and −19.88 to −7.84‰, respectively. The lowest, most depleted values occurred in between Brouke and Louth (Figure 3C).

4. Discussion

The objective of this study was to assess potential groundwater contributions to inland ephemeral streams in central east Australia. While ephemeral streams are often disconnected from regional groundwater, there are circumstances where regional aquifers intersect the river bed through up-coming strata (e.g., basement highs) or fault connectivity. More importantly, intermediate and transient storage in floodplain lenses or river banks plays an important role in sustaining flows throughout periods of declining flow. It is thought that these reservoirs also contribute to waterholes, sustaining these vital water reservoirs, which provide abundant ecosystem services in arid and semi-arid regions [11].
Here, we investigated potential groundwater contributions to waterholes along the Narran, Culgoa and Darling rivers to inform waterhole persistence modelling and provide insights on the importance of the groundwater component in the water balance. Geochemical tracers were chosen as groundwater bores are not easily accessible, have a lack of data or are often too far away from the waterholes to provide information on transient connectivity with groundwater. The focus here was primarily on isotopic tracers, such as stable isotopes and radon, as well as the electrical conductivity of water, which is a proxy for its salinity. This is based on the assumption that tracer concentrations are distinctly, if not orders of magnitude, different between the reservoirs (i.e., waterhole, rainfall, regional groundwater, freshwater lens or bank storage). When, for example, water from one reservoir, e.g., river water, contains a very low concentration of a tracer and receives water from a different reservoir, e.g., groundwater, with a high concentration of that tracer, the spatially distinct or temporally transient increase of the tracer in the first reservoirs then indicates mixing and therefore contributions from the second reservoir. This principle was applied here to qualitatively determine the extend of groundwater connectivity to the waterholes in the selected river systems.
The conditions during sampling for this study did not represent no-flow conditions and flow had not completely ceased. Higher rainfalls in early months of the year resulted in high discharge, which had declined by the time the sampling took place (Figure 2). However, it is reasonable to assume that these flow peaks lead to recharge into the river banks and the floodplains.

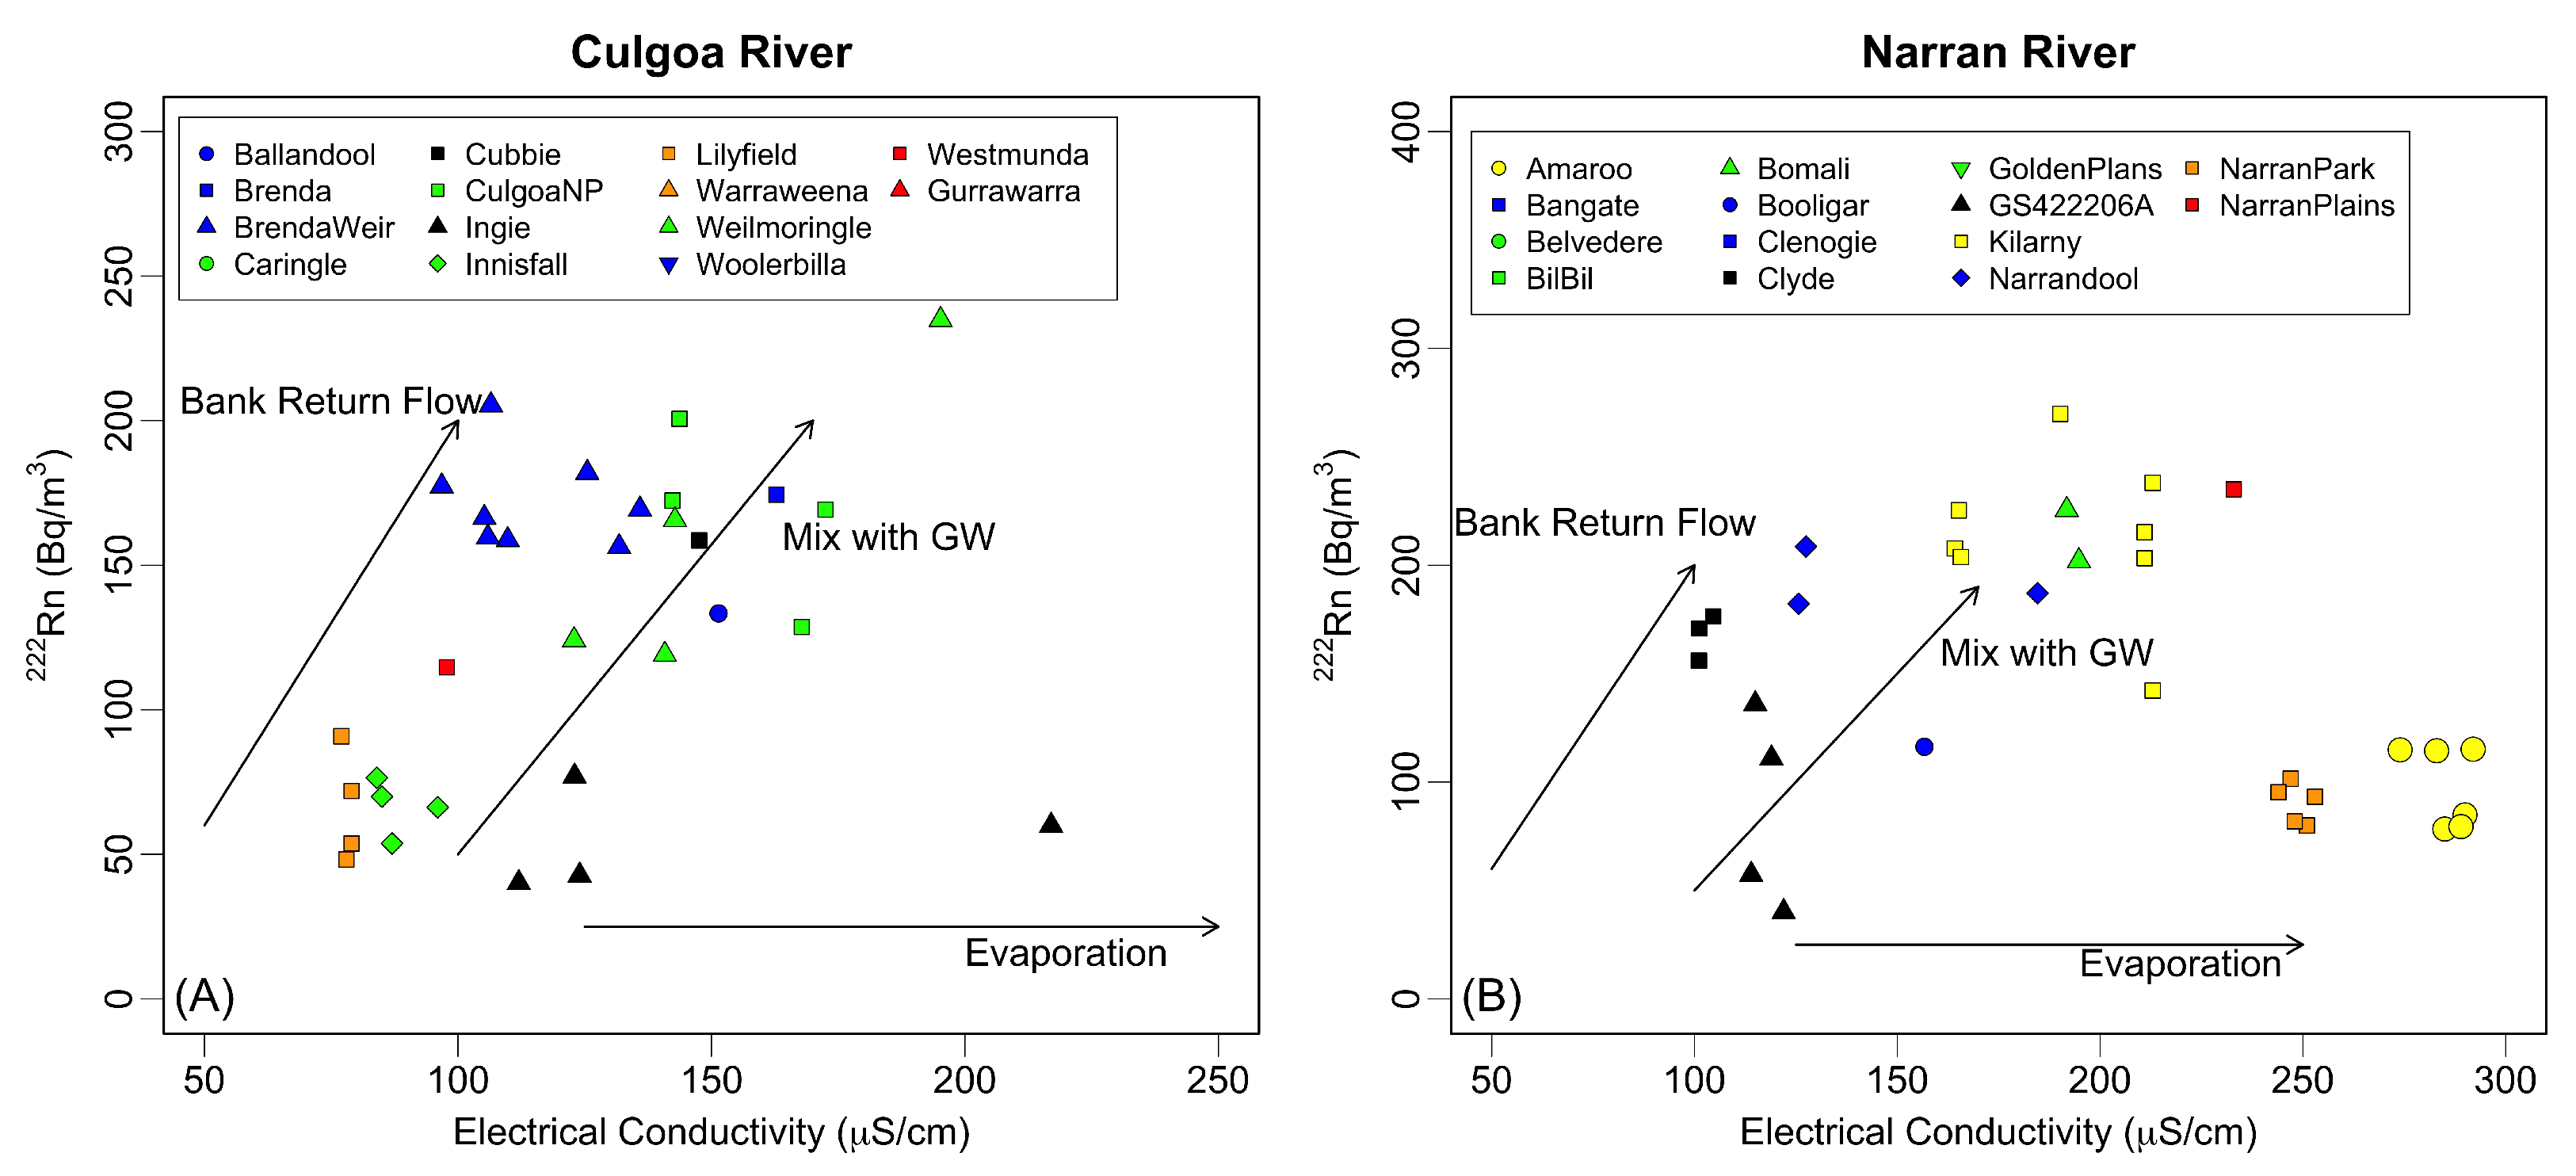
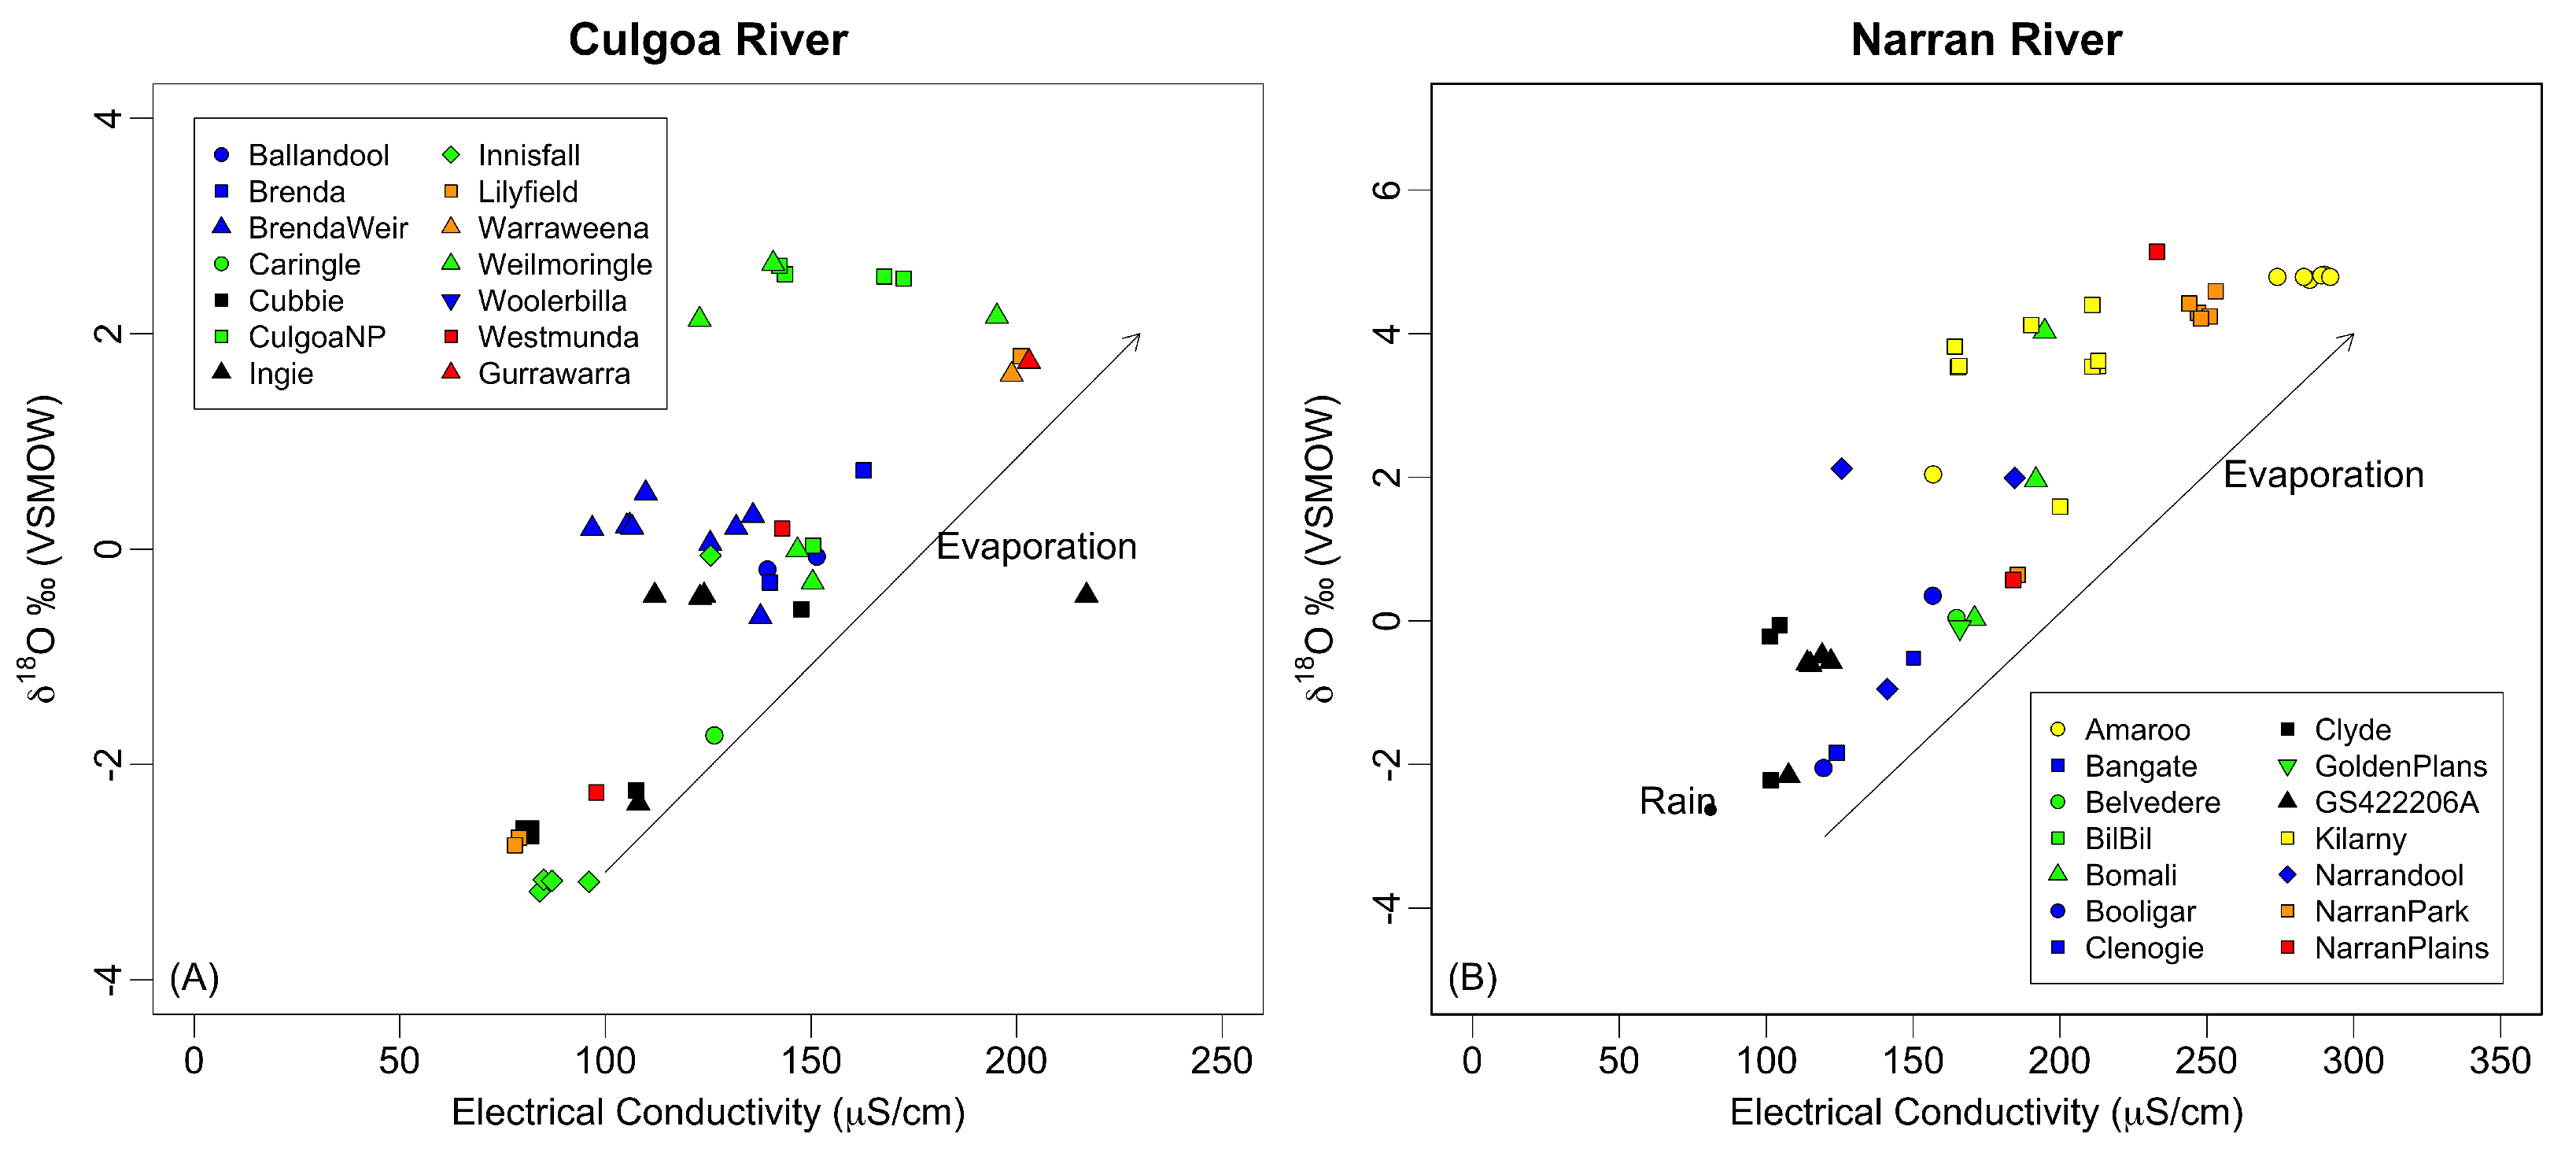
4.1. Characterisation of the Reservoirs

Groundwater in the regional aquifers has often high salinities from brackish to hyper saline conditions. This is relatively widespread in shallow aquifer systems in the Murray-Darling Basin [43]. Radon concentrations in the regional aquifer is generally high as well.
Freshwater lenses often develop around the river systems and form an half cylindrical freshwater reservoir on top of the saline groundwater (Figure 9) [28]. The principle is analogous to freshwater lenses in coastal and island settings, where the lens expands or contracts depending on freshwater recharge conditions [44,45]. The water chemistry is often characterised by minor salinity increases compared to the river water it was recharged from and similar stable isotope values. The slight increase in salinity can stem from minor water/rock interactions or mixing with the adjacent saline groundwater. The one distinct difference to the original river water are in general higher radon concentrations due to the fast equilibration time (secular equilibrium) between radium and radon. While no bores in the freshwater lens were sampled, examples from the region support the assumptions for this study [27,44].
River bank storage is arguably part of a freshwater lens but it may also occur in regions where freshwater lenses are absent. One could distinguish the two by modes of recharge, where river banks are possibly more often recharged directly through the upper parts of the river bed and banks during in-channel flows and floods, whereas freshwater lenses are recharged mainly through flooding of the floodplain.
The waterholes are generally filled by events but some filling from local rainfall can occur. They are depressions in river bed topography that hold larger volumes of water than the rest of the channel. The water chemistry is often close to that of rainfall. Salinity is slightly increased from minor rock-water interactions, salt dissolution during runoff processes and nutrient transport from runoff. The stable isotope composition is also similar to rainfall unless significant evaporation occurs, which is seen in the waterholes along the Culgoa, the Narran and the Darling rivers. Radon concentrations are low as rainfall contains insignificant radon, compared to groundwater, and if present, radon tends to evade quickly from surface water bodies due to the low solubility.

4.2. Groundwater Connectivity Along the Culgoa, Narran, and Darling Rivers Waterholes

Along the Narran River EC-values in Amaroo, Killarney and Narrandool were highest. While this is potentially an indication of groundwater contributions to the waterholes, radon values for the waterholes suggest that Narrandool, Narran Park, Bomali and some parts of Killarney may also have some groundwater contributions (indicated by higher radon values combined with higher EC-values), but this is not the case for Amaroo and the rest of Killarney (Figure 4A and Table 2). Higher radon concentrations but low EC may be the result of water contribution from parafluvial zone or from bank return flow where salinities are low but radon can accumulate to secular equilibrium levels [28]. However, these rivers have not developed large parafluvial zones compared to, for example, braded river systems, and bank return flow would be the most likely source. While some samples have slightly elevated radon concentrations in combination with low EC (e.g., Ballandool, Booligar, Wesmunda), groundwater fluxes on the basis of the radon concentrations would only be small (Figure 4A), considering that diffusive fluxes from the riverbed are likely to be similar to the lowest values detected for each waterhole. Higher EC values on the Culgoa River occurred at Culgoa National Park and Weilmoringle Weir with slightly higher radon concentrations ranging from 128 to 200 and 119 to 182 Bq/m3, respectively. There is the possibility of small groundwater inflow or bank return flow to these waterholes (Figure 4B).
Groundwater is one potential cause of increasing salinities in rivers, and evaporation is another, especially when flow ceases. Stable isotopes δ 18 O and δ H fractionate during evaporation and the residual water becomes enriched in both isotope pairs. The stable isotope ratios of the water samples from the waterholes followed an evaporation trend, which progressed towards more enriched values along the flow path of the Narran and the Culgoa rivers (Figure 5A,B). The most enriched values were found at Killarney, Amaroo and Narran Park with δ 18 O of +5.14‰ and δ 2 H of 19.32‰. These waterholes also had the highest EC-values and lowest radon, which in the case of Killarney and Amaroo suggests that the salinity increase is not resulting from groundwater discharge to the river but is best explained by evaporation. The waterholes with possible groundwater contribution on the Culgoa River, Culgoa National Park and Weilmoringle Weir, also had high stable isotope ratios indicating significant evaporation and subsequent increases in salinity. Regional groundwater is believed to have much more depleted stable isotope values, which is inferred from values obtained in the Darling River groundwater bores and reported by Meredith et al. (2015) [20] ( δ 18 O of ∼−1.5‰ and δ H of ∼−30‰, [20]; δ 18 O of −3.9‰ and δ 2 H of −30.4‰, data obtained during this study from bores on the Darling flood plains). Hence, groundwater discharge to the river would not only increase the EC and radon concentrations but would also mix the highly enriched stable isotope surface water values with more depleted groundwater isotope values. This should result in more depleted isotope values. The three isotope clusters in Figure 5A,B are an indication that this may happen. The middle cluster represents waterholes where the mixing between slightly higher saline and enriched water and low salinity with depleted isotope values occurs, which is also in line with the EC– δ 18 O relationship observed in Figure 6A,B.
The results from the Darling river are very different compared to the headwater streams, the Culgoa and the Narran rivers. EC values remain more constant and radon values are significantly lower along the Darling. Here, information on groundwater chemistry from the bores is valuable for the conceptualisation of the system. B36842-1 is located close to Tilpa close to Glen Villa (Weir 19A). It’s low EC value of 541 μS/cm indicates a freshwater lens or multiple fresh water lenses in the proximity of the river, which is in line with descriptions on Cooper Creek by Cendon et al. (2020) [18] and some parts of the Murray River in Cartwright et al. (2011) [27]. The extent of these lenses is only know in areas where bore data exist or geophysical surveys were conducted, such as airborne electromagnetic (AEM) data, but alluvial sediment heterogeneities and bedrock topography may be key factors influencing the geometry of a lens or lenses. Bores B36937 and B36853 are within the vicinity of the Upper Darling salt interception scheme, which is indicated as an area of preferential groundwater discharge to the Darling River [42]. D’Hautefeuille and Williams (2003) [42] reported a lens being present in the area and that the fresh lens recharges from the stream at higher flows >4500 ML/Day. It subsequently requires extended periods of low flow to deplete this freshwater lens to the extent that saline groundwater then reaches the river.
During the sampling in September 2015 river flow was not at its minimum with flow still exceeding 400 ML/Day, but much lower than the 4500 ML/Day reported by D’Hautefeuille and Williams (2003) [42]. The river water during this period was still very fresh and the low radon concentrations indicate little groundwater inflow. Low radon groundwater in the Gunnedah formation is also not likely to feed the river as the salinity would increase drastically if this groundwater discharged to the river. Despite groundwater fluxes not being of great importance, the steep increase of EC and radon after Weir 19A towards Hells Gate and Louth indicates small groundwater fluxes to the river at this location whereas all the locations further downstream appear to be rather losing or neutral (Figure 7). The source of this groundwater, however, is probably not from the extended fresh water lens but could be from the regional groundwater system in this case, as described in D’Hautefeuille and Williams (2003) [42] and Meredith et al. (2015) [20]. However, the increase in stable isotopes, for example, δ 18 O , at Weir 19A towards Nangara Bend indicates that water with more enriched stable isotope ratios is discharged to the river. If regional groundwater was the main contributing reservoir, then δ 18 O ratios would be expected to fall towards more depleted values (Figure 7). Contributions from local bank return flow or small evaporated parafluvial zones could potentially be the source of this water. For the study sites further downstream from Weir 19A, where EC values decline again, contributions from the freshwater lens or bank return flow may lead to dilution, however, radon values remain low. Another like source of additional fresh water are tributaries that would potentially add water with low EC and low radon.

5. Conclusions

In summary, radon concentrations were generally very low in all the river systems. This is in line with other studies on inland, low topography river systems. While some waterholes show evidence for possible minor groundwater contributions due to slightly increased radon concentrations and higher EC-values compared to locations upstream and downstream, some of the salinity increase needs to be attributed to evaporation. Generally, groundwater contributions appear to be very small, especially during the sampling period of this study. Given the sampling was after floods and extended in-channel flows, it may suggest that at other, drier times (e.g., during extended drought) when waterhole persistence is most vital to the ecosystems they support, that GW influence on persistence is likely less important because there will not be any bank storage or parafluvial water left to drain into waterholes.
Much of the stable isotope and major ion data suggests that the surface water chemistry is dominated by evaporation, however, some changes cannot be explained by evaporation only. The strong influence of evaporation was also previously suggested driving the increases in EC and the enrichment in δ 18 O [46]. The radon data, however, indicated some connectivity to groundwater, for example, at the locations along the Narran River where the EC and radon increase simultaneously. This may indicate some interaction with groundwater and/or bank storage further upstream. No significant groundwater fluxes occurred along the Darling at the time of sampling apart from the area around Weir 19A, where groundwater connectivity was postulated earlier.
While groundwater was not a major contributor to the waterhole balance at the time of sampling, it may become more important during droughts. The reservoirs that are most important for ecosystem services are the freshwater lenses and the riparian river banks. They contain and provide low salinity water to the ecosystems during no-flow periods. How long the water in the banks last is still mostly is still a major knowledge gap and needs some further studies. Howcroft et al. (2019) [47] suggested residence times of river bank storage of several month if not longer for the Barwon River in Victoria, which is in a similar environment as the rivers here.
The lack of background groundwater information within the river reaches of interest places a large constraint on the ability to interpret groundwater interaction processes within these rivers. Likewise, the lack of surface water quality or gauging data restricts the water balance constraints that can be undertaken to verify the geochemical tracer work. These important factors need to be carefully considered in attempting to interpret both the inferred groundwater interaction processes presented here, as well as the confidence that can be placed in them. A further limitation to the study was the time of sampling. Sampling after prolonged dry periods would have been more beneficial, however, this was not possible due to logistical and funding constraints.
Geophysical investigations, such as AEM or electrical resistivity tomography (ERT) can be beneficial tools to monitor freshwater lenses and possibly also be used to constrain the transient nature of these system.
Waterhole persistence is an important part of ecological health surveys. These surveys feed into water policies, plans and management strategies. Ecosystems compete over the resource with anthropogenic interests, such as agriculture, town supply and other industries. Understanding the basic requirements for ecosystems to survive extended periods without significant flow is therefore of paramount importance for consideration in water management.

Author Contributions

H.H. has developed the concept of the study, collected and analysed the data. He has drafted the manuscript and prepared all figures and maps. J.M. has collected the sample, contributed to the planing and conceptual development of the study and has revised the manuscript. All authors have read and agreed to the published version of the manuscript.

Funding

Funding was provided from the Department of Natural Resources and Mines (DNRM). The project was overseen by Rose Coburn from DNRM and Adam Sluggett from Murray–Darling Basin Authority (MDBA).

Data Availability Statement

Data will be provided upon request. Contact Dr. Harald Hofmann at h.hofmann@uq.edu.au.

Acknowledgments

The project was overseen by Rose Coburn from the DNRM and Adam Sluggett from the Murray–Darling Basin Authority (MDBA). The work contained in this report represents a collaboration between the DNRM, DSITI, Neal Foster from the NSW Department of Primary Industries (DPI) Water, Ozius Spatial, and the University of Queensland (UQ). In addition, the authors would like to acknowledge the significant contributions made to the overall project by Joshua Larsen, Katrina Cousins, Jaye Lobegeiger, John Bowlen, Joanna Blessing, John Vitkovsky, Paul Harding, Myriam Raymond, Marianna Joo, Dean Holloway, Ryan Woods, Cameron Schulz, Rohan Wallace, Sara Clifford, Kate Hodges and Jessica Roffey (DSITI), Andrea Prior and Rod Dew (DNRM), William Lucardie (MDBA), Kevin Brown (Hydro Survey Services), Barry Medway (DPI Water), Nick Marsh, and Jane Bryden-Brown (Ozius). The authors also acknowledge the support of DSITI’s Remote Sensing Centre and the Joint Remote Sensing Research Program in providing input data for the waterhole time-series analysis. The authors gratefully acknowledge the traditional owners of the land on which this research was conducted and the landholders who provided access to field sites on their properties.

Conflicts of Interest

The authors declare no conflicts of interest.

References

  1. Shanafield, M.; Bourke, S.A.; Zimmer, M.A.; Costigan, K.H. An overview of the hydrology of non-perennial rivers and streams. WIREs Water 2021, 8, e1504. [Google Scholar] [CrossRef]
  2. Godsey, S.E.; Kirchner, J.W. Dynamic, discontinuous stream networks: Hydrologically driven variations in active drainage density, flowing channels and stream order. Hydrol. Process. 2014, 28, 5791–5803. [Google Scholar] [CrossRef]
  3. Schilling, O.S.; Cook, P.G.; Grierson, P.F.; Dogramaci, S.; Simmons, C.T. Controls on interactions between surface water, groundwater and riverine vegetation along intermittent rivers and ephemeral streams in arid regions. Water Resour. Res. 2021, 57, e2020WR028429. [Google Scholar] [CrossRef]
  4. Messager, M.L.; Lehner, B.; Cockburn, C.; Lamouroux, N.; Pella, H.; Snelder, T.; Tockner, K.; Trautmann, T.; Watt, C.; Datry, T. Global prevalence of non-perennial rivers and streams. Nature 2021, 594, 391–397, 397A–397T. [Google Scholar] [CrossRef]
  5. Scamardo, J.E.; Wohl, E. Recognizing the ephemeral stream floodplain: Identification and importance of flood zones in drylands. Earth Surf. Process. Landforms 2024, 49, 210–235. [Google Scholar] [CrossRef]
  6. Keegan-Treloar, R.; Irvine, D.J.; Solórzano-Rivas, S.C.; Werner, A.D.; Banks, E.W.; Currell, M.J. Fault-controlled springs: A review. Earth-Sci. Rev. 2022, 230, 104058. [Google Scholar] [CrossRef]
  7. Cartwright, I.; Irvine, D. The spatial extent and timescales of bank infiltration and return flows in an upland river system: Implications for water quality and volumes. Sci. Total Environ. 2020, 743, 140748. [Google Scholar] [CrossRef]
  8. Cartwright, I.; Hofmann, H. Using radon to understand parafluvial flows and the changing locations of groundwater inflows in the Avon River, southeast Australia. Hydrol. Earth Syst. Sci. 2016, 20, 3581–3600. [Google Scholar] [CrossRef]
  9. McJannet, D.; Marvanek, S.; Kinsey-Henderson, A.; Petheram, C.; Wallace, J. Persistence of in-stream waterholes in ephemeral rivers of tropical northern Australia and potential impacts of climate change. Mar. Freshw. Res. 2014, 65, 1131–1144. [Google Scholar] [CrossRef]
  10. Cockayne, B. Climate change effects on waterhole persistence in rivers of the Lake Eyre Basin, Australia. J. Arid. Environ. 2021, 187, 104428. [Google Scholar] [CrossRef]
  11. Marshall, J.C.; Sheldon, F.; Thoms, M.; Choy, S. The macroinvertebrate fauna of an Australian dryland river: Spatial and temporal patterns and environmental relationships. Mar. Freshw. Res. 2006, 57, 61–74. [Google Scholar] [CrossRef]
  12. Tibby, J.; Marshall, J.C.; Lobegeiger, J.S.; Amos, K.J.; Pickering, G.; Myburgh, T. Sedimentation from landscape clearance-induced soil erosion threatens waterhole persistence in a semi-arid river system, southern Queensland, Australia. Mar. Freshw. Res. 2023, 74, 1050–1070. [Google Scholar] [CrossRef]
  13. DSITI. Waterhole refuge mapping and persistence analysis in the Lower Balonne and Barwon–Darling rivers. Department of Science, Information Technology and Innovation. Final Report—Water Planning Ecology, December 2015, Queensland Government. Available online: https://www.mdba.gov.au/publications-and-data/publications/waterhole-refuge-mapping-and-persistence-analysis-lower-balonne (accessed on 10 December 2024).
  14. Wu, H.; Jazayeri, A.; Werner, A.D.; Tang, H.; Lu, C. Riparian freshwater lens response to flooding. Water Resour. Res. 2023, 59, e2022WR033309. [Google Scholar] [CrossRef]
  15. Rau, G.C.; Halloran, L.J.S.; Cuthbert, M.O.; Andersen, M.S.; Acworth, R.I.; Tellam, J.H. Characterising the dynamics of surface water-groundwater interactions in intermittent and ephemeral streams using streambed thermal signatures. Adv. Water Resour. 2017, 107, 354–369. [Google Scholar] [CrossRef]
  16. Winter, T.C. The role of ground water in generating streamflow in headwater areas and in maintaining base flow. J. Am. Water Resour. Assoc. 2007, 4315–4325. [Google Scholar] [CrossRef]
  17. Bunn, S.; Thoms, M.; Hamilton, S.; Capon, S. Flow variability in dryland rivers: Boom, bust and the bits in between. River Res. Appl. 2006, 22, 179–186. [Google Scholar] [CrossRef]
  18. Cendón, D.I.; Larsen, J.R.; Jones, B.G.; Nanson, G.C.; Rickleman, D.; Hankin, S.I.; Pueyo, J.J.; Maroulis, J. Freshwater recharge into a shallow saline groundwater system, Cooper Creek floodplain, Queensland, Australia. J. Hydrol. 2010, 392, 150–163. [Google Scholar] [CrossRef]
  19. Villeneuve, S.; Cook, P.G.; Shanafield, M.; Wood, C.; White, N. Groundwater recharge via infiltration through an ephemeral riverbed, central Australia. J. Arid. Environ. 2015, 117, 47–58. [Google Scholar] [CrossRef]
  20. Meredith, K.T.; Hollins, H.E.; Hughes, C.E.; Cendón, D.I.; Chisari, R.; Griffiths, A.; Crawford, J. Evaporation and concentration gradients created by episodic river recharge in a semi-arid zone aquifer: Insights from Cl, δ18O, δ2H, and 3H. J. Hydrol. 2015, 529, 1070–1078. [Google Scholar] [CrossRef]
  21. Hofmann, H. Estimating the Role of Bank Flow to Stream Discharge Using a Combination of Baseflow Separation and Geochemistry. Water 2023, 15, 844. [Google Scholar] [CrossRef]
  22. Brodie, R.; Sundarm, B.; Tottenham, R.; Hostetler, S.; Ransley, R. An Overview of Tools for Assessing Groundwater-Surface Water Connectivity; Technical Report; Department of Agriculture, Fisheries and Forestry. Australian Government: Canberra, Australia, 2007.
  23. Cook, P.G. Estimating groundwater discharge to rivers from river chemistry surveys. Hydrol. Process. 2012, 27, 3694–3707. [Google Scholar] [CrossRef]
  24. Cecil, L.D.; Green, J.R. Radon-222. In Environmental Tracers in Subsurface Hydrogeology; Cook, P.G., Herczeg, A.L., Eds.; Kluwer Academic Books: Boston, MA, USA, 2000; pp. 175–194. [Google Scholar]
  25. Ellins, K.K.; Roman-Mas, A.; Lee, R. Using 222Rn to examine groundwater/surface discharge interactions in the Rio Grande De Manati. Puerto Rico 1990, 115, 319–341. [Google Scholar] [CrossRef]
  26. Hoehn, E.; Van Gunten, H.R. Radon in Groundwater: A tool to access infiltration from surface water to aquifers. Water Resour. Res. 1989, 25, 1795–1803. [Google Scholar] [CrossRef]
  27. Cartwright, I.; Hofmann, H.; Sirianos, M.A.; Weaver, T.R.; Simmons, C.T. Geochemical and 222Rn constraints on baseflow to the Murray River, Australia, and timescales for the decay of low-salinity groundwater lenses. J. Hydrol. 2011, 405, 333–343. [Google Scholar] [CrossRef]
  28. Cartwright, I.; Hofmann, H.; Gilfedder, B.; Smyth, B. Understanding parafluvial exchange and degassing to better quantify groundwater inflows using 222Rn: The King River, southeast Australia. Chem. Geol. 2014, 380, 48–60. [Google Scholar] [CrossRef]
  29. Bourke, S.A.; Cook, P.G.; Shanafield, M.; Dogramaci, S.; Clark, J.F. Characterisation of hyporheic exchange in a losing stream using radon-222. J. Hydrol. 2014, 519, 94–105. [Google Scholar] [CrossRef]
  30. Gilfedder, B.S.; Cartwright, I.; Hofmann, H.; Frei, S. Explicit Modeling of Radon-222 in HydroGeoSphere During Steady State and Dynamic Transient Storage. Groundwater 2019, 57, 36–47. [Google Scholar] [CrossRef]
  31. Zhou, Z.; Cartwright, I. Using geochemistry to identify and quantify the sources, distribution, and fluxes of baseflow to an intermittent river impacted by climate change: The upper Wimmera River, southeast Australia. Sci. Total Environ. 2021, 801, 149725. [Google Scholar] [CrossRef]
  32. Murray Darling Basin Authority (MDBA). Assessment of Environmental Water Requirements for the Proposed Basin Plan: Lower Balonne River Floodplain, MDBA Publication No: 24/12; Murray-Darling Basin Authority: Canberra, Australia, 2012.
  33. DERM. Refugial Waterholes Project: Research Highlights; Queensland Department of Environment and Resource Management, Queensland Government: Brisbane, Australia, 2010.
  34. Waters, J.M.; Burridge, C.P.; Craw, D. The lasting biological signature of Pliocene tectonics: Reviewing the re-routing of Australia’s largest river drainage system. J. Biogeogr. 2019, 46, 1494–1503. [Google Scholar] [CrossRef]
  35. Meredith, K.T.; Hollins, S.E.; Hughes, C.E.; Cendon, D.I.; Hankin, S.; Stone, D.J.M. Temporal variation in stable isotopes (18O and 2H) and major ion concentrations within the Darling River between Bourke and Wilcannia due to variable flows, saline groundwater influx and evaporation. J. Hydrol. 2009, 378, 313–324. [Google Scholar] [CrossRef]
  36. BOM. Rainfall Data Portal; Australian Bureau of Meteorology: Canberra, Australia, 2020.
  37. Woods, R.J.; Lobegeiger, J.S.; Fawcett, J.H.; Marshall, J.C. (Eds.) Riverine and Floodplain Ecosystem Responses to Flooding in the Lower Balonne and Border Rivers—Final Report; Department of Environment and Resource Management, Queensland Government: Brisbane, Australia, 2012.
  38. Danaher, T.J.; Collett, L. Development, optimisation, and multi-temporal application of a simple Landsat based Water Index. In Proceedings of the 13th Australasian Remote Sensing and Photogrammetry Conference, Canberra, Australia, 20–24 November 2006. [Google Scholar]
  39. de Vries, C.; Danaher, T.; Denham, R.; Scarth, P.; Phinn, S. An operational radiometric calibration procedure for the Landsat sensors based on pseudo-invariant target sites. Remote Sens. Environ. 2007, 107, 414–429. [Google Scholar] [CrossRef]
  40. Burnett, W.C.; Dulaiova, H. Radon as a tracer of submarine groundwater discharge into a boat basin in Donnalucata, Sicily. Cont. Shelf Res. 2006, 26, 862–873. [Google Scholar] [CrossRef]
  41. BOM. Australian Groundwater Explorer, Australian Bureau of Meteorology. 2025. Available online: http://www.bom.gov.au/water/groundwater/explorer/map.shtml (accessed on 8 December 2024).
  42. D’Hautefeuille, F.; Williams, R. Upper Darling Salt Interception Scheme—Preliminary Investigation to May 2003; Centre for Natural Resources New South Wales Department of Infrastructure, Planning and Natural Resources: Parramatta, Australia, 2003.
  43. Rojas, R.; Gonzalez, G.; Fu, G. Resilience, stress and sustainability of alluvial aquifers in the Murray-Darling Basin, Australia: Opportunities for groundwater management. J. Hydrol. Reg. Stud. 2023, 47, 101419. [Google Scholar] [CrossRef]
  44. Werner, A.D.; Laattoe, T. Terrestrial freshwater lenses in stable riverine settings: Occurrence and controlling factors. Water Resour. Res. 2016, 52, 3654–3662. [Google Scholar] [CrossRef]
  45. Rotz, R.R.; Milewski, A.M. Physical modeling of inland freshwater lens formation and evolution in drylands. Hydrogeol. J. 2019, 27, 1597–1610. [Google Scholar] [CrossRef]
  46. Gibson, J.J.; Sadek, M.A.; Stone, D.J.M.; Hughes, C.E.; Hankin, S.; Cendón, D.I.; Hollins, S.E. Evaporative isotope enrichment as a constraint on reach water balance along a dryland river. Isot. Environ. Health Stud. 2008, 44, 83–98. [Google Scholar] [CrossRef]
  47. Howcroft, H.; Cartwright, I.; Cendón, D.I. Residence times of bank storage and return flows and the influence on river water chemistry in the upper Barwon River, Australia. Appl. Geochem. 2019, 101, 31–41. [Google Scholar] [CrossRef]
Figure 1. Locations of the waterholes (i.e., those that retained water after 350 days without flow) across the study area. (A) Overview of the Culgoa, Narran, Barwon, and Darling Rivers; (B) Sampled waterholes along the Culgoa River; (C) Sampled waterholes along the Narran River; (D) Sampled waterholes and groundwater bores along the Darling and Barwon Rivers. The letter/number sequence GW0XXXXX represents the New South Wales Government Bore number. QLD = Queensland; NSW = New South Wales; ACT = Australian Capital Territory; VIC = Victoria; TAS = Tasmania; NT = Northern Territory; WA = Western Australia; SA = South Australia. Coordinates are in longitude and latitude decimal degrees.
Hydrology 12 00015 g001
Figure 2. Discharge of the Culgoa River at Brenda.
Hydrology 12 00015 g002
Figure 3. (A) Electrical conductivity values, (B) radon concentrations, and (C) δ 18 O values along the flow paths for all rivers.
Hydrology 12 00015 g003
Figure 4. (A) Radon concentrations and EC values for water samples from the Narran River. (B) Radon concentrations and EC values for water samples from the Culgoa River. The increasing symbol size represents the increasing distance in the flow direction.
Hydrology 12 00015 g004
Figure 5. Stable isotopes δ 18 O and δ 2 H for the water samples from the Narran (B) and Culgoa (A) Rivers. All samples follow an evaporation trend (black dashed line). The Cobar local meteoric water line (black dashed line) from Meredith [20] and the Brisbane local meteoric water line (grey dashed line) are shown for reference. The symbol size increases with the distance from the most upstream sites.
Hydrology 12 00015 g005
Figure 6. (A) δ 18 O and EC values for water samples from the Culgoa River. (B) δ 18 O concentrations and EC values for water samples from the Narran River. The increasing symbol size represents the increasing distance in the flow direction.
Hydrology 12 00015 g006
Figure 7. Radon and δ 18 O along the flow path on the Barwon and Darling Rivers from Summerville to Wilga. Sample numbers indicate locations.
Hydrology 12 00015 g007
Figure 8. Stable isotope compositions for δ 18 O and δ 2 H for the samples collected from the Barwon and Darling Rivers, as well as the groundwater samples collected from the Gunnedah Formation (grey) and the Narrabri Formation (black). All samples show an evaporation trend (orange = surface water; grey = groundwater). The Cobar local meteoric water line (black dashed line) from Meredith et al. (2015) [20] and the Brisbane local meteoric water line (grey dashed line) are shown for reference. The symbol size for the surface water samples increases with distance from the most upstream sites.
Hydrology 12 00015 g008
Figure 9. Concept of river and waterhole processes with groundwater reservoirs.
Hydrology 12 00015 g009
Table 1. Sites in the Culgoa and Narran Rivers. A total of 30 sites, 9 of which had been augmented with weirs, were selected across the two rivers.
Site NameLatitudeLongitudeNatural/Weir Pool
Culgoa River
Cubbie−28.61049147.97784Natural
Ingie−28.6683147.80261Natural
Woolerbilla GS−28.78385147.63031Natural
Ballandool−28.90783147.51321Natural
Brenda−29.02882147.26564Natural
Brenda Weir pool−29.02796147.31221Weir pool
Culgoa NP (NSW)−29.18325147.00017Natural
Weilmoringle Weir−29.25396146.92188Weir pool
Weilmoringle GS−29.24327146.92389Natural
Caringle−29.33033146.82761Natural
Innisfail−29.50803146.63242Natural
Westmunda (Grogan’s Hole)−29.70533146.62436Natural
Gurrawarra−29.81595146.47699Natural
Lilyfield−29.85022146.44121Natural
Warraweena−29.93411146.32320Natural
Narran River
Clyde−28.76764148.08948Natural
GS422206A−28.84097148.05302Natural
Booligar−28.93873148.08159Natural
Glenogie−29.07827148.03789Natural
Angledool−29.13709147.94771Natural
Narrandool−29.19076147.83507Natural
Bangate (Sorrento Hole)−29.31740147.68872Natural
Bil Bil−29.36072147.60225Weir pool
Golden Plains−29.38503147.57106Natural
Bomali−29.42910147.55040Natural
Belvedere−29.44701147.52798Natural
Amaroo−29.53071147.43658Natural
Killarney−29.58680147.41068Weir pool
Narran Plains−29.67077147.36882Natural
Narran Park−29.69681147.36775Natural
Darling and Barwon
Barwon Nature Reserve−29.71472148.42895Weir pool
Collewaroy−30.06863147.18817Weir pool
Summerville−29.96333146.21512Weir pool
Jandra (Weir 19a)−30.17973145.78943Weir pool
Hell’s Gate−30.29673145.55720Weir pool
Akuna−30.40982145.33432Weir pool
Weir 20a−30.45682145.30090Weir pool
Winbar−30.67888144.90575Weir pool
Nangara Bend−30.91258144.57527Weir pool
Trevallyn−31.38992144.00055Weir pool
Wilga−31.42735143.92540Weir pool
Ellendale−31.73642143.27040Natural
Table 2. Results from radon analysis and EC measurements for the waterholes of the Culgoa and Narran Rivers. A total of 100 samples were collected and analysed for δ 18 O and δ 2 H . During the bathymetric survey (February/March 2015), 33 samples were collected, for which only EC, δ 18 O , and δ 2 H were determined, while the remaining 67 were also measured for radon.
SampleTypeRiverDateRadon (Bq/m3)EC (μS/cm) δ 18 O δ 2 H
BallandoolswCulgoa12/06/2015133.33151.4−0.070.15
BallandoolswCulgoa10/03/2015N/A139.4−0.19−2.84
BrendaswCulgoa10/03/2015N/A140.0−0.31−3.45
Brenda WaterholeswCulgoa13/06/2005174.43162.80.733.12
Brenda Waterhole-1swCulgoa12/06/2015158.74109.80.52−0.63
Brenda Waterhole-2swCulgoa12/06/2015169.34135.90.311.14
Brenda Waterhole-3swCulgoa12/06/2015156.33131.80.200.32
Brenda Waterhole-4swCulgoa12/06/2015159.64105.90.22−0.05
Brenda Waterhole-5swCulgoa12/06/2015166.40105.20.21−0.22
Brenda Waterhole-6swCulgoa12/06/2015205.38106.50.200.13
Brenda Waterhole-7swCulgoa12/06/2015177.3096.80.19−0.95
Brenda Waterhole-8swCulgoa12/06/2015182.01125.50.050.81
Brenda WeirpoolswCulgoa11/02/2015N/A137.7−0.63−4.19
CaringleswCulgoa26/02/2015N/A126.5−1.73−10.16
CubbieswCulgoa10/06/2015158.55147.6−0.56−1.42
CubbieswCulgoa18/02/2015N/A107.5−2.24−10.13
CulgoaswCulgoa12/03/2015N/A150.50.03−3.68
CulgoaNP-1swCulgoa13/06/2015128.64167.82.538.60
CulgoaNP-2swCulgoa13/06/2015169.21172.52.517.66
CulgoaNP-3swCulgoa13/06/2015200.61143.72.557.78
CulgoaNP-4swCulgoa13/06/2015172.33142.32.639.96
GurrawarraswCulgoa15/03/2015N/A203.01.744.30
IngieswCulgoa17/02/2015N/A108.0−2.36−10.12
Ingie-1swCulgoa26/05/201540.13112.0−0.43-2.75
Ingie-2swCulgoa26/05/201542.74124.0−0.43-2.16
Ingie-3swCulgoa26/05/201576.97123.0−0.45−0.55
Ingie-3swCulgoa26/05/201559.96217.0−0.43−3.22
InnisfalswCulgoa14/03/2015N/A125.6−0.06−0.47
Innisfall-1swCulgoa29/05/201566.2596.0−3.09−14.84
Innisfall-2swCulgoa29/05/201576.4784.0−3.18−16.28
Innisfall-3swCulgoa29/05/201569.9485.0−3.07−15.32
Innisfall-4swCulgoa29/05/201553.7587.0−3.08−16.12
LillyfieldswCulgoa15/03/2015N/A201.01.793.81
Lilyfield-1swCulgoa29/05/201553.7579.0−2.68−15.05
Lilyfield-2swCulgoa29/05/201590.8377.0N/AN/A
Lilyfield-3swCulgoa29/05/201571.8979.0N/AN/A
Lilyfield-4swCulgoa29/05/201548.2178.0−2.75−14.93
WarraweenaswCulgoa15/03/2015N/A198.81.623.45
Weilmoringie WeirswCulgoa12/03/2015N/A150.4−0.31−3.04
Weilmoringle Weir-1swCulgoa14/06/2015124.10122.92.134.16
Weilmoringle Weir-2swCulgoa14/06/2015165.61142.8N/AN/A
Weilmoringle Weir-3swCulgoa14/06/2015119.08140.82.658.93
Weilmoringie Weir-4swCulgoa13/06/2015234.81195.22.166.38
Weilmoringle StationswCulgoa12/03/2015N/A146.7−0.01−3.28
WestmundaswCulgoa13/06/2015114.7297.8−2.26−12.19
WestmundaswCulgoa14/03/2015N/A143.00.19−1.60
WoolerbillaswCulgoa17/02/2015N/A110.1−2.38−10.46
Woolerbilla-1swCulgoa13/06/2015N/A161.1−0.34−1.43
Woolerbilla-2swCulgoa13/06/2015N/A163.3−0.29−0.38
Woolerbilla-3swCulgoa13/06/2015N/A164.3−0.24−0.74
AmarooswNarran13/05/2015N/A156.82.046.18
Amaroo-1swNarran28/05/2015114.86274.04.7919.32
Amaroo-14swNarran28/05/201584.86290.04.8218.39
Amaroo-15swNarran28/05/201579.44289.04.8118.29
Amaroo-17swNarran28/05/2015114.44283.04.7918.86
Amaroo-2swNarran28/05/201578.33285.04.7518.57
Amaroo-20swNarran28/05/2015115.14292.04.7918.48
BangateswNarran21/02/2015N/A150.1−0.52−0.48
BelvedereswNarran22/02/2015N/A164.80.041.19
BilBilswNarran21/02/2015N/A158.5−0.230.24
BomaliswNarran22/02/2015N/A170.90.030.02
Bomali-2swNarran16/06/2015225.54191.81.968.04
Bomali-3swNarran16/06/2015201.95194.84.0314.02
BooligarswNarran13/06/2015116.27156.70.351.37
BooligarswNarran20/02/2015N/A119.5−2.05−10.99
ClydeswNarran19/02/2015N/A101.6−2.22−11.00
Clyde 1swNarran11/06/2015176.42104.6−0.06−1.80
Clyde 2swNarran11/06/2015170.87101.2−0.22−2.48
Clyde 3swNarran11/06/2015155.99101.1−0.22−2.51
GlenogieswNarran20/02/2015N/A124.0−1.84−11.00
GoldenPlainsswNarran24/02/2015N/A165.9−0.09−1.36
GSA22206AswNarran19/02/2015N/A107.6−2.16−12.13
GSA22206A-1swNarran26/05/201540.13122.0−0.57−2.53
GSA22206A-2swNarran26/05/2015110.97119.0−0.49−2.68
GSA22206A-3swNarran27/05/2015135.97115.0−0.61−3.30
GSA22206A-4swNarran26/05/201557.28114.0−0.59−2.11
KilarneyswNarran13/03/2015N/A200.01.596.84
Killarny-10swNarran15/06/2015203.77165.73.5513.95
Killarny-12swNarran15/06/2015203.22211.03.5414.03
Killarny-13swNarran15/06/2015142.18213.03.6214.93
Killarny-5swNarran15/06/2015215.23211.04.4017.01
Killarny-6swNarran15/06/2015269.79190.24.1216.10
Killarny-7swNarran15/06/2015207.73164.23.8215.14
Killarny-8swNarran15/06/2015238.00213.03.5514.15
Killarny-8swNarran15/06/2015142.08N/AN/AN/A
Killarny-9swNarran15/06/2015225.29165.23.5314.11
Narran Park 7swNarran27/05/2015N/A250.0N/AN/A
Narran Park 8swNarran27/05/201593.19253.04.5918.29
Narran Park 9swNarran27/05/2015101.53247.04.2918.50
Narran Park 10swNarran27/05/201579.96251.04.2416.80
Narran Park 12swNarran27/05/201581.90248.04.2117.06
Narran Park 13swNarran27/05/201595.28244.04.4218.44
Narran Park-bankgwNarran27/05/20152779.1710,600.04.2216.53
Narran PlainsswNarran15/06/2015234.98233.05.1418.27
NarrandoolswNarran24/02/2015N/A141.2−0.95−6.04
Narrandool-1swNarran14/06/2015187.04184.61.996.51
Narrandool-2swNarran14/06/2015182.22125.72.124.49
Narrandool-3swNarran14/06/2015208.59127.5N/AN/A
NarranParkswNarran23/02/2015N/A185.60.644.97
NarranPlainsswNarran23/02/2015N/A184.10.57−5.57
Goodooga RainrainRain26/05/2015N/A81.0−2.63−9.51
Table 3. Data obtained from 12 surface water samples and 8 groundwater samples along the Darling River from Brewarrina to the west of Tilpa.
SampleTypeDateEC (μS/cm)T°CDO (mg/L)Radon (Bq/m3) δ 18 O δ 2 H
Sommervillesw28/09/15 12:0039520.38.956.1−1.67−13.28
Jandrasw28/09/15 14:0034722.710.1247.7−2.95−19.12
Hells Gate upstreamsw28/09/15 17:0049921.71073.5−2.60−18.63
Hells Gate downstreamsw28/09/15 17:0050420.29.7265.9−2.57−18.24
Akunasw29/09/15 07:4047417.96.99102.2−1.32−8.62
Weir 20Asw29/09/15 08:3045318.3783.8−1.62−10.21
Winbarsw29/09/15 11:2049518.88.6837.1−1.12−8.78
Nangara Bendsw29/09/15 12:0045920.58.922.1−0.81−7.90
Trevallynsw29/09/15 14:00350218.443.4−1.14−7.84
Wilgasw29/09/15 14:4034819.68.0238.3−1.10−7.43
Weir 19A downstreamsw10/01/15 08:0030918.19.3723.8−2.84−19.64
Weir 19A upstreamsw10/01/15 08:0031017.76.8428.2−2.95−19.88
B36842-1gw29/09/15 16:0054123.30.145343.8−3.54−28.48
B36842-2gw29/09/15 16:00197623.20.474.5−3.64−29.24
B36852-1gw30/09/15 09:3034,57023.90.386739.6−4.04−31.45
B36852-2gw30/09/15 09:3035,120243.74687.5−3.69−29.24
B36937-1gw30/09/15 13:3012,70024.40.112905.2−4.85−35.17
B36937-2gw30/09/15 13:3040,37024.40.11318.8−4.16−32.50
B36853-1gw10/01/15 09:1537723.80.1113,236.1−3.45−25.24
B36853-2gw10/01/15 09:1535,08923.91.37178.8−4.12−31.88
Disclaimer/Publisher’s Note: The statements, opinions and data contained in all publications are solely those of the individual author(s) and contributor(s) and not of MDPI and/or the editor(s). MDPI and/or the editor(s) disclaim responsibility for any injury to people or property resulting from any ideas, methods, instructions or products referred to in the content.

