
Impact of Three Gorges Reservoir Operation on Water Level at Jiujiang Station and Poyang Lake in the Yangtze River


Abstract
:1. Introduction
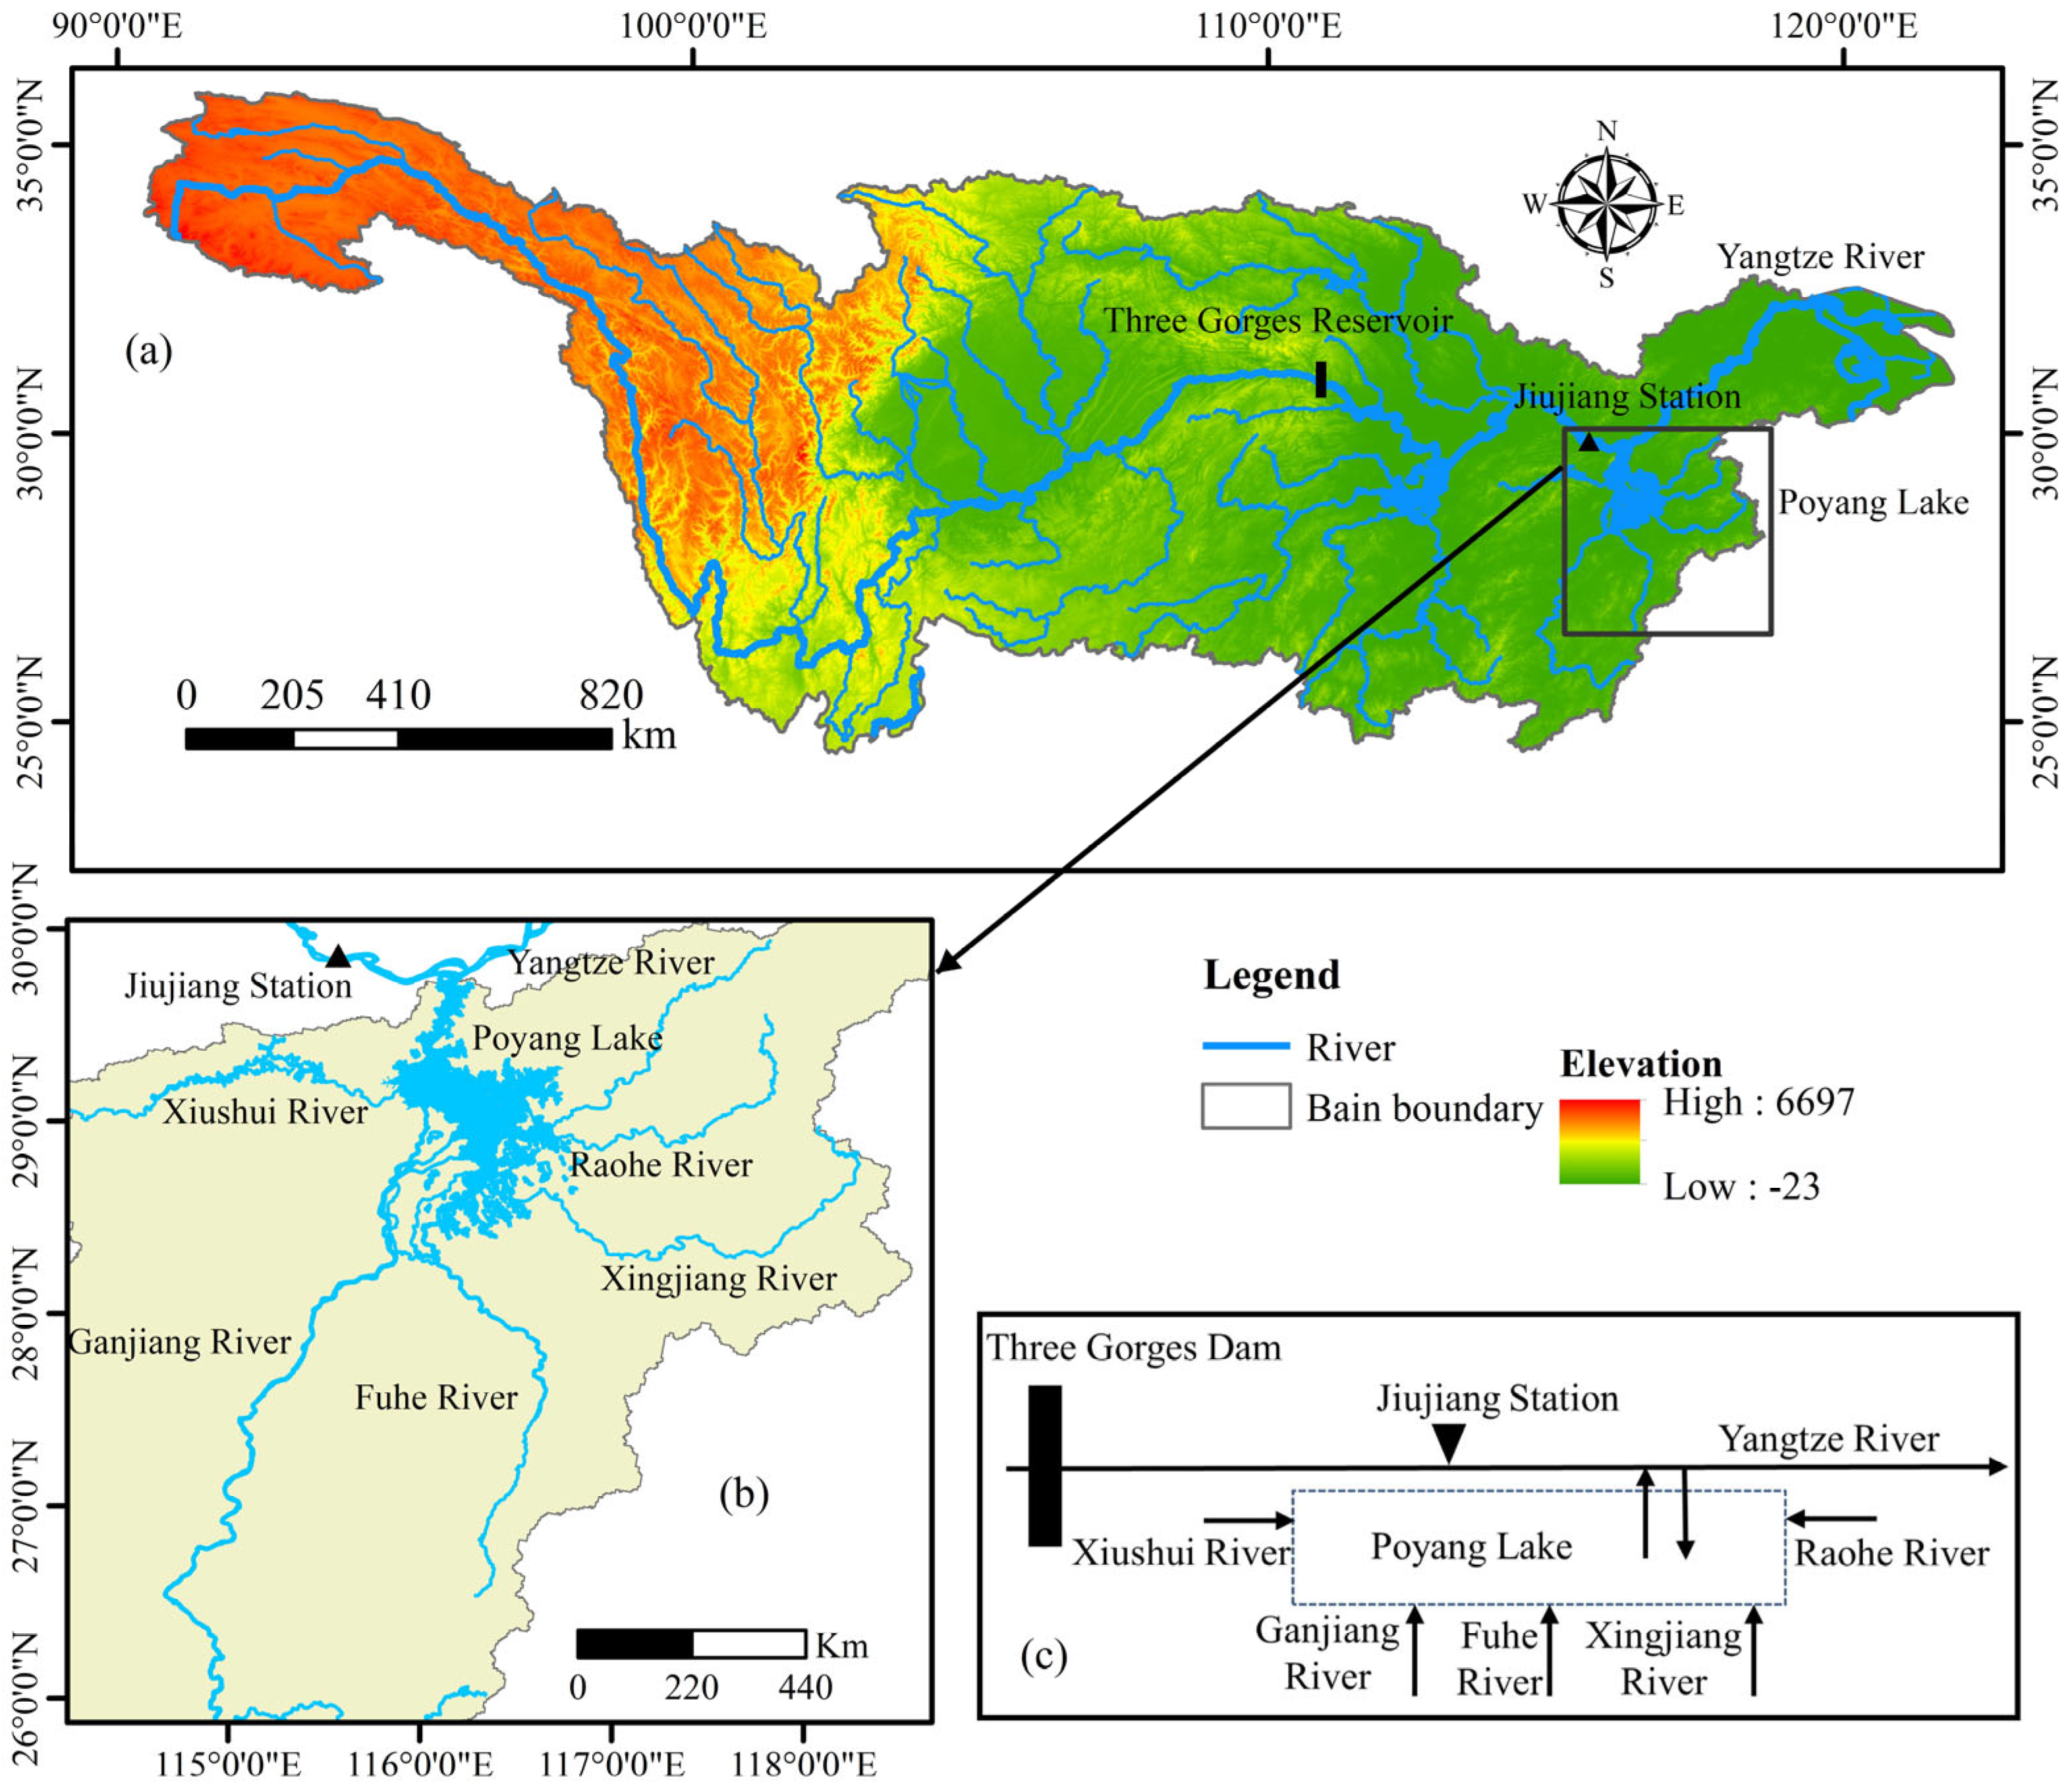
2. Study Area and Materials
3. Methodologies
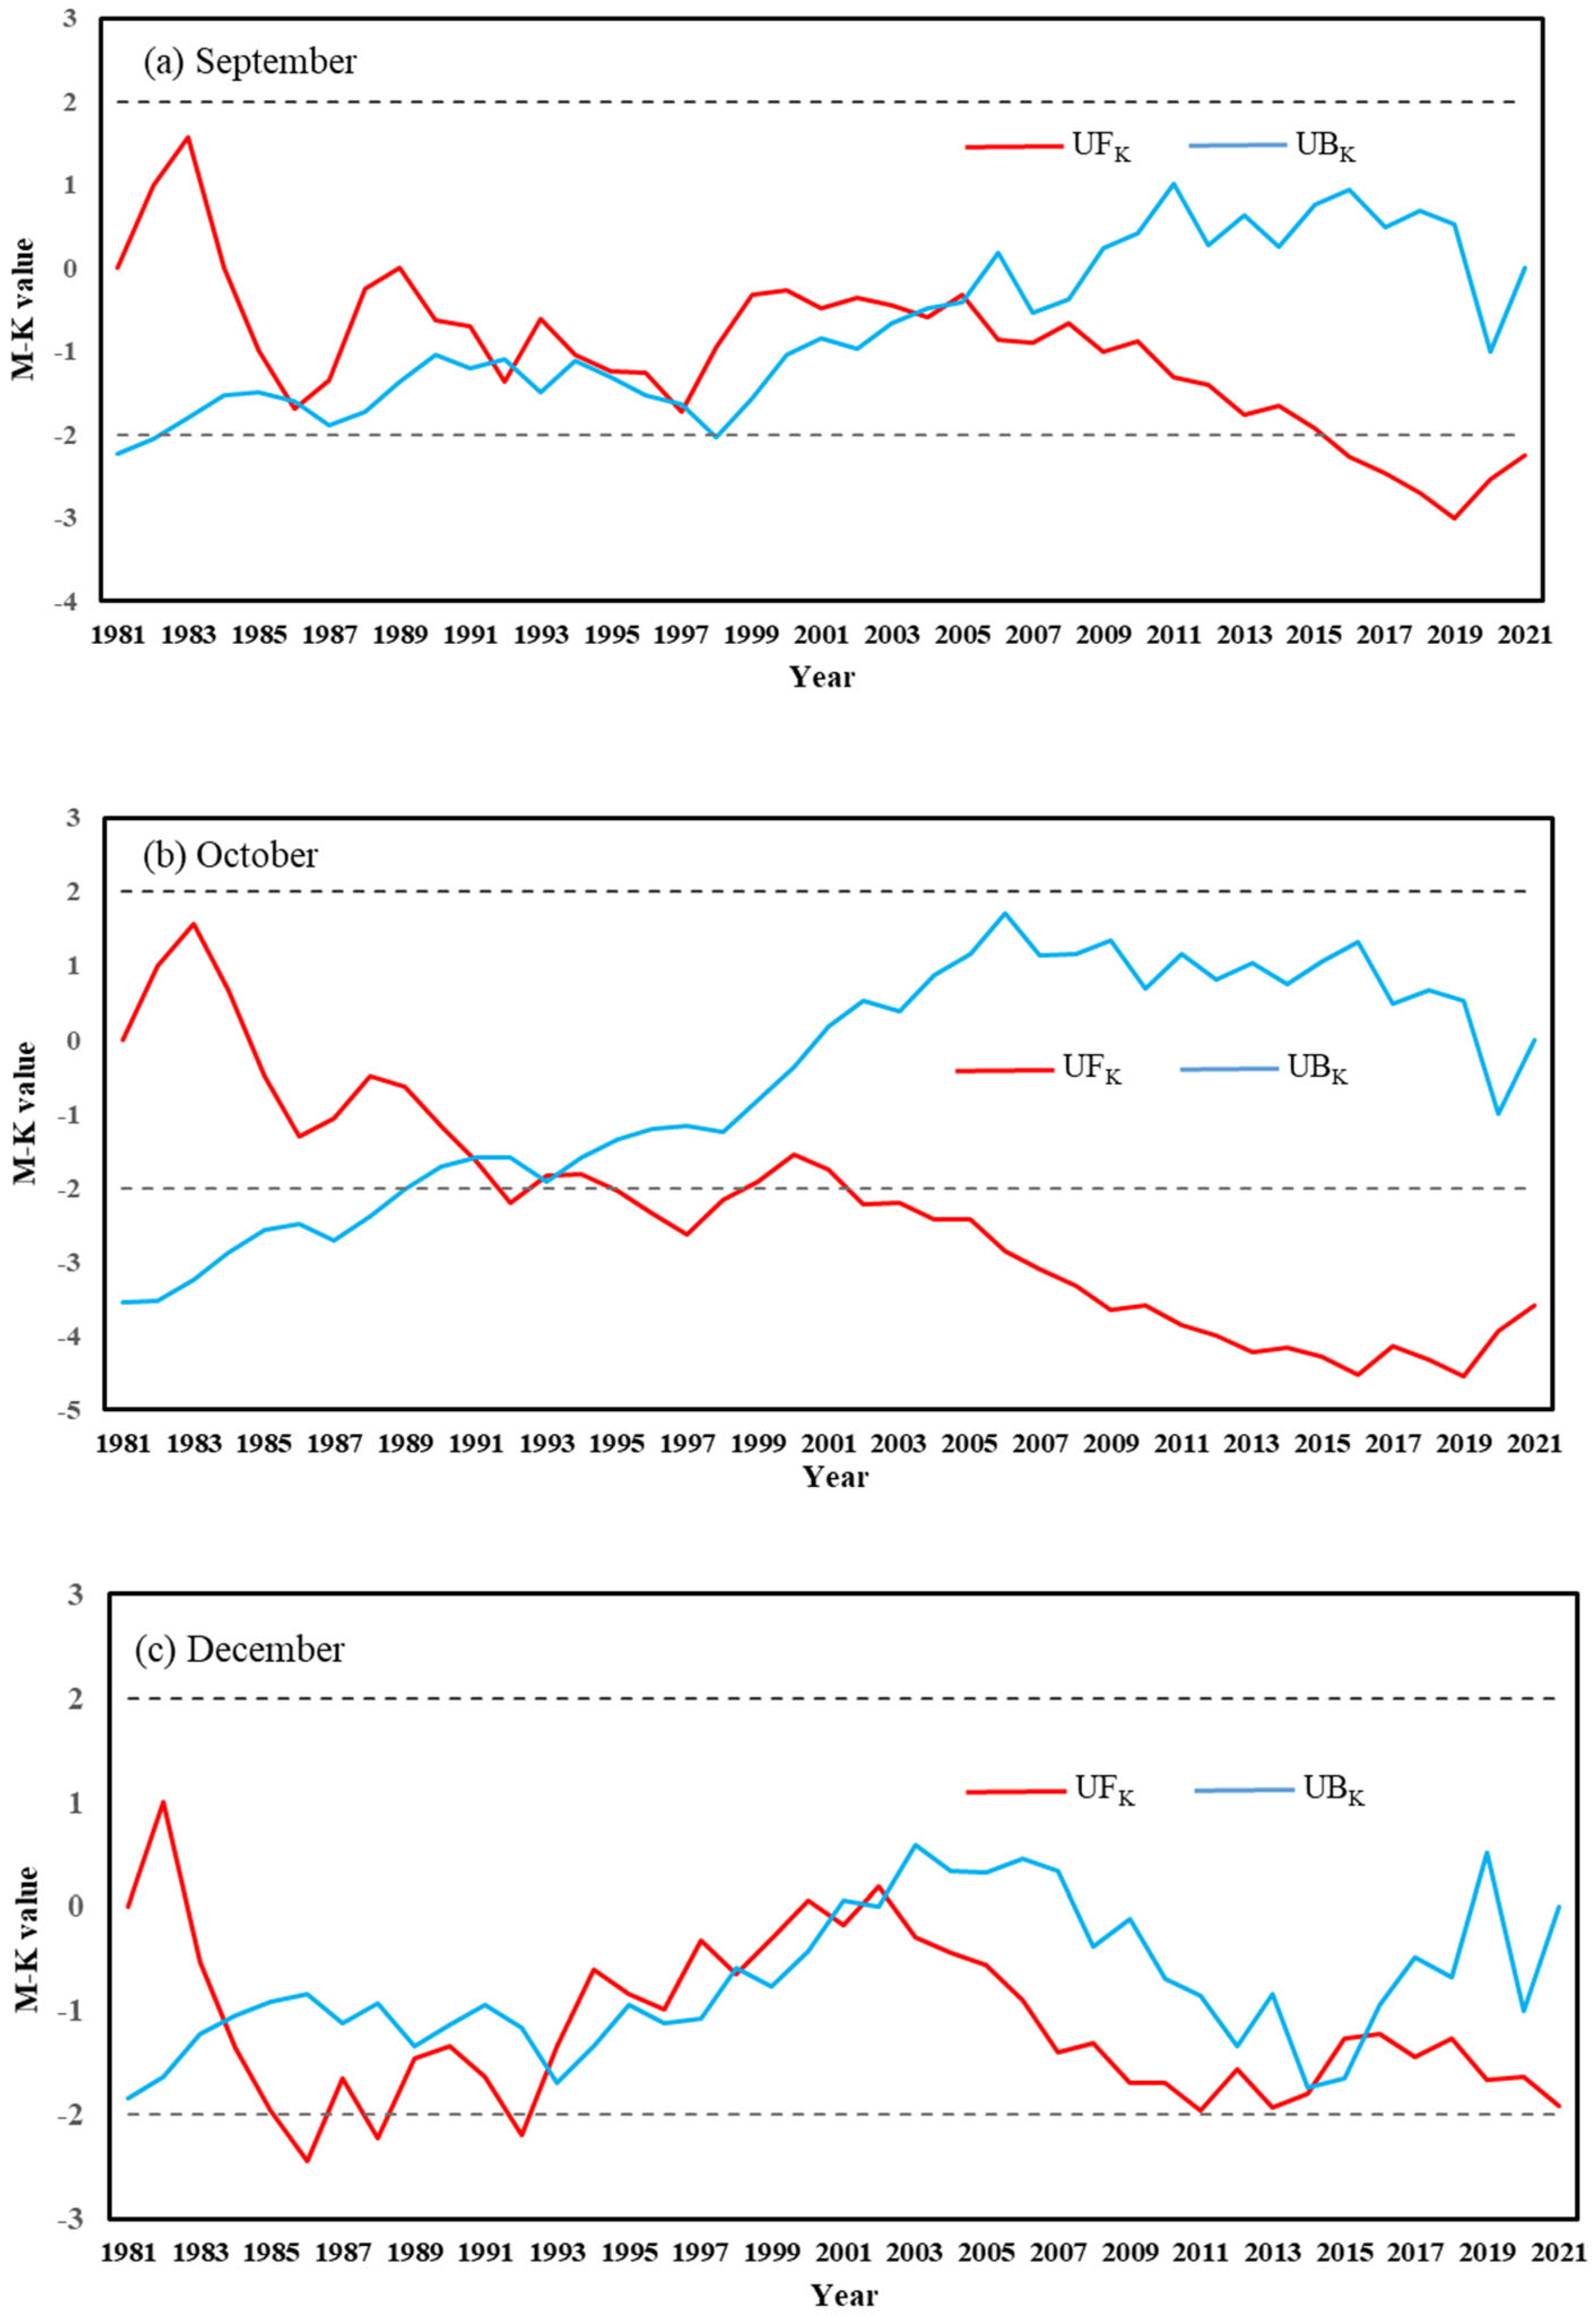
3.1. Mann-Kendall Test
3.2. LSTM Neural Network Model
3.3. Partial Dependence Plot
3.4. Evaluation Metrics
4. Result Analysis and Discussion
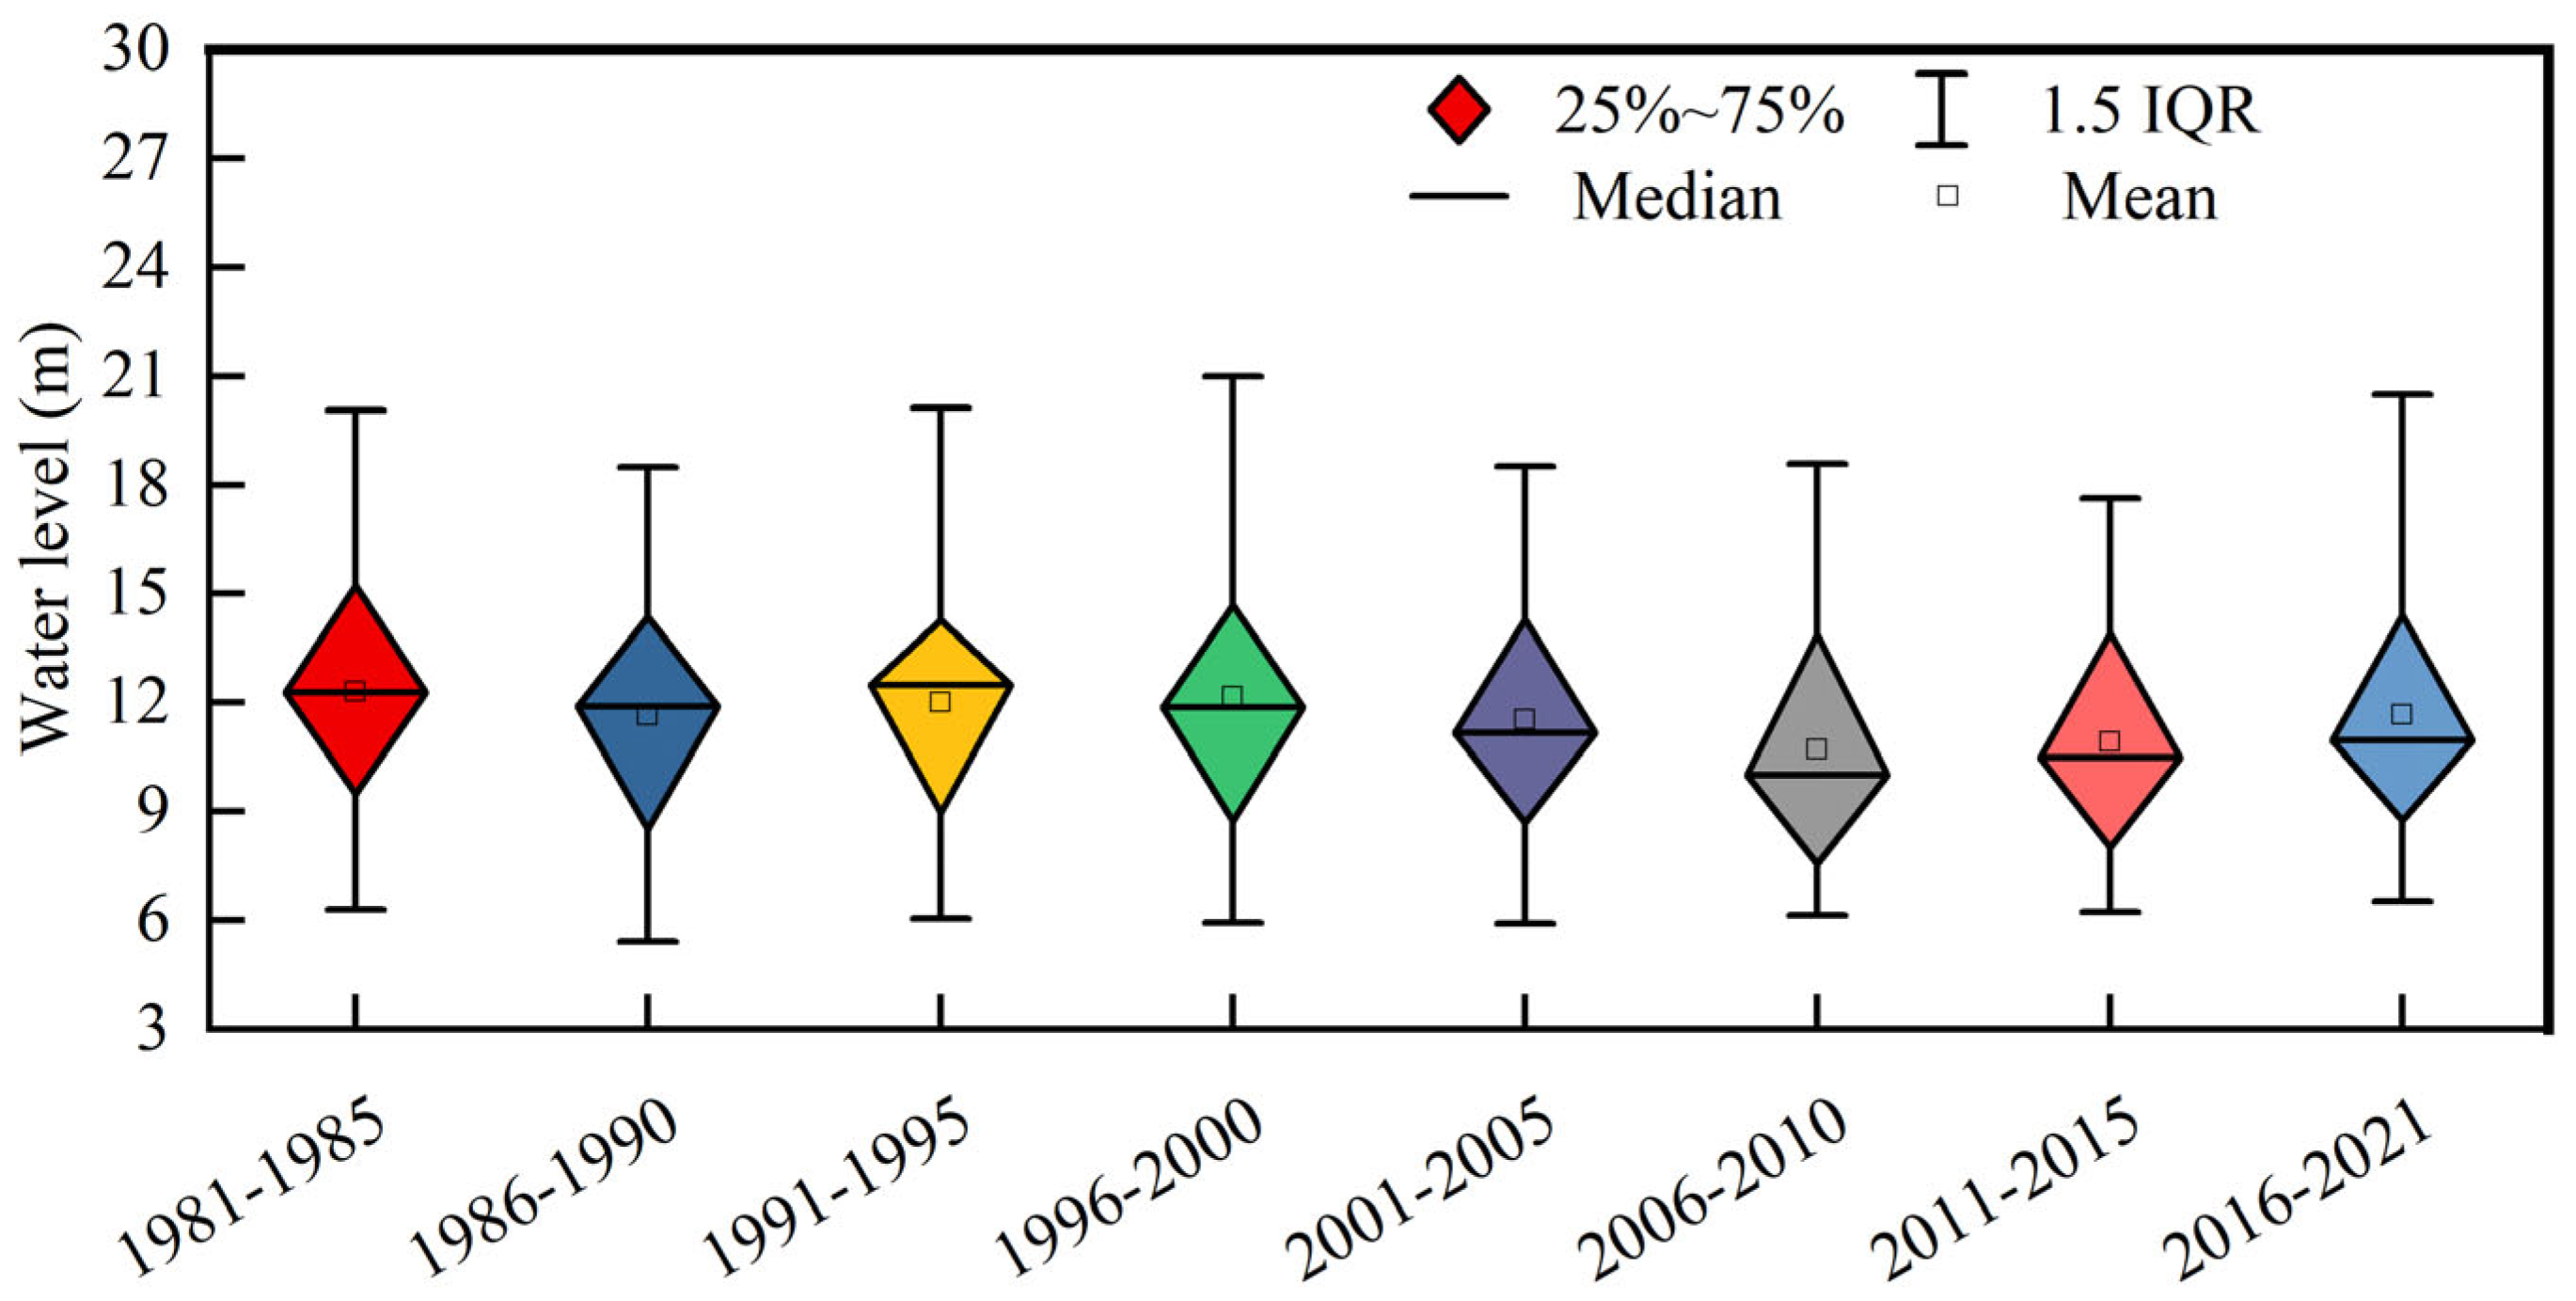
4.1. Hydrological Change Trends at JJS
- (1)
- Change trend of water level
- (2)
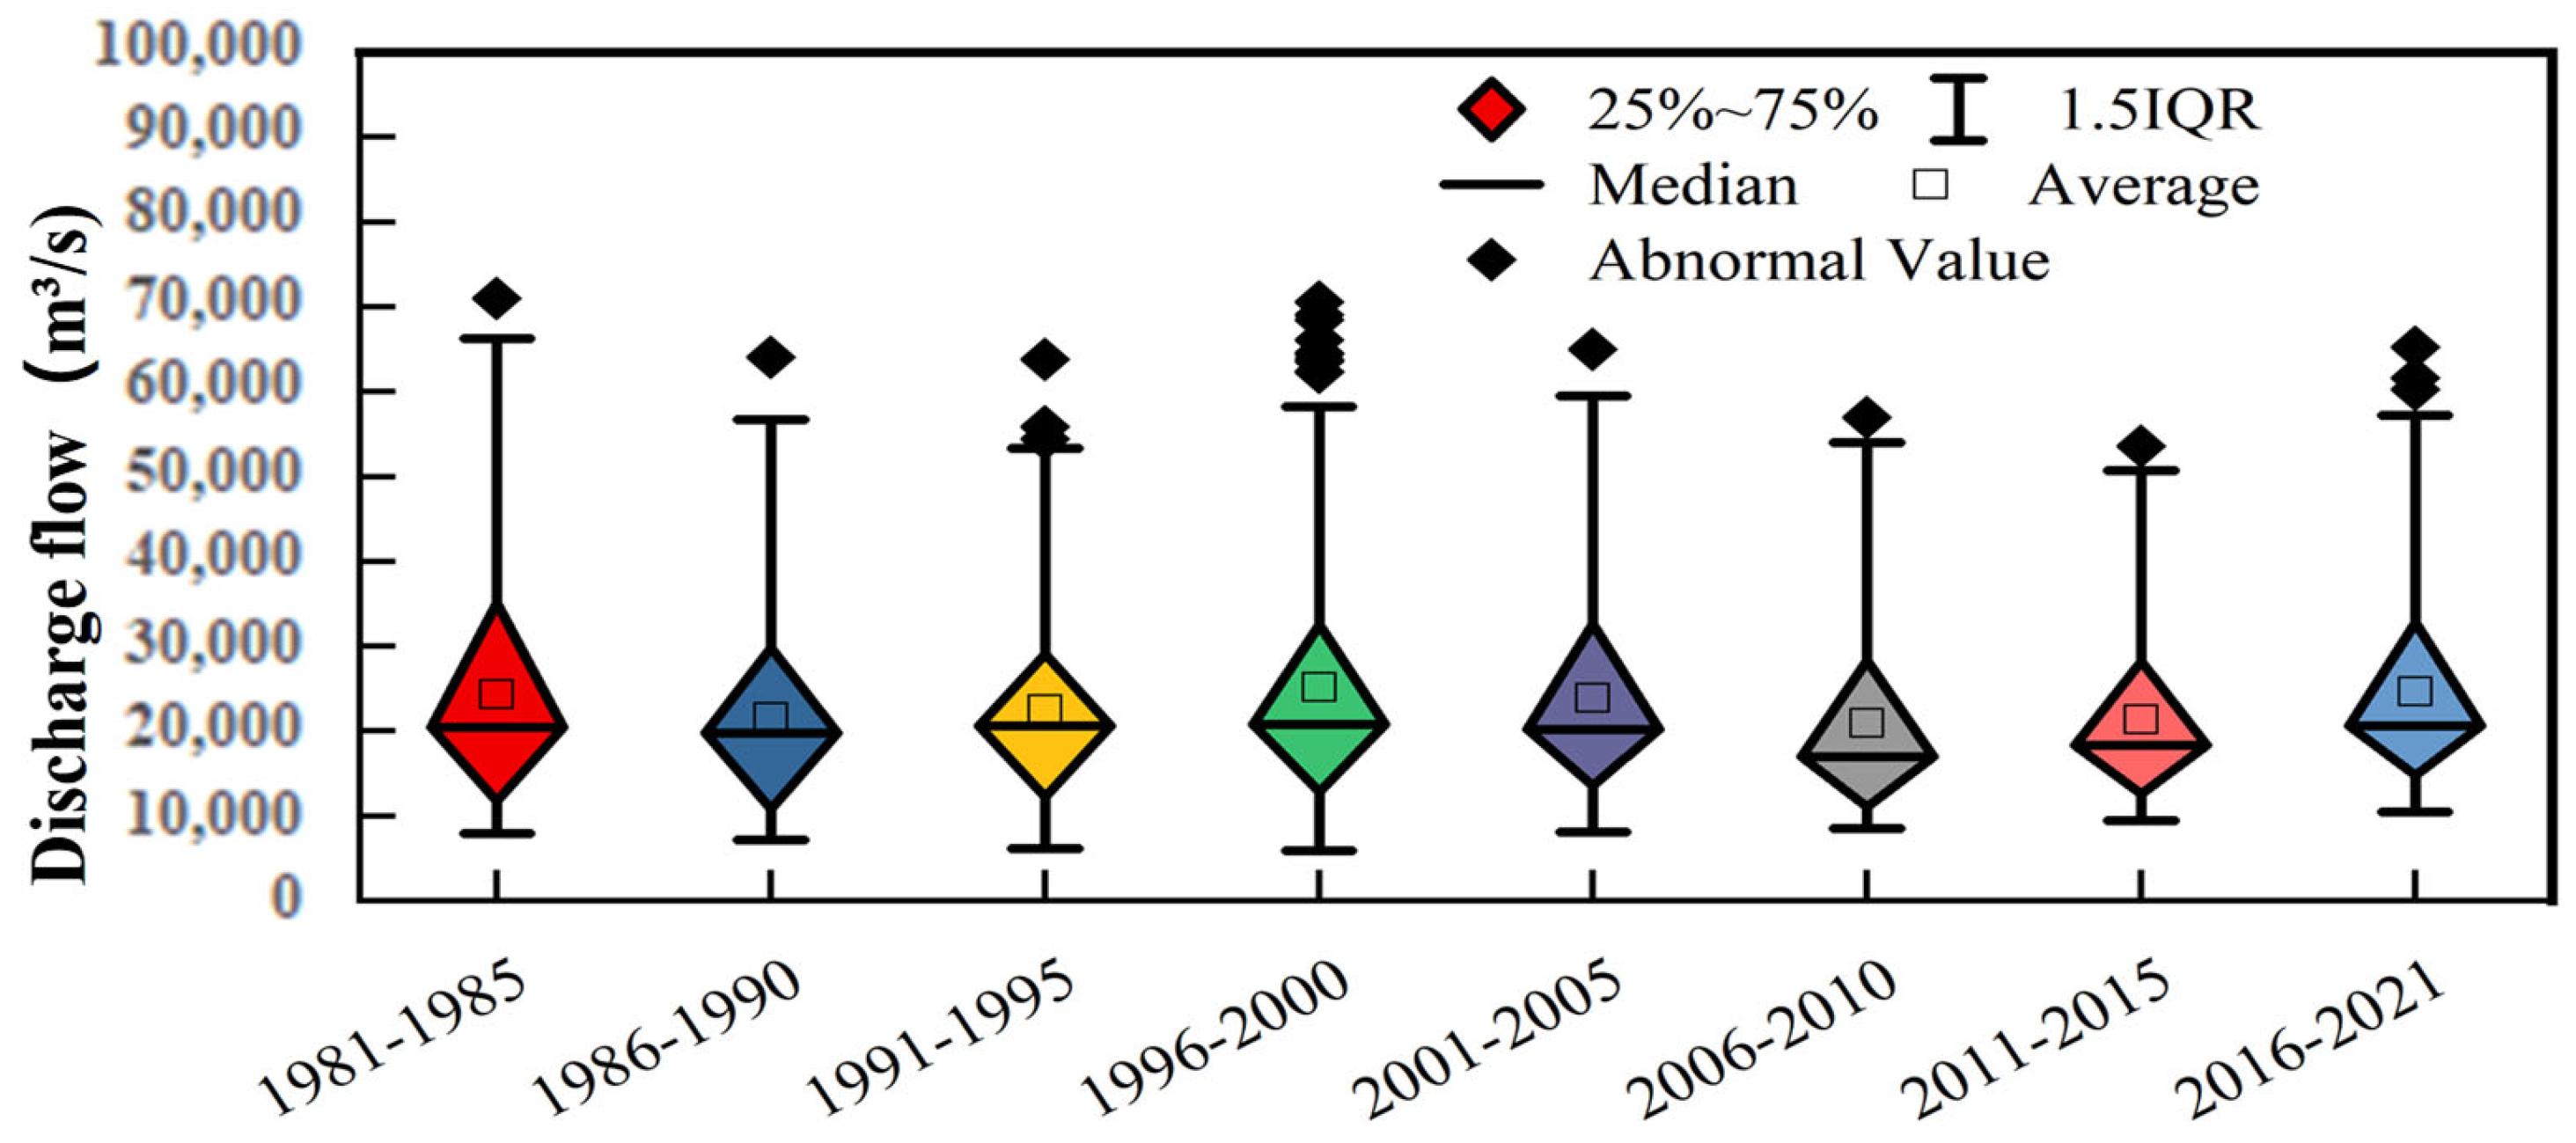
- Change trend of flow discharge
4.2. Inflow Volume Changes of TGR
- (1)
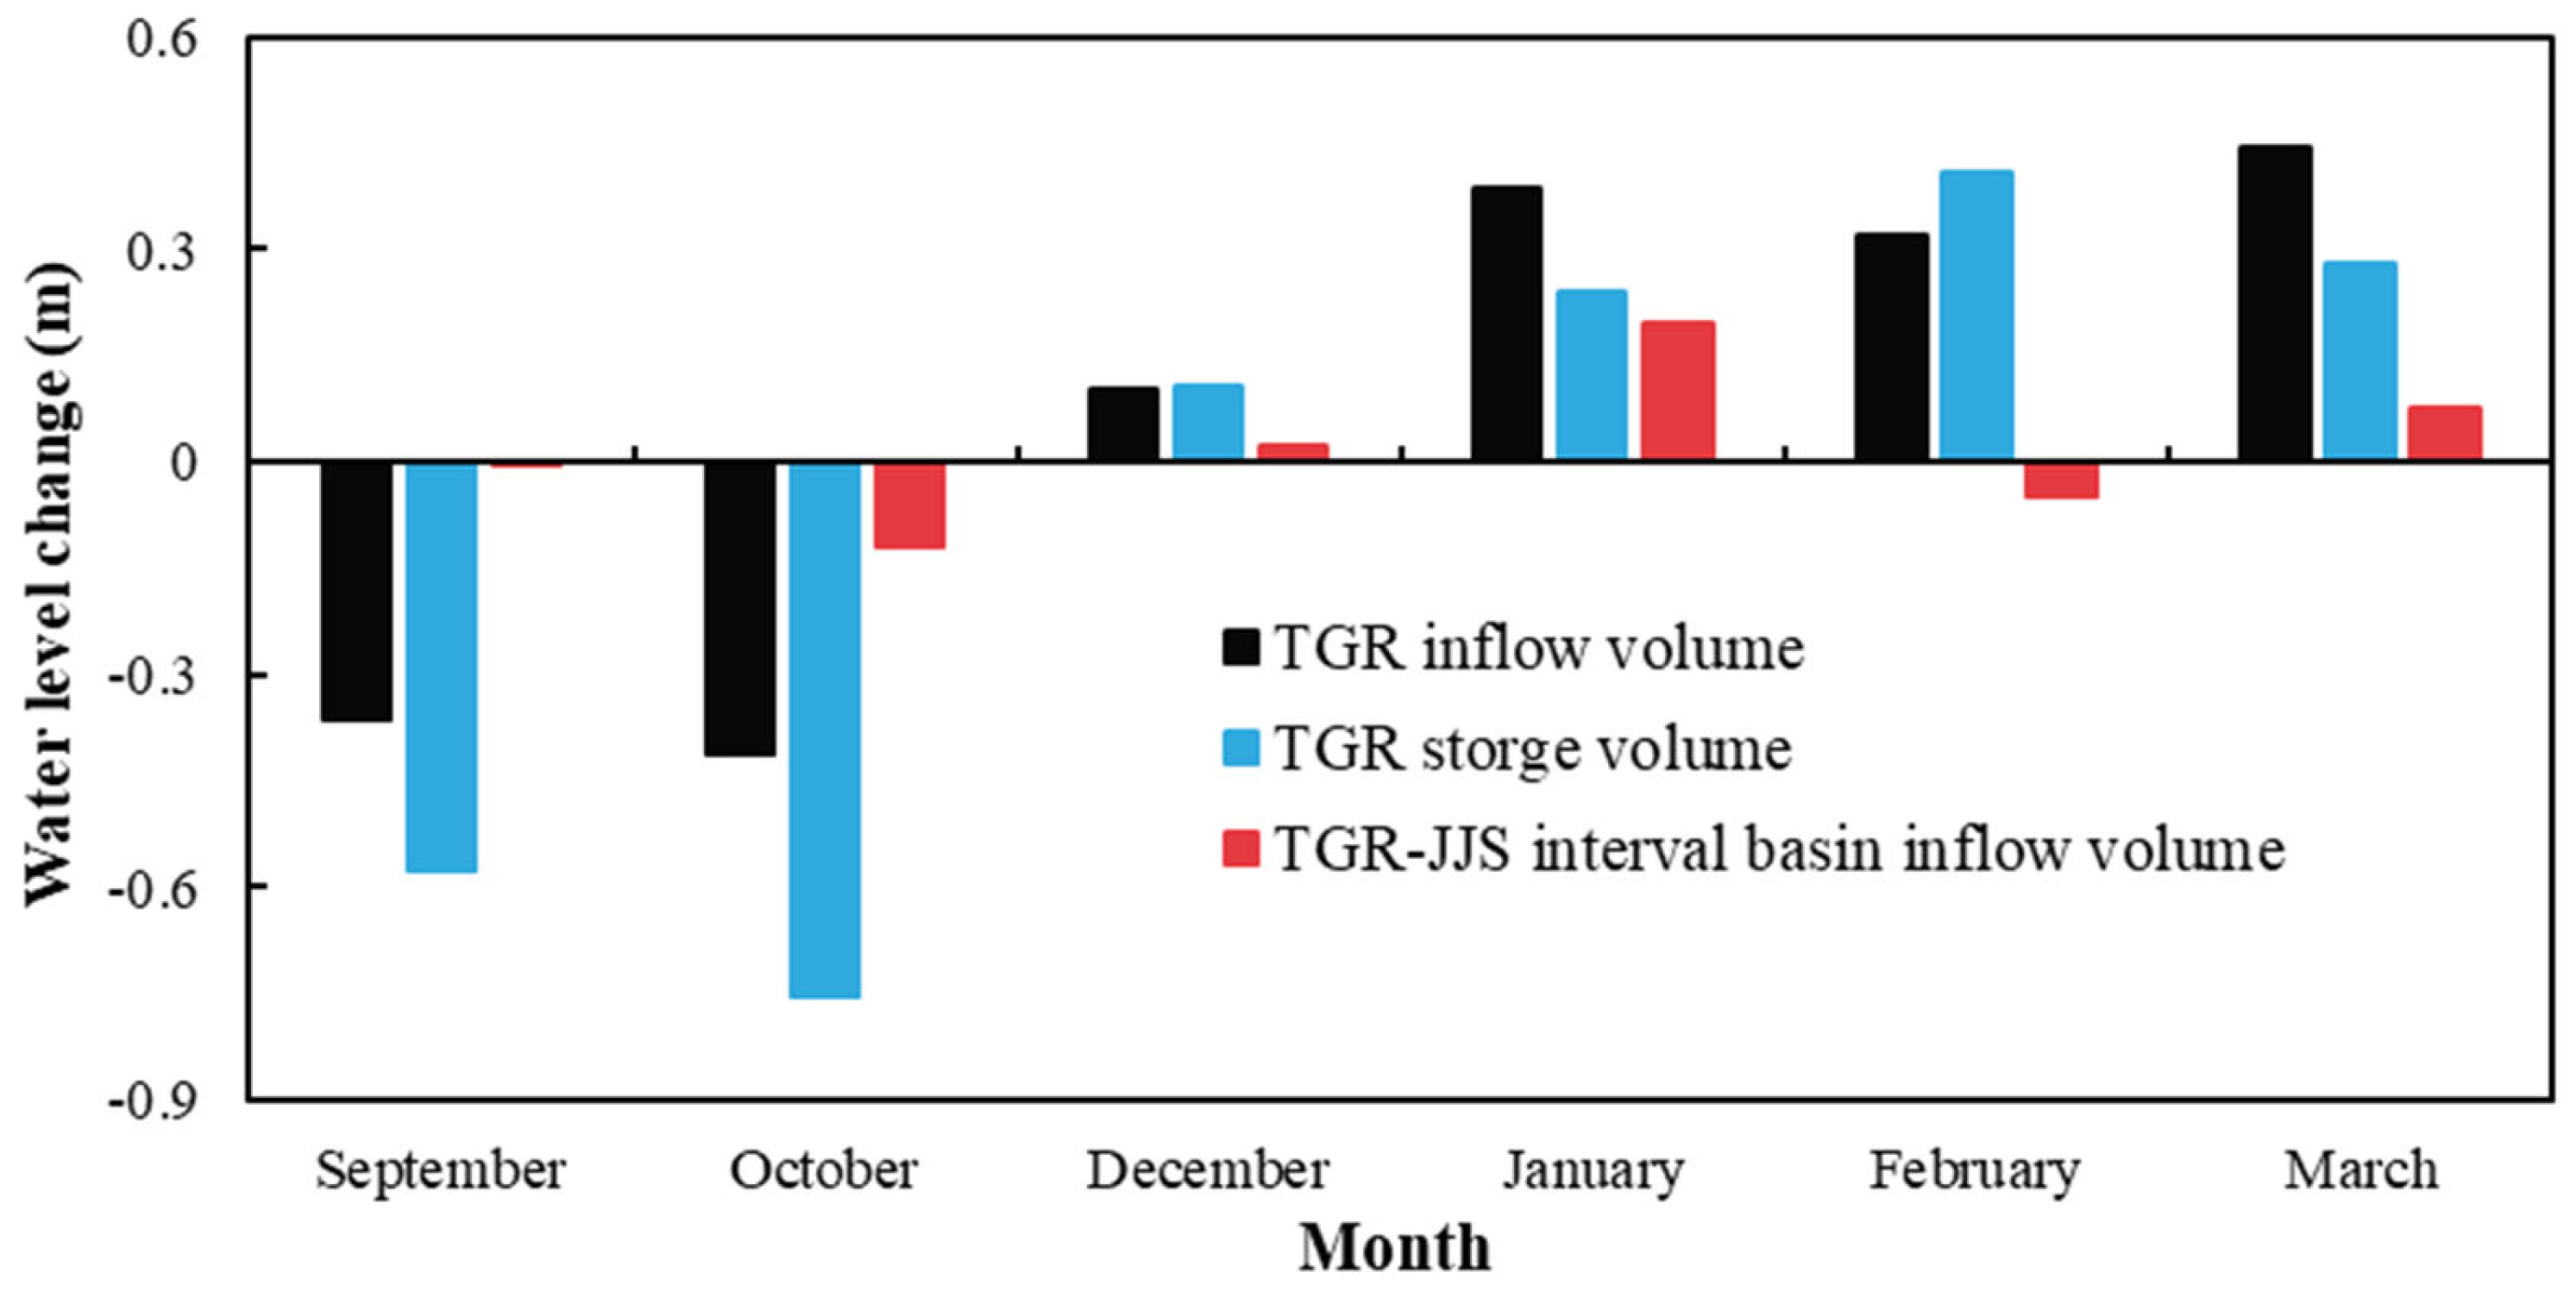
- Inflow volume changes of TGR
4.3. Flow Volume Changes at JJS
4.4. Water Level Changes at JJS
- (1)
- Factors of flow discharge and riverbed incision at JJS
- (2)
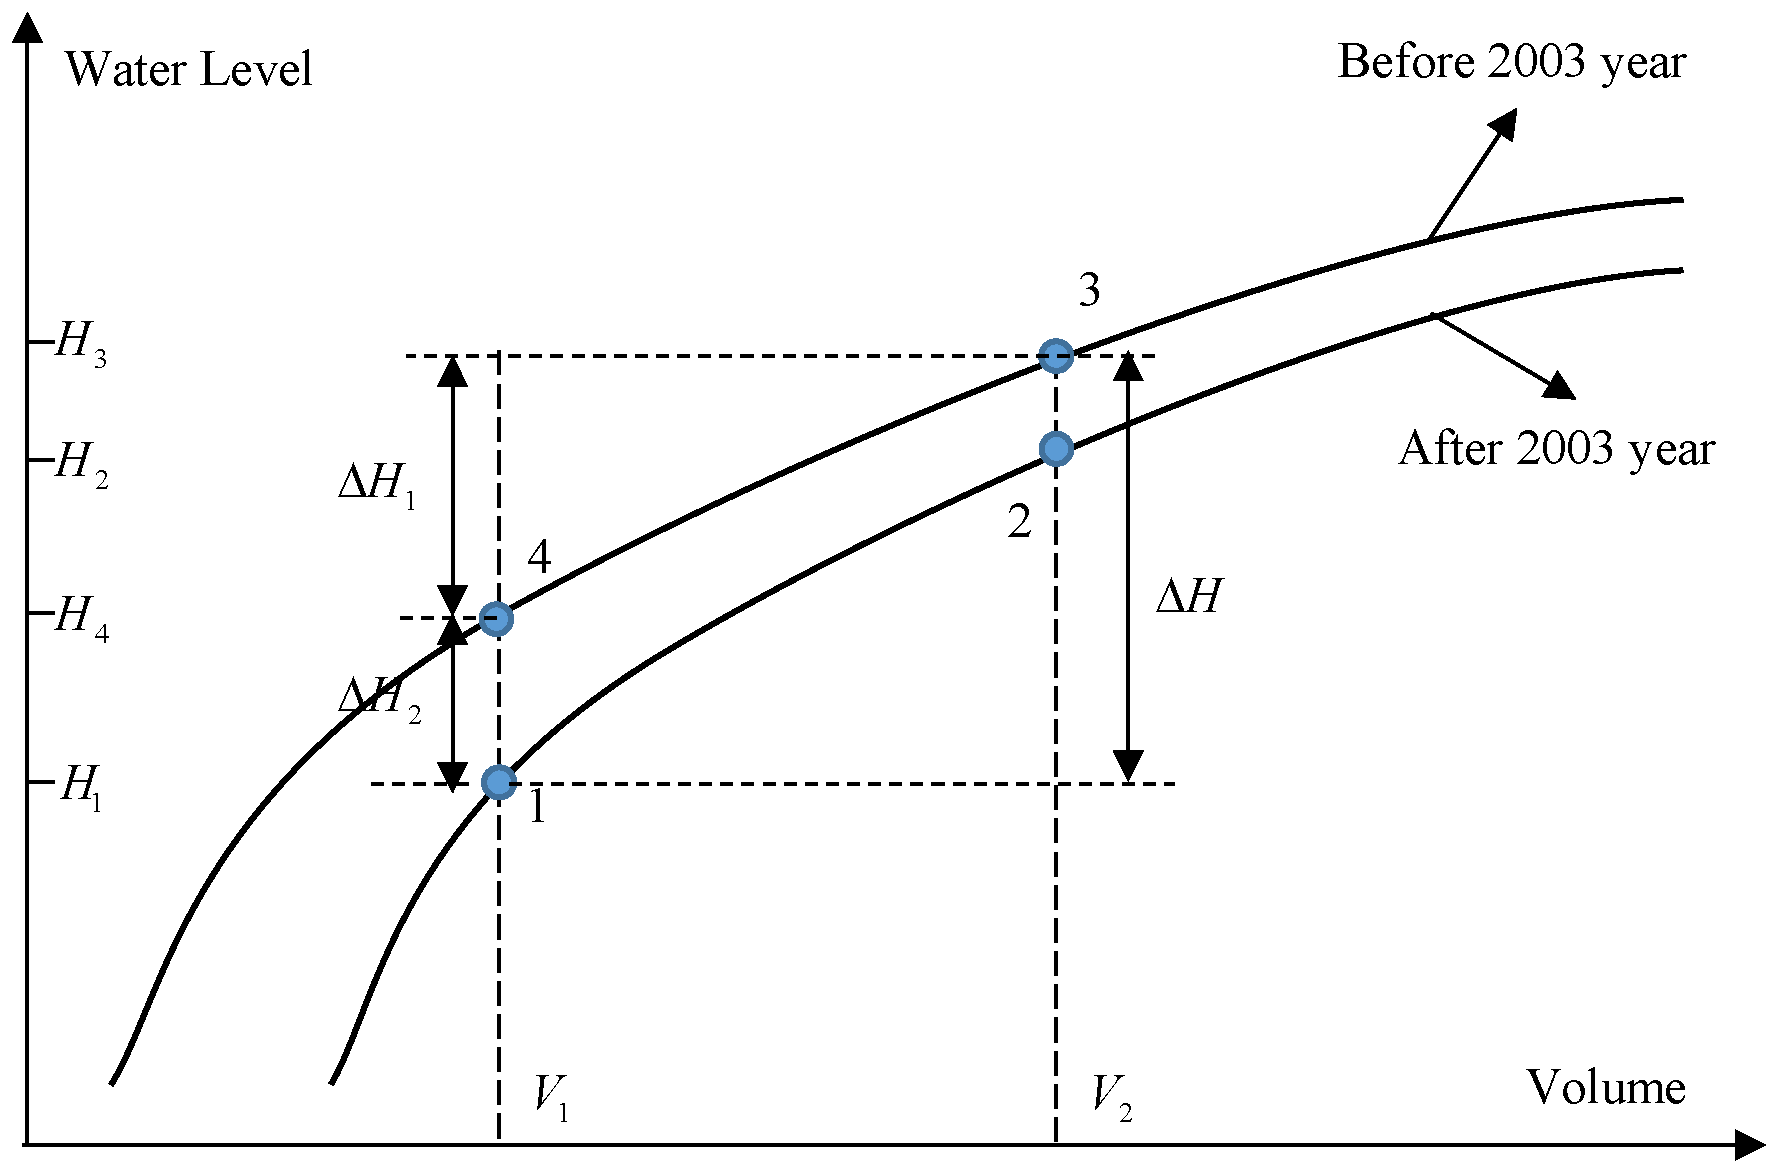
- Factors of TGR operation
5. Conclusions
- (1)
- After the operation of TGR in 2003, the annual average of monthly water levels at JJS are decreased by −1.74 m, −2.11 m, and −0.78 m in September, October, and December, respectively, and are slightly decreased by −0.02 m and −0.18 m in January and February, with a little rise of 0.12 m in March.
- (2)
- The annual average monthly water levels at JJS are decreased 0.59 m and 1.11 m, which are caused by riverbed incision and TGR outflow discharge during the impoundment period, respectively. From December to March of the following year, the water levels at JJS are reduced 0.99 m due to riverbed incision and rise 0.63 m with the increasement of TGR outflow discharge in the drawdown period.
- (3)
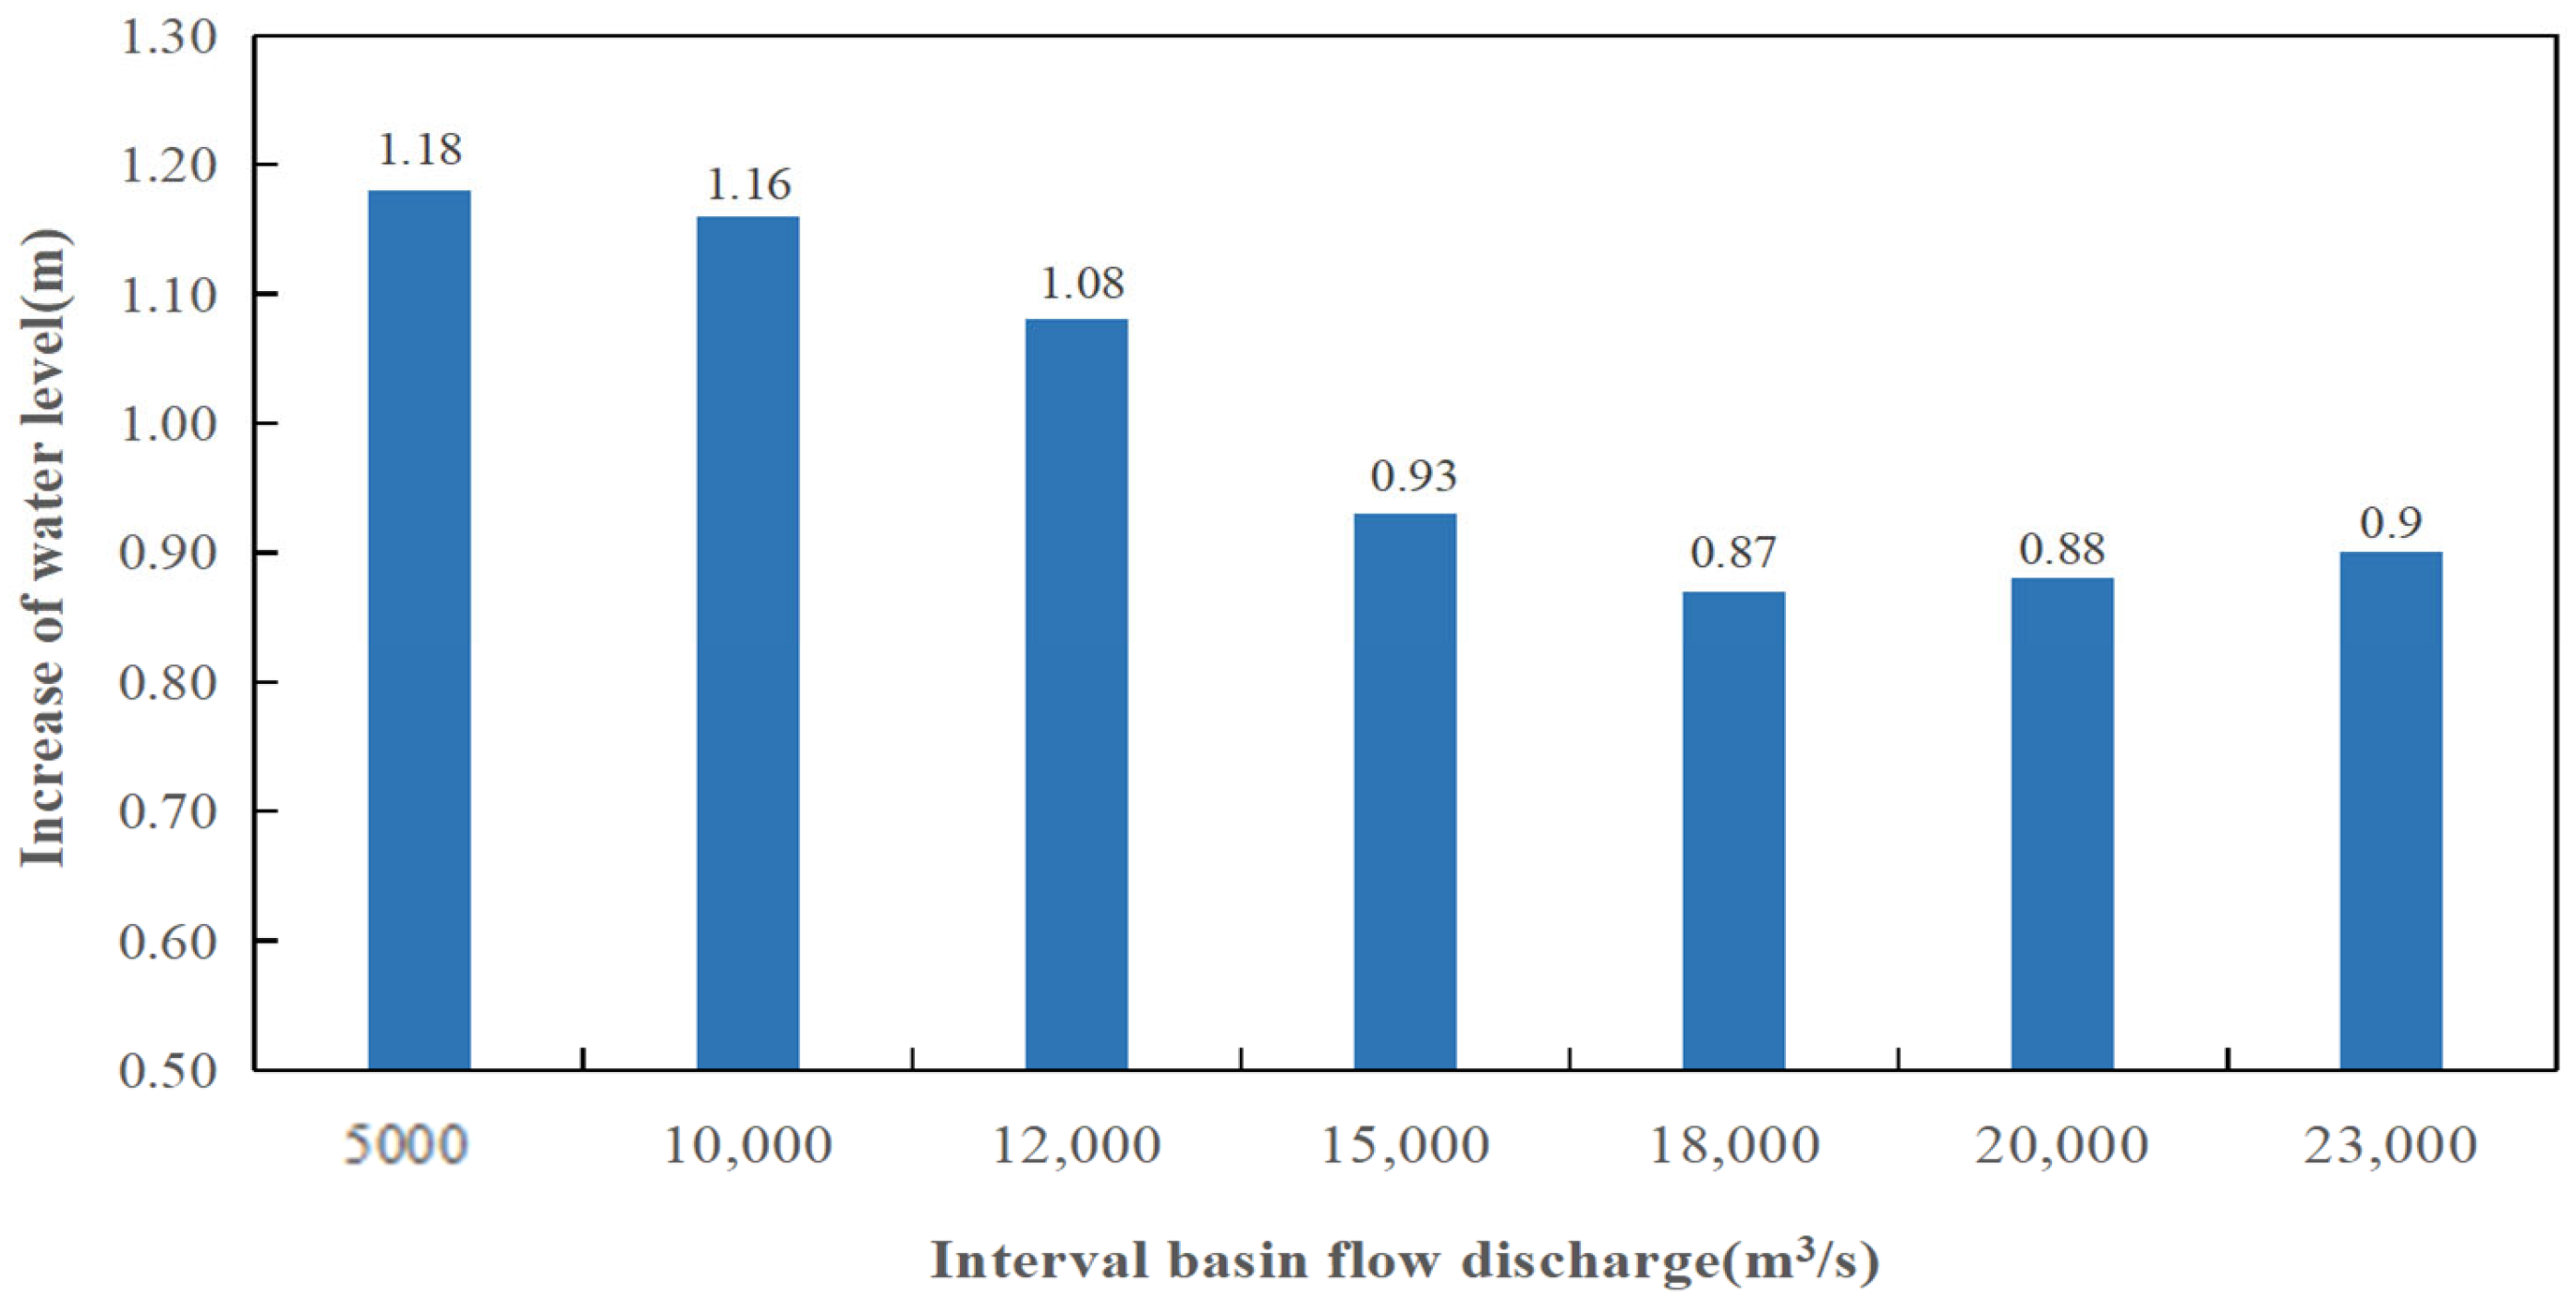
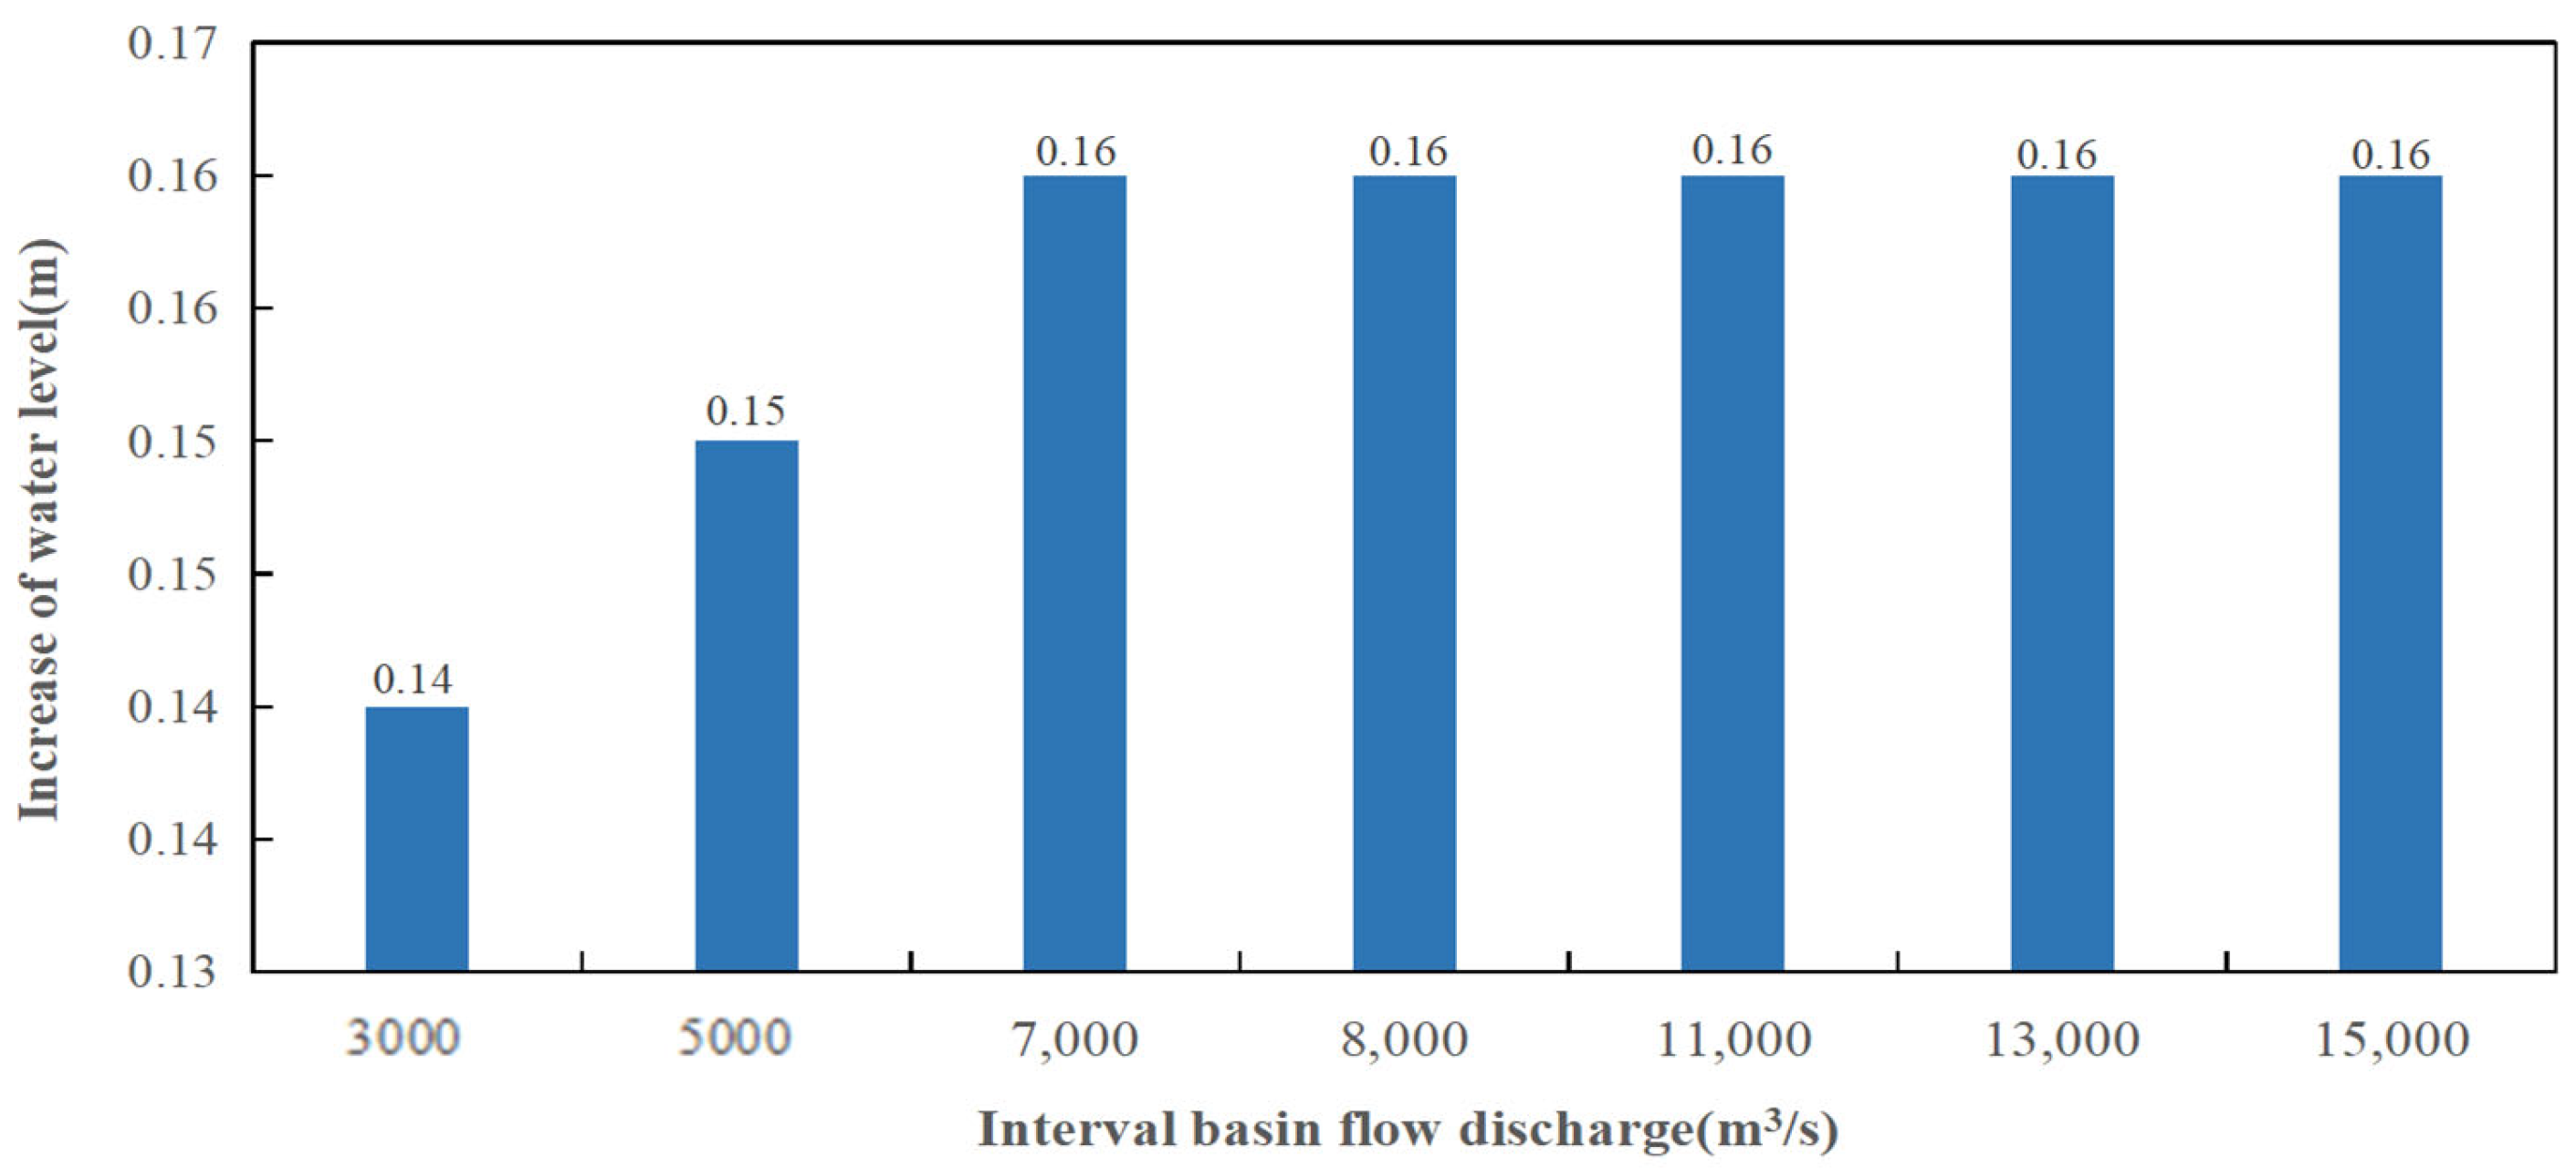
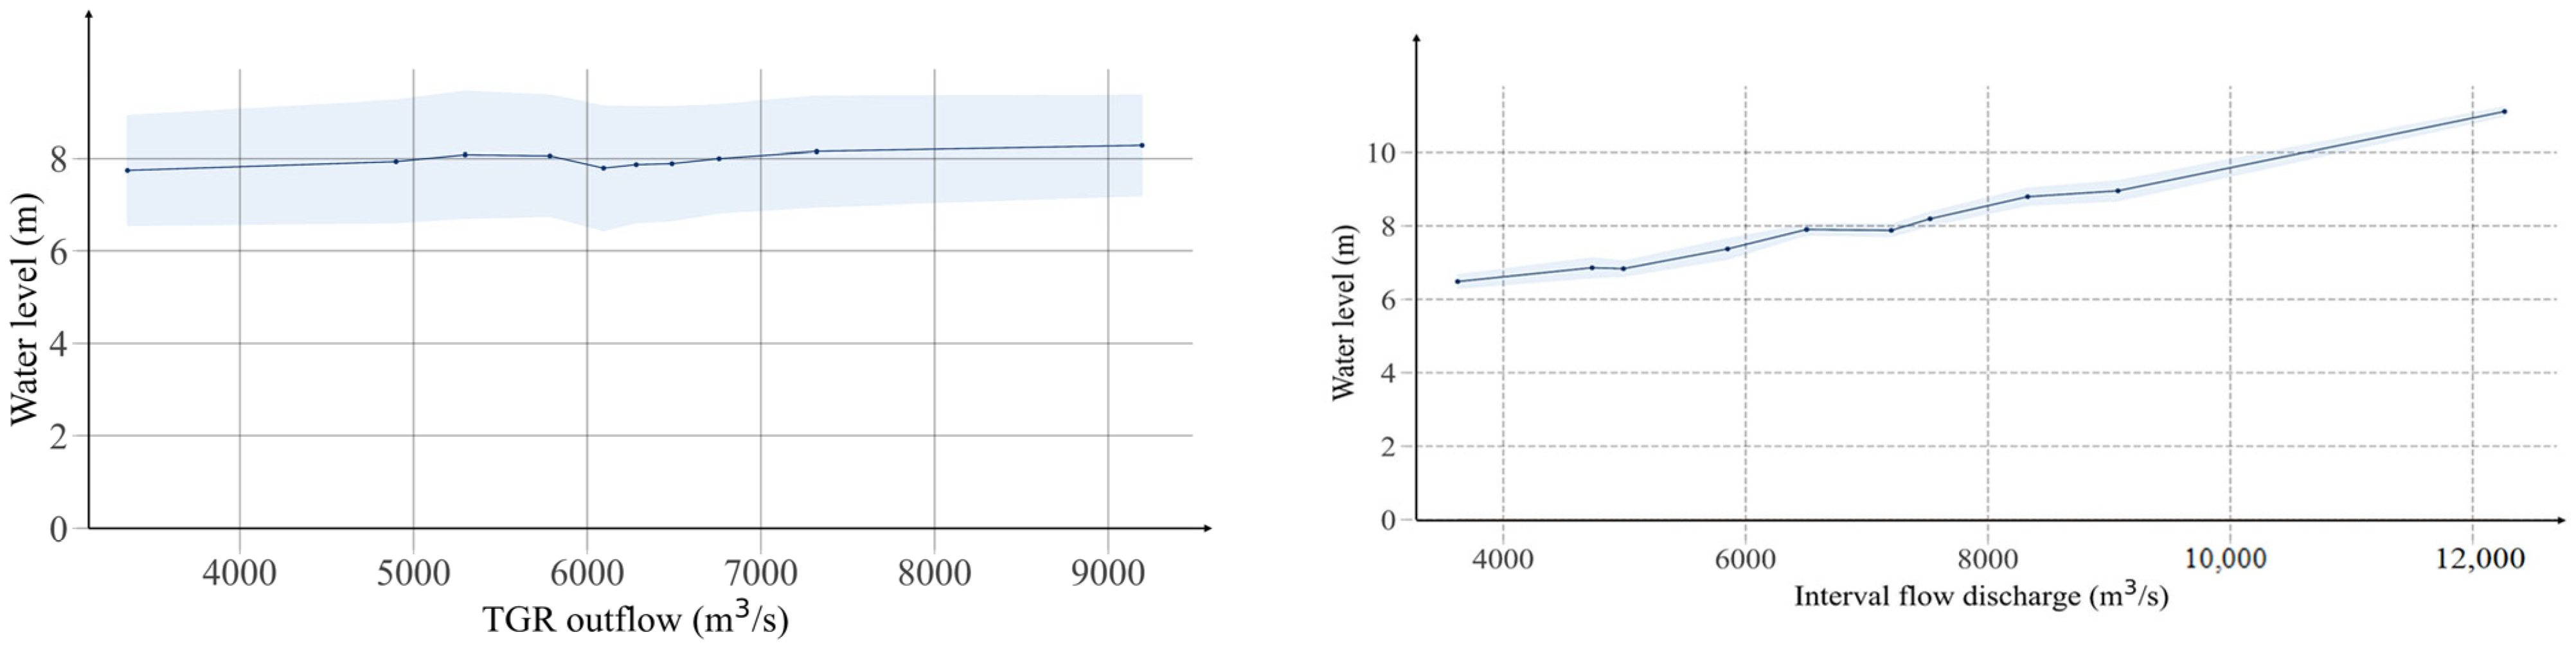
- Every additional 5000 m3/s of the TGR outflow discharge can increase about 1.0 m the water level at JJS in the impoundment period from September to October, while, in the drawdown period from December to March of the following year, every additional 1000 m3/s of the TGR outflow discharge can increase 0.16 m the water level at JJS.
Author Contributions
Funding
Data Availability Statement
Acknowledgments
Conflicts of Interest
References
- Yang, Y.; Zheng, J.; Zhang, H.; Chai, Y.; Zhu, Y.; Wang, C. Impact of the Three Gorges Dam on riverbed scour and siltation of the middle reaches of the Yangtze River. Earth Surf. Process. Landf. 2022, 47, 1514–1531. [Google Scholar] [CrossRef]
- Gan, M.; Lai, X.; Guo, Y.; Lu, Z.; Chen, Y.; Pan, S.; Pan, H.; Chu, A. Unravelling the spatiotemporal variation in the water levels of Poyang Lake with the variational mode decomposition model. Hydrol. Process. 2024, 38, e15239. [Google Scholar] [CrossRef]
- Liu, M.; Zhang, P.; Cai, Y.; Chu, J.; Li, Y.; Wang, X.; Li, C.; Liu, Q. Spatial-temporal heterogeneity analysis of blue and green water resources for Poyang Lake basin, China. J. Hydrol. 2023, 617, 128983. [Google Scholar] [CrossRef]
- Ye, X.; Li, Y.; Li, X.; Zhang, Q. Factors influencing water level changes in China’s largest freshwater lake, Poyang Lake, in the past 50 years. Water Int. 2014, 39, 983–999. [Google Scholar] [CrossRef]
- Liu, Y.; Wu, G. Hydro-climatological influences on recently increased droughts in China’s largest freshwater lake. Hydrol. Earth Syst. Sci. 2016, 20, 93–107. [Google Scholar] [CrossRef]
- Wang, J.; Sheng, Y.; Wada, Y. Little impact of the Three Gorges Dam on recent decadal lake decline across China’s Yangtze Plain. Water Resour. Res. 2017, 53, 3854–3877. [Google Scholar] [CrossRef]
- Huang, F.; Ochoa, C.G.; Guo, L.; Wu, Y.; Qian, B. Investigating variation characteristics and driving forces of lake water level complexity in a complex river–lake system. Stoch. Environ. Res. Risk Assess. 2021, 35, 1003–1017. [Google Scholar] [CrossRef]
- Zhang, X.; Jiang, C.; Huang, J.; Liu, Z.; Wang, X.; Li, X. Quantitative attribution of the surface area reduction of Poyang Lake over the last two decades. J. Water Resour. Plan. Manag. 2024, 150, 05024011. [Google Scholar] [CrossRef]
- Liu, Z.; Guo, S.; Guo, J.; Liu, P. The impact of Three Gorges Reservoir refill operation on water levels in Poyang Lake, China. Stoch. Environ. Res. Risk Assess. 2017, 31, 879–891. [Google Scholar] [CrossRef]
- Zhang, Q.; Li, L.; Wang, Y.G.; Werner, A.D.; Xin, P.; Jiang, T.; Barry, D.A. Has the Three-Gorges Dam made the Poyang Lake wetlands wetter and drier? Geophys. Res. Lett. 2012, 39, l20402. [Google Scholar] [CrossRef]
- Huang, F.; Zhang, N.; Ma, X.; Zhao, D.; Guo, L.; Ren, L.; Wu, Y.; Xia, Z. Multiple changes in the hydrologic regime of the Yangtze River and the possible impact of reservoirs. Water 2016, 8, 408. [Google Scholar] [CrossRef]
- Yao, J.; Gao, J.; Yu, X.; Zhang, Q. Impacts of a proposed water control project on the inundation regime in China’s largest freshwater Poyang Lake: Quantification and ecological implications. J. Hydrol. Reg. Stud. 2022, 40, 101024. [Google Scholar] [CrossRef]
- Liu, Y.; Wu, G.; Zhao, X. Recent declines in China’s largest freshwater lake: Trend or regime shift? Environ. Res. Lett. 2013, 8, 014010. [Google Scholar] [CrossRef]
- Jiang, C.; Zhang, Q.; Luo, M. Assessing the effects of the Three Gorges Dam and upstream inflow change on the downstream flow regime during different operation periods of the dam. Hydrol. Process. 2019, 33, 2885–2897. [Google Scholar] [CrossRef]
- Wang, F.; Zhou, Q.; Gao, H.; Wen, Y.; Zhou, S. Dynamic monitoring of Poyang Lake water area and storage changes from 2002 to 2022 via remote sensing and satellite gravimetry techniques. Remote Sens. 2024, 16, 2408. [Google Scholar] [CrossRef]
- Dai, Z.; Liu, J.T. Impacts of large dams on downstream fluvial sedimentation: An example of the Three Gorges Dam (TGD) on the Yangtze River. J. Hydrol. 2013, 480, 10–18. [Google Scholar] [CrossRef]
- Yang, S.L.; Milliman, J.D.; Li, P.; Xu, K. 50,000 dams later: Erosion of the Yangtze River and its delta. Glob. Planet. Change 2011, 75, 14–20. [Google Scholar] [CrossRef]
- Lai, X.; Jiang, J.; Yang, G.; Lu, X.X. Should the Three Gorges Dam be blamed for the extremely low water levels in the middle–lower Yangtze River? Hydrol. Process. 2014, 28, 150–160. [Google Scholar] [CrossRef]
- Lai, X.; Shankman, D.; Huber, C.; Yesou, H.; Huang, Q.; Jiang, J. Sand mining and increasing Poyang Lake’s discharge ability: A reassessment of causes for lake decline in China. J. Hydrol. 2014, 519, 1698–1706. [Google Scholar] [CrossRef]
- de Leeuw, J.; David, S.; Wu, G.; de Boer, W.F.; James, B.; He, Q.; Herve, Y.; Xiao, J. Strategic assessment of the magnitude and impacts of sand mining in Poyang Lake, China. Reg. Environ. Change 2010, 10, 95–102. [Google Scholar] [CrossRef]
- Jiang, F.; Qi, S.; Liao, F.; Zhang, X.; Wang, D.; Zhu, J.; Xiong, M. Hydrological and sediment effects from sand mining in Poyang Lake during 2001–2010. Acta Geogr. Sin. 2015, 70, 837–845. [Google Scholar]
- Wang, P.; Zhang, X.; Qi, S. Was the trend of the net sediment flux in Poyang Lake, China, altered by the Three Gorges Dam or by sand mining? Environ. Earth Sci. 2019, 78, 64. [Google Scholar] [CrossRef]
- Dai, X.; Wan, R.; Yang, G. Non-stationary water-level fluctuation in China’s Poyang Lake and its interactions with Yangtze River. J. Geogr. Sci. 2015, 25, 274–288. [Google Scholar] [CrossRef]
- Ye, X.; Xu, C.Y.; Zhang, Q.; Yao, J.; Li, X. Quantifying the human induced water level decline of China’s largest freshwater lake from the changing underlying surface in the lake region. Water Resour. Manag. 2018, 32, 1467–1482. [Google Scholar] [CrossRef]
- Ye, X.; Liu, F.; Zhang, Z.; Xu, C. Quantifying the impact of compounding influencing factors to the water level decline of China’s largest freshwater lake. J. Water Resour. Plan. Manag. 2020, 146, 05020006. [Google Scholar] [CrossRef]
- Yildiz, M.B.; Di Nunno, F.; Đurin, B.; Pham, Q.B.; de Marinis, G.; Granata, F. A combined seasonal Mann–Kendall and innovative approach for the trend analysis of streamflow rate in two Croatian Rivers. Water 2024, 16, 1422. [Google Scholar] [CrossRef]
- Liu, S.; Xie, Y.; Fang, H.; Du, H.; Xu, P. Trend test for hydrological and climatic time series considering the interaction of trend and autocorrelations. Water 2022, 14, 3006. [Google Scholar] [CrossRef]
- Kratzert, F.; Klotz, D.; Brenner, C.; Schulz, K.; Herrnegger, M. Rainfall–runoff modelling using long short-term memory (LSTM) networks. Hydrol. Earth Syst. Sci. 2018, 22, 6005–6022. [Google Scholar] [CrossRef]
- Kratzert, F.; Klotz, D.; Hochreiter, S.; Nearing, G.S. A note on leveraging synergy in multiple meteorological data sets with deep learning for rainfall–runoff modeling. Hydrol. Earth Syst. Sci. 2021, 25, 2685–2703. [Google Scholar] [CrossRef]
- Shi, H.; Yang, N.; Yang, X.; Tang, H. Clarifying relationship between PM2.5 concentrations and spatiotemporal predictors using multi-way partial dependence plots. Remote Sens. 2023, 15, 358. [Google Scholar] [CrossRef]
- Greenwell, B.M. PDP: An R package for constructing partial dependence plots. R J. 2017, 9, 421–436. [Google Scholar] [CrossRef]


| Month | Sept. | Oct. | Dec. | Jan. | Feb. | Mar. |
|---|---|---|---|---|---|---|
| 1981–2002 | 15.10 | 13.42 | 8.56 | 7.48 | 7.70 | 9.07 |
| 2003–2021 | 13.35 | 11.31 | 7.77 | 7.46 | 7.57 | 9.19 |
| Difference | −1.74 | −2.11 | −0.78 | −0.02 | −0.13 | 0.12 |
| Month | Sept. | Oct. | Dec. | Jan. | Feb. | Mar. |
|---|---|---|---|---|---|---|
| Z | −1.62 | −2.4 | 2.01 | 4.59 | 3.58 | 2.29 |
| 1981–2002 | 91.0 | 72.8 | 30.9 | 25.3 | 23.9 | 33.9 |
| 2003–2021 | 80.1 | 60.7 | 32.5 | 31.0 | 28.5 | 39.9 |
| Difference | −10.9 | −12.1 | 1.6 | 5.7 | 4.7 | 6.0 |
| Month | Sept. | Oct. | Dec. | Jan. | Feb. | Mar. | Annual |
|---|---|---|---|---|---|---|---|
| Z | −1.73 | −1.46 | 2.07 | 5.14 | 4.59 | 4.27 | −1.1 |
| 1981–2002 | 63.7 | 46.3 | 15.8 | 11.8 | 9.8 | 12.2 | 434.5 |
| 2003–2021 | 59.5 | 42.4 | 16.4 | 14.5 | 11.9 | 15.5 | 414.3 |
| Difference | −4.2 | −3.9 | 0.7 | 2.7 | 2.2 | 3.3 | −20.2 |
| Month | Sept. | Oct. | Dec. | Jan. | Feb. | Mar. |
|---|---|---|---|---|---|---|
| Flow volume change at JJS | −10.898 | −12.088 | 1.600 | 5.755 | 4.678 | 5.962 |
| TGR inflow volume change | −6.656 | −7.074 | 0.746 | 1.674 | 2.804 | 2.082 |
| TGR outflow volume change | −4.200 | −3.900 | 0.700 | 2.700 | 2.200 | 3.300 |
| Interval flow volume change | −0.042 | −1.114 | 0.154 | 1.381 | −0.326 | 0.580 |
| Month | Sept. | Oct. | Dec. | Jan. | Feb. | Mar. |
|---|---|---|---|---|---|---|
| Riverbed incision | −0.52 | −0.66 | −0.99 | −1.02 | −1.05 | −0.89 |
| Flow volume change | −0.94 | −1.28 | 0.23 | 0.82 | 0.68 | 0.8 |
| Total change | −1.46 | −1.95 | −0.77 | −0.19 | −0.37 | −0.09 |
| Evaluation Indicators | Sept. to Oct. | Dec. to Mar. | ||
|---|---|---|---|---|
| Training Period | Test Period | Training Period | Test Period | |
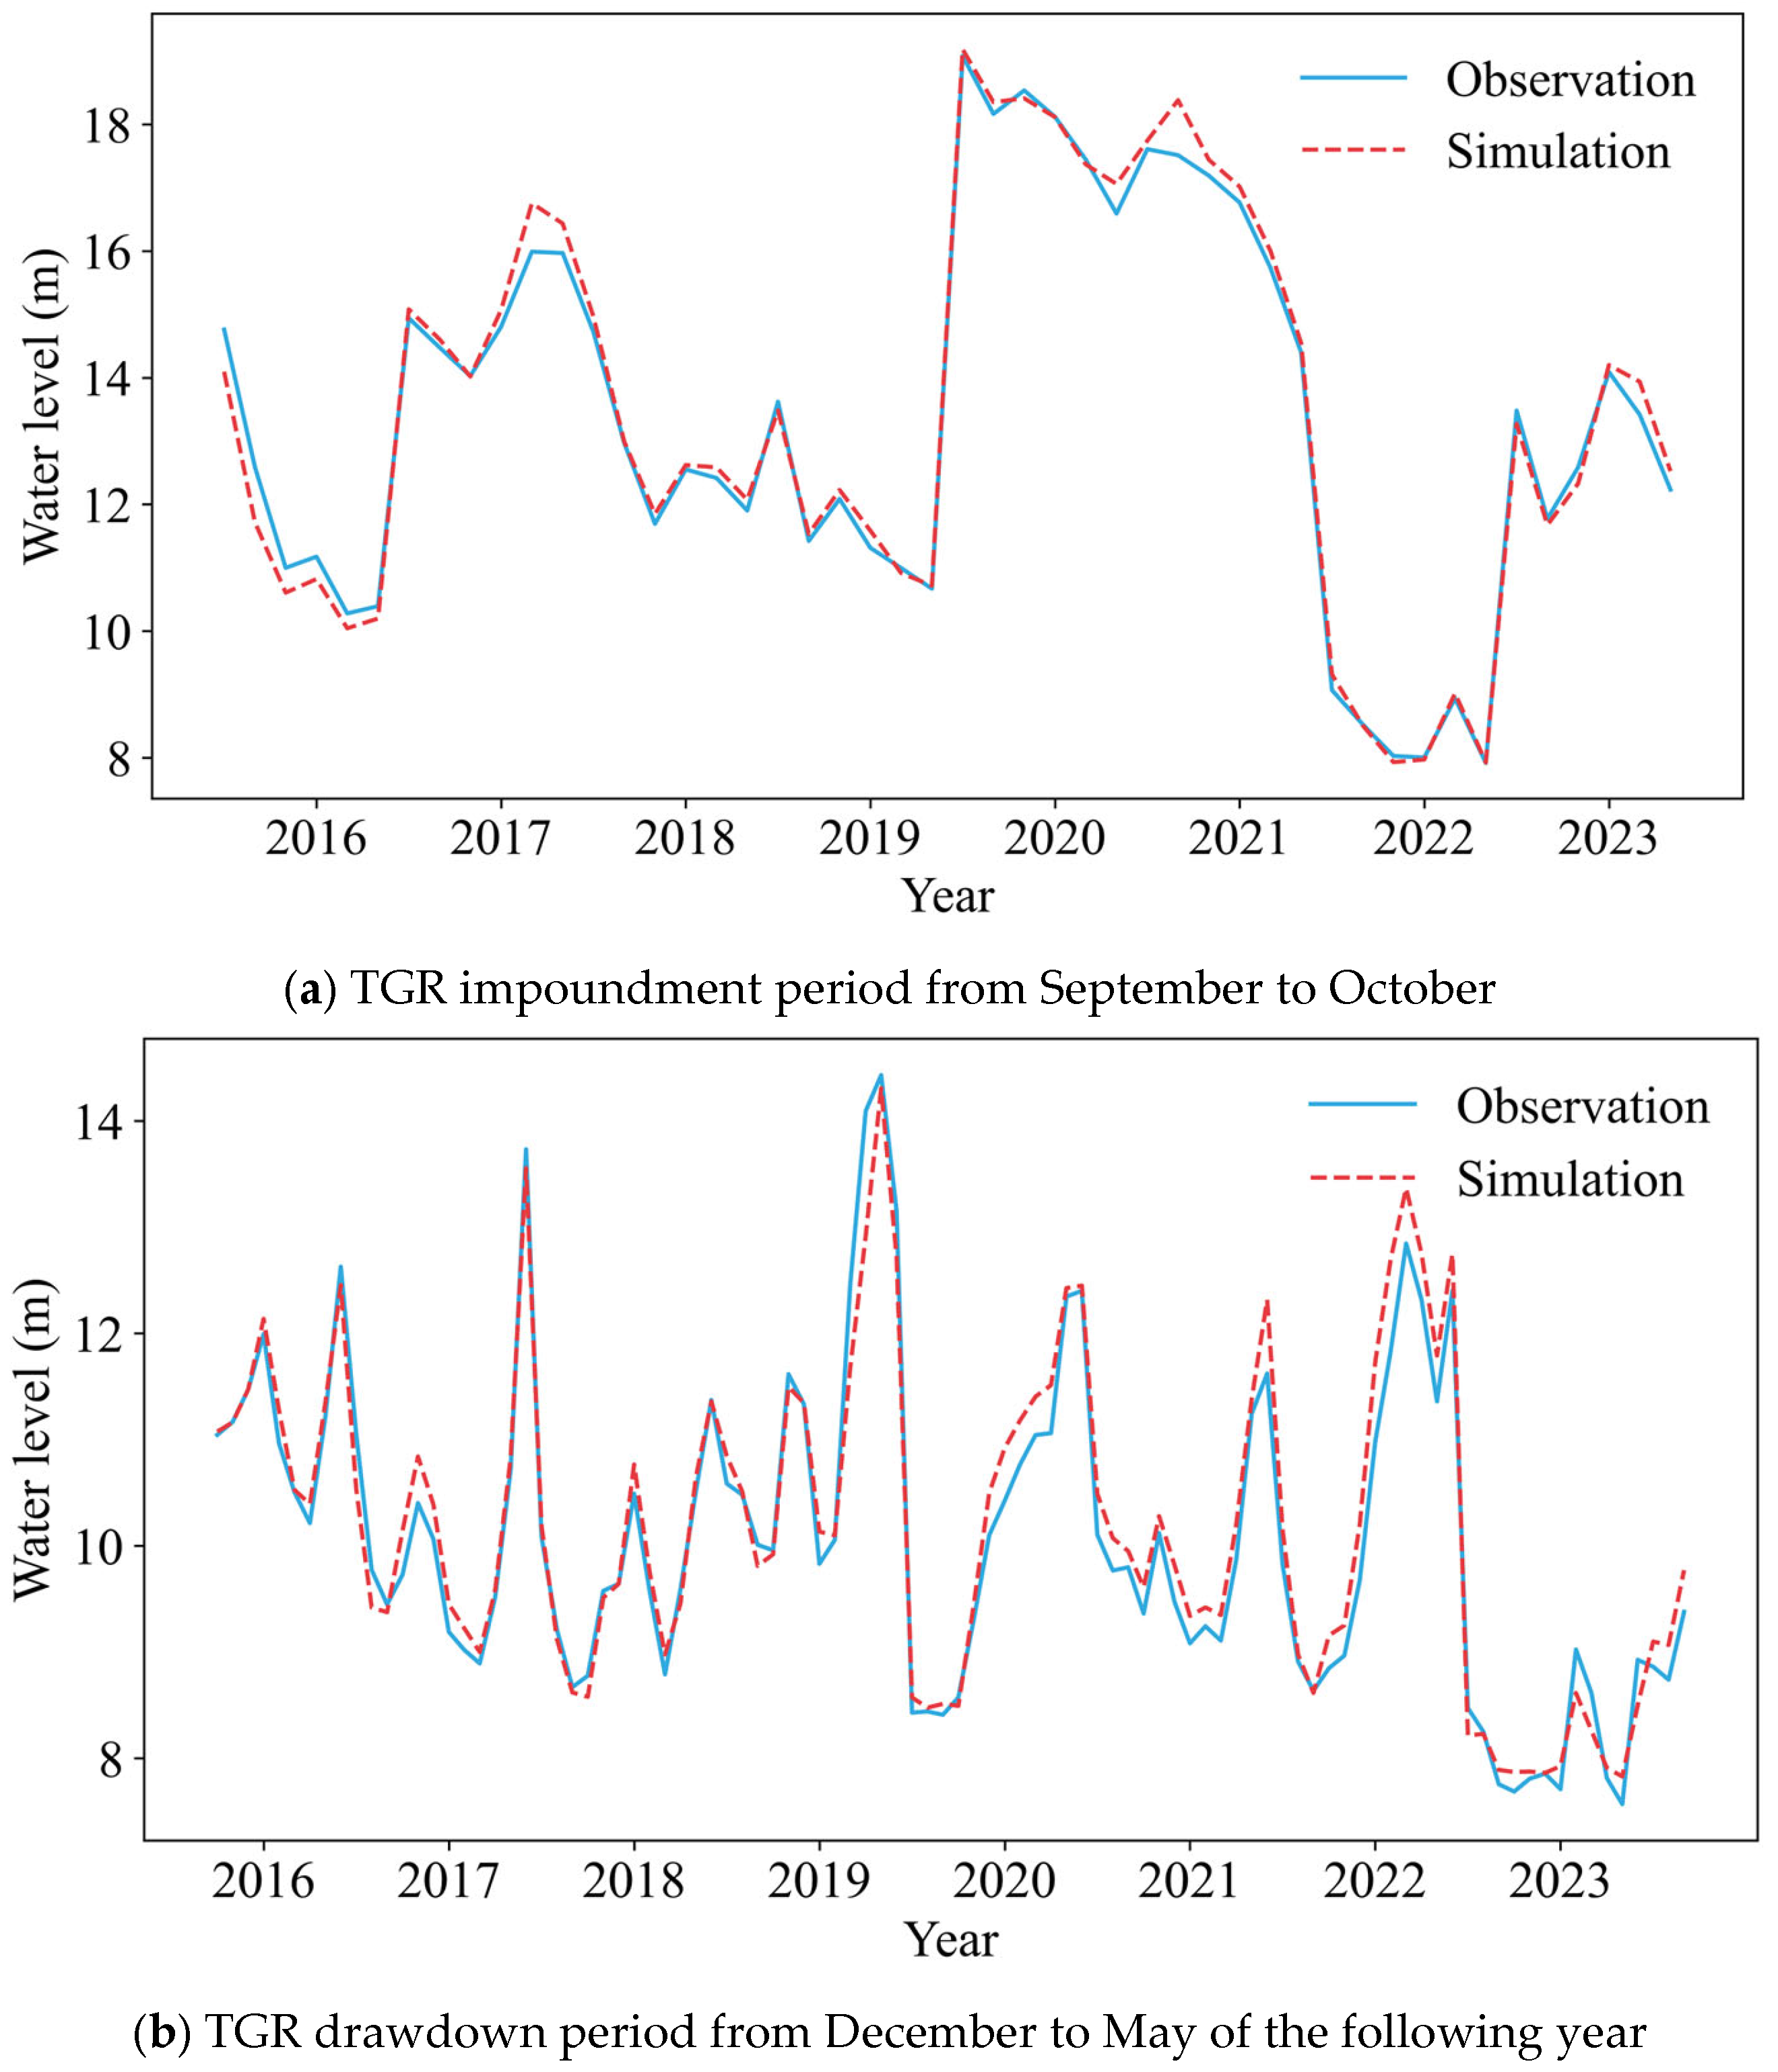
| NSE | 0.99 | 0.98 | 0.98 | 0.96 |
| MAE (m) | 0.16 | 0.23 | 0.19 | 0.24 |
| RMSE (m) | 0.24 | 0.31 | 0.27 | 0.32 |
Disclaimer/Publisher’s Note: The statements, opinions and data contained in all publications are solely those of the individual author(s) and contributor(s) and not of MDPI and/or the editor(s). MDPI and/or the editor(s) disclaim responsibility for any injury to people or property resulting from any ideas, methods, instructions or products referred to in the content. |
© 2025 by the authors. Licensee MDPI, Basel, Switzerland. This article is an open access article distributed under the terms and conditions of the Creative Commons Attribution (CC BY) license (https://creativecommons.org/licenses/by/4.0/).
Share and Cite
Wang, Y.; Guo, S.; Xiang, X.; Li, C.; Li, N. Impact of Three Gorges Reservoir Operation on Water Level at Jiujiang Station and Poyang Lake in the Yangtze River. Hydrology 2025, 12, 52. https://doi.org/10.3390/hydrology12030052
Wang Y, Guo S, Xiang X, Li C, Li N. Impact of Three Gorges Reservoir Operation on Water Level at Jiujiang Station and Poyang Lake in the Yangtze River. Hydrology. 2025; 12(3):52. https://doi.org/10.3390/hydrology12030052
Chicago/Turabian StyleWang, Yun, Shenglian Guo, Xin Xiang, Chenglong Li, and Na Li. 2025. "Impact of Three Gorges Reservoir Operation on Water Level at Jiujiang Station and Poyang Lake in the Yangtze River" Hydrology 12, no. 3: 52. https://doi.org/10.3390/hydrology12030052
APA StyleWang, Y., Guo, S., Xiang, X., Li, C., & Li, N. (2025). Impact of Three Gorges Reservoir Operation on Water Level at Jiujiang Station and Poyang Lake in the Yangtze River. Hydrology, 12(3), 52. https://doi.org/10.3390/hydrology12030052