Abstract
Nitrate contamination poses a significant global environmental threat, impacting the water quality in surface and groundwater systems. Despite its considerable impact, there remains a lack of comprehensive understanding of nitrate sources and discharge patterns, particularly in the Lake Victoria basin of East Africa. To address this gap, a study was conducted in the Kagera River basin, responsible for 33% of Lake Victoria’s surface inflow. This study utilized δ15N and δ18O isotope analysis in nitrate, hydrochemistry, and the Bayesian mixing model (MixSIAR) to identify and quantify nitrate sources. Spatiotemporal data were collected across three seasons: long rains, dry season, and short rains, in areas with diverse land uses. Nitrate isotopic data from water and potential sources were integrated into a Bayesian mixing model to determine the relative contributions of various nitrate sources. Notable spatial variations were observed at sampling sites with concentrations ranging from 0.004 to 3.31 mg L−1. Spatially and temporally, δ15N-NO3− values ranged from +6.0% to +10.2‰, whereas δ18O-NO3− displayed significant spatial differences with mean ranges from −1% to +7‰. MixSIAR analysis revealed important contributions from manure and sewage sources ranging between 49% and 73%. A boron analysis revealed manure was the main source of nitrates in the manure and sewage. These results show that it is necessary to implement improved manure and sewage management practices, especially through proper waste treatment and disposal systems, to enable informed policy decisions to enhance nitrogen management strategies in riparian East Africa, and to safeguard the region’s water resources and ecosystems.
1. Introduction
Increasing trends of riverine nitrate loading from different sources have led to water pollution, eutrophication, the proliferation of invasive weeds, such as water hyacinths, and the deterioration of surface water quality globally [1]. Aquatic nitrogen often originates from agricultural lands through the application of synthetic fertilizer and manure, soil N leachates and runoffs, partially treated or untreated sewage waste from treatment plants, domestic waste, and precipitation [2,3,4,5,6]. High levels of nitrates in drinking water beyond the WHO limit (10 mg L−1) (as N) have negative impacts on human health as they cause methemoglobinemia in infants and affect aquatic life by causing oxygen depletion [7,8]. Owing to the significant risk that excessive levels of nitrates in water pose to human health, it is crucial to regulate their presence in aquatic ecosystems. Identifying nitrate sources in the environment helps pinpoint the causes of elevated NO3− fluxes and, consequently, guides the implementation of targeted management policies to reduce N inputs [4]. Furthermore, identifying the sources allows for better control of the water quality in various at-risk watersheds.
The Kagera River has the largest surface inflow (approximately 30%) to Lake Victoria, covering four riparian countries (Burundi, Rwanda, Tanzania, and Uganda) and is a critical yet under-researched nitrogen pollution hotspot. Studies in the Lake Victoria basin have identified the Kagera River as the major source of riverine nitrogen loads of 491 N kg km yr−1 [9], 29,303 N t yr−1 [10], and 16,357 t yr−1 [11], which is associated with the proliferation of water hyacinths. The earliest documented infestation of the water hyacinth in Lake Victoria was in the late 1980s, which was introduced via the Kagera River [12]. According to [12], the rate of water hyacinth flowing from the Kagera River into Lake Victoria is equivalent to a contiguous floating mat covering, depending on seasonal river volume conditions. The high infestation of water hyacinths in the river is a clear indicator of nitrogen loading [13,14]. This pollution leads to the deterioration of water quality, resulting in biodiversity loss, decline in fisheries, and threats to livelihoods. In addition, unsuitable water quality for domestic, industrial, agricultural, and livestock use contributes to public health risks. The Kagera River basin is a significant sub-basin of the Lake Victoria basin and plays a crucial role in the socioeconomic development of the region, such as water supply for domestic and industrial use, hydropower generation, food security, aquaculture, tourism, and supports biodiversity and ecosystem services [15,16]. Previous monitoring studies, based on hydrochemical data, conducted to determine the variability of water quality parameters, such as nitrate levels, showed that the Kagera River is the highest riverine contributor to NO3− N loading in the lake [10,17,18]. Based on such hydrochemical data, it would be difficult to implement targeted nitrate management measures because riverine nitrate may originate from different sources within the basin. Despite these pressing challenges and the importance of the basin, the available data on nitrogen loads are based on hydrochemistry, and a significant research gap remains in quantifying nitrate sources. Addressing this gap is essential for developing sustainable interventions, enhancing transboundary water management, and unlocking potential benefits such as improved biodiversity, reduced nutrient pollution, and reduced health risks.
The Kagera basin is characterized by diverse physical and human environments, including major subsistence farming (mixed farming), large-scale sugarcane production in the mid-regions, land cover depletion due to extensive bush burning, soil erosion exacerbated by uplands cultivation, overgrazing, and wetland inhabitation for grazing. These activities contribute to riverine nitrogen loading and eutrophication. Based on this complexity, hydrochemical monitoring is insufficient to inform strategies for nitrate pollution, as it quantifies the concentration with limitations on the contributing nitrate sources. This requires the implementation of sophisticated monitoring systems to monitor nitrate pollution and water quality. To effectively differentiate between these numerous nitrate sources, the Bayesian mixing model MixSIAR, in conjunction with a multi-tracer isotope, offers insights into the probability of source contribution [19,20,21]. The use of stable nitrogen δ15N and oxygen δ18O isotope data of NO3− to trace nitrate loading in surface and groundwater has been used to distinguish nitrate sources worldwide. Recent studies on Kenyan rivers and groundwater using the stable isotopes δ15N- and δ18O-NO3− have provided a better understanding of each source in the Lake Victoria basin for the three Kenyan rivers [22,23] and groundwater in the Kano plains [24]. Despite different nitrate sources showing different signatures of, δ15N- and δ18O-NO3−, some sources show overlapping signatures of δ15N- and δ18O-NO3−, and additional boron isotope analysis has been used to distinguish between manure and sewage sources in both the surface and groundwater [22,25,26,27]. The co-mobilization of boron with nitrate in water systems makes it a good indicator for nitrate sources using its isotopic signatures, which are distinct for manure, sewage, and synthetic fertilizers. Moreover, boron is not affected by denitrification, making it a more reliable tracer for nitrate in the case of overlapping manure and sewage [28,29,30].
This approach offers a more comprehensive understanding of the sources, which is essential for developing sound policies and optimized nitrogen management in the Lake Victoria basin. Therefore, the purpose of this study is (i) to use hydrochemistry to quantify the spatial and temporal variations in nitrate concentrations, (ii) to identify the sources of nitrate pollution using dual isotopic tracers (δ15N-NO3− and δ18O-NO3−), and (iii) to apply the Bayesian MixSIAR model to estimate the contribution of different nitrate sources in the lower Kagera basin. This study is the first in the Kagera River basin to use a multi-tracer approach, combining isotopic and statistical modeling techniques to enhance the understanding of nitrogen pollution dynamics. Consequently, the transboundary basin presents opportunities for sustainable development that can improve food and energy production, transportation, industrial development, and environmental conservation.
2. Materials and Methods
2.1. Study Area
The Kagera River basin is a sub-basin of Lake Victoria shared by four counties in East Africa: Tanzania, Uganda, Rwanda, and Burundi. The transboundary river lies between 0°45′ and 3°35′ latitude south and 29°15′ and 30°51′ longitude east and is approximately 400 km long. This study was conducted in the lower Kagera basin which stretches from Lake Rweru forming the Rwanda–Tanzania border to Uganda where it drains into Lake Victoria. This lower basin is approximately 250 km and cuts across various landscapes, including wetlands, savannas, and agricultural lands. The basin area experiences bimodal humid, sub-humid, and semi-arid climatic conditions, with short rains occurring from October to December and long rains from March to May. The dry period occurs in July, while April and November are the wettest months [15]. Annual rainfall ranges from 800 to 2000 mm and is characterized by storms that result in soil erosion and runoff [31]. The mean annual temperatures in the lowlands range from 21 °C to 30 °C. Most of the population depends on agriculture, which entails agropastoral systems in semi-arid zones, mixed annual cropping (banana and coffee), commercial sugarcane farming in humid zones, and mixed-livestock systems in semi-humid zones. The farming systems in the basin are characterized by the subsistence agriculture of food crops (legumes, cereals, tubers, bananas, and coffee) with minimal inputs, animal husbandry (cattle, goats, sheep, and poultry), and a limited area under commercial farms (sugarcane, horticulture, coffee, and tea). Settlement in the basin is characterized by the majority of the population living in rural areas and directly depends on farming, fishing, and herding. Based on the hydrogeological properties, the lower river basin has two zones: the swamp and lake terrain in the central parts of the Rwanda and Tanzania border and the alluvial plains associated with several satellite lakes and plateaus in Tanzania [15].
2.2. Sampling and Analytical Methods
Sampling locations were guided by the Lake Victoria Environmental Management Project (LVEMP) pre-existing monitoring sites [11], land use, and hydrogeological conditions along the river catchment and guidance from the Lake Victoria water board to the Kagera catchment division [9]. Spatiotemporal sampling was guided by the basin’s different land use and seasonal patterns. The main land uses considered in this study were mixed farming (K1, K2, K3, K6, K7, and K8), commercial agriculture, such as sugarcane farming (S2–S4), industrial areas (S1), and forested areas (K5) giving a total of 13 sites (Figure 1). Sampling was conducted for seven sampling campaigns aligning with the wet and dry seasons: (1) the peak of long rains in April, (2) the end of wet long rains in June, (3) the dry period in July, (4) the onset of short rains in September, (5) the mid–short rains in October, (6) the peak short rains in November, and (7) the end of short rains in December 2022.
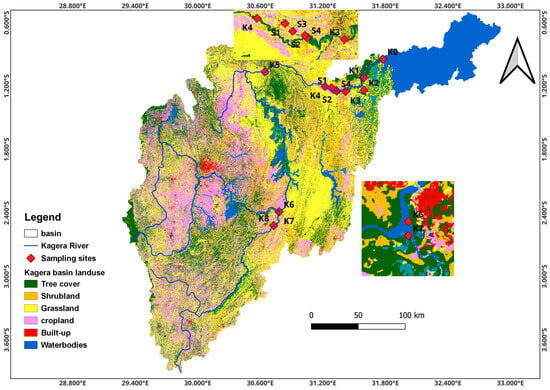
Figure 1.
Map of the Kagera River basin showing the sampling site in the lower Kagera basin.
In situ parameters, such as pH, electrical conductivity (EC), temperature, total dissolved solids (TDS), and dissolved oxygen (DO) were analyzed in the field using a multiparameter sensor (2FD47F-Multi3430, WTW, Germany). To assess dilution and spatiotemporal nitrate concentration, river discharge rates were determined at three sampling points (Ruvuvu bridge (K8), Ngono bridge (K2), and Kyaka Ferry (K3)) using OTT Q-Liner for mobile discharge measurements in rivers. All measured data were transferred to a Personal Digital Assistant (PDA) via Bluetooth, and river discharge was recorded in (m3/s). For water, a grab sample was collected in 500 mL high-density polyethylene bottles and stored in an insulated cooler box with ice cubes for transportation to the laboratory for further analysis. Upon returning to the laboratory, water was shaken to resuspend the sediments and filtered in duplicate on pre-combusted (450 °C > 5 h) glass-fiber filters (0.7 µm GF/F, Whatman, Cincinnati, OH, USA). The filtrate was stored frozen for hydrochemical and isotopic analysis and shipped in dry ice to the laboratory in Kenya. A subsample was preserved by adding dilute hydrochloric acid for cation and anion analysis. The glass fiber filters were preserved and frozen for particulate organic nitrogen (PON) analysis. The amount of water filtered was recorded and used in the calculation of the PON by dividing the total nitrogen (TN) results by the amount of filtered water recorded as µg/L. The filters and water samples were shipped using dry ice to ISOFYS for isotopic and PON analysis. All filters were dried at 60 °C for 48 h before the analysis. The PON concentrations were determined by measuring the dried GF/F filters using an elemental analyzer (Automated Nitrogen Carbon Analyzer, Sercon Instruments; Crewe, UK). The cations and anions analyzed were NH4 +, Na+, Ca2+, Na+, Mg2+, NO2−, NO3−, and Cl− using ion chromatography (930 Compact IC Flex, Metrohm, Switzerland) at the Watershed Hydrology Research Laboratory, University of Nairobi. Isotopic analyses (δ15N- and δ18O-NO3−) were performed at the ISOFYS Laboratory of Ghent University, Belgium, using the bacterial denitrification method [32]. This method is based on the quantitative transformation of NO3− to N2O by a denitrifying bacterium lacking the nitrous oxide reductase gene (Pseudomonas aureofaciens). The isotopic composition of the formed N2O was analyzed using TG-IRMS (ANCA-TGII interfaced with a Sercon 20-20 IRMS, all Syscon Electronics). Measured data were normalized on international reference scales using two standards: USGS34 (δ15N = −1.8 ± 0.2‰ v.s. AIR, δ18O = −27.8 ± 0.4‰ v.s. VSMOW) and USGS32 (δ15N = +180 ± 1.0‰ v.s. AIR, δ18O = 25.4 ± 0.6‰ v.s. VSMOW). The average standard error of the measured samples was 0.02‰ for 15N and 0.50‰ for 18O. All stable isotope results were reported using the conventional delta (δ) in per mil (‰) relative to the respective international standards, as follows:
where Rsample and Rstandard are the 15N/14N and 18O/16O ratios of the sample and the standards for δ15N and δ18O, respectively. The δ18O values were reported relative to the Vienna Standard Mean Ocean Water (VSMOW), and δ15N values were reported relative to N2 in atmospheric air (AIR).
Boron concentrations and δ11B in potential nitrate sources and selected water samples were determined to distinguish between sewage and manure nitrate sources as described in detail by [28]. For accuracy and reproducibility, the IAEA-B1 seawater standard was used. The δ11B values were calculated using standard reference material NIST 951a boric acid with a precision of (95% CI) of the δ11B measurements with HR-ICP-MS instrument amounts ±3‰.
2.3. Data Analysis
Physicochemical and isotopic parameters were subjected to analysis of variance (ANOVA) using R statistical software version 3.6.1. Mean comparisons between different sites and seasons were performed using Tukey’s HSD test (p < 0.05). The Bayesian MixSIAR model in R was used to apportion the contributions of various sources, as described in [21]. Local values of δ15N- and δ18O-NO3− were used to improve the MixSIAR model (Table S1).
3. Results
3.1. Physicochemical and Hydrochemical Properties
Dissolved oxygen (DO) was significantly different between sampling sites (p > 0.05) with an average DO ranging from 1.45 to 7.75 mg L−1 (Table 1). Low DO was observed in sites within the Kagera sugar plantation, where water was not rapidly flowing; whereas the highest DO was generally observed in fast-moving sites. The low DO at the sites could be due to microbial activities in water that can consume oxygen. The average temperature ranged between 22.3 and 29.8 °C and significantly differed across the sampling seasons. High temperatures were recorded at the sugar factory processing discharge point (S1); whereas the lowest temperature was recorded at the Ruvuvu bridge (K8). DO was inversely proportional to temperature. The sites recorded a moderately acidic pH with a range of 4.3 to 5.3, which is outside the permissible WHO limits (6.5–8.5) for drinking water [33].

Table 1.
Mean values for in situ parameters at various sampling sites in the lower Kagera basin.
Electrical conductivity (EC) was significantly different between the sampling sites. Electrical conductivity ranged between 49.3 and 208.6 µs cm−1, with K2 showing the lowest and S2 having the highest EC. TDS was significantly different between the sampling sites. The TDS ranged between 29.1 and 111.5 mg L−1, with the lowest value recorded at K8 and the highest at the S1.
Calcium was the dominant cation, followed by Na+, K+, Mg2+, K+, and NH4+ (Table 2). Significant seasonal variations were observed for Na+, NH4+, Ca2+, and Mg2+, whereas only K+ showed significant spatial variation (p < 0.05) (Table 2 and Table 3). The seasonal average variations for cations were noted with high concentrations of Na+ in October, NH4+ in April, Ca2+ and Mg2+ in October (10, 1.4, 39.8, 2.8 mg L−1, respectively). The lowest concentrations of Mg2+ and Ca2+ were observed in April, which was the peak of wet long rains (0.2 and 1.3 mg L−1), while Na+ and NH4+ were lowest at the end of December of wet short rains (4.4 and 0.002 mg L−1, respectively). Significant spatial variations were recorded for K+, with the highest at the Kagera sugar factory discharge point (S1—5.9 mg L−1) and the lowest at the Ngono tributary (K2—1 mg L−1) before the confluence with the Kagera River.
Table 2.
Spatial average hydrochemistry and δ15N-NO3− and δ18O-NO3− data for the lower Kagera River.
Table 3.
Seasonal average variations for hydrochemistry and δ15N-NO3− and δ18O-NO3− data for the lower Kagera River.
Significant seasonal variations were observed for anions, except for NO3−, which showed significant spatial differences (p < 0.05) (Table 2 and Table 3). Chlorine was the dominant anion, followed by SO42− > NO3−. The ranges for anions were as follows: NO3− (0–3.3 mg L−1), Cl− (2.4–71.0 mg L−1), and SO42− (0.3–22.4 mg L−1). The highest average seasonal anion concentrations were recorded in the June end of wet long rains for Cl− (51.1 mg L−1), and for SO42− in the November peak for short rains (7.9 mg L−1). The high concentration of chloride in water is related to anthropogenic activities, such as contamination from sewage, animal waste, and other domestic effluents, while the permeability of rocks and porosity of the soil equally contribute to high levels of chloride ions in water [34,35].
Low mean concentrations of the anions were recorded in September, the onset of short rains, for SO4− (3.4 mg L−1) and the April peak for long rains for Cl− (8.9 mg L−1). Spatial differences in NO3− were noted, with the highest mean average recorded at K8, the Ruvuvu tributary before the confluence with the Kagera on the Tanzania side. This area is mainly characterized by mixed agricultural farming (livestock and subsistence farming). It is worth noting that cultivation in these areas and the upper stream of the tributary is conducted on the slopes of the hilly landscape. The lowest NO3− concentration was recorded at the discharge point of the Kagera Sugar Factory before the confluence with the Kagera River.
A correlation matrix analysis revealed a strong positive correlation between Ca2+ and Cl−, EC and TDS (r = 0.9), TDS and K+, Cl− and Na+, and Ca2+ and Na+ (r = 0.7) (Table S2). The positive correlation between Ca2+, Cl−, and Na+ indicates that the origin could be from the same source, such as mineral-rich rocks. Mg2+ showed a moderately positive correlation with Ca2+, K+, Na+, and Cl− (r = 0.5, r = 0.5, r = 0.6, r = 0.6, and r = 0.5, respectively). Additionally, K+, Na+, and EC (r = 0.5) had a moderate positive correlation with EC, and temperature with EC and TDS (r = 0.6). The positive correlation of the water quality parameters indicates sources with similar geochemical structures.
3.2. Nitrate Variation in the Lower Kagera River
Spatial NO3− concentrations ranged from 0.004 mg L−1 at S1 during the mid-wet season in October to 3.31 mg L−1 at K8 during the peak wet November rains. There was no significant difference between the seasons, but a high average nitrate concentration was observed in the dry period, closely followed by the start of wet season (Table 3). Significant spatial differences were recorded between sampling sites (p < 0.05) (Figure 2a). Ruvuvu (K8), the main tributary draining the Burundi catchment and partly the Tanzania catchment, had a significantly higher average NO3− concentration (2.5 mg L−1) than the other sites, with ranges of 1.5–3.31 mg L−1. The area is mainly characterized by subsistence mixed farming on the Tanzanian side, with intensive cultivation of steep slopes and flows near the urban areas of Kayanza and Gitega on the Burundi side. Cultivation in steep slopes results in soil erosion and runoff during the rainy season; whereas urban settlement can lead to human waste discharge to the river. K6 recorded the second-highest average NO3− concentration (1.6 mg L−1) with ranges of 0.01–3.15 mg L−1 during the July dry period and mid-wet rains in October. This is a contribution of both K7 (Ruvuvu mean 2.5 mg L−1) and K6 (Akagera mean 1.0 mg L−1) tributaries from the Burundi and Rwanda catchment, respectively, which are characterized by the same land uses of intensive subsistence farming and cultivation on the steep slopes of the hilly parts of the two countries.
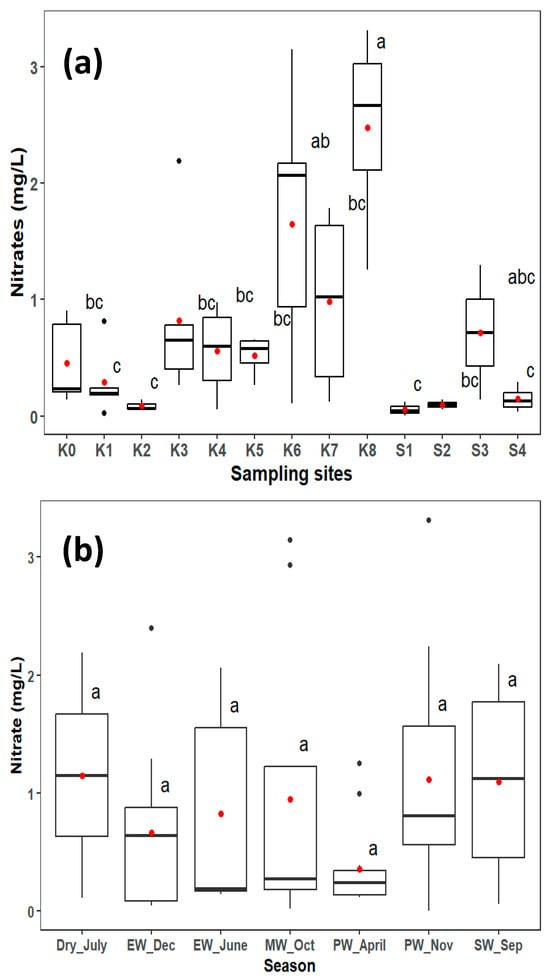
Figure 2.
Spatial nitrate (a) and temporal nitrate (b) concentrations range in the lower Kagera River. Seasons indicated are end wet (EW), mid wet (MW), SW (start wet) and peak wet (PW). The red dot shows the mean, black dot shows values above the values beyond the 1.5 interquartile range, and the dark line shows the median. Boxplots with different letters show ANOVA outputs indicating significant differences (p < 0.05) using the Tukey HSD test.
The average NO3− concentration differed significantly between the Kagera sugar plantation sites (p < 0.05). K5 and K4, which represent less human-impacted areas flowing through the forested areas of the Kagera catchment, recorded significantly lower NO3− average concentrations than the upper parts. The mean average concentration was 0.5 and 0.6 mg L−1, respectively, with no significant difference in the two sites. The K4 station is located upstream of the Kagera Sugar Company intake point and is partially characterized by the mixed farming of crops, such as maize, beans, and bananas, where animal manure and minimal fertilizers are used. K5 is mainly characterized by rangelands for cattle. The Kagera sugar plantation sites (S1–S4), where commercial sugarcane farming is practiced, showed significantly lower NO3− concentrations, except for S3, which drains the sugar company discharge, excess irrigation water, and runoff into the river. Since the channel is downstream, it is likely affected by human settlement for workers employed in the company and probably also affected by runoff nitrates from fertilizers used in the plantations. The concentrations at this point were significantly different from those in the upstream sites. K3 point which is located downstream of the Kagera Sugar Company, showed a slightly elevated concentration compared to the upstream point (K4) just before the company. Although Kagera commercial sugarcane farming uses N-based synthetic fertilizers (Kwera, urea, Kynoplus, Amidas, and Microp) for production, results show relatively low concentrations of NO3−, ranging from 0.26 mg L−1 in October to 2.19 mg L−1 in July, during the dry period. The sites also drain areas of human settlements, which are mainly characterized by mixed farming and free-range cattle ranching. Ngono (K2), the main tributary of the Tanzania catchment, showed significantly different concentrations from those of the upstream sites. This difference could be attributed to the different sources of nitrate in this area. This area is mainly characterized by minimal human activities limited to subsistence farming (maize, beans, and bananas) and low usage of fertilizers and animal manure.
3.3. Isotopic Variations of δ15N and δ18O-NO3−
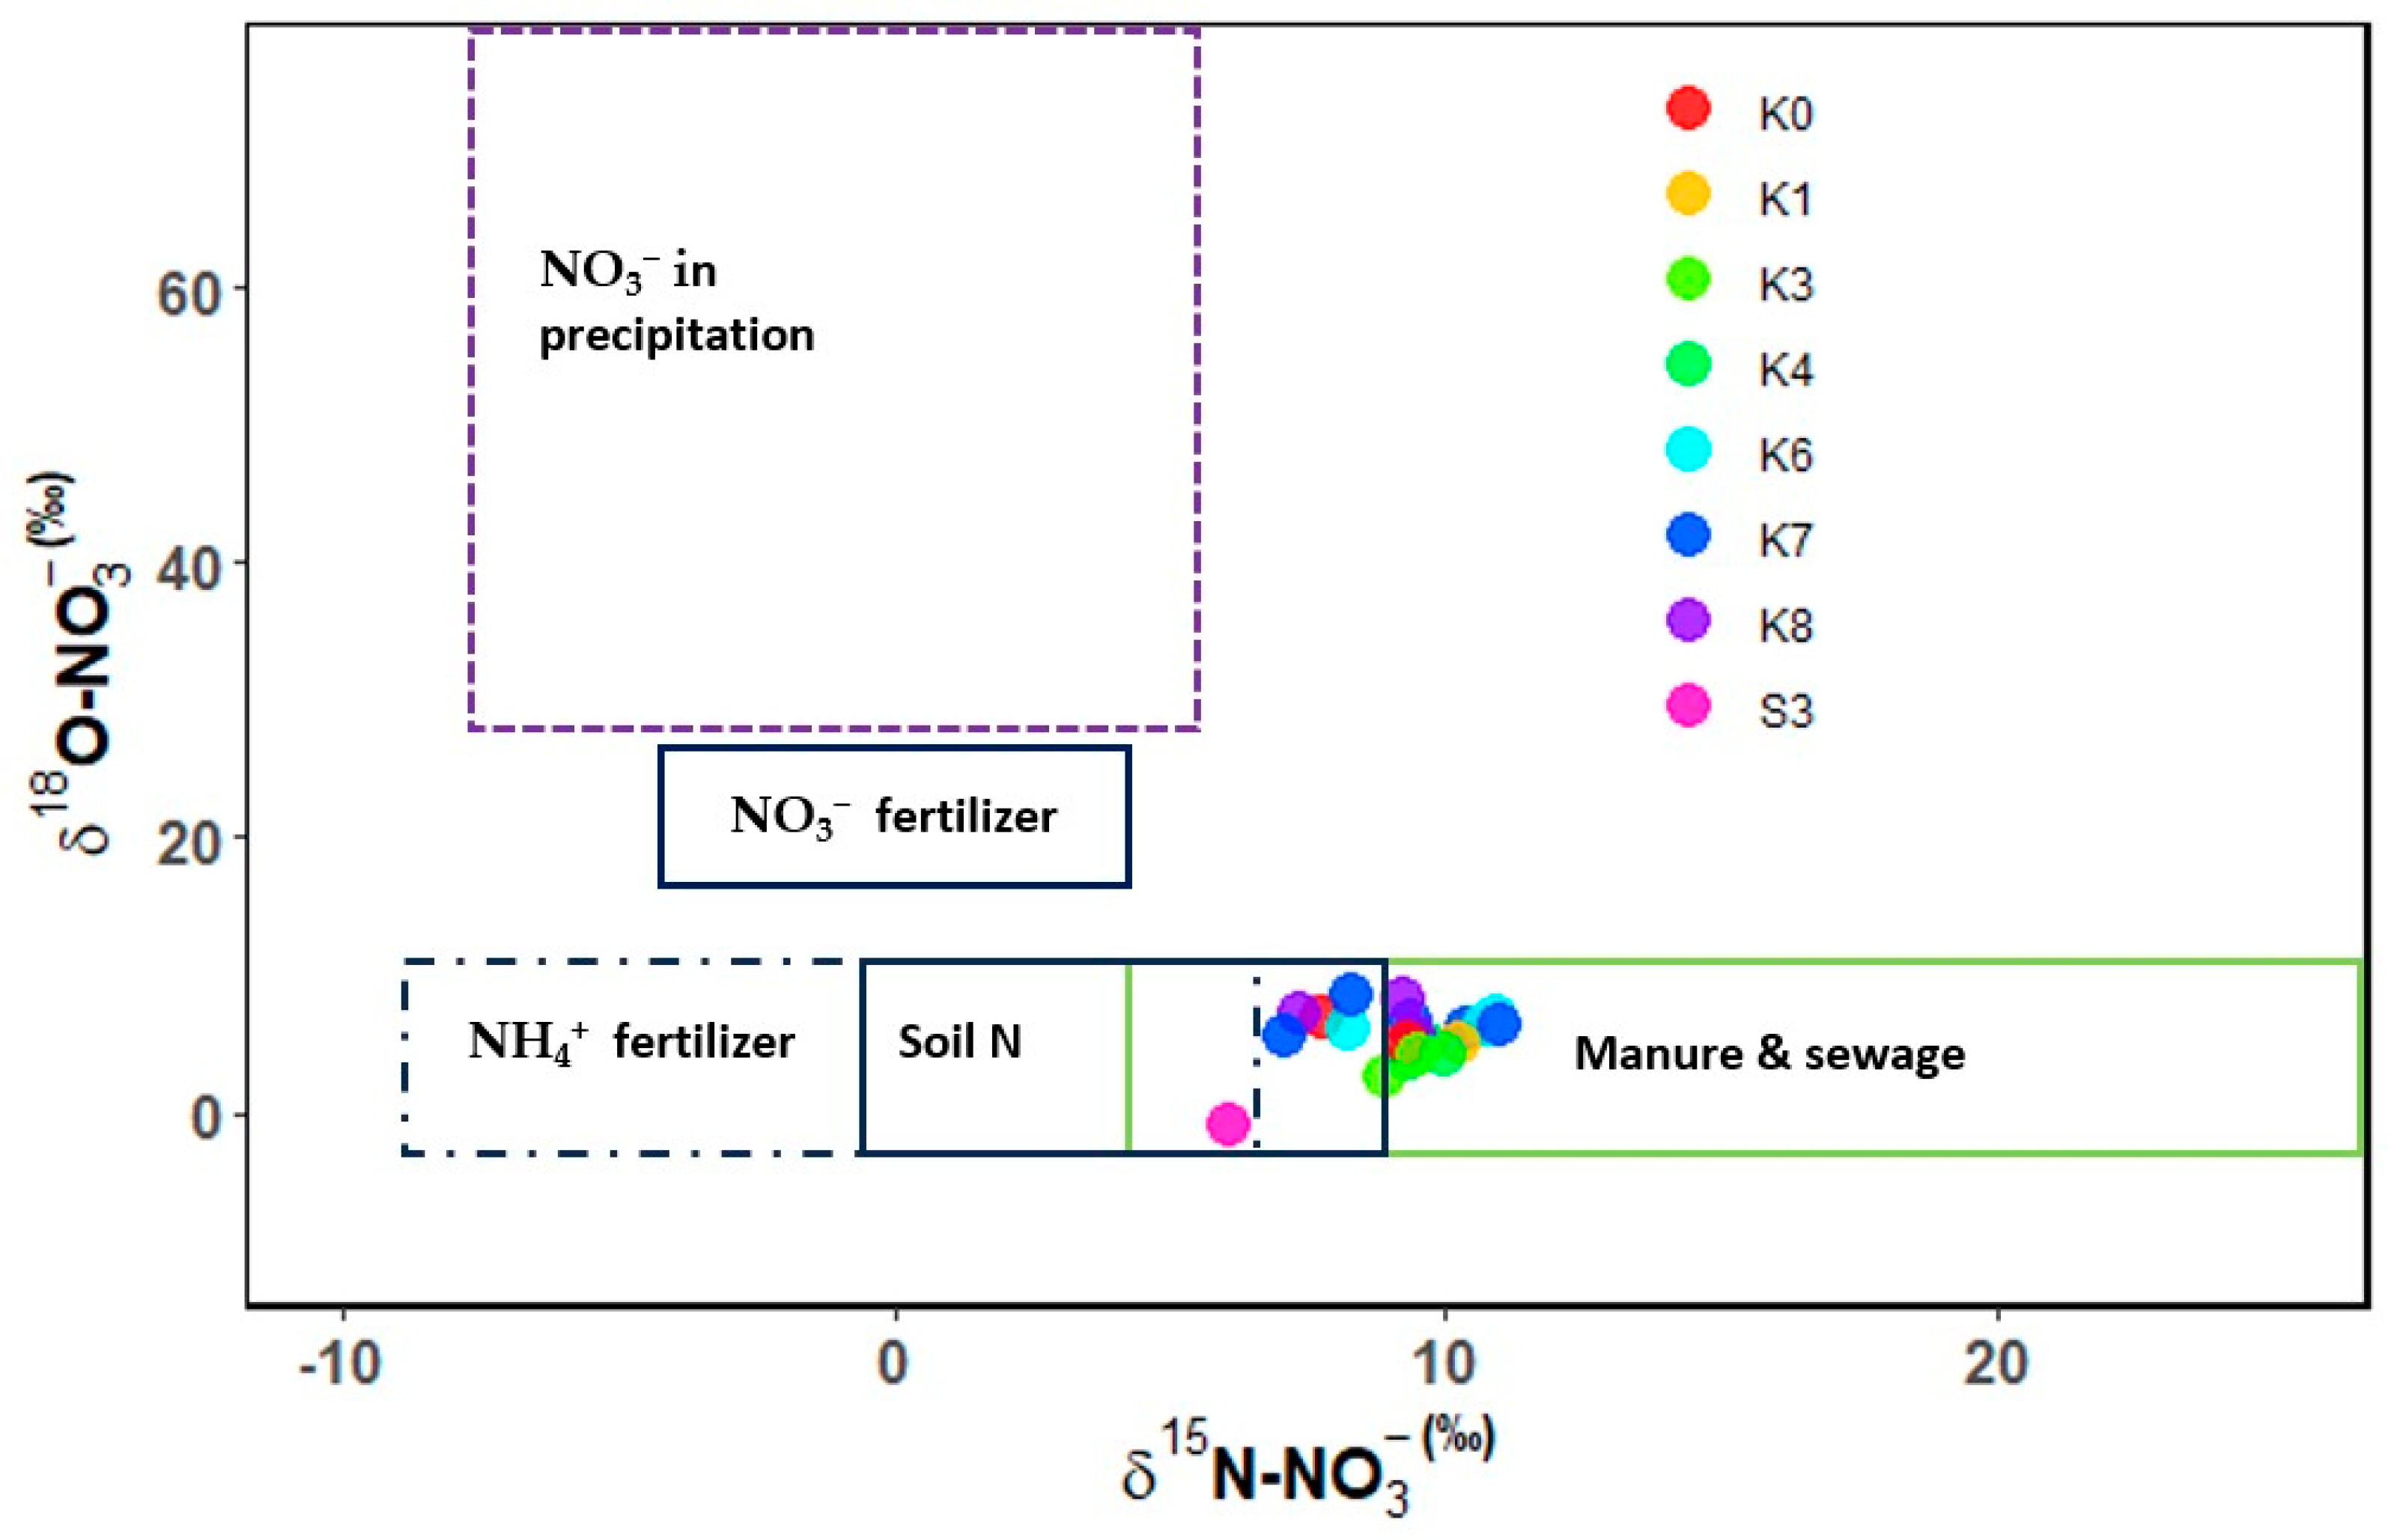
There were no significant spatial and temporal variations of δ15N-NO3− (Table 2 and Table 3). The spatial range was +6.0‰ to +10.2‰. The highest mean of δ15N-NO3− was recorded at K1 and the lowest at S3. The lowest mean δ15N-NO3− was recorded during the end of the wet season, in December, and the highest seasonal rates were observed in September, which concedes with the onset of short rains when most of the farmers plant. The δ15N-NO3− at the Kagera sugarcane growing areas (S1, S2, S4) and K2 and K5 were below the detectable limit.
The values of δ18O-NO3− showed significant spatial variations (Table 2). The mean ranges were −1‰ to +7‰, with low values recorded at S3 and the highest at K8. Across the transect, where the main land use was mainly agricultural and urban settlements, all the sites showed significantly similar values, except for S3, which recorded a significantly lower value (−1‰). S3 is a site in the Kagera sugarcane plantations which could have run-off from the sugarcane plantations, where synthetic fertilizers are used and are possibly different from those used by small-scale farmers. Sites draining the upper Kagera basin (K6 and K7) plotted together, while sites in the mid areas (K3 and K4) had similar plotting, indicating possible land uses. K0 and K8 are both sites in less cultivated areas and have patches of forests, which could be the likely reason for their close plotting proximity. The recorded ranges were within the reported ranges for soil N, NH4+ fertilizer, manure, and sewage (Figure 3). Seasonal δ18O-NO3− ranges were −1‰ during the end of wet-December (short rains) and 8.5‰ during the peak wet-November (short rains) (Table 3). The low values of δ18O-NO3− suggest minimal contributions from atmospheric-deposited nitrogen. Similar to δ15N-NO3−, δ18O-NO3− at S1, S2, and S4, and at K2 and K5 were below the detectable limit. All the samples plotted in the manure and sewage ranges for both the δ15N-NO3− and δ18O-NO3− (Figure 3), indicating the nitrates in the lower Kagera basin are mainly anthropogenic sources.

Figure 3.
δ15N-NO3− and δ18O-NO3− plot of water samples and potential sources of the lower Kagera basin.
3.4. Proportional Contribution of Nitrate Sources
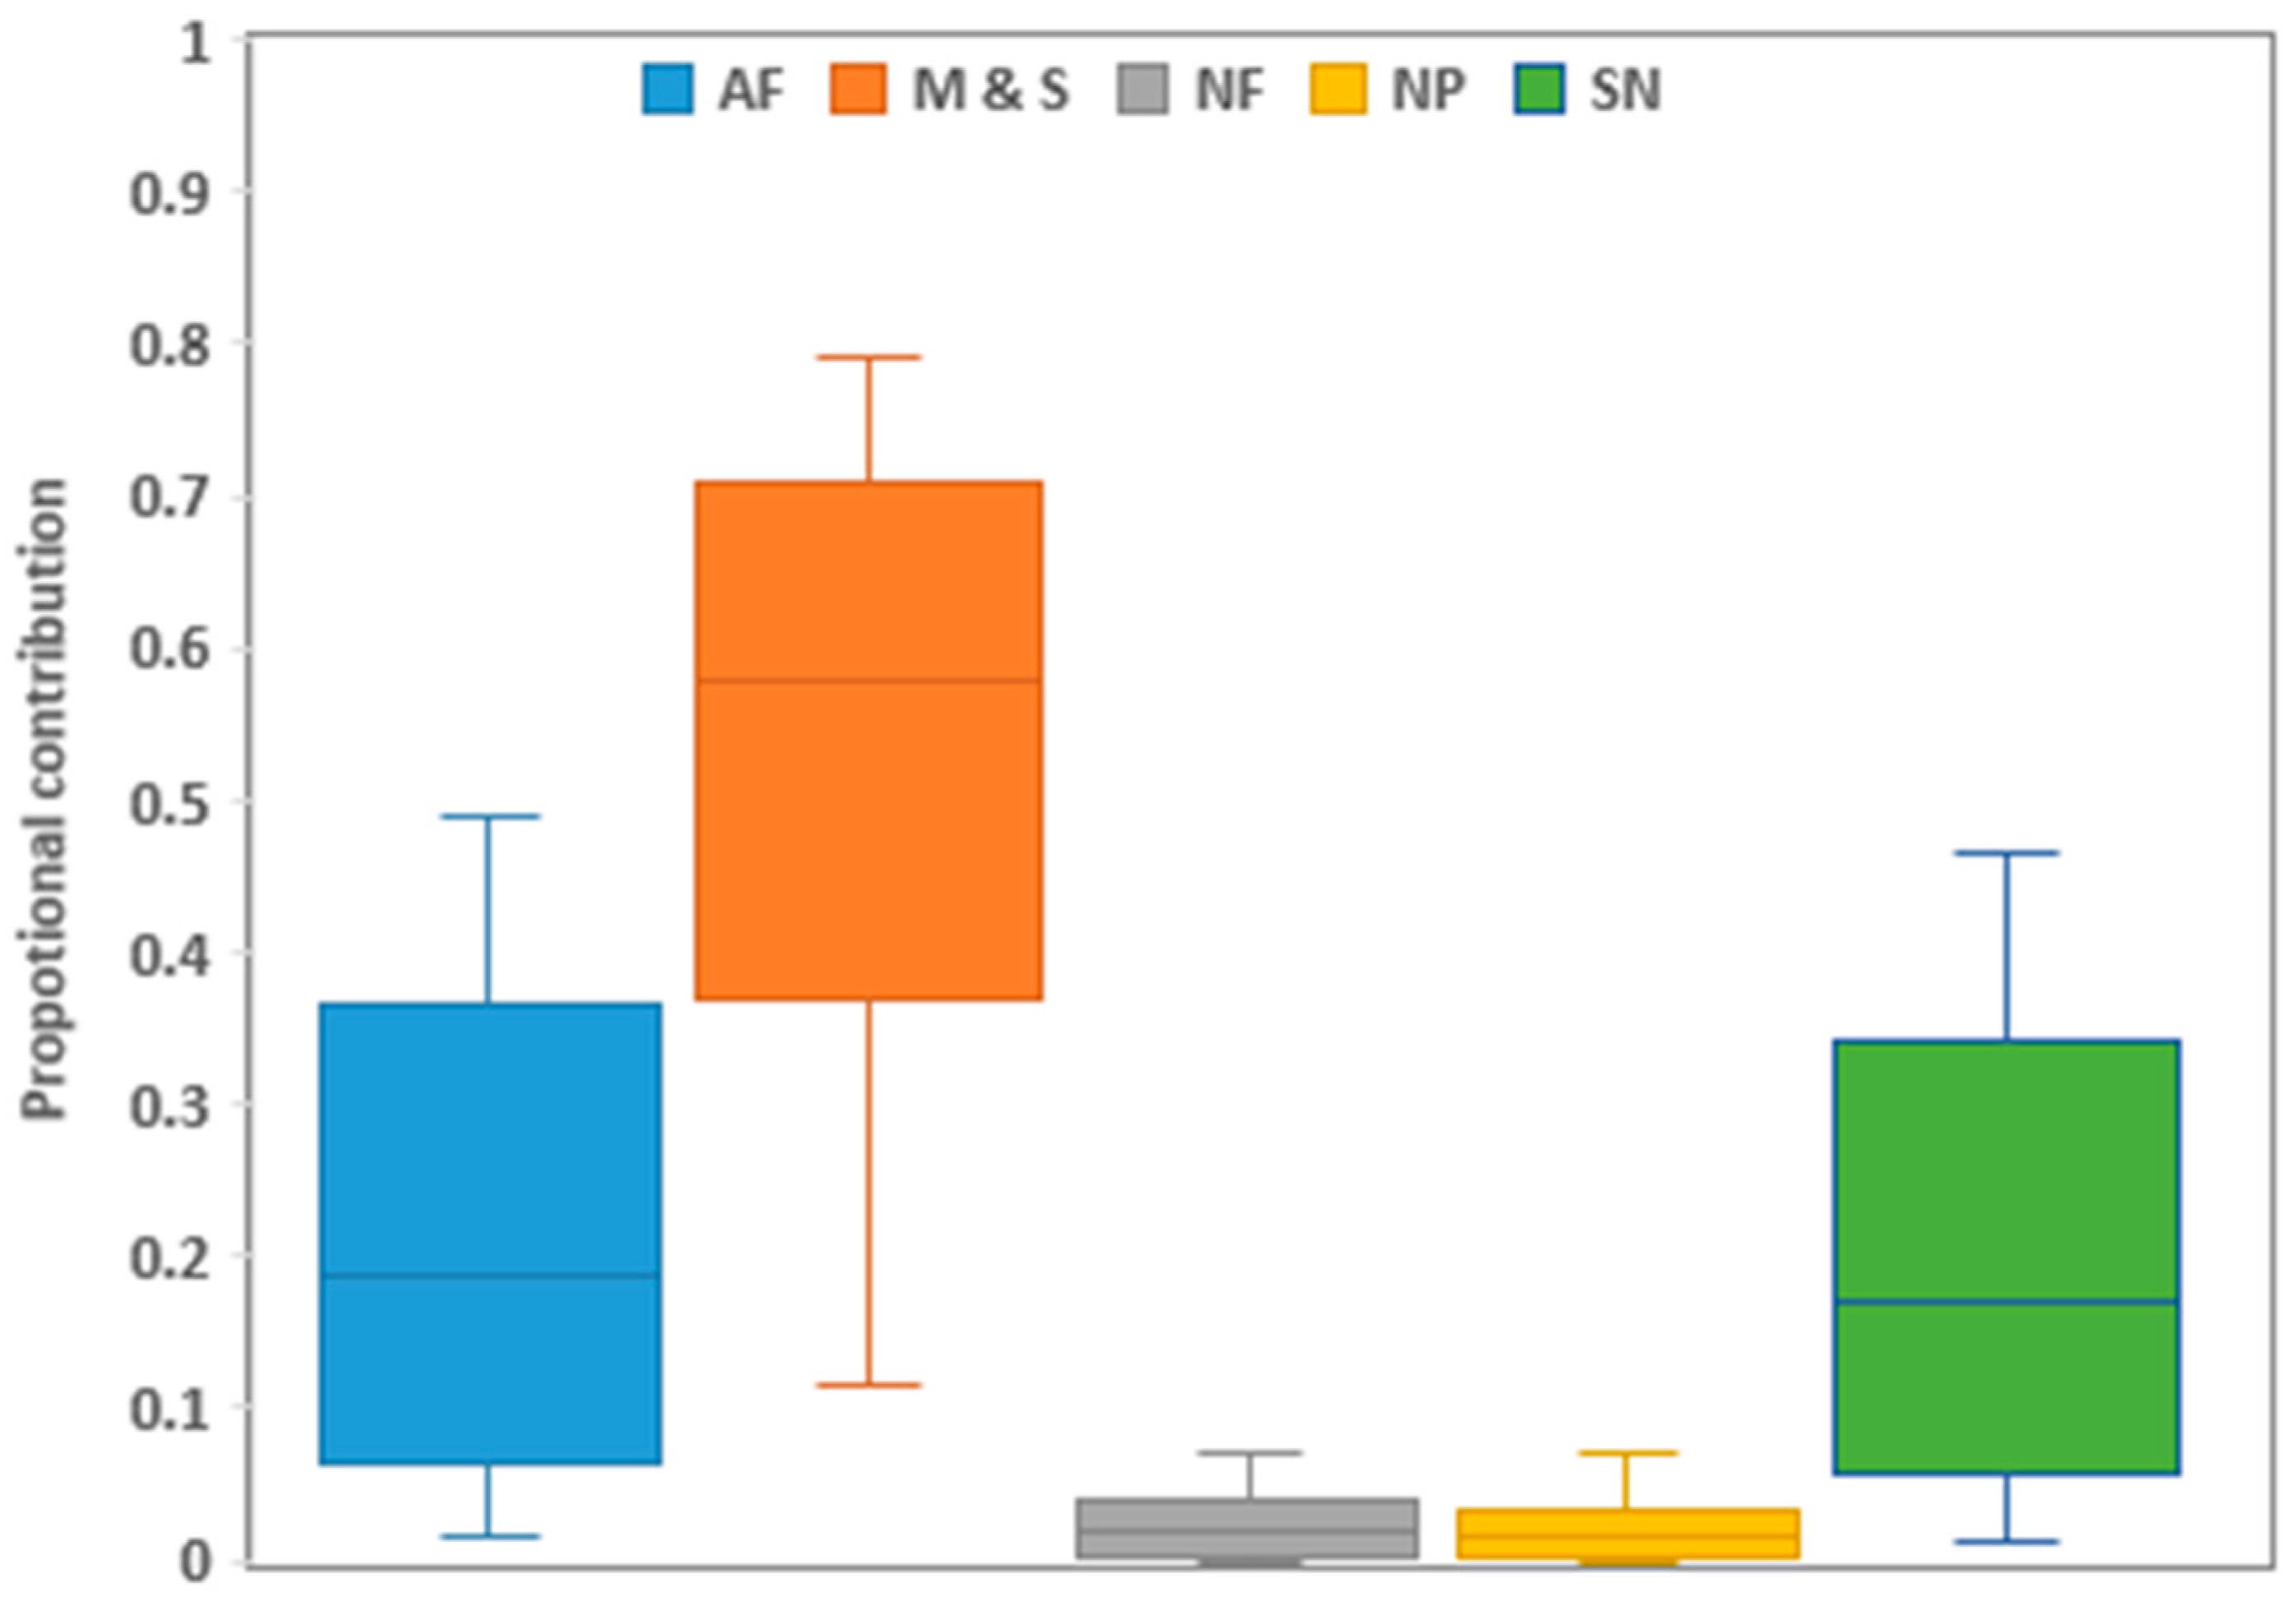
The biplot method identified the primary NO3− sources using the nitrogen and oxygen isotopes (Figure 3). The samples in the biplot show the source distribution of nitrate concentration. Because the biplot has restrictions, such as source overlapping, the Bayesian stable isotope mixing model MixSIAR was used to estimate the relative contribution of each major NO3− source.
The results across the sites showed that manure and sewage (58%, CI 35–79%) had the highest contribution, followed by NH4+ fertilizers (20%, CI 1–48%), soil N (19%, CI 1–46%), and NO3− fertilizers (2%, CI 0–7%), whereas precipitation (1%, CI 0–7%) had the lowest nitrate contribution (Figure 4).

Figure 4.
Proportional contributions of primary NO3− sources across all sampled sites in the lower Kagera basin. Boxplots show the 25th, 50th, and 75th percentiles, while whiskers illustrate the 5th and 95th percentiles. M & S is manure and sewage, AF is ammonium-based fertilizers (urea), NF is nitrate-based fertilizers (NPK mixtures), SN is soil nitrogen, and NP is nitrate in precipitation.
The spatial proportion contributions for manure and sewage were highest at S3 (73%) and lowest at K8 (49%), in the order S3 > K1 > K3 > K7 > K6 > K7 > K8 (Figure S1). Ammonium-based fertilizers were the second nitrate contributor, with K0, K8, and K6 (24%) having the highest and S3 having the lowest contribution. Soil N was third, with K8 having the highest contribution and S3 having the lowest contribution. The contribution of nitrate-based fertilizers was in the range of 1–3%, while nitrates in the precipitation were in the range of 1–2%.
Based on the MixSIAR model results, manure and sewage samples were difficult to distinguish. Therefore, the analysis of boron isotopes was used to try to overcome this challenge because manure shows distinct δ11B signatures ranging from −7.7‰ to +12.9‰ and sewage from +6.9‰ to 42.1‰ [30,36,37]. Water samples showed boron concentration ranges of 4.1–40 µg L−1 (Figure 5), while source samples were as follows: manure 20 µg L−1, NPK 9.7 µg L−1, Urea 0.5 µg L−1, and sewage 117.4 µg L−1. The δ11B values for inorganic N-based fertilizer were −1 to −6‰, sewage +33‰, manure +22‰, with surface water values ranging from −1‰ to +16‰. The selected water samples plotted with the manure ranges indicated a larger contribution to the manure and sewage proportions of the MixSIAR results. Sites K2, K3, and K7 plotted close to NPK fertilizers, these sites are situated in small-scale farming areas where horticultural crops are grown near the river, hence possible fertilizer run off into the river. Although S3 was in close alignment with manure, this site drains the Kagera sugar factory canals and had elevated levels of boron indicating the industrial activities of the factory.
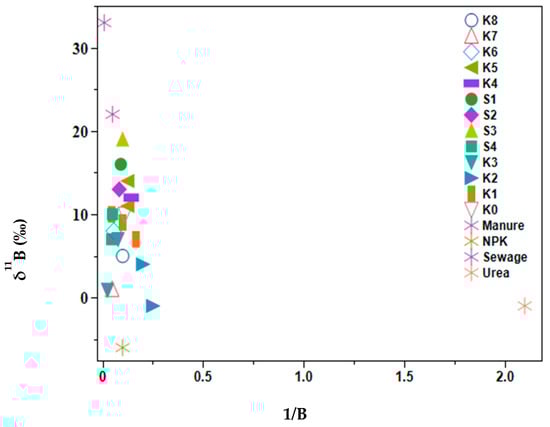
Figure 5.
Biplot of δ11B against 1/B of selected lower Kagera River basin samples and source samples.
4. Discussions
The spatial variability of nitrate concentrations over the lower Kagera watershed area reveals the anthropogenic activities that affect water quality. The contributions of the two main tributaries of the Kagera had elevated levels of nitrate compared to the mid-areas of the catchment, confirming human-related activities in the upper catchments. These elevated nitrate levels in the tributaries could be attributed to the nonpoint nitrate sources in specific areas and low water volume limiting dilution. This is in line with the findings of [38], who observed higher nitrate concentrations in the tributaries than in the mainstream of the Zhaoshandu watershed in China, and the findings of [39] for the Cedar River in Iowa. Forested areas in a catchment are associated with reduced nitrate levels due to the high nitrogen absorption for vegetation growth, soils rich in organic matter limiting its mobility and leaching, and favorable conditions for denitrification that limit the transport of nitrate into the river. The extensive area of the catchment running along the border of Tanzania and Rwanda had relatively low nitrate levels and was mainly characterized by pristine lands and game reserves aligning with the aforementioned factors. Similarly, sites K0, K1, K4, and K5 had nitrate concentrations below 0.5 mg L−1, and were located in areas covering forests with minimal human and agricultural activities, indicating the buffering potential of vegetation in controlling nitrate pollution in water bodies [40]. Despite the mid-areas being dominated by large-scale sugarcane production and the use of inorganic fertilizers, the nitrate levels were relatively lower compared to the areas draining the two major tributaries. This could be due to dilution as indicated by the high mean discharge (252.84 m3/s levels at the lower site, after the large sugarcane plantation (K3), compared to the mean discharge of 87.9 m3/s for K8, one of the tributaries from Burundi. This suggests that human settlement contributes more to nitrate loading in the river than large-scale agricultural activities. The absence of substantial seasonal fluctuations in nitrate concentrations were also reported in the Nyando River [23], which indicates that localized land use dominates temporal fluctuations in precipitation or agricultural operations as the main drivers of spatial disparities. This also aligns with the findings of [41], who observed that, although seasonal variables can impact nutrient concentrations, land-use type and intensity are frequently more significant determinants of spatial variation in water quality. Additionally, other studies in the sub-Saharan African basins have shown no seasonal variations in nitrate concentrations for wet and dry seasons [42]. However, it is important to highlight the comparatively elevated levels of nitrates observed during the dry period, which is similar to the study of [43] and SW during September. This may be linked to decreased agricultural activities during the dry season (Dry-July), while the increased runoff at the beginning of the rainy season (SW-Sep) aligns with planting and the peak wet season (PW-Nov) during the topdressing period, when organic and inorganic fertilizers are applied. The nitrate concentrations in the sugarcane growing areas in this study were <1 mg L−1 and were lower than those recorded in the Nyando River in the Lake Victoria basin [23]; whereas sites in the forested areas recorded relatively similar nitrate concentrations to those of the Sondu River in the Mau forest complex [40]. The nitrate concentration in the forested areas of the lower Kagera basin was generally below 1 mg L−1, similar to other tropical rivers [44,45,46].
Hydrochemistry has proven to be one of the methods used to quantify the chemical composition of surface and underground water. Quantifying the chemical composition of water quality provides directions for the levels of nutrients, nutrient sources, and geochemical and hydrological processes, as well as insights for environmental monitoring and management. The chloride-to-nitrate relationship has been used to confirm the sources of nitrate in several studies [23,47,48,49,50]. A strong linear correlation between nitrate and chloride indicates the same sources, while deviations from this indicate mixed nitrate sources (Table S2). There was no correlation between chloride and nitrate, indicating that nitrate originated from different sources. Additionally, there was no correlation between sulfate, ammonium, and nitrate, which could indicate nitrates from industrial pollution or agricultural runoff from inorganic fertilizers. High chloride concentrations in surface water are linked to the mixing of sewage and draining of animal waste, which are potential nitrate sources in surface and underground water [35]. The chloride concentrations in the lower Kagera were >10 mg L−1 across all sites, indicating the possibility of sewage mixing or manure from neighboring areas. These results were further confirmed by multi-tracer analysis in this study.
The values of δ15N-NO3− in all the sites recorded values >+5‰ (Table 2), which are values associated with catchments with high agricultural activities and urban settlement [4,25]. Overall, the mean value ranges were within manure and sewage [30,51], expect for the S3 which had lower δ15N-NO3−. K1 is a site located in an area where open livestock grazing is practiced, and livestock water points could be a possible reason for the low rates which are indicative of nitrates from manure. The low δ15N-NO3− at S3 shows possible impacts of inorganic fertilizers used in the sugarcane plantation. The low variation range in the δ15N-NO3− with no significant difference indicates nitrate was possibly from the same sources or transformation processes [52]. These ranges are similar to those reported for surface waters in the Kenyan catchment of the Lake Victoria basin, −4.5‰ to +19.7‰ in [22] and −13.1‰ to +26.9‰ in [1] in a watershed in China, and generally indicate nitrified sources (−10‰ to +15‰) [4,30,53]. Since there were no significant temporal δ18O-NO3− variations, it is assumed that the recorded ranges were source contributions rather than seasonal atmospheric oxidation changes [51]. S3, a site draining the sugarcane plantation, showed significantly lower values that relate to manure, as further revealed by the boron analysis (Figure 5). Although the site was in the sugarcane plantation irrigation canal and was expected to contain inorganic fertilizers, the boron analysis showing proximity to the manure sources indicates the impact of manure. Similar observations have been reported in the Yellow River irrigation areas, since the irrigated canals are mainly distributed in villages, living quarters, and scattered livestock farms [54]. The ranges of δ18O-NO3− in this study show that the probability of nitrates from nitrate-based fertilizers and precipitation is minimal, which aligns with the studies of [55], who found a minimal use of inorganic N sources in the Kagera region in Tanzania.
Nitrogen forms in aquatic systems can be transformed through multiple biogeochemical cycles, such as denitrification, nitrification, and biological assimilation. The isotopic values of δ18O-NO3− and δ15N-NO3− can indicate these transformation processes [47]. Studies have shown that, during denitrification, δ15N-NO3− and δ18O-NO3− simultaneously increase with ratios ranging from 1.3:1 to 2.1:1, while nitrification leads to a decrease of δ15N and δ18O in water with increased nitrate concentration [29,56,57]. The ratios of δ15N-NO3− and δ18O-NO3− at K0, K1, K6, and K7 were within the reported denitrification ratios indicating in situ denitrification occurred. On the contrary, the DO at these sites was <2 mg L−1, which is the threshold for denitrification to take place. The δ15N-NO3− and δ18O-NO3− at (S1, S2, and S4) the sugarcane growing areas were BDL with DO levels of ≤2 mg L−1, which indicates the possibility of in situ denitrification, hence the low level of nitrates.
The use of a biplot of isotopic signatures for potential nitrate sources and isotopic signatures for water samples allows for the visualization of likely sources of nitrate pollution using the ranges of potential sources [20,51]. However, this method has limitations, as it provides a qualitative assessment and, when sources overlap, it is not easy to distinguish between them. On the other hand, the MixSIAR Bayesian mixing model quantitively estimates the contribution of different sources while accounting for natural variability, solving mixing scenarios and overlapping sources coupled with uncertainty analysis [19,21]. The local potential nitrates were used to improve the model (Table S1). The model results showed that the highest contribution across all sites in the lower Kagera basin was from manure and sewage (Figure 5). The mean contributions of manure and sewage at 95% confidence intervals ranged between 49%, with a confidence interval of (CI) 32–73%, and 73%, with a CI of 23–96%. This aligns with the results of [22], which had similar results for manure and sewage contributing the highest nitrate in the Nyando River draining to the Lake Victoria basin in the Kenyan catchment. Similar studies have demonstrated the significant contribution of manure and sewage in agricultural areas [43,47,58,59]. This is mainly due to the free-range method of grazing livestock in the Lake Victoria basin, farmers using manure as a fertilizer that is carried into the river during the rainy seasons as surface runoff, and the limited capacity for treating sewage. The use of manure in the Lake Victoria basin is attributed to its availability and affordability compared to inorganic fertilizers [55]. The δ11B analysis showed that a higher concentration of nitrates in the MS originated from the manure. However, sewage nitrate sources cannot be completely ignored because sewage systems are not connected to a sewerage system and human settlements use pit latrines that can overflow during rainy periods. The contribution of AF was the second nitrate contributor across all the sites, which indicates the contribution of fertilizers such as urea which is the most commonly used nitrogen fertilizer in the lake basin. Similar findings were observed in the Huihe River in east China, where subsistence farming was the main land use [43]. Contributions from SN were close to AF, indicating agricultural activities in the lower Kagera basin and were similar to a study of surface water in Ghana [60]. The close contributions of AF and SN indicate that ammonium is converted into organic nitrogen by soil microorganisms and washed into the river as surface runoff. Downslope cultivation, land preparation, and planting during the onset of rain escalate soil erosion. Among the five nitrate sources, the contribution of atmospheric deposition was the least aligned with other studies in different basins [23,38,60].
5. Conclusions
The assessment of nitrate sources in the lower Kagera basin, using hydrochemistry, isotopic signatures, and the MixSIAR Bayesian mixing model is the first study to use a multi-tracer approach that provides insightful conclusions about the primary contributors to nitrate pollution. The spatial variation in nitrate concentrations reflects the different point sources related to land use in the catchment. These results consistently indicate that manure and sewage were the predominant sources of nitrate pollution across all sampled sites in the lower Kagera basin. The significant impact of manure and sewage is particularly evident in agricultural areas, where mixed farming practices prevail. The prevalence of free-range grazing and the widespread use of manure as a fertilizer, driven by its availability and affordability compared to inorganic fertilizers, contribute substantially to the nitrate levels in these regions. Ammonium-based fertilizer and soil N contributed relatively the same nitrate load. These findings have important implications for nitrogen management at both the regional and international levels. In the Lake Victoria basin, it is important to improve manure handling and management practices and adopt good agronomic practices, such as 4R stewardship (right source, right rate, right time, and right place) for organic fertilizers. Farmers should also be encouraged to apply manure during growing seasons to optimize crop uptake, compost manure to stabilize nitrogen, plant cover crops to absorb residual nitrates after manure application, and use contours and terraces to slow surface runoff. Policymakers should focus on establishing nutrient management plans and cross-border collaboration between Rwanda, Burundi, Tanzania, and Uganda to enhance nitrogen pollution control through joint monitoring and shared best practices. Additionally, to mitigate sewage-related nitrate pollution, effective waste treatment solutions, such as decentralized wastewater treatment systems for rural areas, upgrading urban sewage treatment plants, improving stormwater management, and promoting wastewater reuse policies, should be prioritized. While this study has focused on the lower Kagera basin and highlighted the nitrate contributions of the two main tributaries from Rwanda and Burundi, further studies are needed to understand nitrate dynamics in the upper Kagera basin and the impact of land use on nitrate loading. Such studies will provide a more comprehensive view of basin-wide nitrate pollution, helping to tailor management strategies that address local nitrogen sources and regional water quality challenges.
Supplementary Materials
The following supporting information can be downloaded at: https://www.mdpi.com/article/10.3390/hydrology12040084/s1, Figure S1: MixSIAR output on proportional contributions of potential nitrate sources for the lower Kagera River sites. Boxplots show the 25th, 50th, and 75th percentiles, while whiskers illustrate the 5th and 95th percentiles. Where M &S is manure and sewage, AF is ammonium-based fertilizers (urea), NF is nitrate-based fertilizers (NPK mixtures), SN is soil nitrogen, and NP is nitrate in precipitation; Table S1: δ15N-NO3−, δ18O-NO3− values of potential nitrate sources used in the MixSIAR model. Table S2: Pearsons’s correlation matrix summary of water parameters for the lower Kagera River.
Author Contributions
Conceptualization, C.M. (Cargele Masso), B.N., S.M., P.B. and C.M. (Catherine Mathenge); methodology, C.M. (Catherine Mathenge), B.N., S.M. and P.B.; software, C.M. (Catherine Mathenge); validation, B.N. and S.M.; formal analysis, C.M. (Catherine Mathenge) and B.N.; investigation, C.M. (Catherine Mathenge) and B.N.; resources, C.M. (Cargele Masso), S.M. and P.B.; data curation, C.M. (Catherine Mathenge); writing—original draft preparation, C.M. (Catherine Mathenge); writing—review and editing, B.N., S.M. and P.B.; visualization, C.M. (Catherine Mathenge) and B.N.; supervision, S.M., B.N., P.B. and C.M. (Cargele Masso); project administration, C.M. (Cargele Masso) and S.M.; funding acquisition, C.M (Cargele Masso). All authors have read and agreed to the published version of the manuscript.
Funding
This study was jointly funded by the International Institute of Tropical Agriculture (IITA) through Integrated Nitrogen Management Systems and the International Atomic Energy Agency (IAEA) under the RAF7021 project.
Data Availability Statement
Data will be published as Data in Brief.
Acknowledgments
We thank the Lake Victoria Basin Commission (LVBC) for logistical linkages with the Tanzania Ministry of Water: Kagera catchment division in Bukoba, Integrated Nitrogen Studies in Africa (INSA) for the secondment at Ghent University, the Ministry of Water Bukoba team for their logistical support during the entire sampling period, and the ISOFYS team for analytical support.
Conflicts of Interest
The authors declare no conflicts of interest.
References
- Jin, Z.; Qin, X.; Chen, L.; Jin, M.; Li, F. Using dual isotopes to evaluate sources and transformations of nitrate in the West Lake watershed, eastern China. J. Contam. Hydrol. 2015, 177–178, 64–75. [Google Scholar] [CrossRef] [PubMed]
- Chen, F.; Jia, G.; Chen, J. Nitrate sources and watershed denitrification inferred from nitrate dual isotopes in the Beijiang River, south China. Biogeochemistry 2009, 94, 163–174. [Google Scholar] [CrossRef]
- Cole, M.L.; Kroeger, K.D.; McClelland, J.W.; Valiela, I. Effects of watershed land use on nitrogen concentrations and δ15 nitrogen in groundwater. Biogeochemistry 2006, 77, 199–215. [Google Scholar] [CrossRef]
- Mayer, B.; Boyer, E.W.; Goodale, C.; Jaworski, N.A.; Van Breemen, N.; Howarth, R.W.; Seitzinger, S.; Billen, G.; Lajtha, K.; Nadelhoffer, K.; et al. Sources of nitrate in rivers draining sixteen watersheds in the northeastern U.S.: Isotopic constraints. Biogeochemistry 2002, 57–58, 171–197. [Google Scholar] [CrossRef]
- Panno, S.V.; Kelly, W.R.; Hackley, K.C.; Hwang, H.H.; Martinsek, A.T. Sources and fate of nitrate in the Illinois River Basin, Illinois. J. Hydrol. 2008, 359, 174–188. [Google Scholar] [CrossRef]
- Scheren, P.A.G.M.; Zanting, H.A.; Lemmens, A.M.C. Estimation of water pollution sources in Lake Victoria, East Africa: Application and elaboration of the rapid assessment methodology. J. Environ. Manag. 2000, 58, 235–248. [Google Scholar] [CrossRef]
- Fukada, T.; Hiscock, K.M.; Dennis, P.F.; Grischek, T. A dual isotope approach to identify denitrification in groundwater at a river-bank infiltration site. Water Res. 2003, 37, 3070–3078. [Google Scholar] [CrossRef]
- Kendall, C. Tracing Nitrogen Sources and Cycling in Catchments. In Isotope Tracers in Catchment Hydrology; Elsevier: Amsterdam, The Netherlands, 1998; pp. 519–576. ISBN 978-0-444-81546-0. [Google Scholar] [CrossRef]
- Machiwa, P.K. Water quality management and sustainability: The experience of Lake Victoria Environmental Management Project (LVEMP)—Tanzania. Phys. Chem. Earth 2003, 28, 1111–1115. [Google Scholar] [CrossRef]
- Kayombo, S.; Jorgensen, S.E. Experience and Lessons Learned Brief; Royal Danish University of Pharmaceutical Sciences: Copenhagen, Demark, 2002. [Google Scholar]
- Okungu, J.O.; Rutagemwa, D.K.; Ssenfuma-Nsubuga, M.; Abuodha, J.O.Z.; Muyodi, F.J.; Hecky, R.E. The Changing Water Quality of Lake Victoria, Current Conditions, Trends and Required Action; Uganda National Council for Science and Technology: Kampala, Uganda, 2005. [Google Scholar]
- Albright, T.P.; Moorhouse, T.G.; McNabb, T.J. The rise and fall of water hyacinth in Lake Victoria and the Kagera River basin, 1989–2001. J. Aquat. Plant Manag. 2004, 42, 73–84. [Google Scholar]
- Dersseh, M.G.; Steenhuis, T.S.; Kibret, A.A.; Eneyew, B.M.; Kebedew, M.G.; Zimale, F.A.; Worqlul, A.W.; Moges, M.A.; Abebe, W.B.; Mhiret, D.A.; et al. Water Quality Characteristics of a Water Hyacinth Infested Tropical Highland Lake: Lake Tana, Ethiopia. Front. Water 2022, 4, 774710. [Google Scholar] [CrossRef]
- Jayaweera, M.W.; Kasturiarachchi, J.C. Removal of nitrogen and phosphorus from industrial wastewaters by phytoremediation using water hyacinth (Eichhornia crassipes (Mart.) Solms). Water Sci. Technol. 2004, 50, 217–225. [Google Scholar] [CrossRef]
- Berakhi, R.O.; Oyana, T.J.; Adu-Prah, S. Land use and land cover change and its implications in Kagera river basin, East Africa. Afr. Geogr. Rev. 2015, 34, 209–231. [Google Scholar] [CrossRef]
- Ogola, S.A. Land and Natural Resources Conflicts in Transboundary Agroecosystem Management Project Kagera Basin; Food and Agriculture Organization (FAO): Rome, Italy, 2014. [Google Scholar]
- LVEMP. Lake Victoria Regional Water Quality Synthesis Report Lake Victoria Environment Management Project (LVEMP) Water Quality and Ecosystem Status; South Eastern Kenya University: Kwa Vonza, Kenya, 2005. [Google Scholar]
- Wali, U.G. Modelling of Nonpoint Source Pollution in Akagera Transboundary River in Rwanda. Open Environ. Eng. J. 2011, 4, 124–132. [Google Scholar] [CrossRef]
- Blake, W.; Smith, H.; Navas, A.; Bodé, S.; Goddard, R.; Zou Kuzyk, Z.; Lennard, A.; Lobb, D.; Owens, P.; Palazon, L.; et al. Application of hierarchical Bayesian unmixing models in river sediment source apportionment. EGU Gen. Assem. Conf. Abstr. 2016, 18, 10. [Google Scholar]
- Ransom, K.M.; Grote, M.N.; Deinhart, A.; Eppich, G.; Kendall, C.; Sanborn, M.E.; Souders, A.K.; Wimpenny, J.; Yin, Q.; Young, M.; et al. Bayesian nitrate source apportionment to individual groundwater wells in the Central Valley by use of elemental and isotopic tracers. Water Resour. Res. 2016, 52, 5577–5597. [Google Scholar] [CrossRef]
- Stock, B.C.; Jackson, A.L.; Ward, E.J.; Parnell, A.C.; Phillips, D.L.; Semmens, B.X. MixSIAR model description. PeerJ 2018, 6, e5096. [Google Scholar] [CrossRef] [PubMed]
- Nyilitya, B.; Mureithi, S.; Boeckx, P. Land use controls Kenyan riverine nitrate discharge into Lake Victoria–evidence from Nyando, Nzoia and Sondu Miriu river catchments*. Isot. Environ. Health Stud. 2020, 56, 170–192. [Google Scholar] [CrossRef]
- Nyilitya, B.; Mureithi, S.; Bauters, M.; Boeckx, P. Nitrate source apportionment in the complex Nyando tropical river basin in Kenya. J. Hydrol. 2021, 594, 125926. [Google Scholar] [CrossRef]
- Nyilitya, B.; Mureithi, S.; Boeckx, P. Tracking Sources and Fate of Groundwater Nitrate in Kisumu City and Kano Plains, Kenya. Water 2020, 12, 401. [Google Scholar] [CrossRef]
- Nestler, A.; Berglund, M.; Accoe, F.; Duta, S.; Xue, D.; Boeckx, P.; Taylor, P. Isotopes for improved management of nitrate pollution in aqueous resources: Review of surface water field studies. Environ. Sci. Pollut. Res. 2011, 18, 519–533. [Google Scholar] [CrossRef]
- Pastén-Zapata, E.; Ledesma-Ruiz, R.; Harter, T.; Ramírez, A.I.; Mahlknecht, J. Assessment of sources and fate of nitrate in shallow groundwater of an agricultural area by using a multi-tracer approach. Sci. Total Environ. 2014, 470–471, 855–864. [Google Scholar] [CrossRef]
- Tamborski, J.; Brown, C.; Bokuniewicz, H.; Cochran, J.K.; Rasbury, E.T. Investigating Boron Isotopes for Identifying Nitrogen Sources Supplied by Submarine Groundwater Discharge to Coastal Waters. Front. Environ. Sci. 2020, 8, 126. [Google Scholar] [CrossRef]
- Tirez, K.; Brusten, W.; Widory, D.; Petelet, E.; Bregnot, A.; Xue, D.; Boeckx, P.; Bronders, J. Boron isotope ratio (δ11B) measurements in Water Framework Directive monitoring programs: Comparison between double focusing sector field ICP and thermal ionization mass spectrometry. J. Anal. At. Spectrom. 2010, 25, 964–974. [Google Scholar] [CrossRef]
- Niu, X.; Jia, X.; Yang, X.; Wang, J.; Wei, X.; Wu, L.; Shao, M. Tracing the Sources and Fate of NO3− in the Vadose Zone–Groundwater System of a Thousand-Year-Cultivated Region. Environ. Sci. Technol. 2022, 56, 9335–9345. [Google Scholar] [CrossRef] [PubMed]
- Xue, D.; Botte, J.; De Baets, B.; Accoe, F.; Nestler, A.; Taylor, P.; Van Cleemput, O.; Berglund, M.; Boeckx, P. Present limitations and future prospects of stable isotope methods for nitrate source identification in surface- and groundwater. Water Res. 2009, 43, 1159–1170. [Google Scholar] [CrossRef] [PubMed]
- Wasige, J.E.; Groen, T.A.; Smaling, E.; Jetten, V. Monitoring basin-scale land cover changes in Kagera Basin of Lake Victoria using: Ancillary data and remote sensing. Int. J. Appl. Earth Obs. Geoinf. 2013, 21, 32–42. [Google Scholar] [CrossRef]
- Sigman, D.M.; Casciotti, K.L.; Andreani, M.; Barford, C.; Galanter, M.; Böhlke, J.K. A bacterial method for the nitrogen isotopic analysis of nitrate in seawater and freshwater. Anal. Chem. 2001, 73, 4145–4153. [Google Scholar] [CrossRef]
- World Health Organization. Guidelines for Drinking-Water Quality: Small Water Supplies; World Health Organization: Geneva, Switzerland, 2024. [Google Scholar]
- Hong, Y.; Zhu, Z.; Liao, W.; Yan, Z.; Feng, C.; Xu, D. Freshwater Water-Quality Criteria for Chloride and Guidance for the Revision of the Water-Quality Standard in China. Int. J. Environ. Res. Public Health 2023, 20, 2875. [Google Scholar] [CrossRef]
- Kothari, V.; Vij, S.; Sharma, S.; Gupta, N. Correlation of various water quality parameters and water quality index of districts of Uttarakhand. Environ. Sustain. Indic. 2021, 9, 100093. [Google Scholar] [CrossRef]
- Widory, D.; Kloppmann, W.; Chery, L.; Bonnin, J.; Rochdi, H.; Guinamant, J.-L. Nitrate in groundwater: An isotopic multi-tracer approach. J. Contam. Hydrol. 2004, 72, 165–188. [Google Scholar] [CrossRef]
- Widory, D.; Petelet-Giraud, E.; Négrel, P.; Ladouche, B. Tracking the Sources of Nitrate in Groundwater Using Coupled Nitrogen and Boron Isotopes: A Synthesis. Environ. Sci. Technol. 2005, 39, 539–548. [Google Scholar] [CrossRef]
- Shu, L.; Chen, W.; Liu, Y.; Shang, X.; Yang, Y.; Dahlgren, R.A.; Chen, Z.; Zhang, M.; Ji, X. Riverine nitrate source identification combining δ15N/δ18O-NO3− with Δ17O-NO3− and a nitrification 15N-enrichment factor in a drinking water source region. Sci. Total Environ. 2024, 918, 170617. [Google Scholar] [CrossRef] [PubMed]
- Donaghy, J. Calculating Nutrient Loads from Four Tributaries of the Cedar River in Iowa. Master’s Thesis, University of Northern Iowa, Cedar Falls, IA, USA, 2014. [Google Scholar]
- Jacobs, S.R.; Breuer, L.; Butterbach-Bahl, K.; Pelster, D.E.; Rufino, M.C. Land use affects total dissolved nitrogen and nitrate concentrations in tropical montane streams in Kenya. Sci. Total Environ. 2017, 603–604, 519–532. [Google Scholar] [CrossRef] [PubMed]
- Carpenter, S.R.; Caraco, N.F.; Correll, D.L.; Howarth, R.W.; Sharpley, A.N.; Smith, V.H. Nonpoint Pollution of Surface Waters with Phosporous and Nitrogen. Ecol. Appl. 1998, 8, 559–568. [Google Scholar] [CrossRef]
- Afrifa, G.Y.; Chegbeleh, L.P.; Sakyi, P.A.; Yidana, S.M.; Loh, Y.A.S.; Ansah-Narh, T.; Manu, E. Quantifying nitrate pollution sources and natural background in an equatorial context: A case of the Densu Basin, Ghana. Hydrol. Sci. J. 2022, 67, 1941–1953. [Google Scholar] [CrossRef]
- Chen, X.; Jiang, C.; Zheng, L.; Dong, X.; Chen, Y.; Li, C. Identification of nitrate sources and transformations in basin using dual isotopes and hydrochemistry combined with a Bayesian mixing model: Application in a typical mining city. Environ. Pollut. 2020, 267, 115651. [Google Scholar] [CrossRef]
- Kilonzo, F.; Masese, F.O.; Griensven, A.V.; Bauwens, W.; Obando, J.; Lens, P.N.L. Spatial–temporal variability in water quality and macro-invertebrate assemblages in the Upper Mara River basin, Kenya. Phys. Chem. Earth Parts A/B/C 2013, 67, 93–104. [Google Scholar] [CrossRef]
- Recha, J.W.; Lehmann, J.; Walter, M.T.; Pell, A.; Verchot, L.; Johnson, M. Stream water nutrient and organic carbon exports from tropical headwater catchments at a soil degradation gradient. Nutr. Cycl. Agroecosyst. 2013, 95, 145–158. [Google Scholar] [CrossRef]
- Masese, F.O.; Salcedo-Borda, J.S.; Gettel, G.M.; Irvine, K.; McClain, M.E. Influence of catchment land use and seasonality on dissolved organic matter composition and ecosystem metabolism in headwater streams of a Kenyan river. Biogeochemistry 2017, 132, 1–22. [Google Scholar] [CrossRef]
- Chen, W.; Zhang, X.; Wu, N.; Yuan, C.; Liu, Y.; Yang, Y.; Chen, Z.; Dahlgren, R.A.; Zhang, M.; Ji, X. Sources and transformations of riverine nitrogen across a coastal-plain river network of eastern China: New insights from multiple stable isotopes. Sci. Total Environ. 2024, 924, 171671. [Google Scholar] [CrossRef]
- Jin, Z.; Cen, J.; Hu, Y.; Li, L.; Shi, Y.; Fu, G.; Li, F. Quantifying nitrate sources in a large reservoir for drinking water by using stable isotopes and a Bayesian isotope mixing model. Environ. Sci. Pollut. Res. 2019, 26, 20364–20376. [Google Scholar] [CrossRef] [PubMed]
- Kohn, J.; Soto, D.X.; Iwanyshyn, M.; Olson, B.; Kalischuk, A.; Lorenz, K.; Hendry, M.J. Groundwater nitrate and chloride trends in an agriculture-intensive area in southern Alberta, Canada. Water Qual. Res. J. 2016, 51, 47–59. [Google Scholar] [CrossRef]
- Shin, W.-J.; Jung, Y.-Y.; Choi, M.; Choi, S.-H.; Choi, H.-B.; Lee, K.-S.; Bong, Y.-S.; Song, H.; Koh, D.-C. National-scale investigation of dual nitrate isotopes and chloride ion in South Korea: Nitrate source apportionment for stream water. Environ. Res. 2023, 228, 115873. [Google Scholar] [CrossRef] [PubMed]
- Kendall, C.; Elliott, E.M.; Wankel, S.D. Tracing Anthropogenic Inputs of Nitrogen to Ecosystems. In Stable Isotopes in Ecology and Environmental Science, 1st ed.; Michener, R., Lajtha, K., Eds.; Wiley: Hoboken, NJ, USA, 2007; pp. 375–449. [Google Scholar] [CrossRef]
- Guo, Z.; Yan, C.; Wang, Z.; Xu, F.; Yang, F. Quantitative identification of nitrate sources in a coastal peri-urban watershed using hydrogeochemical indicators and dual isotopes together with the statistical approaches. Chemosphere 2020, 243, 125364. [Google Scholar] [CrossRef]
- Spalding, R.F.; Hirsh, A.J.; Exner, M.E.; Little, N.A.; Kloppenborg, K.L. Applicability of the dual isotopes δ15N and δ18O to identify nitrate in groundwater beneath irrigated cropland. J. Contam. Hydrol. 2019, 220, 128–135. [Google Scholar] [CrossRef]
- Zhang, Y.; Shi, P.; Li, F.; Wei, A.; Song, J.; Ma, J. Quantification of nitrate sources and fates in rivers in an irrigated agricultural area using environmental isotopes and a Bayesian isotope mixing model. Chemosphere 2018, 208, 493–501. [Google Scholar] [CrossRef]
- Mathenge, C.; Mureithi, S.; Midingoyi, S.-K.; Nyilitya, B.; Kironchi, G.; Masso, C. Unveiling the determinants of the spatial variability of nitrogen sources use in the Lake Victoria basin, East Africa. Environ. Sustain. Indic. 2024, 24, 100484. [Google Scholar] [CrossRef]
- Nikolenko, O.; Jurado, A.; Borges, A.V.; Knöller, K.; Brouyère, S. Isotopic composition of nitrogen species in groundwater under agricultural areas: A review. Sci. Total Environ. 2018, 621, 1415–1432. [Google Scholar] [CrossRef]
- Zhao, G.; Sun, T.; Wang, D.; Chen, S.; Ding, Y.; Li, Y.; Shi, G.; Sun, H.; Wu, S.; Li, Y.; et al. Treated wastewater and weak removal mechanisms enhance nitrate pollution in metropolitan rivers. Environ. Res. 2023, 231, 116182. [Google Scholar] [CrossRef]
- Park, J.; Kim, G.; Kim, T.-H.; Rho, T.; Son, P. Tracing the contributions of different nitrate sources associated with submarine groundwater discharge in coastal seawaters off Jeju Island, Korea. Mar. Chem. 2024, 261, 104382. [Google Scholar] [CrossRef]
- Ren, X.; Yue, F.-J.; Tang, J.; Li, C.; Li, S.-L. Nitrate transformation and source tracking of rivers draining into the Bohai Sea using a multi-tracer approach combined with an optimized Bayesian stable isotope mixing model. J. Hazard. Mater. 2024, 463, 132901. [Google Scholar] [CrossRef] [PubMed]
- Saka, D.; Adu-Gyamfi, J.; Skrzypek, G.; Antwi, E.O.; Heng, L.; Torres- Martínez, J.A. Disentangling nitrate pollution sources and apportionment in a tropical agricultural ecosystem using a multi-stable isotope model. Environ. Pollut. 2023, 328, 121589. [Google Scholar] [CrossRef] [PubMed]


Disclaimer/Publisher’s Note: The statements, opinions and data contained in all publications are solely those of the individual author(s) and contributor(s) and not of MDPI and/or the editor(s). MDPI and/or the editor(s) disclaim responsibility for any injury to people or property resulting from any ideas, methods, instructions or products referred to in the content. |
© 2025 by the authors. Licensee MDPI, Basel, Switzerland. This article is an open access article distributed under the terms and conditions of the Creative Commons Attribution (CC BY) license (https://creativecommons.org/licenses/by/4.0/).