Article

Runoff Variations and Quantitative Analysis in the Qinghai Lake Basin Under Changing Environments

by
Li Mo
1,2,
Xinxiao Yu
1,2,
Yonghan Feng
1,2,* and
Tao Jiang
1,2
1
The Metropolitan Area Forest Ecosystem Research Station, School of Soil and Water Conservation, Beijing Forestry University, Beijing 100083, China
2
Key Laboratory of State Forestry and Grassland Administration on Soil and Water Conservation, Beijing Forestry University, Beijing 100083, China
*
Author to whom correspondence should be addressed.
Hydrology 2025, 12(4), 94; https://doi.org/10.3390/hydrology12040094
Submission received: 5 March 2025 / Revised: 14 April 2025 / Accepted: 15 April 2025 / Published: 17 April 2025

Abstract

:
This study examines runoff variations and their drivers in the Buha and Shaliu Rivers of the Qinghai Lake Basin (1960–2016), a key ecological area in China. Abrupt changes were detected using the Mann–Kendall and cumulative anomaly methods, while the Budyko framework attributed runoff variations to dominant factors. Correlation and grey relational analyses assessed multicollinearity, and a lake water balance model with climate elasticity theory quantified the effects of climate and land surface changes on runoff components and lake levels. Results indicate that the Buha River experienced an abrupt runoff change in 2004, while the Shaliu River exhibited a change beginning in 2003. Based on the trends and abrupt change points of each factor, the study period was divided into four segments: 1960–1993, 1994–2016, 1960–2003, and 2004–2016. The correlation coefficients are significantly different in different periods. The climate elasticity coefficients were as follows: P (precipitation), 1.98; ET0 (potential evapotranspiration), −0.98; Rn (net radiation), 0.66; T (average temperature), 0.02; U2 (wind speed at 2 m height), 0.16; RHU (relative umidity), −0.56. The elasticity coefficient of runoff with respect to precipitation is significantly higher than that for other climate variables. Net radiation and relative humidity contribute equally to runoff, while wind speed and temperature have relatively smaller effects. In the Qinghai Lake Basin, runoff is sensitive to precipitation (0.38), potential evapotranspiration (−0.07), and the underlying surface parameter ω (−98.32). Specifically, a 1 mm increase in precipitation raises runoff by 0.38 mm, while a 1 mm rise in potential evapotranspiration reduces it by 0.07 mm. A one-unit increase in ω leads to a significant runoff decrease of 98.32 mm. According to the lake water balance model, climate contributes 88.43% to groundwater runoff, while land surface changes contribute −11.57%. Climate change and land surface changes contribute 93.02% and 6.98%, respectively, to lake water levels. This study quantitatively evaluates the impacts of climate and land surface changes on runoff, providing insights for sustainable hydrological and ecological management in the Qinghai Lake Basin.

1. Introduction

The Qinghai–Tibet Plateau serves as an ecological security barrier for China and Asia, known as the “Roof of the World”, the “Third Pole of the Earth”, and the “Asian Water Tower”. It hosts abundant natural resources, including water, plants, grasslands, and tourism. As a critical region for global biodiversity conservation, the Qinghai–Tibet Plateau plays an essential role in maintaining ecosystem and production functions. It is a key pillar of China’s ecological security and sustainable development [1]. The Qinghai Lake Basin is located in the northeastern Qinghai–Tibet Plateau, at the transition zone between China’s arid northwest, the eastern monsoon region, and the plateau. It is a renowned lake wetland and ecological security barrier in China [2,3]. Therefore, studying the impacts of climate change and underlying surface changes on runoff in the Qinghai Lake Basin, as well as their quantitative analysis, is of great importance for the region’s ecology.
The consistency of hydrological series is affected by climate change and human activities, leading to significant uncertainty in runoff analysis results. Lei et al. effectively reduced the uncertainty of parameter estimation by using a Bayesian estimation method based on empirical mode decomposition and Mann–Kendall sampling [4]. Song Xiaomeng et al. [5] noted that most regions globally exhibit a significant declining trend in runoff. Between 1950 and 2004, runoff in China’s six major river basins generally decreased [6]. Among them, observed runoff in the Songhua River, Liao River, Hai River, Yellow River, and Han River decreased significantly, with the largest decline in the Hai River Basin [7,8]. Zhao Yang et al. [9] and Sun Fenghua et al. [10] further validated this trend, showing that runoff in most rivers in China decreased significantly, particularly in the Yellow River and Liao River basins. For instance, in the Yellow River Basin, annual runoff at four mainstem hydrological stations decreased by 17.93% to 40.79% between 1950 and 2016. In the Liao River Basin, during the 13 driest years from 1996 to 2009, average annual runoff was only 58% of the multi-year mean, and just 32% in the driest year. In contrast, runoff changes in southern rivers of China are minimal. Piao et al. [11] found no significant trend in annual runoff in the Yangtze River Basin. Xu et al. [12] also indicated that annual runoff in the Pearl River Basin increased by about 10% over the past 50 years. Guo et al. [13] found that Bosten Lake experienced three significant water level fluctuations between 1956 and 2010. Using a water balance model, they calculated the contributions of inflow, outflow, precipitation, and evaporation during different periods. The results showed that between 1958 and 1987, increased evaporation was the primary cause of lake water level decline. From 1988 to 2002, human interventions in inflow and outflow caused a rapid 4.6-m rise in lake water level. Between 2003 and 2010, increased outflow and reduced precipitation caused the water level to drop again by 3.76 m. Additionally, in recent decades, due to the impacts of climate change and human activities, extreme climate events have had significant effects on hydrological processes and the spatiotemporal distribution of water resources [14]. Further, He Kediao et al. [15] introduced extreme precipitation factors into the lake water level driving indicator system. Using principal component analysis and multiple regression models with R2 (coefficient of determination), they quantitatively assessed the contributions of extreme precipitation, evaporation, and other meteorological factors to water level changes in Dianchi Lake, Fuxian Lake, and Yangzonghai Lake. The contributions of meteorological factors to these lakes’ water level changes were 49.7%, 64.5%, and 93.3%, respectively. Wu et al. [16] used a monthly dynamic water balance model to simulate the water balance of Lake Nam Co on the Qinghai–Tibet Plateau. The results showed that rainfall, runoff, glacier meltwater, lake precipitation, lake seepage, and evaporation contributed 104.7%, 56.6%, 41.7%, 222.2%, and 280.9% to the water balance, respectively. Although extensive research has revealed runoff variation trends in major river basins and lakes across China, systematic studies on long-term runoff changes in the Qinghai Lake Basin remain limited. As the largest inland saline lake in China, Qinghai Lake is located in the climate-sensitive region of the Qinghai–Tibet Plateau, where hydrological processes are significantly influenced by climate variability and human activities. A thorough analysis of long-term runoff characteristics and their driving mechanisms in this region is essential to fill the research gap and support effective water resource and ecological management.
Currently, there are four main methods for quantitatively analyzing the impacts of climate change and underlying surface alterations on watershed hydrology and water resources [17,18]. The first category is long-term data comparative analysis, including methods such as linear regression [19] and double cumulative curve analysis [20]. This method collects long-term data on watershed climate and runoff, employs time series analysis to build statistical models, and analyzes the effects of climate change and underlying surface alterations on runoff. Langbein (1949) was the first to use this method to analyze annual runoff variations in parts of the United States and their relationship with climate change, yielding favorable results. Wang Henian [21] analyzed hydrological evolution in the Hai River mountain region using hydrological, meteorological, and land use data from 1957 to 2000. He found that human activities contributed approximately 70% to hydrological changes, while climate change accounted for only 30%. The second category is the elasticity coefficient method, widely used to analyze watershed sensitivity to climate or underlying surface characteristic changes. Schaake [22] introduced the climate elasticity method to quantitatively assess the impact of climate change on runoff. Milly and Dunne [23] derived a two-parameter method assuming precipitation and potential evapotranspiration as the main factors influencing runoff changes, enabling calculation of climate change impacts on runoff. Zhang et al. [24] applied this method to study runoff reduction in the Loess Plateau region, identifying reduced precipitation and soil conservation measures as the primary causes. The third method is based on the Budyko hypothesis water balance model, which uses water balance principles to analyze the coupled relationship between climate and watershed hydrothermal conditions, attributing changes in runoff. Liu Jianyu et al. [25] applied the Budyko theoretical model to analyze runoff changes in 413 basins across China, concluding that climate change contributed 53.5% and human activities contributed 46.5%. Li Bin et al. [26] used the Budyko formula to analyze the impacts of climate change on runoff and found that climatic factors contributed approximately 45% to annual runoff changes. The fourth method involves watershed hydrological modeling, which uses extensive meteorological and hydrological data to quantify the impacts of climate change on runoff through hydrological models. Although hydrological models can accurately describe hydrological changes and their patterns, their limitations include uncertainties in model structure and parameters, as well as challenges in representing the complex interactions between topography, vegetation, soil, and climatic factors within the basin. These limitations often necessitate extensive field data, making simulation difficult in certain regions. Nevertheless, hydrological models remain irreplaceable for short-term scale analyses. In the Qinghai Lake Basin, many studies indicate that climate change is the dominant factor driving changes in runoff and lake water levels, while the impacts of human activities and underlying surface changes are relatively minor [27,28,29,30,31,32]. For example, Qin and Huang [33] used a lake water balance model and sensitivity analysis to demonstrate that runoff changes in Qinghai Lake are primarily influenced by precipitation, and that lake water levels are highly sensitive to changes in precipitation and temperature. Li Xiaodong et al. [34] used the water balance equation and multiple regression methods to calculate the main factors influencing Qinghai Lake water levels. The results showed that discharge, precipitation, and evaporation contributed to water level changes, in that order.
Although climate change is regarded as the dominant factor influencing the hydrological cycle of the Qinghai Lake Basin, few studies have conducted a quantitative analysis of runoff changes in the basin based on the Budyko framework. Therefore, this study aims to quantitatively analyze the impacts of climate change and changes in underlying surface characteristics on runoff variations in the Qinghai Lake Basin. Meanwhile, it provides new perspectives and methodologies for hydrological research on inland closed lakes in alpine regions such as the Qinghai–Tibet Plateau.

2. Materials and Methods

2.1. Study Area

The Qinghai Lake Basin is located on the northeastern edge of the Qinghai–Tibet Plateau, with geographical coordinates ranging from 97°50′ to 101°20′ E and 36°15′ to 38°20′ N. The total area is approximately 29,600 km2. Qinghai Lake, located in the southeastern part of the basin, is the largest inland and saline lake in China, situated at 99°36′ to 100°46′ E and 36°32′ to 37°15′ N. The lake’s surface area accounts for approximately 16% of the basin’s total area. In recent years, the surface area of Qinghai Lake has been steadily increasing. The current area of the main lake and its subsidiary lakes is approximately 4441.22 km2. The basin’s topography is mountainous on the periphery with a low-lying central area, and the southeastern part is higher than the northwest. It belongs to the Qin-Qi-Kunlun geosynclinal fold zone, with an elevation ranging from 3036 to 5298 m. The geomorphological types include plains, low mountains, mid-mountains, and terraces, with mountainous areas accounting for about two-thirds of the total area. The basin’s climate is classified as a high-altitude, semi-arid, and cold climate, characterized by aridity, low precipitation, strong winds, and intense solar radiation. The annual average temperature ranges from −0.8 °C to 1.1 °C, and the precipitation ranges from 327 to 423 mm, decreasing from the eastern and southern regions to the western and northern areas. The temperature in the lake area is higher than in the surrounding mountainous regions, with a longer frost-free period. Annual sunshine duration reaches 2430 to 3330 h, and total solar radiation is 607 to 720 KJ/cm2 [35]. Figure 1 shows the map of the study areas.

2.2. Data Sources

Over 50 rivers are asymmetrically distributed around Qinghai Lake. Among them, the Buha River and the Shaliu River contribute the largest inflows into the lake. The catchment areas of the Buha River and Shaliu River are approximately 14,337 km2 and 1442 km2, respectively. The Buha River, approximately 300 km in length, originates from a branch of the Qilian Mountains and flows southeastward into Qinghai Lake. The Buha and Shaliu River catchments contribute 51.4% of the annual river inflow to Qinghai Lake [36]. Runoff data (daily, monthly, and annual values, as well as flood peak data) from three monitoring stations (Table 1)—Buha River Mouth Station, Gangcha Station, and Gangcha No. 2 Station (the latter constructed after the decommissioning of Gangcha Station, with a continuous time series)—are available for the periods 1960–2016, 1960–1975, and 1976–2016, respectively. Lake level data from the Xia She Station span the period 1984–2016, while annual lake level data cover 1959–1984 [37].
Hydrometeorological stations are sparse in the Northwest region. However, two long-term hydrological stations in the Qinghai Lake Basin provide complete runoff data spanning more than 50 years. Qinghai Lake has recorded water level data for more than 30 years. Meteorological stations within and around the basin, except for Wulan and Haiyan stations, have data records exceeding 50 years. (Table 2 provides details on the meteorological stations within and around the study area.) To analyze runoff changes in response to climate and land surface variations, this study primarily utilizes meteorological, hydrological, and other relevant datasets from within and around the basin.

2.3. Mann–Kendall Non-Parametric Trend and Change Point Tests

The Mann–Kendall non-parametric trend test is widely used in time series trend analysis of meteorological and hydrological data because it is not affected by data distribution or outliers [38,39]. This study applies the method to analyze trends in hydrological and meteorological factors, including runoff, precipitation, evapotranspiration, and temperature. The statistical value S for a time series X = x 1 , x 2 , x 3 , x n is calculated as follows [40]:
S = i = 1 n 1 j = i + 1 n s g n x j x i
s g n ( x ) = 1 , i f x j x i > 0 0 , i f x j x i = 0 1 , i f x j x i < 0
when n ≥ 8, the mean (E(S)) and variance (Var(S)) of the statistical variable S can be calculated as follows:
E S = 0
V a r ( S ) = n ( n 1 ) ( 2 n + 5 ) 18
The standardized value of S, denoted as Z, can be calculated using the following formula:
Z = S 1 V a r ( S ) , i f S > 0 0 i f S = 0 S + 1 V a r ( S ) , i f S < 0
Assuming no trend in the original sequence, the statistic Z can be used to test the time-scale trend of the data series. A two-tailed test is performed at a given significance level α, and the critical value Z 1 α / 2 is obtained from a table. If Z > 0 , the trend is upward; otherwise, it is downward. If Z Z 1 α / 2 , the null hypothesis is rejected; otherwise, it is accepted.
The Mann–Kendall statistical test [40] can be used to detect change points in a data series. The specific method is as follows:
S k = i = 1 k j = 1 i 1 α i j ( k = 2 , 3 , 4 , , n )
α i j = 1 0 x i > x j x i x j 1 j i
The statistical variable UFK is defined as follows:
U F K = S k E S k V a r ( S k ) k = 1 , 2 , 3 , , n
In this formula,
E S k = k k 1 4
V a r S k = k k 1 2 k + 5 72
The variable x is sorted in reverse order, while satisfying the following conditions:
U B K = U F K k = n + 1 k ( k = 1 , 2 , , n )
If the UFK curve is above 0, it indicates an upward trend in the variable; otherwise, it indicates a downward trend. If the UFK curve crosses the critical values at the 0.05 or 0.01 significance level, it indicates a significant trend in the variable. If the UFK and UBK curves intersect within the critical value range, the corresponding time point of the intersection indicates the time when the time series experiences a change point.

2.4. Runoff Attribution Analysis Method Based on the Budyko Hypothesis

Based on Budyko’s coupled water and heat balance theory, the sensitivity and contribution of climate variation and human disturbances to runoff changes can be quantified. This approach enables the accurate and rapid identification of the dominant factors driving runoff variations and is widely applied in analyzing the impacts of climate and land surface changes on runoff [41,42].
E P = f ( E T 0 / P )
In this equation, E represents the actual evapotranspiration of the watershed (mm), P represents the precipitation of the watershed (mm), and ET0 represents the potential evapotranspiration of the watershed (mm).
Budyko’s initial research did not account for characteristics such as land surface properties and watershed area [43]. Based on watershed hydrometeorological theory, Fu Baopu [44] proposed the theoretical analytical equation for the Budyko curve:
E P = 1 + E T 0 P 1 + E T 0 P ω 1 / ω
In this equation, ω represents the characteristic parameter of the watershed’s underlying surface, which reflects the comprehensive conditions of the underlying surface ω 1 ,  [45,46].
For a closed watershed, the long-term water balance follows the equation below:
P = E + Q + Δ S
In this equation, Q represents the annual runoff of the watershed (mm), calculated by dividing the total annual runoff volume (m3) by the watershed catchment area (km2) for the corresponding year. ΔS denotes the change in water storage within the watershed. In long-term watershed studies, Δ S 0 .
From Equations (13) and (14), we derive the following equation:
Q = P ω + E T 0 ω 1 / ω E T 0
In this equation, ω is determined using the least squares method.
Changes in watershed surface runoff ( Δ Q ) can be considered as comprising three components: runoff changes caused by climate variation ( Δ Q c l i m a t e ), changes induced by alterations in watershed underlying surface characteristics ( Δ Q c a t c h m e n t ), and changes directly resulting from human activities ( Δ Q h u m a n ). This can be expressed as follows:
Δ Q = Δ Q c l i m a t e + Δ Q c a t c h m e n t + Δ Q h u m a n
Human activities indirectly impact runoff by altering local climatic conditions, vegetation, soil, and other underlying surface conditions within the watershed. These changes are already accounted for in the first two components Δ Q c l i m a t e and Δ Q c a t c h m e n t and are thus not calculated separately. Direct runoff changes caused by human activities primarily include water diversion and the construction of hydraulic projects [47]. In watersheds with minimal human activity, such as the Tibetan Plateau, where population density, direct water usage, and the number of hydraulic projects are low ( Δ Q h u m a n 0 ), the equation can be expressed as follows:
Δ Q = Δ Q c l i m a t e + Δ Q c a t c h m e n t
The runoff changes caused by climate change [26] can be expressed by the following equation:
Δ Q c lim a t e = Q P × Δ P + Q E T 0 × Δ E T 0
Similarly, the following can be derived:
Δ Q c a t c h m e n t = Q ω × Δ ω
In the above equation, Δ Q c lim a t e represents the runoff change caused by climate change; Δ Q c a t c h e m e n t represents the runoff change caused by underlying surface changes; Δ P represents the change in precipitation; Δ ω represents the change in the underlying surface characteristic parameter; Δ E T 0 represents the change in potential evapotranspiration; Q / P represents the runoff sensitivity coefficient to precipitation; Q / E T 0 represents the runoff sensitivity coefficient to potential evapotranspiration; and Q / ω represents the runoff sensitivity coefficient to underlying surface characteristics.
Based on Equation (15), partial derivatives with respect to P, ET0, and ω are calculated to obtain the sensitivity coefficients of watershed runoff (Q) to climatic factors (P and ET0):
Q P = 1 + E T 0 P ω 1 / ω 1
Q E T 0 = 1 + P E T 0 ω 1 / ω 1 1
Q ω = P ω + E T 0 ω 1 / ω ( 1 ω 2 ) ln ( P ω + E T 0 ω ) + 1 ω 1 P ω + E T 0 ω ( ln P P ω + ln E T 0 E T 0 ω )

2.5. Statistical Analysis

This study applies the Mann–Kendall test and cumulative anomaly method to detect and analyze abrupt changes in annual runoff from 1960 to 2016 in the Qinghai Lake basin. It also uses the runoff attribution analysis method based on the Budyko hypothesis to identify the driving factors behind these changes. Correlation and grey relational analyses are employed to identify multicollinearity among the factors affecting runoff in the basin. The responses of surface runoff, groundwater runoff, and lake water levels to climate and land surface changes are quantitatively analyzed using the lake water balance model and climate elasticity coefficient theory (Appendix A1).
The Mann–Kendall test is a robust non-parametric method well-suited for detecting trends and abrupt changes in long-term, irregular hydrological data. Although it is less sensitive to seasonal variations, this limitation has minimal impact in this study due to its focus on interannual trends. The Budyko framework is widely applied for runoff attribution under long-term average conditions. Given the Qinghai Lake Basin’s stable hydroclimatic conditions, minimal human disturbance, and semi-arid environment, the model’s assumptions are largely satisfied, ensuring its reliable applicability in this context. Table 3 is the abbreviation comparison of each indicator.

3. Results

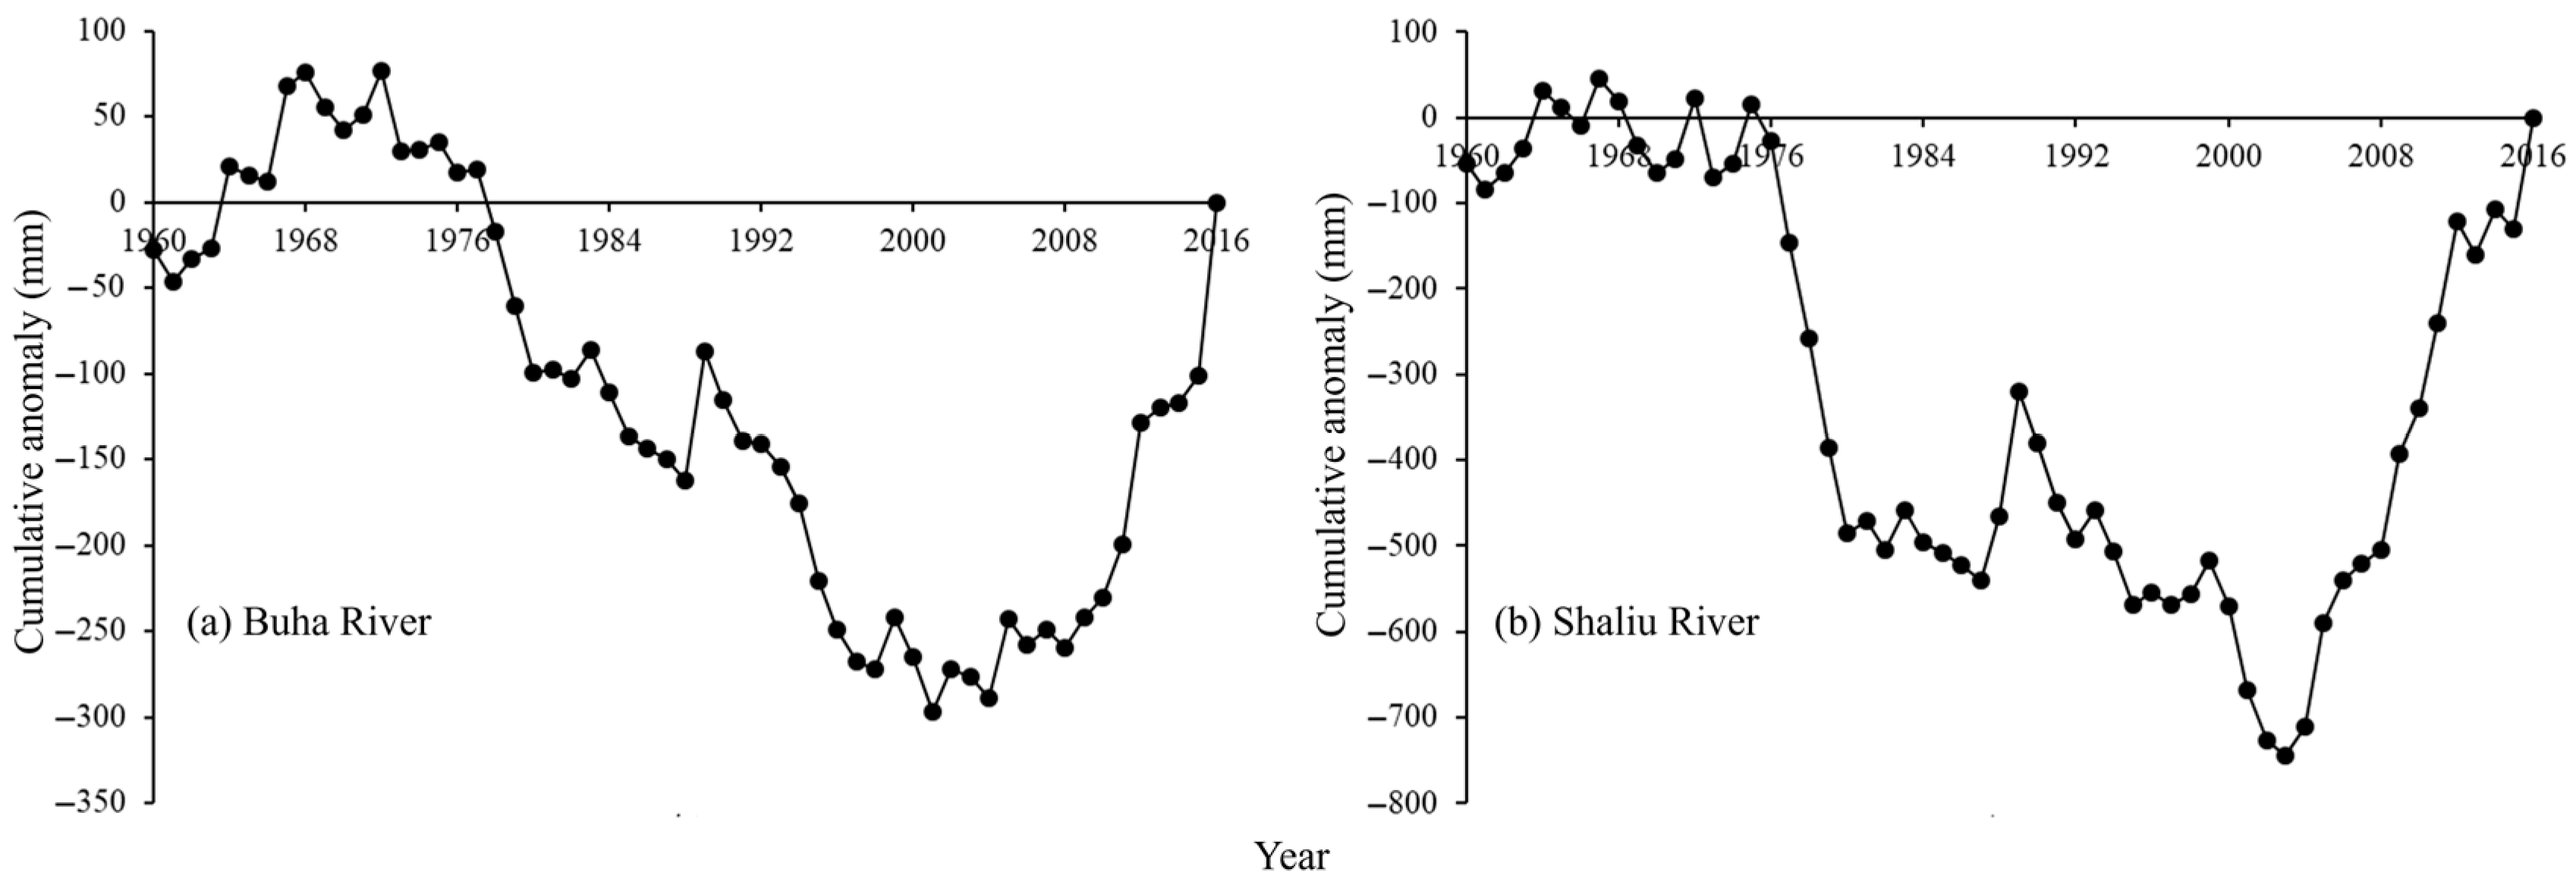
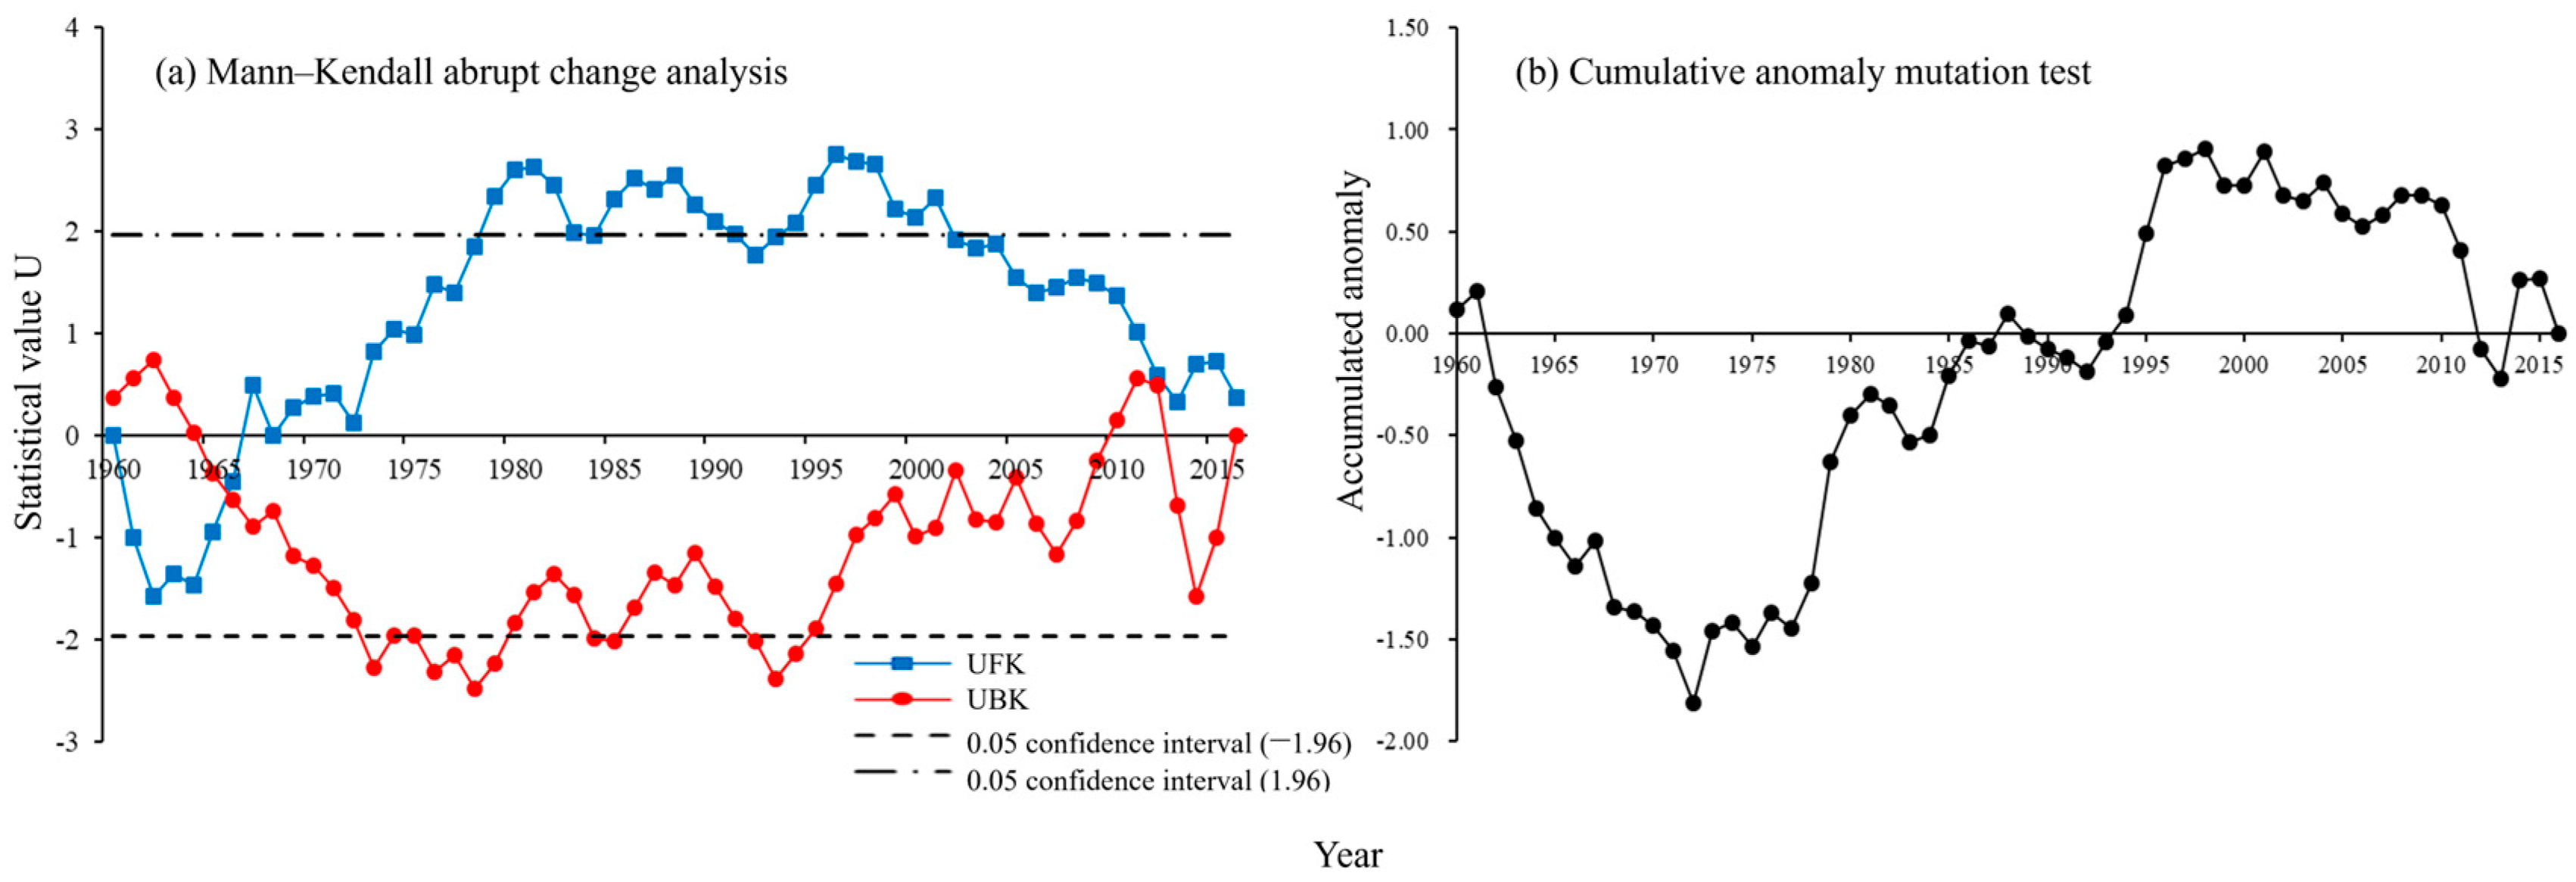
3.1. Analysis of Watershed Runoff Changes

Using runoff data from 1960 to 2016 at two hydrological stations on the Buha River and Shaliu River, the evolution trends of runoff depth were analyzed in detail (Figure 2 and Figure 3). The multi-year average runoff depths for the Buha River and Shaliu River basins are 60.72 mm and 184.95 mm, respectively. Over the entire study period, the interannual trends of runoff depth in the two rivers exhibit a gradual increase amidst fluctuations, with linear trend slopes of 0.41 and 1.17, indicating annual runoff depth increases of 0.41 mm and 1.17 mm, respectively. The annual runoff volumes of the Buha River and Shaliu River were subjected to the Mann–Kendall trend test, yielding Z-values of 1.36 and 1.91. Since |Z| < 1.96, neither trend is statistically significant at the 0.05 confidence level, indicating that the upward trends are not significant.
The coefficients of variation (CV) for the annual runoff data series of the Buha River and Shaliu River are 0.50 and 0.35, respectively, indicating significant interannual fluctuations. Specifically, the maximum annual runoff of the Buha River was 162.20 mm (2016), and the minimum was 13.90 mm (1973). For the Shaliu River, the maximum annual runoff was 330.90 mm (1989), and the minimum was 56.40 mm (1979).
A 5-year moving average analysis of annual runoff volumes for the Buha and Shaliu Rivers from 1960 to 2016 reveals similar trends for both rivers (Figure 2 and Figure 3). During the 1960s–1970s, annual runoff exhibited a noticeable declining trend. In the 1980s, runoff increased, with a stronger upward trend in the Shaliu River compared to the Buha River. Between 1990 and 1995, a temporary decline occurred for both rivers. Since 1995, annual runoff volumes have shown a significant upward trend in both rivers.
The Mann–Kendall change point test for the annual runoff of the Buha River (Figure 4) indicates that the UFK statistic was less than 0 during 1977–2010, signifying a downward trend in annual runoff. Conversely, during 1960–1976 and 2011–2016, the UFK values were greater than 0, indicating an upward trend. Although UFK and UBK statistics intersected at the edges of the time series in 1961, 1965, 2011, 2012, and 2015, these points occur at the series’ beginning and end, preventing the identification of definitive change points. For the Shaliu River, the UFK statistic was less than 0 during 1977–2005, indicating a declining trend in annual runoff, while UFK values greater than 0 during 1960–1976 and 2006–2016 indicate an upward trend. The UFK and UBK statistics for the Shaliu River intersected at the edges of the data series. Notably, the two curves intersected in 2005 within the 0.05 confidence interval, indicating that a change point occurred in the Shaliu River runoff series in 2005.
This study used the cumulative anomaly method to further analyze the annual runoff trends and change points of the two rivers (Figure 5). The results indicate that the change points of annual runoff occurred in 2004, 2003, and 2007. Therefore, the change point for the annual runoff of the Buha River was determined to be in 2004, while the Shaliu River exhibited a change starting in 2003. The change in runoff for the Buha River occurred one year later than that of the Shaliu River, which is associated with the larger watershed area and longer flow convergence time.

3.2. Analysis of the Impact of Climate Change on Runoff

A 5-year moving average analysis of annual runoff from 1960 to 2016 for the two rivers shows similar trends in the Buha and Shaliu Rivers, with a brief decline observed between 1990 and 1995 (Figure 1 and Figure 2). Considering the trends and change points of various factors, the study period was divided into 1960–1993, 1994–2016, 1960–2003, and 2004–2016 to analyze the responses of runoff to climatic indices in different periods. According to Table 4, except for 2004–2016, the correlation coefficients between annual precipitation (P) and annual runoff (Q) are relatively high, ranging from 0.70 to 0.74, showing significant positive correlations at the 0.01 level. Average wind speed (U) is negatively correlated with Q, with a higher correlation coefficient during 1960–1993 compared to other periods. Since 1994, the correlation between U and Q has been significantly lower than that before 1994. Temperature (T) exhibits higher correlations with Q only during the periods 1960–1993 and 1994–2016, consistent with the temperature change point around 1993. The correlation coefficient between Q and sunshine duration (SSD) is relatively high at 0.55 during 2004–2016 but does not pass the 0.05 significance level. In other periods, the correlation coefficients are lower, showing insignificant negative correlations and failing the 0.05 significance level. Q is mostly positively correlated with average relative humidity (RHU), with higher correlations observed before the temperature change point compared to after. Potential evapotranspiration (ET0) has a significant negative correlation with Q, exhibiting a pattern similar to RHU. Except for 2004–2016, net radiation (Rn) is negatively correlated with Q in other periods. The correlations between annual runoff (Q) and climatic factors during 2004–2016 are insignificant, likely due to the abrupt change in runoff starting in 2003, with only 13 years of data by 2016, resulting in insufficient sample size and low confidence. In summary, Q shows significant positive correlations with P and RHU, and significant negative correlations with ET0, Rn, and U, with correlation coefficients varying across periods.
Using the formula ( E ¯ = P ¯ Q ¯ ), the multi-year average evapotranspiration in the watershed was calculated to be 265.09 mm/a, and the parameter n was determined to be 1.24 using the least squares method. The Mann–Kendall trend test revealed that changes in P, T, and U2 from 1960 to 2016 were significant at the 0.01 level, while Rn was significant at the 0.05 level. The multi-year averages, linear trend rates, significance levels, and rates of change for the climatic and hydrological factors in the Buha River basin are shown in Table 5. Further analysis of the linear relationships among climatic and hydrological factors was conducted, and climate elasticity coefficients were calculated (Table 6).
Substituting the results from Table 6 into the theoretical equation for climate elasticity coefficients yields the following formula:
d Q Q ¯ = 1.98 d P P ¯ 0.64 d R n R n ¯ 0.02 d T 0.16 d U 2 U 2 ¯ + 0.55 d R H U R H U ¯
This formula indicates that for every 1% increase in precipitation, runoff increases by 1.98%; for every 1% increase in net radiation, runoff decreases by 0.64%; for every 1 °C increase in temperature, runoff decreases by 0.02%; for every 1% increase in wind speed at 2 m height, runoff decreases by 0.16%; and for every 1% increase in relative humidity, runoff increases by 0.55%. Evidently, the elasticity coefficient of runoff to precipitation is significantly higher than that of other climate variables. Net radiation and relative humidity contribute similarly to runoff, while wind speed and temperature have relatively minor effects. This indicates that runoff is more sensitive to precipitation than to other climate variables.

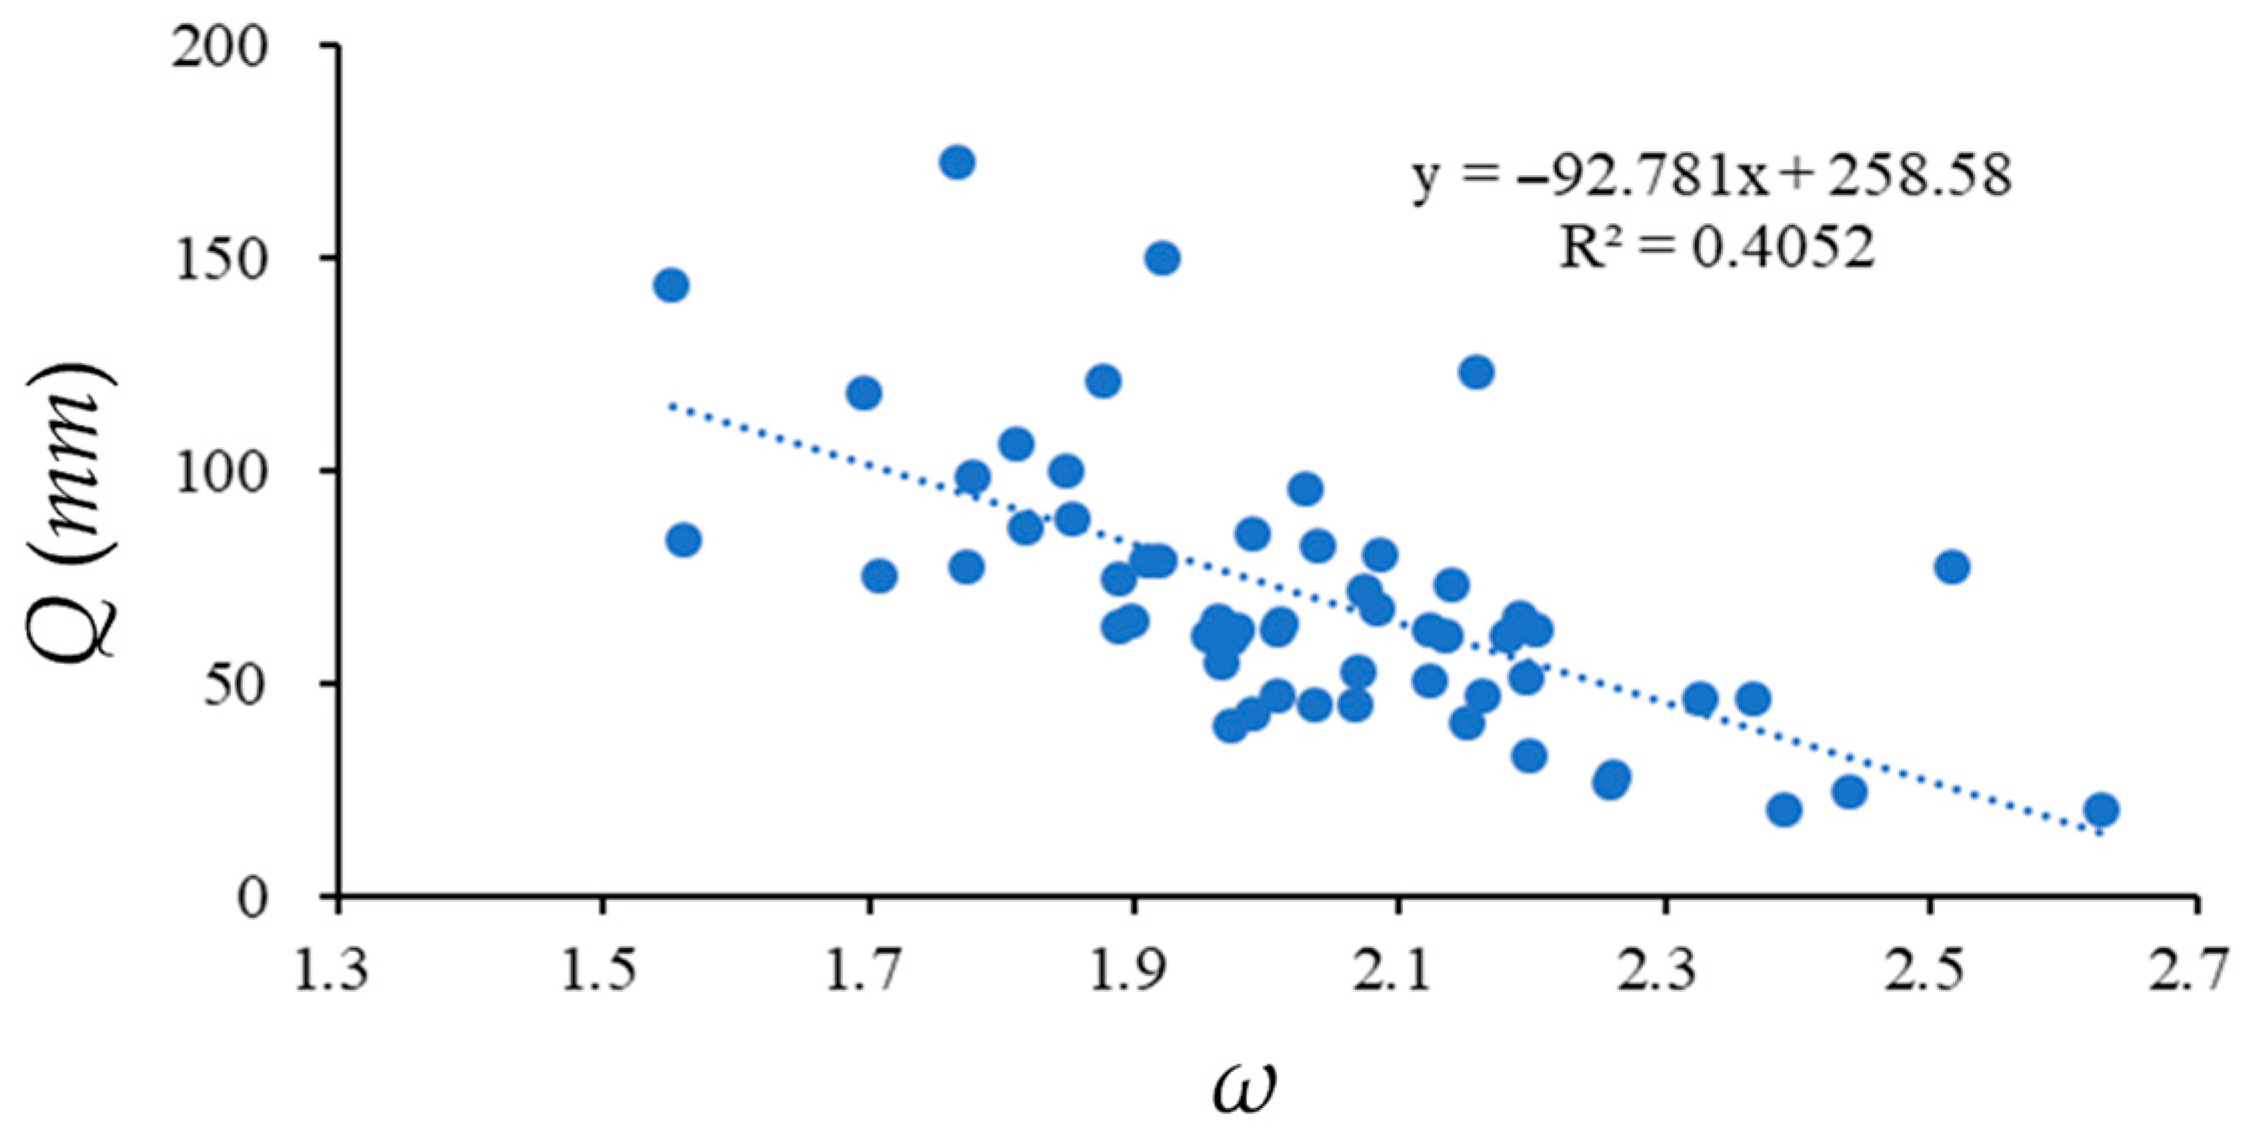
3.3. Analysis of the Impact of Land Surface Changes on Runoff

This study, following the Fu Baopu method, calculated the annual underlying surface characteristic parameter ω for the watershed, with the variation trend shown in Figure 6. The maximum value of ω was 2.63 (in 1979), the minimum value was 1.55 (in 2012), and the multi-year average was 2.03. The variation trend of ω can be roughly divided into two phases: Phase I (1960–1979), showing an increasing trend with a linear trend rate of 0.02; and Phase II (1979–2016), showing a decreasing trend with a linear trend rate of −0.03/a.
The change points of ω were identified using the Mann–Kendall method and cumulative anomaly method. As shown in Figure 7, from 1960 to 1966, UFK < 0, indicating a declining trend in ω. Starting in 1967, UFK > 0, showing an upward trend. Between 1979 and 2001, ω exceeded the 0.05 confidence interval, indicating a significant increasing trend. UFK and UBK intersected within the confidence interval in 1966, indicating that the change point of ω occurred in 1966. Using the cumulative anomaly method, change points were identified in 1972 and 2001. Therefore, the change points of the underlying surface characteristic parameter ω were around 1966, 1972, and 2001.
The correlation coefficient between ω and runoff is −0.64 (p < 0.01), indicating that higher ω values correspond to lower runoff. The linear trend rate is −92.78, with a linear fitting coefficient of 0.41 (Figure 8). ω is closely related to surface runoff entering the lake, directly influencing the runoff generation and convergence processes of the watershed’s underlying surface. The Qinghai Lake watershed is expansive, with relatively flat terrain in the central region. Runoff generation and convergence typically require longer times, making these processes more dependent on the characteristics of the catchment area. Significant land use changes in the Qinghai Lake watershed over recent decades likely caused variations in ω, primarily due to changes in vegetation and soil conditions within the watershed.

3.4. Quantitative Analysis of the Impact of Climate and Land Surface Changes on Runoff

3.4.1. Quantitative Analysis of the Impact of Climate Change and Land Surface Characteristics on Surface Runoff

Using the elasticity coefficients of runoff for each factor from Table 6 and the Budyko hypothesis-based runoff attribution analysis method, the impacts of climate change and underlying surface changes on watershed runoff were calculated:
ΔQclimate = ∂Q/∂P·ΔP + ∂Q/∂ET0·ΔET0 = 25.91 − 0.49 = 25.42 mm
ΔQcatchment = ∂Q/∂ω·Δω = 6.44 mm
The results (Table 7) indicate that from 1960 to 2016, the primary driver of runoff changes in the Qinghai Lake watershed was climate change, which led to an increase in runoff by 25.42 mm, contributing 79.79%. Changes in watershed underlying surface characteristics also played a significant role, increasing runoff by 6.44 mm, with a contribution rate of 20.21%. The study error was 5.89%, which includes both research errors and errors caused by factors such as hydraulic engineering, subsurface ice melt, and glacier snowmelt. The high contribution of climate change is mainly attributed to increased precipitation and atmospheric humidity, to which runoff in the semi-arid Qinghai Lake Basin is highly sensitive. Due to limited soil infiltration and sparse vegetation cover, even minor increases in precipitation can generate disproportionately large increases in runoff. In addition, reductions in potential evapotranspiration and net radiation have weakened atmospheric water loss, further enhancing runoff production. The 20.21% contribution from land surface changes is largely explained by improvements in vegetation cover, land use, and soil structure, all of which enhance the watershed’s runoff generation and convergence capacity. Specifically, vegetation restoration increases surface roughness and water retention, reducing direct runoff losses and promoting more stable hydrological responses.

3.4.2. Quantitative Analysis of the Impact of Climate Change and Land Surface Characteristics on Subsurface Runoff

Changes in groundwater runoff are influenced by multiple factors and exhibit complex patterns, making it difficult to comprehensively analyze its dynamic changes using conventional single-factor analysis. The groundwater system in the Qinghai Lake watershed is a composite water system, where the groundwater runoff process is influenced by both climatic factors and the underlying surface. Due to the lack of observational data for groundwater runoff, the Rlg ± ε calculated from the lake water balance equation does not isolate groundwater runoff. Therefore, this study focuses on distinguishing the contributions of climate change and underlying surface changes to Rlg ± ε. This study employs the principal component regression analysis method [48] to perform a quantitative attribution evaluation of groundwater runoff. The factors influencing groundwater runoff (y) are as follows: lake water level difference (x1); lake precipitation (x2); surface runoff (x3); lake evaporation (x4); watershed precipitation (x5); and watershed underlying surface characteristic parameters (x6). Correlation analysis (Table 8) and grey relational analysis (Table 9) reveal that there is multicollinearity among the influencing factors, and all factors are closely related to y.
As shown in Table 10, the largest eigenvalue of the correlation coefficient matrix is 3.61, with a contribution rate of 60.09%, while the smallest eigenvalue is 0.03, with a contribution rate of 0.44%. The cumulative contribution rate of the first three principal components (90.32%) exceeds 80%, indicating that these three components essentially encompass all the information contained in the original influencing factors. Subsequently, the three principal components were used to analyze y, and the linear equation was derived from Table 11 as follows:
F1 = 0.36·x1 − 0.57·x2 + 0.38·x3 + 0.25·x4 + 0.57·x5 + 0.06·x6
F2 = 0.45·x1 + 0.52·x2 + 0.13·x3 − 0.09·x4 + 0.12·x5 + 0.70·x6
F3 = 0.44·x1 − 0.08·x2 − 0.29·x3 + 0.70·x4 − 0.47·x5 − 0.01·x6
Principal component F1 can be interpreted as the precipitation factor, F2 as the underlying surface characteristic parameter factor, and F3 as the lake evaporation factor. The underlying surface characteristic parameter factor represents changes in the underlying surface, while the precipitation and lake evaporation factors represent climate change. Using the underlying surface factor (F2), precipitation factor (F1), and evaporation factor (F3) as independent variables, and groundwater runoff (y) as the dependent variable, a multiple linear regression was conducted using the least squares method, yielding the following equation:
y = 384.01 − 0.36·F1 − 0.31·F2 + 1.99·F3
The actual values of y were fitted with the regression values, yielding a correlation coefficient (R) of 0.92, a coefficient of determination (R2) of 0.85, an F-test value of 320.59, and a significance level of p < 0.01, indicating a good fit of the regression equation. Converting the impact of principal component factors on groundwater runoff into percentages reveals that evaporation has the greatest impact at 75.00%, while precipitation and changes in the underlying surface contribute −13.43% and −11.57%, respectively. In summary, the contribution of climate to groundwater runoff is 88.43%, while the contribution of the underlying surface is −11.57%. For groundwater runoff, the dominant contribution from climate factors (88.43%) reflects the strong control of precipitation and evaporation on subsurface hydrological processes. In contrast, the negative contribution from land surface changes suggests localized reductions in infiltration capacity, possibly due to soil compaction or degradation.

3.4.3. Quantitative Analysis of the Impact of Climate Change and Land Surface Characteristics on Lake Water Levels

Based on the lake water balance model, the contributions of Pl, Rls, El, and Rlg ± ε to Δh were calculated as 20.64%, 29.26%, −40.84%, and 9.26%, respectively. Climate factors and surface runoff contributed the most to lake water level differences. Using the model, the contributions of climate change and changes in underlying surface characteristics to lake water level variation were calculated to be 93.02% and 6.98%, respectively (Table 12). The dominant role of climate change is attributed to its direct influence on lake precipitation, evaporation, and runoff inflow, highlighting the strong sensitivity of the lake to climatic variability. Although the contribution of land surface changes is smaller, it remains meaningful, as improvements in vegetation conditions can enhance the watershed’s runoff generation and convergence capacity. Moreover, increased extreme precipitation events can lead to more infiltration-excess runoff, indirectly contributing to lake level rises. Thus, while climate change is the primary driver, underlying surface changes also play a secondary but non-negligible role in regulating lake water levels, as described by the following calculations:
R ( Δ h ) c = 20.64 % + 40 . 84 % + 29 . 26 % × 79 . 79 % + 9 . 26 % × 88 . 43 % = 93 . 02 %
R ( Δ h ) u = 29.26 % × 20.21 % + 9.26 % × 11.56 % = 6.98 %

4. Discussion

4.1. Driving Factors of Runoff Changes in the Qinghai Lake Basin

Qinghai Lake is a crucial water body for maintaining ecological security in the northeastern Qinghai–Tibet Plateau. Variations in runoff within its watershed significantly affect the surrounding socio-economic development and ecological safety [49]. The results of this study indicate that, over the study period, the annual runoff depth of the Buha River and Shaliu River exhibited a fluctuating but gradually increasing trend, with annual increases of 0.41 mm and 1.17 mm, respectively. However, these trends were not statistically significant. This finding aligns with the results of Huang Xiaoxiang et al. [50], possibly due to a marked warming and humidification process during the increasing stage of runoff depth in Qinghai Lake, leading to a sharp rise in runoff and a significant reduction in evaporation [36]. Furthermore, the abrupt change point for annual runoff in the Buha River occurred in 2004, while it began in 2003 for the Shaliu River. This result is generally consistent with studies by Zhang Zifu and Huang Xiaoxiang. The later runoff change in the Buha River compared to the Shaliu River may be partly attributed to differences in watershed area and flow convergence time. Additionally, the location and timing of abrupt changes in main channel runoff in the Qinghai Lake watershed may be closely related to large-scale water projects, tributaries with extensive catchment areas, and water diversion projects [51]. The results of this study show a positive correlation between Q (runoff), P (precipitation), and RHU (relative humidity). Increases in precipitation and relative humidity likely directly enhance watershed moisture, thereby increasing runoff. Precipitation is the primary source of runoff, with increased precipitation directly converting to runoff. This is particularly evident in seasons with high precipitation, where excess water, unable to fully infiltrate or be absorbed by vegetation, flows into rivers as runoff [52]. An increase in relative humidity typically indicates higher moisture content in the air, which facilitates precipitation formation and subsequently enhances runoff. Research indicates that in arid study watersheds, the response of runoff to changes in precipitation may exhibit nonlinear characteristics. Specifically, precipitation elasticity is lowest during increases in precipitation and highest during decreases [53]. This finding slightly differs from our study results, possibly due to the Qinghai Lake watershed’s location at the intersection of China’s arid northwest, high-altitude cold zones, and eastern monsoon regions, resulting in climatic complexity and diversity [36]. Q (runoff) shows a significant negative correlation with ET0 (evapotranspiration), Rn (net radiation), and U (wind speed), suggesting that under conditions of high evaporation, radiation, and wind speed, enhanced evaporation and transpiration lead to surface water loss, thereby reducing runoff. Particularly during arid seasons with intense evaporation, moderate precipitation may occur, but high temperatures, radiation, and wind speeds accelerate water evaporation, reducing the amount of water entering river systems [54]. Therefore, precipitation and humidity typically have a significant impact on runoff, while evaporation, radiation, and wind speed play a more prominent role in water loss. Moreover, this study reveals variations in watershed runoff across different periods of climatic change (Table 4), likely reflecting seasonal differences in the impact of climatic changes on runoff. During spring and autumn, low precipitation and high temperatures result in strong evaporation and reduced runoff. In contrast, summer experiences higher precipitation and moderate temperatures, leading to increased runoff. Seasonal variations in climate, particularly changes in precipitation and evaporation, significantly affect runoff [55]. As precipitation is the direct source of runoff, changes in precipitation directly determine the water volume in a watershed. Consequently, precipitation elasticity is higher than that of other climatic variables (Table 6). Fluctuations in precipitation are quickly reflected in changes in runoff, particularly during seasons of concentrated rainfall, where increased water volume significantly boosts runoff. Additionally, the study indicates that net radiation and relative humidity contribute similarly to runoff, while wind speed and temperature have smaller contributions, demonstrating that runoff is more sensitive to precipitation than other climatic variables. Net radiation and relative humidity indirectly influence runoff by affecting evaporation and precipitation potential. Net radiation determines surface water evaporation, while relative humidity influences the saturation of water vapor, affecting precipitation and evaporation processes. Their contributions are relatively balanced as they collectively impact the water cycle under varying conditions. Wind speed and temperature typically influence runoff indirectly by affecting evaporation, with minimal impact under humid conditions [56]. High temperatures and strong wind speeds may increase evaporation, but under sufficient precipitation, these factors have relatively minor effects on runoff [57].
The trend of underlying surface characteristic parameters in the Qinghai Lake watershed can be divided into two stages: Phase I (1960–1979), showing an increasing trend, and Phase II (1979–2016), showing a decreasing trend. The increasing trend in Phase I may be related to climate warming, increased precipitation during the humid period, natural ecological restoration within the watershed, and land use changes such as agricultural expansion and vegetation restoration projects [58]. In Phase II, the climate became colder and drier, with decreased temperatures and reduced precipitation accelerating soil moisture evaporation rates [59]. Simultaneously, intensified human activities, such as overgrazing and land development, placed stress on the ecological environment, leading to reduced vegetation cover and soil degradation, causing a decreasing trend in underlying surface characteristic parameters. This change not only affected the watershed hydrological processes but also potentially exacerbated ecological degradation and water resource scarcity. This suggests that since 1980, the underlying surface parameters in the Qinghai Lake watershed have gradually improved, enhancing runoff generation. The hydrological conditions of each lake are influenced by its location, upstream boundaries, geographical climate, and specific human activities (e.g., urbanization, industrial development, and irrigation). Therefore, it is essential to identify key factors affecting water levels to develop methods and procedures for regulating or mitigating extreme hydrological processes in lakes. Many researchers have pointed out that the primary reason for the decline in Qinghai Lake’s water level is long-term climate warming and drying, resulting in lake evaporation exceeding precipitation and runoff inflow [27,29,37]. Liu Jifeng et al. [60] conducted a simulation study of the Buha River basin in Qinghai Lake using the SWAT distributed hydrological model. The results showed that climate change was the dominant factor reducing runoff in the watershed during the 1980s and 1990s. Observational data indicate that human water consumption in the Qinghai Lake area accounts for only 1–5% of total water consumption, a minimal amount, suggesting that direct human water use has little impact on lake water levels [29]. Regarding the impact of underlying surface changes on runoff, different scholars have reached varying conclusions. Some studies suggest that increased vegetation cover reduces runoff in the region [61,62], while others indicate that enhanced vegetation cover may improve regional runoff generation capacity [63]. These differing findings suggest that the impact of vegetation cover on runoff varies significantly due to differences in factors such as sunlight, temperature, soil-water climate conditions, as well as variations in research methods and scales [64]. Li Xiaodong et al. [32] proposed that vegetation growth conditions directly influence lake water level changes, with a positive correlation, consistent with the findings of this study. Specifically, increased precipitation helps improve vegetation growth, thereby enhancing the underlying surface conditions of the watershed [65], which increases surface runoff generation and convergence capacity, ultimately leading to higher runoff volumes. This study demonstrates that larger underlying surface characteristic parameters correspond to lower runoff, with a linear trend rate of −92.78 and a linear fitting coefficient of 0.41 (Figure 8). Changes in the underlying surface may alter runoff generation and convergence mechanisms in the watershed. First, changes in vegetation types and cover directly affect surface roughness and precipitation distribution. Additionally, long-term vegetation changes may alter soil structure and properties, further influencing the water cycle process [66]. Vegetation changes in the Qinghai Lake watershed not only affect hydrological processes but also have profound implications for the sustainable development of regional ecosystems and climate systems.

4.2. Response Mechanisms of Runoff Evolution in the Qinghai Lake Basin Under a Changing Environment

For most river basins in China, human activities primarily reduce annual runoff [25]. However, in this study, human activities were found to increase runoff. This is attributed to increased construction land and desertified areas and reduced grassland in the Qinghai Lake Basin, weakening runoff regulation capacity. Combined with significant climatic impacts, human activities have led to increased runoff. The water balance in the Qinghai Lake Basin involves multiple factors, including precipitation, runoff, and evaporation, as well as glacier meltwater, snowmelt, and underground ice melt recharge. Snow cover is distributed above 4700–4800 m, with permanent snow cover being less than 300 km2, accounting for only 1% of the basin area. Thus, the impact of snowmelt on the water balance is negligible [28]. There are 22 glaciers in the Qinghai Lake Basin, primarily located in the headwaters of the Buha River’s tributaries, Yangkangqu and Xigerqu. Remote sensing imagery shows that glacier area decreased from 15.4 km2 in 1990 to 8.9 km2 in 2010, with an average annual loss of 0.013 billion m³, accounting for approximately 0.3% of the lake’s replenishment [67]. The impact of glacier meltwater on the water balance is minimal. Excluding the flat terrain around the lake, approximately two-thirds of the Qinghai Lake Basin is covered by permafrost [27]. Changes in seasonal freezing and thawing processes, along with permafrost degradation, affect surface hydrology [28,68]. However, the characteristics and mechanisms remain unclear. Errors in this study are related to these factors. Current attribution methods assume that climate change and underlying surface changes are independent variables. However, in reality, these variables are interconnected, making complete separation for quantitative analysis impossible. Additionally, the relative error between the theoretical and observed runoff depth changes in this study is 4.1%, indicating that the Budyko hypothesis-based hydrothermal coupling attribution method is applicable to the Buha River Basin and reliable [50].
This study demonstrates that the primary factors affecting surface runoff in the Qinghai Lake Basin are climatic variables, particularly precipitation and temperature changes. Climate change contributes 79.79% to surface runoff variability, significantly surpassing the 20.21% impact of underlying surface changes. This result highlights the dominant role of climatic factors, especially precipitation changes, in the basin’s hydrological cycle. Increased precipitation directly boosts surface runoff, whereas rising temperatures accelerate water loss through evaporation and transpiration, further reducing the formation of surface runoff [69]. Specifically, precipitation is the fundamental driver of runoff formation in the basin. When precipitation increases, water exceeds the soil’s absorption capacity, converting into surface runoff. Rising temperatures increase water loss through processes such as evaporation and transpiration, leading to more water evaporating into the atmosphere and reducing runoff generation. Changes in the underlying surface, such as land use and vegetation cover, also influence surface runoff but have a relatively limited impact compared to climate changes. Specifically, although increased vegetation cover generally helps reduce surface runoff, climate factors—particularly changes in precipitation and temperature—are predominant in this study area [70]. Therefore, climate change, particularly changes in precipitation and temperature, is the primary driver of surface runoff variations in this basin. Correlation and gray relational analyses reveal significant multicollinearity among hydrological factors in the basin and complex relationships between these factors and subsurface runoff. Principal component regression analysis further indicates that lake evaporation has the most significant impact on subsurface runoff, followed by precipitation and underlying surface changes. The dominant role of lake evaporation on subsurface runoff can be explained by several mechanisms: Firstly, evaporation from lakes or reservoirs increases with rising temperatures, reducing groundwater recharge within the hydrological cycle. Specifically, evaporation transfers water from water bodies to the atmosphere, thereby reducing groundwater recharge in the basin [24]. Changes in precipitation are a key factor in groundwater recharge. Increased precipitation infiltrates the ground to replenish subsurface runoff, whereas decreased precipitation reduces this recharge. Although the impact of underlying surface changes on subsurface runoff is relatively minor, it remains significant to some extent. Soil permeability and water retention capacity, as well as vegetation cover and root activity, influence water infiltration and indirectly affect groundwater recharge [71].The strong correlations among precipitation, evaporation, and underlying surface factors result in significant multicollinearity, which must be carefully addressed in regression models. Principal component regression analysis effectively mitigates multicollinearity issues, enhancing the stability and accuracy of the model. The study’s findings suggest that improving vegetation conditions enhances the basin’s runoff production and confluence capacity [72].
This study provides a scientific basis for water resource management and ecological conservation in the Qinghai Lake Basin by quantitatively analyzing the impacts of climate change and land surface alterations on runoff dynamics. The findings indicate that precipitation is the dominant factor influencing runoff variability. Therefore, it is essential to enhance the monitoring and early warning systems for extreme precipitation events and to optimize water allocation strategies, particularly during periods of high interannual variability in precipitation. In addition, since land surface characteristics also have a measurable impact on runoff, efforts should be made to strengthen ecological restoration and vegetation conservation initiatives. These actions can improve soil water retention capacity, mitigate soil erosion, and further enhance the resilience and stability of the regional ecosystem. Although this study inevitably involves certain observational and modeling uncertainties, efforts have been made to minimize errors through rigorous data selection and model parameter calibration. Identifying and quantifying the uncertainties arising from observational and simulation errors remains a key area for future research in runoff attribution studies.

5. Conclusions

The runoff in the Qinghai Lake Basin has a sensitivity coefficient of 0.38 to precipitation, −0.07 to potential evapotranspiration, and −98.32 to the underlying surface characteristic parameter ω. This indicates that for every 1 mm increase in precipitation in the Qinghai Lake Basin, runoff increases by 0.38 mm; for every 1 mm increase in potential evapotranspiration, runoff decreases by 0.07 mm; and for every unit increase in the underlying surface characteristic parameter, runoff decreases by 98.32 mm. From 1960 to 2016, the main cause of runoff changes in the Qinghai Lake Basin was climate change, which led to a runoff increase of 25.42 mm, contributing 79.79%. Changes in underlying surface characteristics also played a significant role, increasing runoff by 6.44 mm and contributing 20.21%.
Using the water balance method, the contributions of Pl, Rls, El, and Rlg ± ε to Δh were calculated as 20.64%, 29.26%, −40.84%, and 9.26%, respectively. Principal component regression analysis was used to quantitatively evaluate the attribution of subsurface runoff. Results show that evaporation had the largest impact on subsurface runoff (75.00%), while precipitation and underlying surface changes contributed −13.43% and −11.57%, respectively. In summary, climate contributed 88.43% to subsurface runoff, while underlying surface changes contributed −11.57%. Climate change and underlying surface changes contributed 93.02% and 6.98% to lake water level changes, respectively. Therefore, the primary factor driving changes in Qinghai Lake’s water level is climate change, with underlying surface alterations also playing a role.

Author Contributions

Conceptualization, L.M. and Y.F.; methodology, L.M.; software, L.M.; validation, Y.F. and T.J.; formal analysis, L.M.; investigation, L.M.; resources, X.Y.; data curation, L.M.; writing—original draft preparation, L.M.; writing—review and editing, Y.F.; visualization, T.J.; supervision, Y.F.; project administration, X.Y.; funding acquisition, X.Y. All authors have read and agreed to the published version of the manuscript.

Funding

This research was funded by the National Natural Science Foundation of China (42230714, U2243202).

Data Availability Statement

Data subject to third party restrictions.

Acknowledgments

We would like to thank our colleagues for their comments on this paper.

Conflicts of Interest

The authors declare that they have no known competing financial interests or personal relationships that could have appeared to influence the work reported in this paper.

Abbreviations

The following abbreviations are used in this manuscript:
TAverage Temperature
PPrecipitation
UAverage Wind Speed (10 m height)
U2Wind Speed at 2 m Height
SSDSunshine Duration
RHURelative Humidity
ET0Potential Evapotranspiration
RnNet Radiation
hWater Level
ΔhWater Level Difference
QRunoff
EActual Evapotranspiration
ΔsWater Storage Change
ωSurface Characteristic Parameter
PlLake Precipitation
RlsInflow Runoff Depth
ElLake Evaporation
RlgInflow Groundwater Runoff
εError

Appendix A

Appendix A.1. Lake Water Balance Model and Climate Elasticity Coefficient Theory

Qinghai Lake is a closed lake with no watershed outlet. Therefore, the water balance equation for Qinghai Lake can be expressed as follows:
Δ h = P l E l + R l s + R l g ± ε
In the above equation, Δ h represents the annual average water level change of the lake (mm), P l represents the annual precipitation over the lake surface (mm), E l represents the annual evaporation over the lake surface (mm), R l s represents the annual surface runoff into the lake (mm), R l g represents the annual groundwater inflow into the lake (mm), and ε represents the error (mm). At the watershed scale, surface runoff into the lake is essentially equivalent to river runoff, and slope runoff can be neglected. Δ h can also be expressed as follows:
Δ h = h i h i 1
In this equation, h i and h i 1 represent the lake water levels in year i and year i−1, respectively.
The annual average water level of Qinghai Lake is derived from the daily water level data at the Xiashe station, averaged annually, and supplemented by the literature [37]. P l is calculated using Thiessen polygon area weighting based on data from the nearest stations to the lake, Buhahekou and Gangcha. E l is derived from E20 evaporation pan data at the Xiashe station, adjusted using a method referenced in the literature [37]. R l s is calculated using the proportional expansion method [73] based on the annual runoff (Qls, m3) of the Buha River and the Shaliu River.
In the Qinghai Lake basin, changes in Δ h result from the combined effects of climate change and human activities (e.g., agricultural irrigation, domestic water use, grazing, over-cultivation, and deforestation), which indirectly affect water level changes. P l and E l represent climatic factors, while R l s and R l g reflect the combined effects of climate change and watershed characteristic changes. Therefore, to distinguish the effects of climate change and watershed characteristic changes on Δ h , it is necessary to quantitatively separate the contributions of climate change and watershed characteristic changes (caused by human activities) to R l s and R l g . The calculation method is as follows:
R ( Δ h ) c = R ( Δ h P l ) c + R ( Δ h E l ) c + R ( Δ h R l s ) c + R ( Δ h R lg ± ε ) c
R ( Δ h ) u = R ( Δ h R l s ) u + R ( Δ h R lg ± ε ) u
In the above equation, R ( Δ h ) c and R ( Δ h ) u represent the contribution rates of climate change and watershed characteristic changes to Δ h ; R ( Δ h P l ) c and R ( Δ h E l ) c represent the contribution rates of P l and E l factors due to climate change to Δ h ; R ( Δ h R l s ) c and R ( Δ h R lg ± ε ) c represent the contribution rates of R l s and R l g factors due to climate change to Δ h ; and R ( Δ h R l s ) u and R ( Δ h R lg ± ε ) u represent the contribution rates of R l s and R l g factors due to watershed characteristic changes to Δ h .
Budyko proposed that, on a long-term timescale for a watershed, evapotranspiration can be expressed as a function of potential evapotranspiration and precipitation. This is known as the Budyko hypothesis. Many scholars have subsequently developed derivations based on the Budyko hypothesis. For example, Yang et al. [45] derived the following equation:
E = E T 0 × P ( P n + E T 0 n ) 1 / n
Equation (A5) can be considered as ET0, P, and n being a function of E and can be expressed as: E = f ( E T 0 , P , n ) . In the equation, n represents the watershed characteristic parameter. The derivation of the elasticity coefficients for climatic factors is based on Yang and Yang [74], as follows.
First, the above equation can be expressed in its total differential form:
d E = f P d P + f E T 0 d E T 0 + f n d n
By combining the long-term water balance equation for the watershed P = E + Q , the total differential form is derived as d P = d E + d Q . Substituting this into Equation (A6) yields the following equation:
d Q = ( 1 f P ) d P f E T 0 d E T 0 f n d n
Equation (A7) explains the response of watershed runoff to climate change and watershed characteristic changes. If the variation of the watershed characteristic parameter n is not considered, further processing yields the following:
d Q Q = ( 1 f P ) × P P E × d P P f E T 0 × E T 0 P E × d E T 0 E T 0
This can be expressed using climate elasticity coefficients as follows:
d Q Q = ε 1 × d P P + ε 2 × d E T 0 E T 0 ε 1 = 1 - f / P × P P E ,   ε 2 = f / E T 0 × E T 0 P E
Combining Penman’s formula for calculating E T 0 , the main meteorological factors affecting ET0Rn, T, U2, and RHU—are incorporated into the total differential equation to estimate the contributions of meteorological factor changes to variations in potential evapotranspiration:
d E T 0 E T 0 R n × d R n + E T 0 T × d T + E T 0 U 2 × d U 2 + E T 0 R H U × d R H U
The formula is further expressed as follows:
d E T 0 E T 0 R n E T 0 × E T 0 R n × d R n R n + 1 E T 0 × E T 0 T × d T + U 2 E T 0 × E T 0 U 2 × d U 2 U 2 + R H U E T 0 × E T 0 R H U × d R H U R H U = ε 3 × d R n R n + ε 4 × d T + ε 5 × d U 2 U 2 + ε 6 × d R H U R H U
In this equation, ε 3 , ε 4 , ε 5 , and ε 6 are the elasticity coefficients of ET0 with respect to changes in Rn, T, U2, and RHU, respectively.
Substituting Equation (A11) into Equation (A9) yields the following:
d Q Q = ε 1 × d P P + ε 2 ε 3 × d R n R n + ε 2 ε 4 × d T + ε 2 ε 5 × d U 2 U 2 + ε 2 ε 6 × d R H U R H U = ε P × d P P + ε R n × d R n R n + ε T × d T + ε U 2 × d U 2 U 2 + ε R H U × d R H U R H U
In the above equation, ε P , ε R n , ε T , ε U 2 and ε R H U represent the elasticity coefficients of Q with respect to changes in P, Rn, T, U2, and RHU, respectively. Yang and Yang [74] focused on the direct effects of temperature on runoff, excluding indirect effects, as temperature also influences precipitation.
Since climate elasticity is defined based on the annual averages of climate variables, Equation (A12) can be expressed as follows:
d Q Q ¯ = ε 1 × d P P ¯ + ε 2 ε 3 × d R n R n ¯ + ε 2 ε 4 × d T + ε 2 ε 5 × d U 2 U 2 ¯ + ε 2 ε 6 × d R H U R H U ¯
Therefore, the climate elasticity indices are expressed as follows:
ε 1 = P ¯ P ¯ - E ¯ 1 f P | P = P ¯ , E T 0 = E T 0 ¯ , ε 2 = - E T 0 ¯ P ¯ - E ¯ 1 f E T 0 | P = P ¯ , E T 0 = E T 0 ¯ , ε 3 = R n ¯ E T 0 ¯ E T 0 R n | X = X ¯ , ε 4 = 1 E T 0 ¯ E T 0 T | X = X ¯ , ε 5 = U 2 ¯ E T 0 ¯ E T 0 U 2 | X = X ¯ , ε 6 = R H U ¯ E T 0 ¯ E T 0 R H U | X = X ¯
In this equation, ( ) ¯ represents the annual average value of each climate variable, while X = X ¯ represents R n = R n ¯ , T = T ¯ , U 2 = U 2 ¯ , and R H U = R H U ¯ .
f P = E P = 1 / 1 + P E T 0 n 1 + 1 / n
f E T 0 = E E T 0 = 1 / 1 + E T 0 P n 1 + 1 / n

References

  1. Fu, B.; Liu, Y.; Zhao, W.; Feng, X.; Liu, S.; Miao, C.; Wang, X.; He, C.; Li, C.; Ye, A.; et al. Optimization for Qinghai-Xizang Plateau ecological security barrier system. Bull. Chin. Acad. Sci. 2024, 39, 1882–1893. [Google Scholar] [CrossRef]
  2. Zhao, H.; Cao, S.; Lei, Y.; Chen, L.; Li, W.; Kang, L. Spatial and Temporal Characteristics and Driving Analysis of Ecosystem Water Use Efficiency in the Qinghai Lake Basin. Acta Agrestia Sin. 2024, 32, 3554–3566. [Google Scholar]
  3. Liu, Y.; Wang, Z.; Wang, F. Characteristics Analysis of Temperature and Precipitation in Qinghai Lake Basin. J. China Hydrol. 2022, 42, 82–88. [Google Scholar] [CrossRef]
  4. Lei, G.; Yin, J.; Wang, W.; Wang, H.; Liu, C. Hydrological Frequency Analysis in Changing Environments Based on Empirical Mode Decomposition and Metropolis-Hastings Sampling Bayesian Models. J. Hydrol. Eng. 2023, 28, 04023027. [Google Scholar] [CrossRef]
  5. Song, X.; Zhang, J.; Zhan, C.; Liu, C. Review for impacts of climate change and human activities on water cycle. Shuili Xuebao 2013, 44, 779–790. [Google Scholar] [CrossRef]
  6. Zhang, J.; Zhang, S.; Wang, J.; Li, Y. Study on runoff trends of the six larger basins in China over the past 50 years. Adv. Water Sci. 2007, 18, 230–234. [Google Scholar]
  7. Zhang, S.; Yang, D.; Yang, H.; Lei, H. Analysis of the dominant causes for runoff reduction in five major basins over China during 1960–2010. Adv. Water Sci. 2015, 26, 605–613. [Google Scholar] [CrossRef]
  8. Wang, J.; Zhang, J.; Li, Y.; Zhang, S. Variation trends of runoffs seasonal distribution of the six larger basins in China over the past 50 years. Adv. Water Sci. 2008, 19, 656–661. [Google Scholar]
  9. Zhao, Y.; Hu, C.; Zhang, X.; Wang, Y.; Cheng, C.; Yin, X.; Xie, M. Analysis on runoff and sediment regimes and its causes of the Yellow River in recent 70 years. Trans. Chin. Soc. Agric. Eng. 2018, 34, 112–119. [Google Scholar]
  10. Sun, F.; Li, L.; Liang, H.; Yuan, J.; Lu, S. Climate change characteristics and its impacts on water resources in the Liaohe river basin from 1961 to 2009. J. Meteorol. Environ. 2012, 28, 8–13. [Google Scholar]
  11. Piao, S.; Ciais, P.; Huang, Y.; Shen, Z.; Peng, S.; Li, J.; Zhou, L.; Liu, H.; Ma, Y.; Ding, Y.; et al. The Impacts of Climate Change on Water Resources and Agriculture in China. Nature 2010, 467, 43–51. [Google Scholar] [CrossRef]
  12. Xu, Y.; Gao, X.; Giorgi, F. Upgrades to the REA Method for Producing Probabilistic Climate Change Predictions. Clim. Res. 2010, 41, 61–81. [Google Scholar] [CrossRef]
  13. Guo, M.; Wu, W.; Zhou, X.; Chen, Y.; Li, J. Investigation of the Dramatic Changes in Lake Level of the Bosten Lake in Northwestern China. Theor. Appl. Climatol. 2015, 119, 341–351. [Google Scholar] [CrossRef]
  14. Wang, W.; Feng, Z.; Ma, M. Climate Changes and Hydrological Processes. Water 2022, 14, 3922. [Google Scholar] [CrossRef]
  15. He, K.; Gao, W.; Duan, C.; Zhu, Y.; Pan, Y.; Liu, C.; Zhang, W.; Yang, G. Water level variation and its driving factors in Lake Dianchi, Fuxian and Yangzong during 1988–2015. J. Lake Sci. 2019, 31, 1379–1390. [Google Scholar]
  16. Wu, Y.; Zheng, H.; Zhang, B.; Chen, D.; Lei, L. Long-Term Changes of Lake Level and Water Budget in the Nam Co Lake Basin, Central Tibetan Plateau. J. Hydrometeorol. 2014, 15, 1312–1322. [Google Scholar] [CrossRef]
  17. Guo, J. Responses of Hydrological Extreme Events and Water Budget under Changing Environment. Ph.D. Thesis, Wuhan University, Wuhan, China, 2014. [Google Scholar]
  18. Wang, X. Advances in Separating Effects of Climate Variability and Human Activity on Stream Discharge: An Overview. Adv. Water Resour. 2014, 71, 209–218. [Google Scholar] [CrossRef]
  19. Zhao, Y.; Zou, X.; Gao, J.; Xu, X.; Wang, C.; Tang, D.; Wang, T.; Wu, X. Quantifying the Anthropogenic and Climatic Contributions to Changes in Water Discharge and Sediment Load into the Sea: A Case Study of the Yangtze River, China. Sci. Total Environ. 2015, 536, 803–812. [Google Scholar] [CrossRef]
  20. Zhang, M.; Wei, X.; Sun, P.; Liu, S. The Effect of Forest Harvesting and Climatic Variability on Runoff in a Large Watershed: The Case Study in the Upper Minjiang River of Yangtze River Basin. J. Hydrol. 2012, 464–465, 1–11. [Google Scholar] [CrossRef]
  21. Wang, H. Evolution of watershed ecological hydrology in Haihe basin mountainous area. Ph.D. Thesis, Beijing Foresty University, Beijing, China, 2015. [Google Scholar]
  22. Schaake, J.C. From climate to flow. In Climate Change and US Water Resources; John Wiley: New York, NY, USA, 1990. [Google Scholar]
  23. Milly, P.C.D.; Dunne, K.A. Macroscale Water Fluxes 2. Water and Energy Supply Control of Their Interannual Variability. Water Resour. Res. 2002, 38, 24-1–24-9. [Google Scholar] [CrossRef]
  24. Zhang, W.; Shi, S. Study on the Relation between Groundwater Dynamics and Vegetation Degeneration in Erjina Oasis. J. Glaciol. Geocryol. 2002, 24, 421–425. [Google Scholar]
  25. Liu, J.; Zhang, Q.; Chen, X.; Gu, X. Quantitative evaluations of human- and climate-induced impacts on hydrological processes of China. Acta Geogr. Sin. 2016, 71, 1875–1885. [Google Scholar]
  26. Li, B.; Li, L.; Qin, Y.; Liang, L.; Li, J.; Liu, Y. Impacts of Climate Variability on Streamflow in the Upper and Middle Reaches of the Taoer River Based on the Budyko Hypothesis. Resour. Sci. 2011, 33, 70–76. [Google Scholar]
  27. Qin, B.; Shi, Y. The Hydrological Characteristics and The Cause of The Declining of Water Level in Qinghai Lake. Acta Geogr. Sin. 1992, 47, 267–273. [Google Scholar]
  28. Ding, Y.; Liu, F. Effect of Climatic Change of Water Balance of Qinghai Lake Basin for Recent Thirty Years and Possible Tendency. Sci. Geogr. Sin. 1995, 15, 128–135, 199. [Google Scholar]
  29. Hu, A. Analysis on the Influence of Climate Change and the Human Activities on Inland Lake. J. Arid Land Resour. Environ. 2007, 21, 1–5. [Google Scholar]
  30. Li, F.; Fu, Y.; Yang, Q.; Yan, L.; Xiao, J. Climate Change and Its Environmental Effects in the Surrounding Area of Qinghai Lake. Resour. Sci. 2008, 30, 348–353. [Google Scholar]
  31. Sun, Y.; Li, X.; Tang, J.; Xu, H. Climate Change and Hydrological Response in the Watershed of Qinghai Lake. Resour. Sci. 2008, 30, 354–362. [Google Scholar]
  32. Li, X.; Zhao, H.; Wang, G.; Yao, K.; Xin, Q.; He, Z.; Li, L. Influence of watershed hydrothermal conditions and vegetation status on lake level of Qinghai Lake. Arid Land Geogr. 2019, 42, 499–508. [Google Scholar]
  33. Qin, B.; Huang, Q. Evaluation of the Climatic Change Impacts on the Inland Lake—A Case Study of Lake Qinghai, China. Clim. Change 1998, 39, 695–714. [Google Scholar] [CrossRef]
  34. Li, X.; Li, L.; Wang, G.; Yao, K.; He, Z.; Xiao, J. Water Level and Agriculture and Husbandry Characteristics in Qinghai Lake Basin: The Response to Climate Warming and Wetting. Chin. Agric. Sci. Bull. 2018, 34, 119–127. [Google Scholar]
  35. Liu, Y. Study on Mechanism of Microbial-Driven NitrogenMigration and Transformation Based on WatershedWater Cycle-Taking Qinghai Lake Basin as an Example. Ph.D. Thesis, East China Normal University, Shanghai, China, 2019. [Google Scholar]
  36. Zhang, Z.; Cong, Z.; Gao, B.; Li, G.; Wang, X. The Water Level Change and Its Attribution of the Qinghai Lake from 1960 to 2020. J. Hydrol. Reg. Stud. 2024, 52, 101688. [Google Scholar] [CrossRef]
  37. Qu, Y. Water Balance an Forecasting of Water Level Change in Qinghai Lake. J. Lake Sci. 1994, 6, 298–307. [Google Scholar]
  38. Yang, Y.; Tian, F. Abrupt Change of Runoff and Its Major Driving Factors in Haihe River Catchment, China. J. Hydrol. 2009, 374, 373–383. [Google Scholar] [CrossRef]
  39. Su, B.; Gemmer, M.; Jiang, T. Spatial and Temporal Variation of Extreme Precipitation over the Yangtze River Basin. Larg. Asian Rivers Their Interact. Estuaries Coasts 2008, 186, 22–31. [Google Scholar] [CrossRef]
  40. Mann, H.B. Nonparametric Tests Against Trend. Econometrica 1945, 13, 245. [Google Scholar] [CrossRef]
  41. Huang, R.; Zhang, J.; Lin, Y.; Bu, T.; Wang, X.; Xue, Z.; Li, Y.; Ma, X.; Yu, Z.; Bai, P. Variation of streamflow and its drivers in Xin’an River Basin. J. Nat. Resour. 2019, 34, 1771–1781. [Google Scholar] [CrossRef]
  42. Zhang, L.; Zhao, G.; Mu, X.; Gao, P.; Sun, W. Attribution of runoff variation in the Wei River basin based on the Budyko hypothesis. Acta Ecol. Sin. 2018, 38, 7607–7617. [Google Scholar]
  43. Ning, T. The Spatiotemporal Variability of Catchment Evapotranspiration and Its Attribution Analysis in the Loess Plateau under the Budyko Framework. Ph.D. Thesis, Research Center of Soil and Water Conservation and Ecological Environment, Chinese Academy of Sciences and Ministry of Education, Beijing, China, 2017. [Google Scholar]
  44. Fu, B. On the Calculation of the Evaporation from Land Surface. Sci. Atmos. Sin. 1981, 5, 23–31. [Google Scholar]
  45. Yang, H.; Yang, D.; Lei, Z.; Sun, F. New Analytical Derivation of the Mean Annual Water-Energy Balance Equation. Water Resour. Res. 2008, 44, W03410. [Google Scholar] [CrossRef]
  46. Xu, X.; Yang, D.; Yang, H.; Lei, H. Attribution Analysis Based on the Budyko Hypothesis for Detecting the Dominant Cause of Runoff Decline in Haihe Basin. J. Hydrol. 2014, 510, 530–540. [Google Scholar] [CrossRef]
  47. Sun, Y. Time instability of hydrological model parameters under changing environment. Ph.D. Thesis, Tsinghua University, Beijing, China, 2015. [Google Scholar]
  48. Zhang, W.; Wei, X.; Li, Y. Groundwater Dynamic Evolution Under Climatic Change and Human Activites in Shiyang River Basin. Res. Soil Water Conserv. 2009, 16, 183–187. [Google Scholar]
  49. Cheng, J.; Liu, C.; Liu, K.; Wu, J.; Fan, C.; Xue, B.; Ma, R.; Song, C. Potential impact of the dramatical expansion of Lake Qinghai on the habitat facilities and grassland since 2004. J. Lake Sci. 2021, 33, 922–934. [Google Scholar]
  50. Huang, X.; Li, R.; Gan, Y.; Wu, Y. Attribution analysis of runoff change in Buha River basin based on Budyko hypothesis. South--North Water Transf. Water Sci. Technol. 2023, 21, 480–490. [Google Scholar] [CrossRef]
  51. Xie, M.; Ren, Z.; Li, Z.; Zhang, X.; Ma, X.; Li, P.; Shen, Z. Evolution of the Precipitation–Stream Runoff Relationship in Different Precipitation Scenarios in the Yellow River Basin. Urban Clim. 2023, 51, 101609. [Google Scholar] [CrossRef]
  52. Li, Q. Investigation of Runoff Evolution at the Headwaters of Yangtze River and Its Driving Forces. J. Yangtze River Sci. Res. Inst. 2018, 35, 1–5. [Google Scholar]
  53. Tang, Y.; Tang, Q.; Wang, Z.; Chiew, F.H.S.; Zhang, X.; Xiao, H. Different Precipitation Elasticity of Runoff for Precipitation Increase and Decrease at Watershed Scale. J. Geophys. Res. Atmos. 2019, 124, 11932–11943. [Google Scholar] [CrossRef]
  54. Li, Z.; Chen, Y.; Shen, Y.; Liu, Y.; Zhang, S. Analysis of Changing Pan Evaporation in the Arid Region of Northwest China. Water Resour. Res. 2013, 49, 2205–2212. [Google Scholar] [CrossRef]
  55. Chen, Y.; Li, Z.; Fan, Y.; Wang, H.; Fang, G. Research progress on the impact of climate change on water resources in the arid region of Northwest China. Acta Geogr. Sin. 2014, 69, 1295–1304. [Google Scholar]
  56. Zhao, X.; Tan, K.; Zhao, S.; Fang, J. Changing Climate Affects Vegetation Growth in the Arid Region of the Northwestern China. J. Arid Environ. 2011, 75, 946–952. [Google Scholar] [CrossRef]
  57. Wang, Y.; Shen, Y.; Chen, Y.; Guo, Y. Vegetation Dynamics and Their Response to Hydroclimatic Factors in the Tarim River Basin, China. Ecohydrology 2013, 6, 927–936. [Google Scholar] [CrossRef]
  58. Li, Y.; Yuan, G. Biophysical effects of the different underlying factors on land the surface temperature in the Qinghai Lake Basin. Arid Zone Res. 2024, 41, 24–35. [Google Scholar] [CrossRef]
  59. Zhao, L.; Hu, G.; Zou, D.; Wu, X.; Ma, L.; Sun, Z.; Yuan, L.; Zhou, H.; Liu, S. Permafrost Changes and Its Effects on Hydrological Processes on Qinghai-Tibet Plateau. Bull. Chin. Acad. Sci. 2019, 34, 1233–1246. [Google Scholar] [CrossRef]
  60. Liu, J.; Huo, S.; Li, S.; Du, Y. Application of SWAT model to analysis of runoff variation of Buha River Basin of Qinghai Lake. J. Hohai Univ. 2007, 35, 159–163. [Google Scholar]
  61. Andréassian, V. Waters and Forests: From Historical Controversy to Scientific Debate. J. Hydrol. 2004, 291, 1–27. [Google Scholar] [CrossRef]
  62. Wei, X.; Zhou, G.; Liu, S.; Sun, G. Forests and Streamflow—Consistence and Complexity. J. Nat. Resour. 2005, 20, 761–770. [Google Scholar]
  63. Liu, C.; Zhong, J. The Influence of Forest Cover Upon Annual Runoff in the Loess Plateau of China. Acta Geogr. Sin. 1978, 33, 112–127. [Google Scholar]
  64. Wang, Y.; Wang, Y. Forest and Slope-runoff. World For. Res. 2005, 18, 12–15. [Google Scholar] [CrossRef]
  65. Xie, S.; Mo, X.; Hu, S.; Chen, X. Responses of vegetation greenness to temperature and precipitation in the Three-North Shelter Forest Program. Geogr. Res. 2020, 39, 152–165. [Google Scholar]
  66. Bai, E.; Xue, B. A review of influences of land use and land cover change on ecosystems. Chin. J. Plant Ecol. 2020, 44, 543–552. [Google Scholar]
  67. Liu, B. Spatial and temporal variation characteristics of grassland and lake in Qinghai Lake basin under climate change. Ph.D. Thesis, Lanzhou University, Lanzhou, China, 2016. [Google Scholar]
  68. Zhu, H. Long Sequence Runoff in the Source of the Yangtze River: Variation Law and Its Relationship with Meteorological Elements. Chin. Agric. Sci. Bull. 2019, 35, 123–129. [Google Scholar]
  69. Xi, H.; Xu, B.; Huang, F.; Yang, Y.; Chen, Y.; Lu, Z.; Qi, S.; Song, F.; Chen, Y.; Qu, L. Impact causes of runoff in mountainous areas of the Ili River basin. Chin. J. Nat. 2024, 1–10. [Google Scholar]
  70. Zhang, Q.; Han, Y.; Song, L. The Summarize of Development of Global Climate Change and It’s Effect Factors. Adv. Earth Sci. 2005, 20, 990. [Google Scholar]
  71. Lei, Y.; Cao, S.; Cao, G.; Yang, Y.; Lan, Y.; Ji, Y.; Li, H. Study on surface water and groundwater interaction of Shaliu River Basin in Qinghai Lake in different periods. J. Nat. Resour. 2020, 35, 2528. [Google Scholar] [CrossRef]
  72. Gu, C.; Mu, X.; Sun, W.; Gao, P.; Zhao, G. Comparative Analysis of the Responses of Rainstorm Flood and Sediment Yield to Vegetation Rehabilitation in the Yanhe River Basin. J. Nat. Resour. 2017, 32, 1755–1767. [Google Scholar] [CrossRef]
  73. Ding, Y.; Liu, F. Estimating on Water Balance Elements in the Drainage Basin of Qinghai Lake. Arid Land Geogr. 1993, 16, 25–30. [Google Scholar] [CrossRef]
  74. Yang, H.; Yang, D. Derivation of Climate Elasticity of Runoff to Assess the Effects of Climate Change on Annual Runoff. Water Resour. Res. 2011, 47, W07526. [Google Scholar] [CrossRef]
Figure 1. Study areas.
Hydrology 12 00094 g001
Figure 2. Trend of annual runoff in Buha River Basin.
Hydrology 12 00094 g002
Figure 3. Trend of annual runoff in Shaliu River Basin.
Hydrology 12 00094 g003
Figure 4. Mann–Kendall abrupt change analysis of annual runoff in Buha River and in Shaliu River.
Hydrology 12 00094 g004
Figure 5. Cumulative anomaly mutation test in Buha River and in Shaliu River.
Hydrology 12 00094 g005
Figure 6. Trend of underlying surface characteristics (ω) from 1960 to 2016 in Qinghai Lake Basin.
Hydrology 12 00094 g006
Figure 7. Abrupt change analysis of underlying surface characteristics (ω) in Qinghai Lake Basin.
Hydrology 12 00094 g007
Figure 8. Relationship between underlying surface characteristic parameters (ω) and surface runoff (Q).
Hydrology 12 00094 g008
Table 1. Information on the main hydrological stations in Qinghai Lake Basin.
Hydrological Station NameRiver
Name
Catchment Area (km2)Flow
(m³/s)
Annual Runoff (108 m3)Runoff Depth (mm)Runoff Coefficient
[10−3 m3/(s·km2)]
Buha River EstuaryBuhua River14,33725.67.8356.31.79
Gang ChaShaliu River14427.22.51157.54.99
Total 15,779 10.34
Table 2. Detailed information on the meteorological stations in and around the research area.
Station CodeStation NameLatitude (°N)Longitude (°E)Elevation (m)Data Time Span
52645Ye Niugou38.4399.6033151960–2016
52842Cha Ka36.7899.0830881960–2016
52633Tuo Le38.8298.4233681960–2016
52833Wu Lan36.9398.4829511960–2016
52836Du Lan36.3098.1031901960–2016
52737De Lingha37.3797.3829821960–2016
52868Gui De36.02101.3722741960–2016
52657Qi Lian38.18100.2527881960–2016
52754Gang Cha37.33100.1333021960–2016
52856Gong He36.27100.6228361960–2016
52943Xing Hai35.5899.9833241960–2016
52765Men Yuan37.38101.6228511960–2016
52866Xi Ning36.73101.7522961960–2016
52955Gui Nan35.58100.7331211960–2016
52745Tian Jun37.3099.0234171961–2010
52855Huang Yuan36.68101.2526751961–2010
52853Hai Yan36.90100.9830101961–2010
1329500Bu Hua37.0399.7331911962–2016
Table 3. Comparison table of the main symbols.
No.AbbreviationNameUnit
1TAverage Temperature°C
2PPrecipitationmm
3UAverage Wind Speed (10 m height)m/s
4U2Wind Speed at 2 m Heightm/s
5SSDSunshine Durationh
6RHURelative Humidity%
7ET0Potential Evapotranspirationmm
8RnNet RadiationMJ/m2
9hWater Levelm
10ΔhWater Level Differencemm
11QRunoffmm
12EActual Evapotranspirationmm
13ΔsWater Storage Changemm
14ωSurface Characteristic Parameter
15PlLake Precipitationmm
16RlsInflow Runoff Depthmm
17ElLake Evaporationmm
18RlgInflow Groundwater Runoffmm
19εError
Table 4. Correlation analysis between climate indicators and annual runoff from 1960–2016 in Buha River.
TimeTPUSSDRHUET0Rn
1960–2016 year0.170.72 **−0.42 **−0.190.47 **−0.50 **−0.45 **
1960–2003 year−0.190.72 **−0.39 **−0.030.71 **−0.73 **−0.44 **
2004–2016 year0.39−0.10−0.080.55−0.440.370.36
1960–1993 year−0.34 *0.74 **−0.53 **−0.090.76 **−0.78 **−0.36 *
1994–2016 year0.49 *0.70 **−0.15−0.320.00−0.13−0.46 *
Note: ** and * indicate significance at the 1% and 5% level, respectively.
Table 5. Climatic and hydrological elements.
Climatic VariablesMulti-Year AverageLinear Tendency RateUnitSignificance (P)Rate of ChangeZ Value
ET0887.401.51mm/a/10a>0.050.02%0.10
P325.8117.45mm/a/10a0.010.54%3.72
Rn2906.93−7.39MJ/(m2·a)/10a0.05−0.03%−2.07
T0.810.36°C/a/10a0.014.47%6.90
U22.70−0.08m/s/a/10a0.01−0.28%−4.44
RHU47.200.03%/a/10a>0.050.01%0.72
Q60.724.12mm/a/10a>0.052.87%1.36
Table 6. Calculation results of elastic coefficient.
FactorElastic CoefficientValue
Pɛ11.98
ET0ɛ2−0.98
Rnɛ30.66
Tɛ40.02
U2ɛ50.16
RHUɛ6−0.56
Table 7. Attribution analysis of runoff variations in Qinghai Lake watershed.
CategoryΔQΔQclimateΔQcatchmentError
Influence quantity (mm)33.8525.426.44−1.99
Contribution rate (%)10079.79%20.21%−5.89%
Table 8. Correlation coefficient matrix of each indicator.
Variablex1x2x3x4x5x6
x110.36 **0.51 **−0.71 **0.63 **−0.23
x2 10.61 **−0.56 **0.73 **−0.24
x3 1−0.56 **0.61 **−0.56 **
x4 1−0.63 **0.27 *
x5 1−0.045
x6 1
Note: * indicates significance at the 0.05 level, and ** indicates significance at the 0.01 level.
Table 9. Grey correlation matrix.
Matrixγ1γ2γ3γ4γ5γ6
y0.820.770.770.830.790.84
Table 10. Correlation coefficient matrix eigenvalue and contribution rate.
Principal ComponentEigenvalueContribution Rate%Cumulative Contribution Rate%
F13.6160.0960.09
F20.9315.4575.54
F30.8914.7890.32
F40.315.0995.41
F50.254.1599.56
F60.030.44100
Table 11. Eigenvectors of the correlation coefficient matrix.
Principal Componentx1x2x3x4x5x6
F10.36−0.570.380.250.570.06
F20.450.520.13−0.090.120.70
F30.44−0.08−0.290.70−0.47−0.01
Table 12. Contribution rate of meteorological and hydrological factors.
Contribution Rate%PlRlsElRlg ± εΔh
Climate change10079.7910088.4393.02
Changes in underlying surface characteristics020.21011.576.98
Disclaimer/Publisher’s Note: The statements, opinions and data contained in all publications are solely those of the individual author(s) and contributor(s) and not of MDPI and/or the editor(s). MDPI and/or the editor(s) disclaim responsibility for any injury to people or property resulting from any ideas, methods, instructions or products referred to in the content.

