Article

Towards a Classification of Tunisian Dams for Enhanced Water Scarcity Governance: Parametric or Non-Parametric Approaches?

National Research Institute of Rural Engineering, Water and Forestry, University of Carthage, Ariana 2080, Tunisia
*
Author to whom correspondence should be addressed.
Hydrology 2025, 12(4), 96; https://doi.org/10.3390/hydrology12040096
Submission received: 25 March 2025 / Revised: 10 April 2025 / Accepted: 15 April 2025 / Published: 18 April 2025

Abstract

:
Classifying dams is important to ensure proper management, safety, and maintenance based on their size, purpose, and risk level. This helps in planning for emergency responses, structural inspections, and efficient water resource utilization. This study used the analysis of variance (ANOVA) technique to categorize the main Tunisian dams according to their precipitation to potential evapotranspiration (P/PET) ratio. The data were obtained from the NASA POWER platform, with potential evapotranspiration estimated using the Oudin model. Despite the violation of the normality assumption, the robustness of the ANOVA test for classification purposes remained unaffected. A comparison between Duncan’s test (parametric) and the Kruskal–Wallis test (non-parametric) revealed similar class structures, although Duncan’s test provided greater precision. The analysis identified four primary dam classes, reflecting regional differences in water availability and evaporative demand, and included dams in north-west Tunisia, considered the ‘water tower’ of the country, and those in semi-arid and arid regions.

1. Introduction

Tunisia is one of the Mediterranean countries with the least water resources. The currently available volume per capita per year is estimated at around 450 mS [1,2,3]. This indicator places Tunisia below the threshold of “absolute water shortage” which is 500 mS per capita per year [4], a criterion widely used by international institutions. In addition to this crucial issue of water scarcity, Tunisia is well exposed to the effects of climate change. In fact, studies on the Mediterranean region indicate, with a high degree of certainty, an increase in the intensity and variability in climatic extremes in the 21st century. Anthropogenic climate change is strongly linked to more frequent and severe extreme weather events, including floods and droughts, as well as increased water-related risks with warming [5,6,7,8]. To address the challenge of water scarcity, an extensive resource mobilization program has was initiated in the 1980s. This is reflected, among others, in the construction of around thirty partially interconnected dams and a thousand hillside reservoirs [9]. To address the effects of climate change, especially the droughts observed over the past five years, Tunisia has released its Water Strategy 2050 [10]. One key focus is classifying dams based on hydroclimatic factors for updating agricultural maps and for better optimization of water efficiency and the balancing of the water needs of agriculture, industry, domestic consumption, and ecosystems.
An extensive body of scientific literature exists on classification methods and their application to climatic variables. In this context, we refer to the book “Statistical Methods in the Atmospheric Sciences; 4th Edition”, which provides a comprehensive overview of various classification methods and their application areas, as well as their requirements and limitations [11]. In Tunisia, studies have been conducted using classification techniques in the field of hydrology. The DRASTIC method was used for agricultural pollution classification [12]. The bivariate statistical method was employed for soil mapping [13]. Geospatial classification was applied to address salinity issues [14]. Although the databases constructed in these cited studies allow for it, the Analysis of Variance method (ANOVA) was not tested and the literature review did not identify any papers applying this technique in the fields of hydrology or climatology, in Tunisia.
Initially, ANOVA [15] allowed for the decomposition of data variability into distinct sources, paving the way for applications in various scientific fields. Later, Fisher [16] applied ANOVA into the agricultural field, to examine the causes of wheat-seed deterioration using time series. Over time, ANOVA became a central tool in research, particularly through work such as that of Scheffé (1956) [17], which strengthened its theoretical foundations. However, criticism, including that of Eisenhart [18], highlighted the limitations of its assumptions, while later studies, such as that of [19], explored its robustness in the face of violations of these assumptions. Today, ANOVA is widely used in water science, ecology, agriculture, and hydrology, where it helps to assess water quality, compare agricultural yields, and model watersheds, confirming its essential role in the analysis of experimental data [20,21,22,23].
In general, precipitation (P) and potential evapotranspiration (PET) variables are usually treated separately for classification purposes. However, these two variables are inherently related, particularly in the context of irrigation or resource estimation, through mass conservation equations. The aim here was to associate them in a simple but effective manner. While their difference could serve as a basis for analysis, it may introduce mathematical challenges due to possible negative or zero values. On the other hand, the ratio P/PET avoids these issues while providing a dimensionless characteristic. Consequently, the classification in this study was based on the P/PET ratio, which acted as an indicator of evaporation demand or the relative availability of water resources.
Taking into account what has been discussed above, in this paper, the ANOVA technique was applied to hydroclimatic variables (precipitation and potential evapotranspiration) by the P/PET ratio, to classify the main Tunisian dams, providing a basis for studies of water governance to support policy makers, in particular for the management of irrigated areas. The choice between parametric or non-parametric tests is compared and validated.
The first part of this article is devoted to the explanation of data, including its origin, description, time-step resolution, mapping, and critical analysis. This is followed by a detailed presentation of the adopted method and the development tools. Subsequently, the results are presented in various forms, accompanied by a critical analysis and future perspectives.

2. Material and Methods

Figure 1 shows the adopted methodology, and represents a processing workflow divided into two phases: the first one dedicated to the construction of the database and the second one focused on the classification procedures.

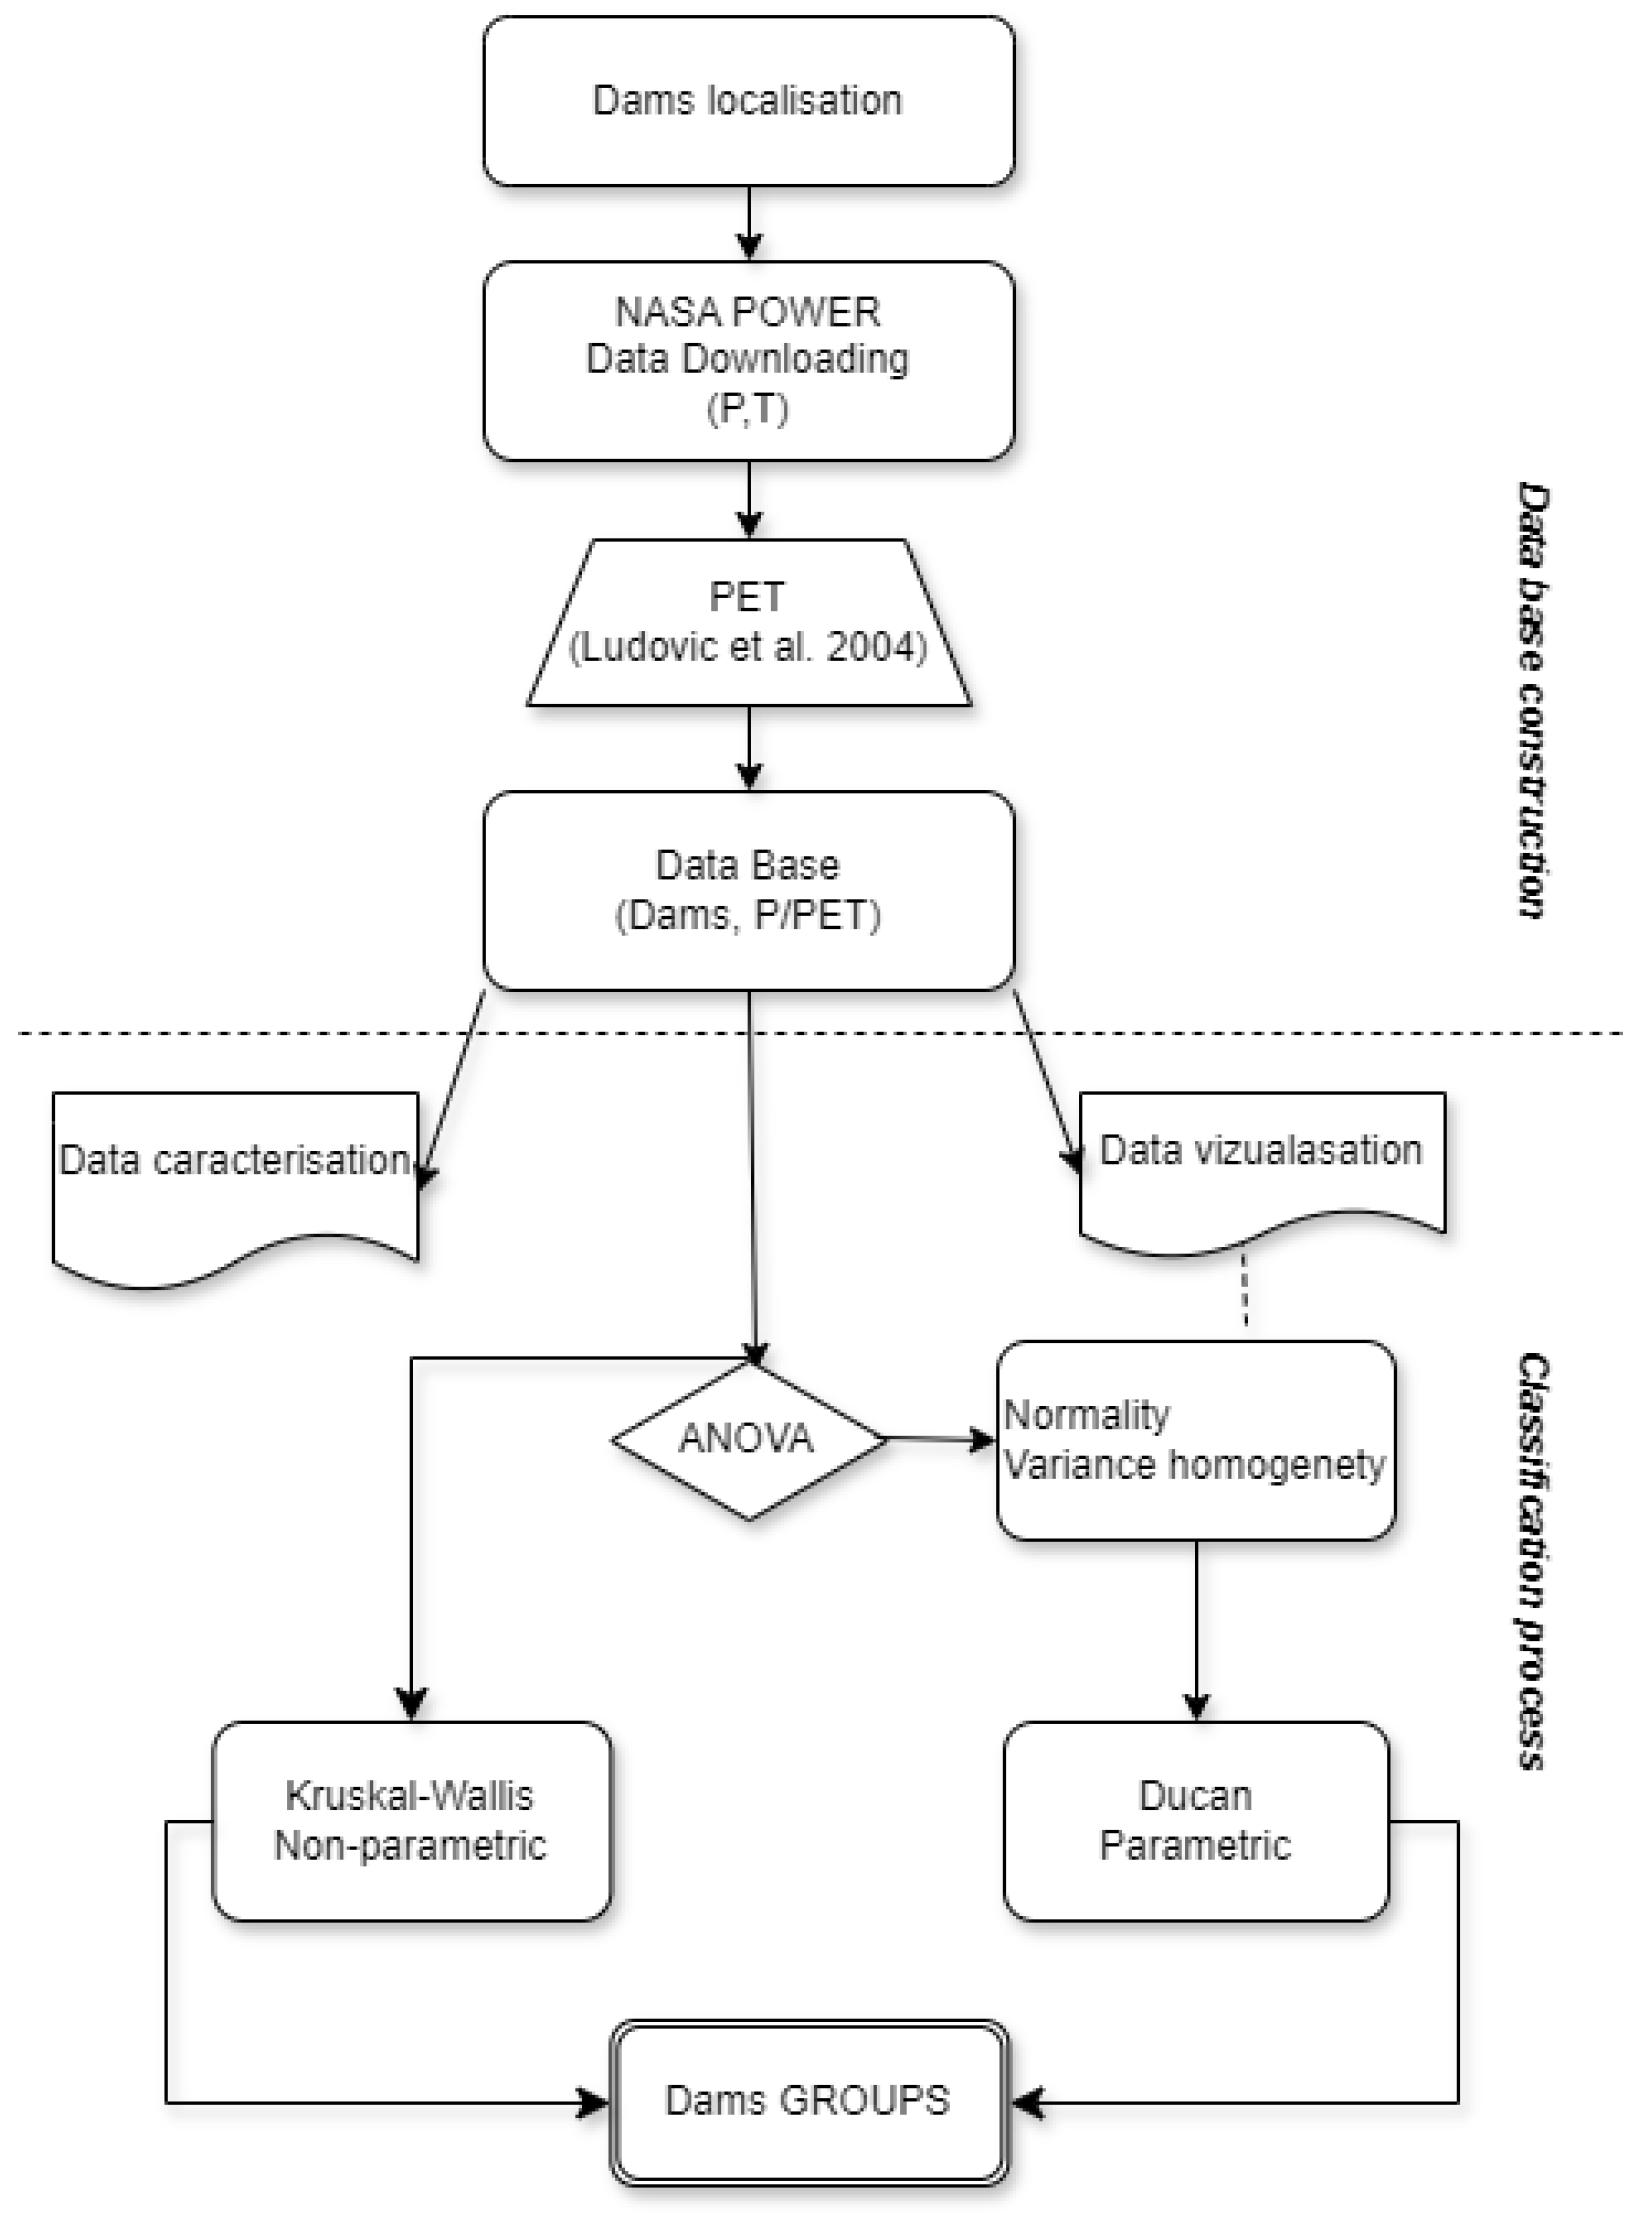
2.1. Database Construction

Ideally, it would be preferable to rely on a hydroclimatic monitoring network. However, compiling a long-term time series from stations covering a significant part of Tunisia and including various variables is not an easy task, as such data services are, in most cases, subject to a fee. Consequently, the choice was made to use open-access data provided by various organizations, in particular the NASA POWER Prediction of Worldwide Energy Resources service [25]. This choice was also based on the fact that the model employed by this platform appeared to be more robust, yielding more reliable outputs compared to other models [26]. Moreover, the current version of the model (MERRA-2) is more reliable and features significant improvements over earlier versions, particularly in the estimation of surface hydrology variables, which was the focus of this paper [27,28]. Last but not least, as a justification for this choice, the ANOVA technique was applied using data provided by this platform on hydrological data in order to analyze the spatiotemporal variability in evapotranspiration and precipitation at different time steps [28,29,30].
Different hydroclimatic variables are provided by NASA POWER at various time steps, ranging from hourly to annual. In this study, the monthly time step was chosen for two main reasons. First, the estimation error of the model decreases when moving from finer to coarser time steps, especially for precipitation [25]. Second, since the output of this work would be linked to the management of water inflow in dams, the monthly time step seemed a more effective and suitable step for such applications compared with the daily time step [31].
This study focused on precipitation (P) and potential evapotranspiration (PET) as key hydroclimatic variables. Regarding PET, although it was available on the NASA POWER platform, air temperature (T) was selected for analysis instead. Subsequently, an estimation model for PET was used, which had demonstrated its effectiveness in estimating water resources, particularly those related to dam inflows. The equations of this model are thoroughly detailed in the work of Ludovic Oudin [24,32].
A database was created covering the main dams in Tunisia, a total of 35 dams. Based on their geographical location, each dam was associated with both precipitation data and potential evapotranspiration estimates. The ratio of precipitation to potential evapotranspiration (P/ETP) was derived. This ratio gave an indication of the relative balance between water availability and evaporative losses in the region. This metric provided a relevant framework for understanding the hydrological stress on dam reservoirs, especially in semi-arid regions like Tunisia. The observation period considered in this study was from January 1983 to December 2023. Figure 2 shows the locations of the dams analyzed in this study. Each dam is labeled with a number corresponding to its geographical coordinates.
The Figure 2 reveals a certain clustering of dams. In fact, the construction of these dams was driven by a broader policy aimed at mobilizing resources to combat drought, protect against flooding, and generate wealth through irrigated perimeters [9]. Consequently, this clustering formed based on the constraints imposed by these objectives, namely rainfall patterns and hydraulic/agricultural conditions. Subsequently, interconnections emerged to address increasing agricultural or demographic demands. This is why a significant proportion of these dams are located in the far north due to higher rainfall, while others are dispersed to serve plains or provide flood protection. This type of grouping can be characterized as anthropogenic. However, what insights might the ANOVA classification offer regarding this clustering?

2.2. Method

Analysis of variance (ANOVA) is often compared to non-parametric tests such as the Kruskal–Wallis test or the Mann–Whitney U test, which are recommended when the assumptions of parametric methods are not met. However, non-parametric tests involve the conversion of continuous data into ranks, resulting in a significant loss of information [33]. This limitation reduces their ability to detect subtle differences between groups.
Regarding normality, Norman [34] and Blanca et al. [35] provide evidence on the robustness of ANOVA to violations of the normality assumption. Norman [34] showed that parametric tests such as ANOVA are robust even in the presence of moderate to severe deviations from normality, including with small sample sizes. This robustness is explained by ANOVA’s reliance on the distribution of means rather than raw data, a property ensured by the Central Limit Theorem [35], which confirmed these findings through a Monte Carlo simulation study involving 1308 conditions. Their results showed that ANOVA adequately controlled Type I error rates in all studied scenarios, regardless of the degree of deviation from normality, sample size equality or inequality, or the shape of the distributions. These findings suggest that ANOVA can be reliably applied even when data exhibit substantial skewness or significant departures from normality.
Therefore, ANOVA followed by Duncan’s test (parametric) was used even in the presence of assumption violations to compare with the Kruskal–Wallis test (non-parametric). This dual approach strengthened the justification for the expected classification and quantified the impact of assumption violations on the choice of method.
This entire work was developed in an open source environment to facilitate the implementation of FAIR (findable, accessible, interoperable, and reusable) principles [36]. RStudio was used for all data processing [37]. Statistical tests and ANOVA classification were performed using the Agricolae package [38]. Graphics, tables, and maps were successfully processed using ggplot2 [39], gt [40], and QGIS [41], all in the Quarto environment [42].

3. Results and Discussion

3.1. The Main Descriptive Statistics of the Data

The dataset consisted of 35 groups, corresponding to the names of the dams, each consisting of 504 monthly observations from January 1983 to December 2023 (a total of 12,600 observations).
Table 1 presents the main statistical characteristics, namely: minimum (Min); mean; standard deviation (SD); and maximum (Max). Figure 3 also shows, in the same graph, the boxplot representing the distribution of the parameters analyzed here (P, PET, and P/PET).
Table 1 and Figure 3 highlight the irregularity, variability, and dispersion of the parameters P (precipitation) and P/E (precipitation to potential evapotranspiration ratio). The standard deviations and means are very close, a characteristic commonly observed in semi-arid regions of Tunisia. In such areas, months like August and September can be entirely dry, yet occasionally experience significant or even maximal rainfall. This may be considered an anomaly or extreme from a statistical point of view, but it is a specific hydrological feature of the region. This particularity poses an ongoing challenge for water resource management in Tunisia [43].
Regarding the P/PET ratio, although the corresponding observations exhibit numerous extreme values similar to those for P and PET, the box plot indicates that most values remained below the 100% threshold, often falling as low as 50%. This highlights the deficit of precipitation relative to potential evapotranspiration, reflecting the arid climatic conditions and the water stress of the region.

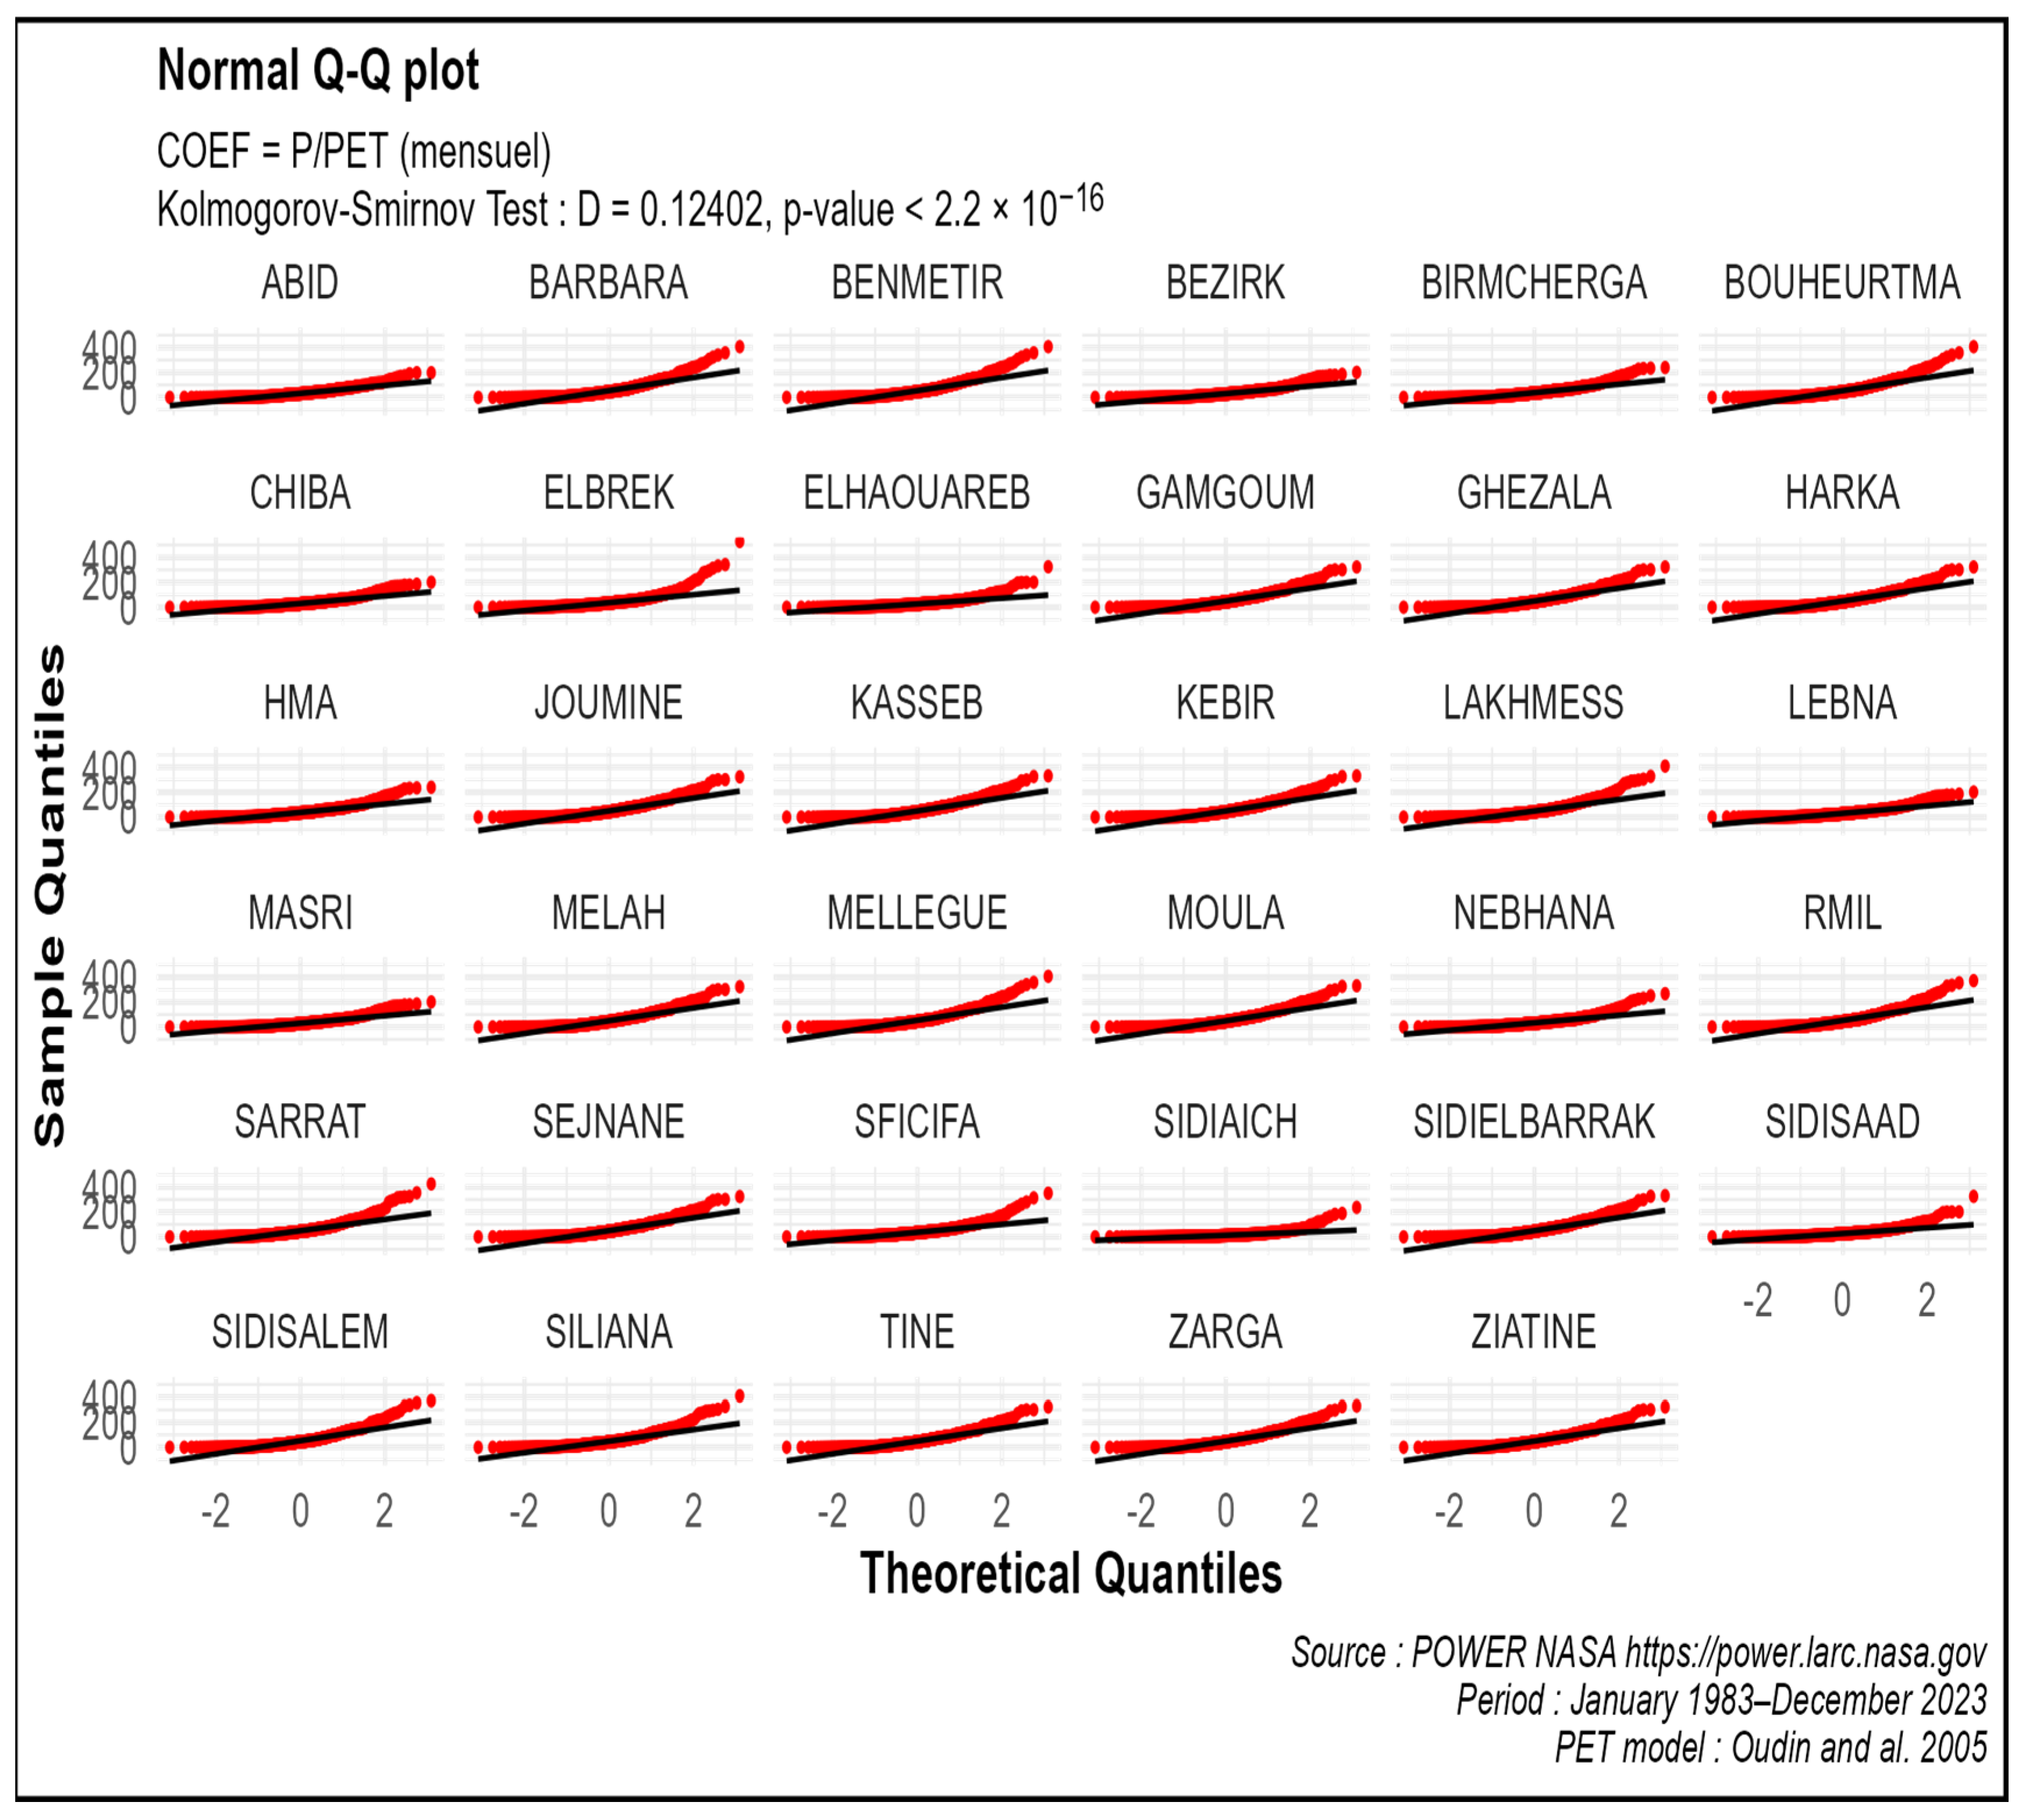
3.2. Normality Assumptions

Figure 4 shows all plots of theoretical quantiles and quantiles relative to the coefficient (P/PET) for each group (Dams). The KolmogorovSmirnov test was applied to the whole sample. The p-value was very low (less than 2.2 × 10⁻¹⁶), rejecting the normality hypothesis. In addition, these graphs show a shift with respect to the theoretical curves. Consequently, the sample adopted here of P/PET values for each dam was considered to be non-normal.

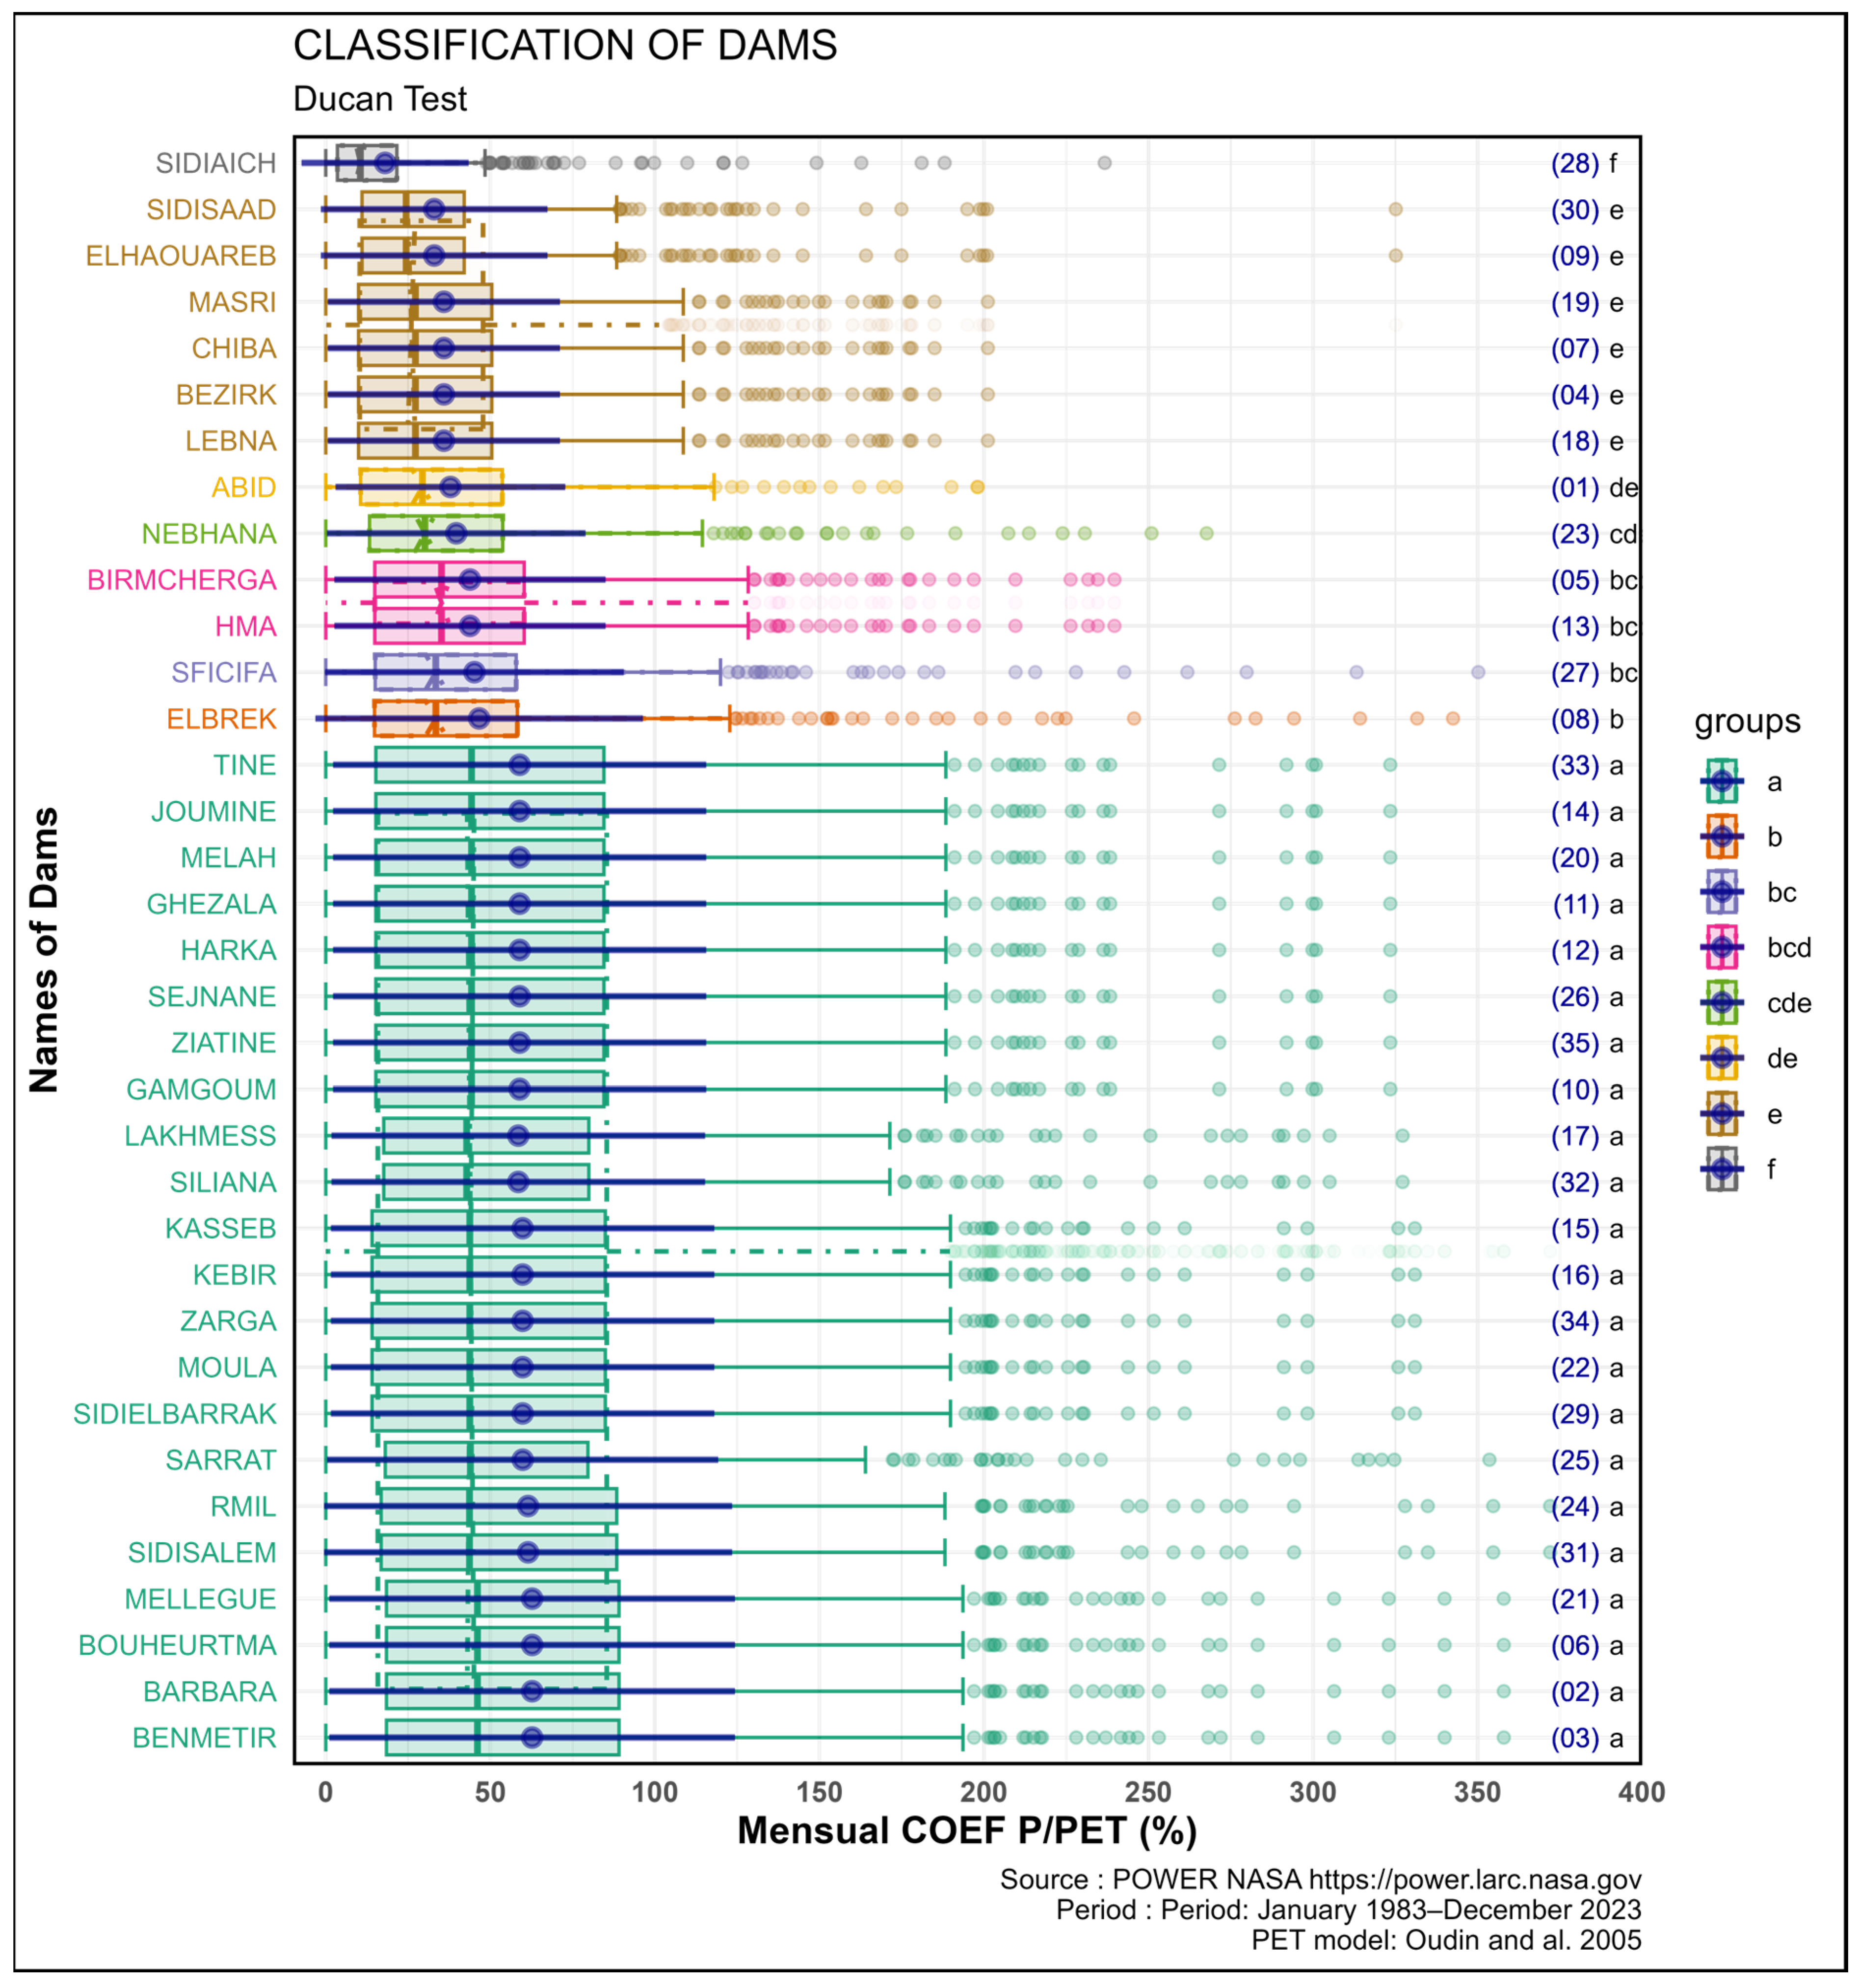
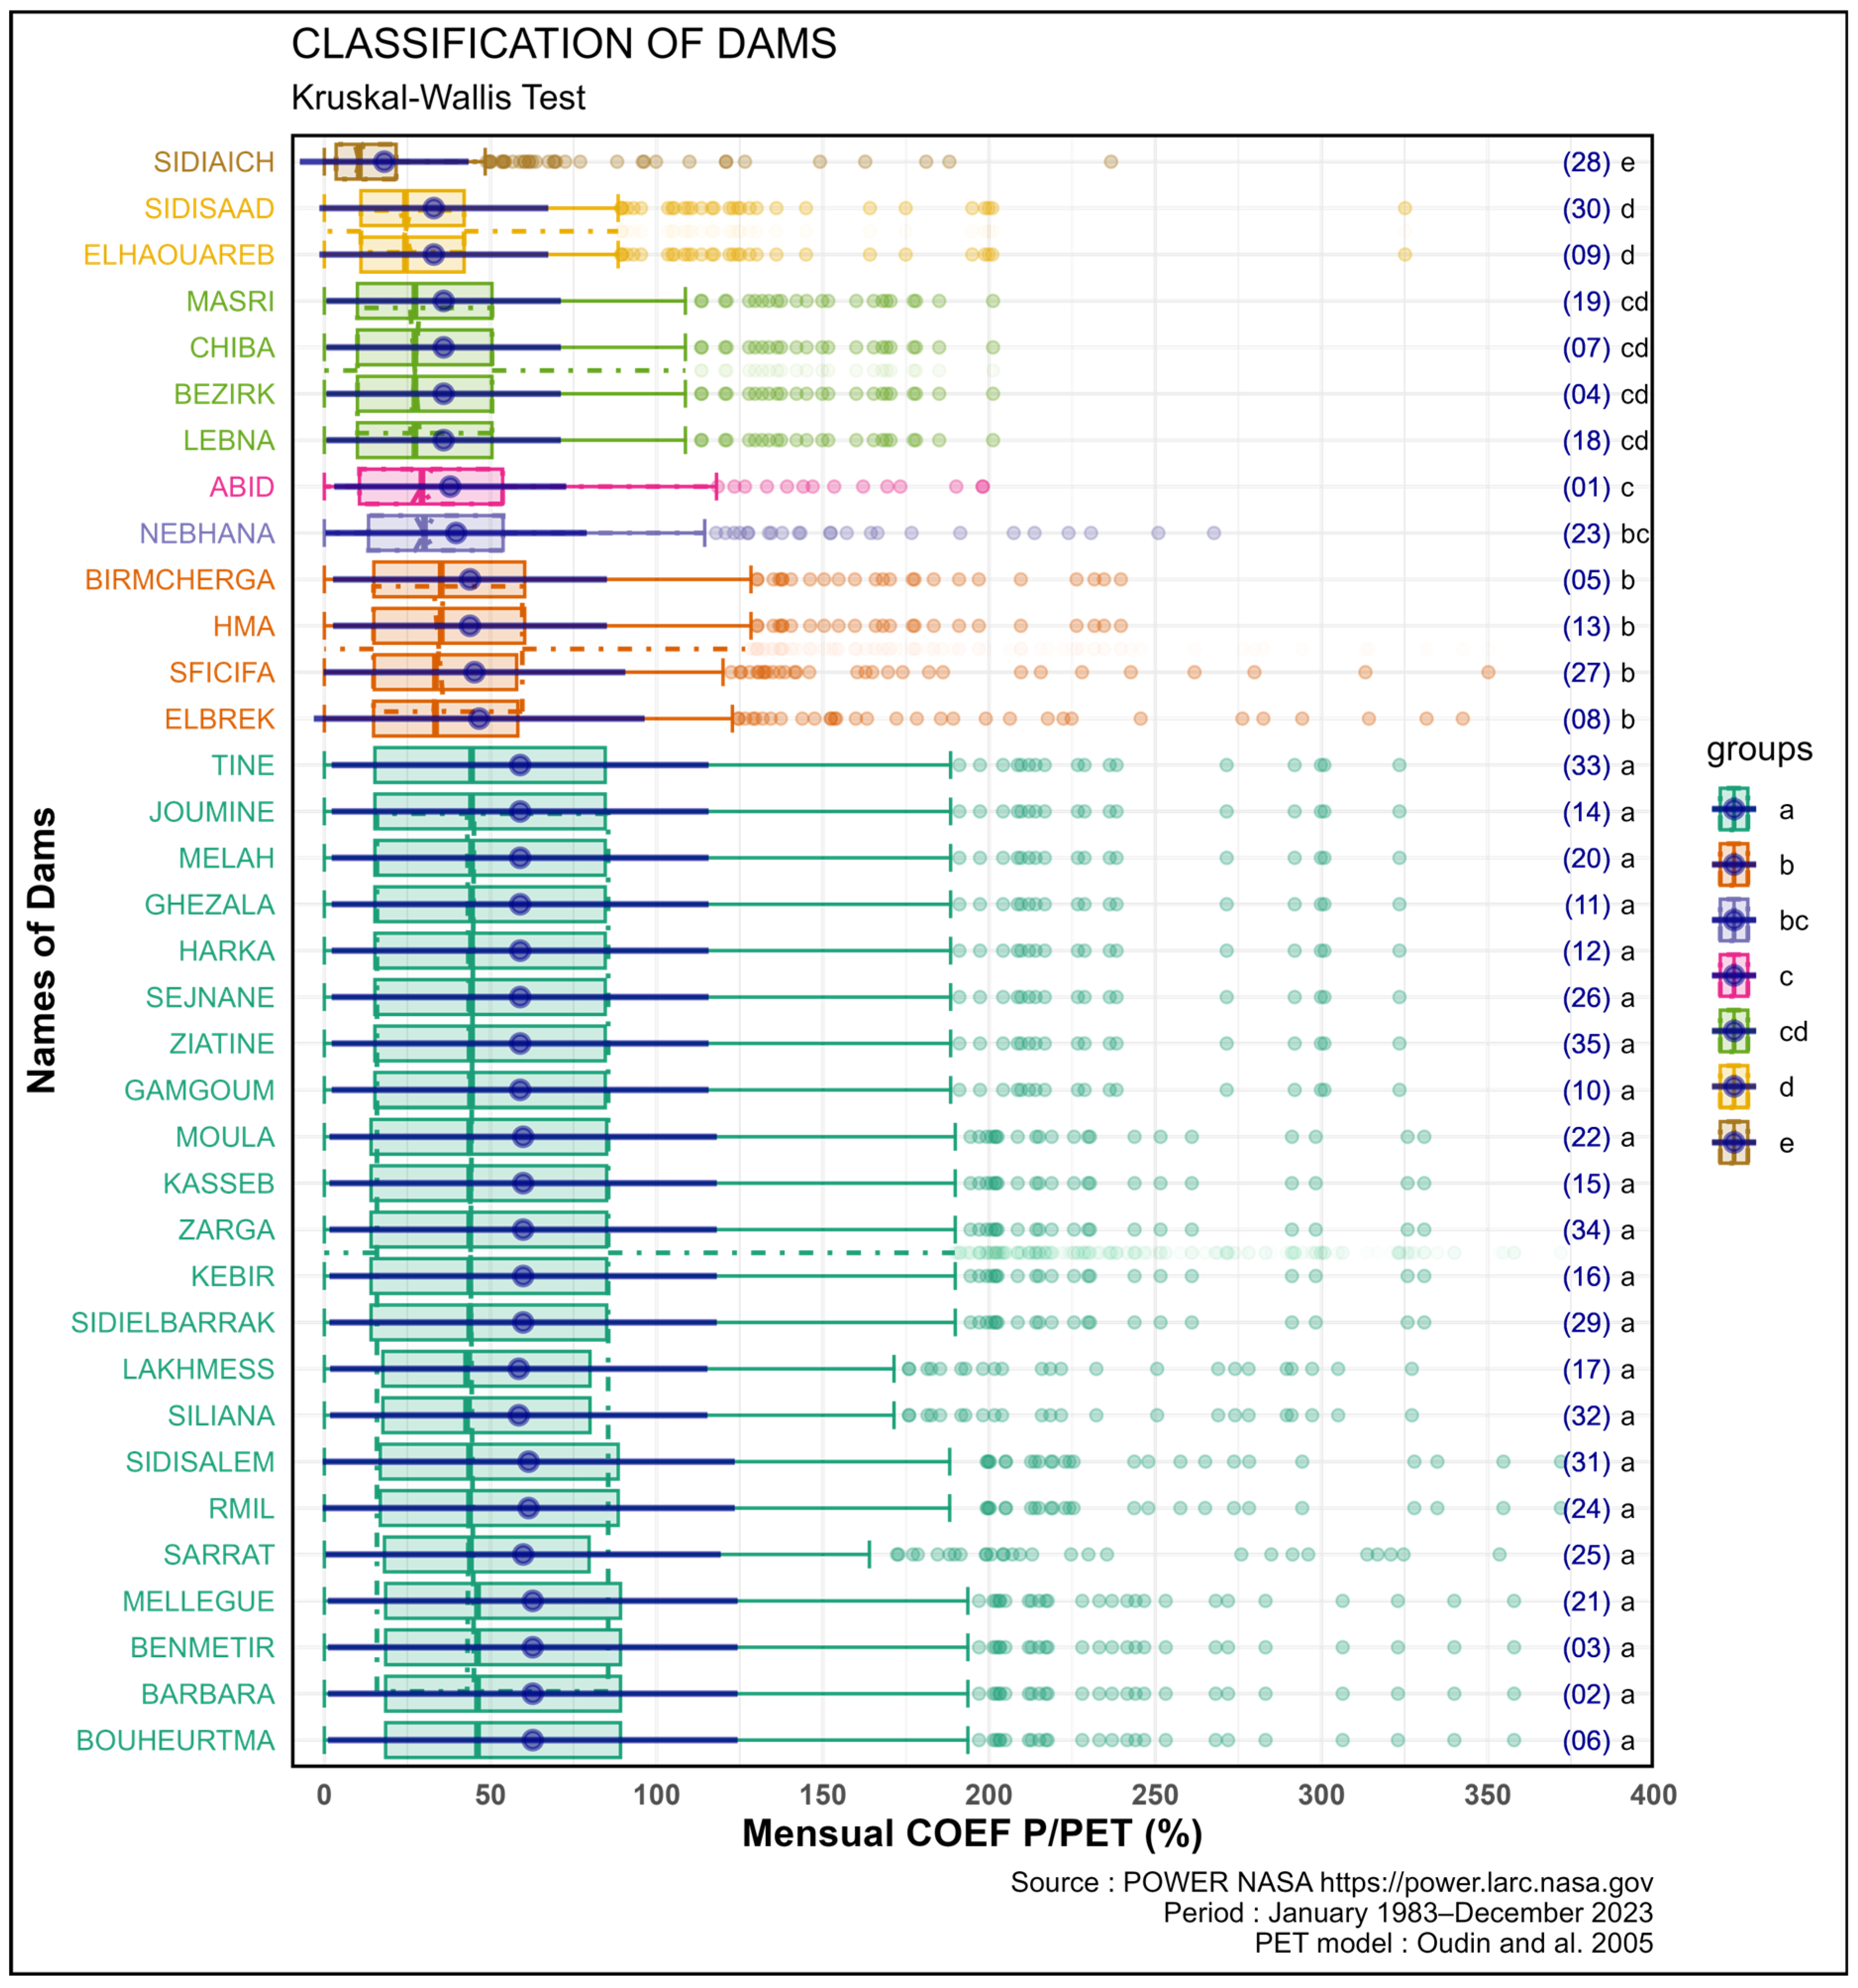
3.3. Classification Test

Duncan’s test (Figure 5) was used to determine the degree of the violation of the normality assumption in a parametric classification test. This was achieved by comparing its performance with that of the Kruskal–Wallis test (Figure 6), with the latter having previously been used for non-normal samples.
As shown in Figure 5 and Figure 6, the ordinate axis indicates the nomenclature of the dams, which are categorized according to the classes derived from each test (Kruskal–Wallis and Duncan’s tests). Each class is distinguished by a distinct color. The abscissa axis represents the coefficient related to the P/PET ratio, expressed monthly and as a percentage. Each figure is accompanied by a box plot for each dam, together with an error bar plot, with a blue point representing the mean and a blue line segment representing the standard deviation (SD). Each box plot is assigned a color corresponding to the post-test classes. Numbers (1) to (35) denote those assigned to each dam (Figure 2). Each group is identified by one or more lower-case letters.
Figure 5 and Figure 6 show a similarity in the classes identified using ANOVA followed by Duncan’s test (eight classes: a, b, bc, bcd, cde, de, e, and f) and a Kruskal–Wallis test (seven classes: a, b, bc, c, cd, d, and e). Class a includes 22 dams {(03), (02), (09), (06), (21), (31), (24), (25), (29), (22), (34), (16), (15), (32), (17), (10), (35), (26), (12), (11), (20), (14), (33)} and is consistent across both tests. These dams are located in the Northwest of Tunisia, and encompass the two watersheds of the extreme north and the Medjerda, which is the primary watershed in Tunisia. The entire water transfer system in Tunisia relies on these two watersheds. Given this classification, they should be considered as a single hydraulic basin.
The final class for each test, namely class f for Duncan’s test and class e for the Kruskal–Wallis test, corresponds exclusively to the SIDIAICH dam (28). This dam is located in an arid environment characterized by extremely high evaporation demand, resulting in a low P/PET ratio. It was built primarily for flood protection purposes. Consequently, this system should not be relied upon as a primary source of water supply. Instead, it would be more beneficial to use it for groundwater recharge to mitigate evaporation losses.
An intermediate class, comprising only the NEBHANA dam (23), was identified in both tests, specifically class cde for Duncan’s test and class bc for the Kruskal–Wallis test. This dam is located in the central plains of Tunisia and is characterized by a semi-arid climate. It was originally built for flood control. Over time, however, it has become the main supplier of water resources for the established irrigated perimeters downstream and also serves as a source for drinking water supply to coastal regions. It is considered and managed as an independent system.
It is noteworthy that, for both tests, subclasses are represented by more than one lower-case letter. For example, class bcd in Duncan’s test could be considered intermediate between classes b, c, and d. Similarly, class cd in the Kruskal–Wallis test is intermediate between classes c and d. Duncan’s test appears to be more precise because it is based on means, whereas the Kruskal–Wallis test relies on ranks. This explains why Duncan’s test produces a greater number of classes and subclasses than to the Kruskal–Wallis test.
Notwithstanding the non-compliance with the assumption of normal distribution, the analysis of variance (ANOVA) followed by Duncan’s test remains relevant in the present context, as demonstrated by the above considerations. This finding is consistent with the conclusions of Blanca et al. (2017) [35] and Norman (2010) [34], as mentioned in Section 2.2. It is worth noting that the robustness of the ANOVA test is maintained even in circumstances where normality assumption is not met.
In light of the above points and on the basis on Figure 5 and Figure 6, it is proposed to adopt four classes:
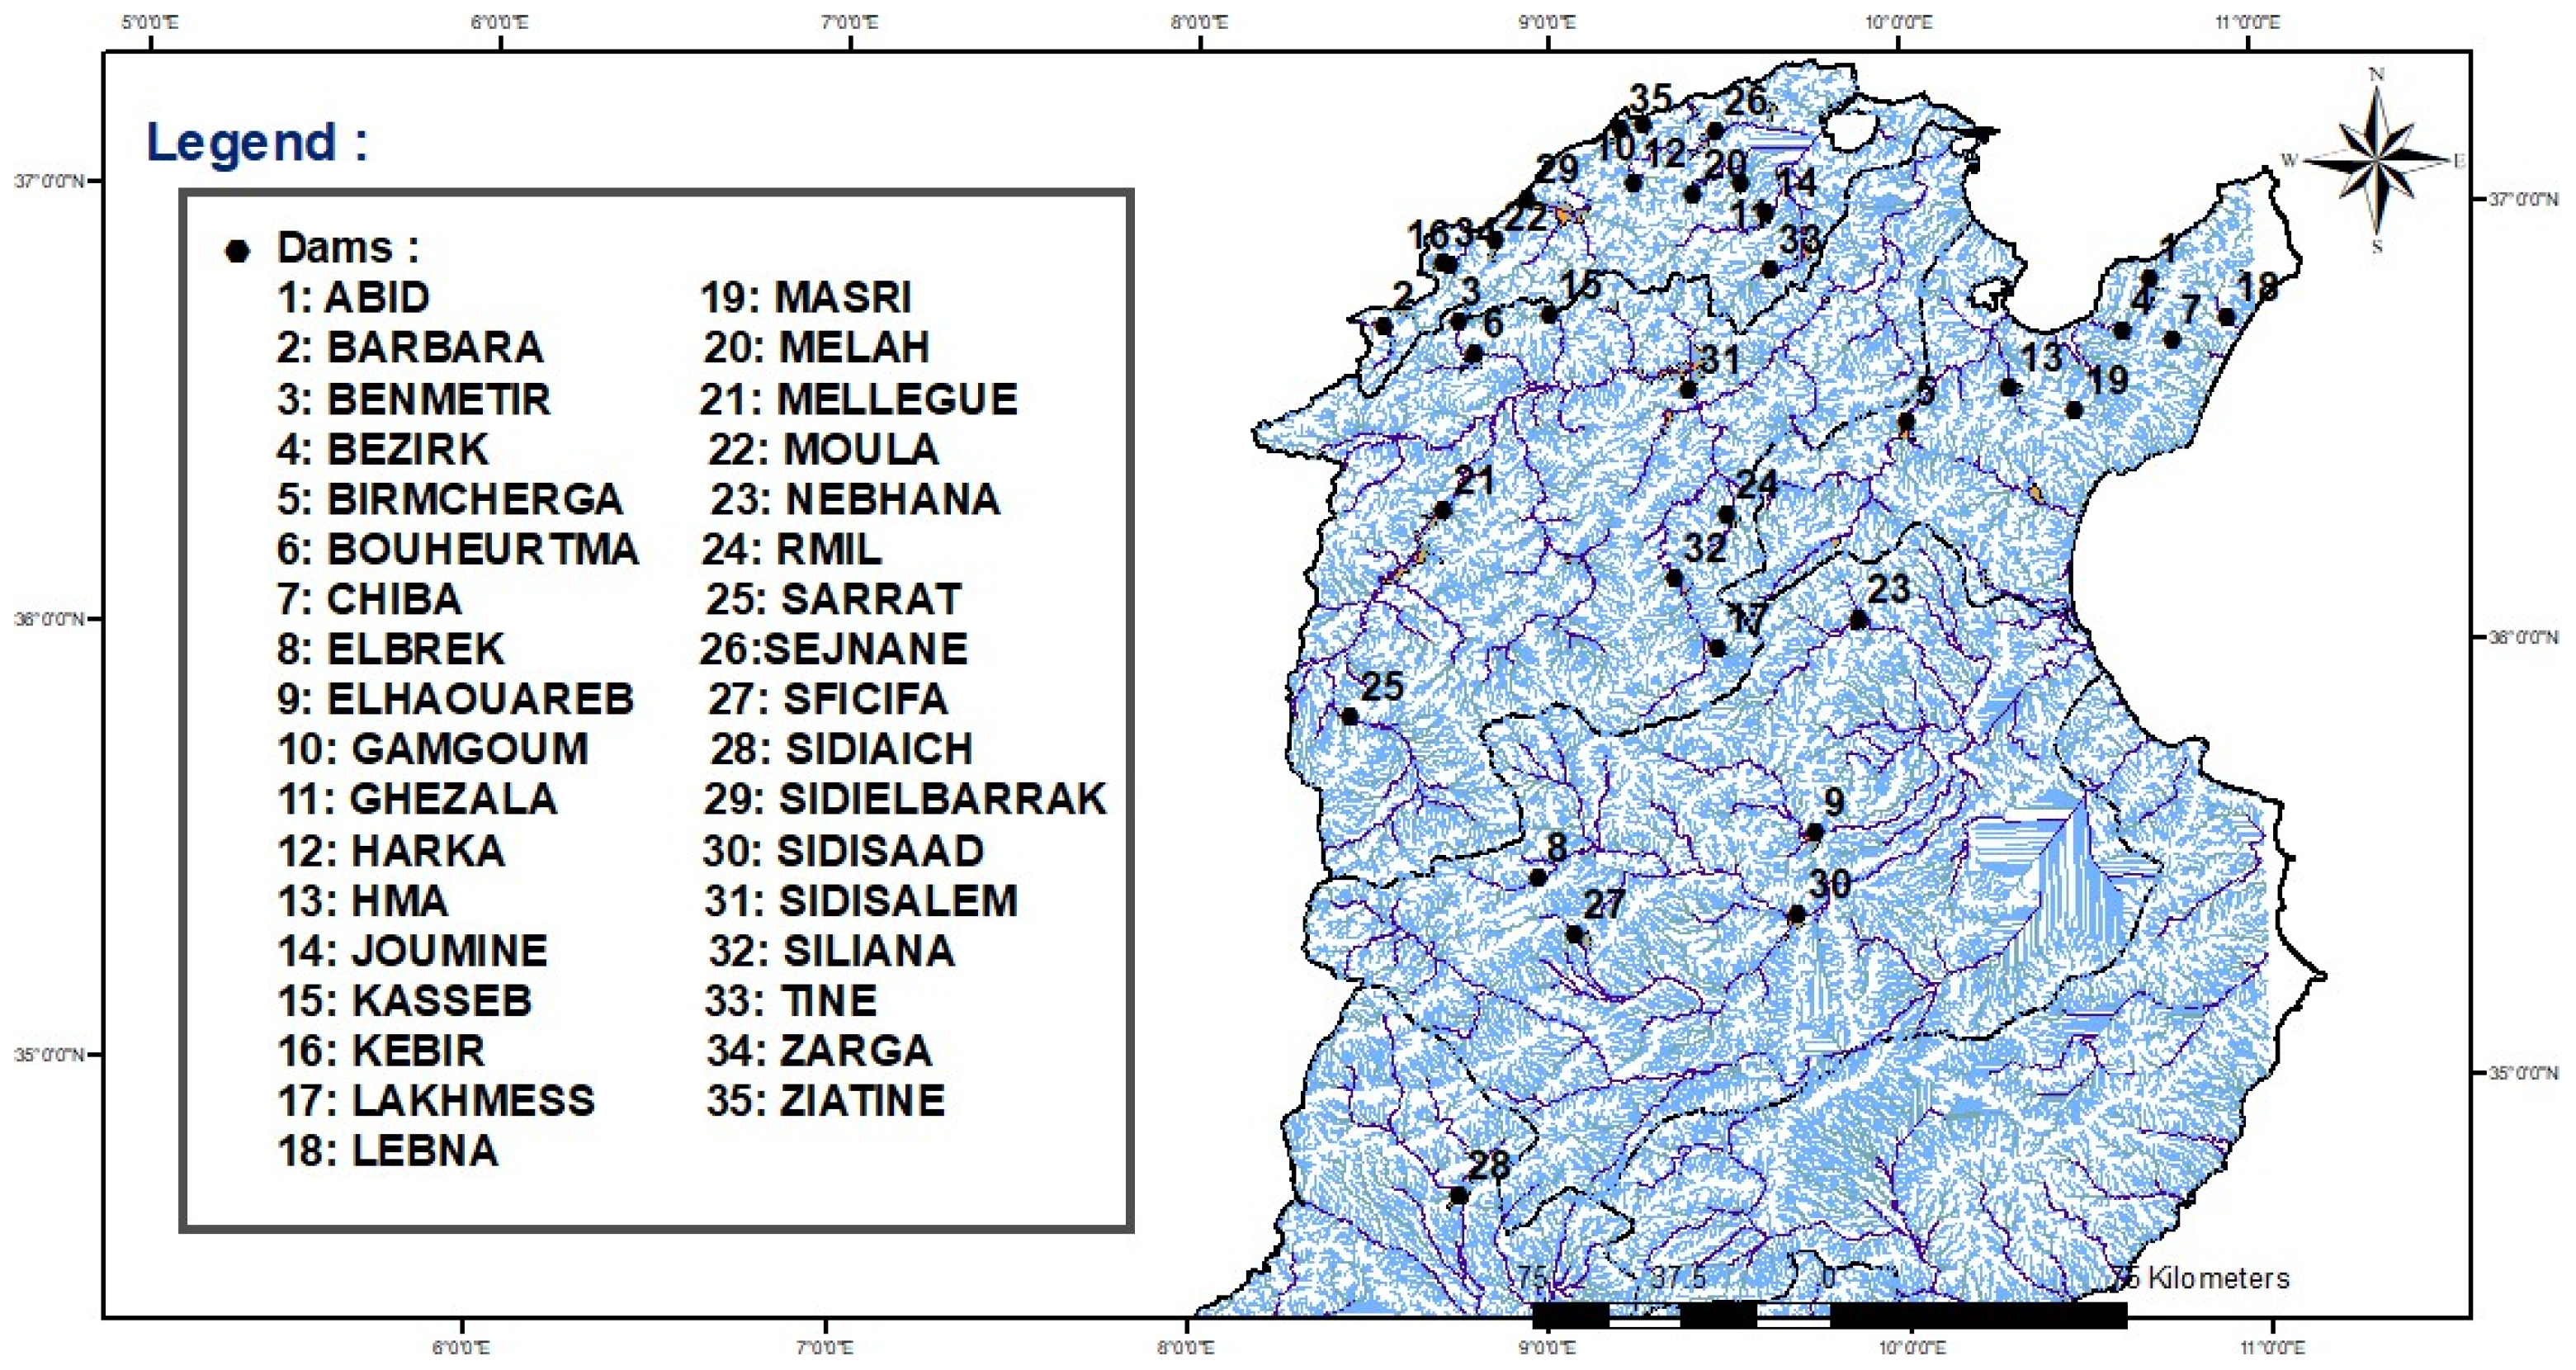
  • Class 1 corresponds to group a of both the Kruskal–Wallis and Duncan’s tests. This class includes the dams {(03), (02), (09), (06), (21), (31), (24), (25), (29), (22), (34), (16), (15), (32), (17), (10), (35), (26), (12), (11), (20), (14), (33)}. These dams are located in the extreme northern watershed and the Medjerda watershed, which together form the “water tower” of Tunisia. They should be considered as a single hydraulic basin, as this basin serves as the primary source for potential water transfers. Furthermore, when updating the agricultural map, it is essential to avoid adopting crops that could be cultivated locally (within the hydraulic basin), and instead produce them elsewhere using transferred water resources.
  • Class 2: This class includes the dams {(08), (27), (13), (05)}. They are located along the Tunisian Ridge, a natural barrier separating semi-arid regions from sub-humid regions.
  • Class 3: This class comprises the dams {(01), (18), (04), (07), (19), (09), (30)}. This group of dams is located in the areas adjacent the Tunisian Ridge. These regions are agriculturally intensive, with significant pressure on water resources, often requiring careful allocation between drinking water and irrigation needs.
  • Class 4: Dams treated as unique systems. Two systems are identified: {(23)} and {(28)}.
This classification made it possible to distinguish different groups of dams based on the ratio of precipitation (P) and potential evapotranspiration (PET). However, it would be more useful to complement this ratio with a variable characterizing the hydrological inflows to the dams. Such a variable could include the monthly inflow, the runoff coefficient, or the watershed response time. This approach would facilitate the development of a classification that integrated both climatic and watershed variables.

4. Conclusions

The present study applied the analysis of variance (ANOVA) technique to classify the main Tunisian dams based on the hydroclimatic variables, precipitation (P) and evapotranspiration (PET), using the ratio (P/PET). The dataset was constructed using the NASA POWER project platform. The model employed for estimating potential evapotranspiration was that of Oudin (2004a) [24]. The resulting database consisted of 35 groups, each corresponding to one dam, and each group containing 504 monthly observations, a total of 12,600 observations. Subsequent data analysis revealed significant spatiotemporal variability in the (P/PET) ratio, with standard deviations and means very close to each other.
The results demonstrated that, despite violating the normality assumption, the ANOVA test remains a robust tool for dam classification, in the line with the conclusions of Blanca et al. (2017) and Norman (2010) [34,35]. A comparison between Duncan’s test (parametric) and the Kruskal–Wallis test (non-parametric) showed similarities in the identified classes, although Duncan’s test provided a more accurate classification due to its use of means rather than ranks.
The proposal for four primary dam classes was driven by the recognition of regional differences in water availability and evaporation demand. The classes include dams in northwestern Tunisia, which has been designated as the country’s “water tower”, as well as dams in semi-arid and arid regions. This classification provides a solid basis for water resource management, particularly for optimizing irrigation and agricultural planning.
Dams located in regions characterized by low P/PET values are more vulnerable to hydrological stress due to higher atmospheric demand relative to water input. This suggests the need for adaptive management strategies, including optimized reservoir operation, improved water allocation planning, and the implementation of measures to reduce evaporative losses. Furthermore, this classification framework can serve as a decision support tool for prioritizing investments in dam safety, especially under conditions of increasing climate variability and prolonged drought. These findings contribute to a better understanding of the spatial variability in hydrological constraints across Tunisia and provide guidance for the development of more resilient and sustainable water management policies.
However, for a more comprehensive classification, it would be relevant to include additional variables, such as monthly hydrological inflows or runoff coefficients, to better characterize the watersheds. Such an approach would enable the development of a more tailored water management strategy to meet the challenges posed by climate change and hydroclimatic variability.

Author Contributions

Conceptualization, S.M. and S.K.; methodology, S.M. and S.K.; software, S.M.; validation, S.M., S.K. and S.B.M.; formal analysis, S.M. and S.K.; investigation, S.M.; resources, S.M. and S.K.; data curation, S.M. and S.K.; writing—original draft preparation, S.M.; writing—review and editing, S.M., S.K., S.B.M. and N.Z.; visualization, S.M., S.B.M. and N.Z.; supervision, S.K.; project administration, S.M.; funding acquisition, S.K. All authors have read and agreed to the published version of the manuscript.

Funding

This research received no external funding.

Data Availability Statement

The data supporting the findings of this research are available in the manuscript.

Conflicts of Interest

The authors declare no conflict of interest.

References

  1. Ben Boubaker, H.; Benzarti, Z.; Hénia, L. Tunisia’s water resources: Climate constraints and human pressure. In Eau et Environnement: Tunisie et Milieux Méditerranéens; Arnould, P., Hotyat, M., Eds.; Sociétés, Espaces, Temps; ENS Éditions: Lyon, France, 2003; pp. 37–52. ISBN 978-2-84788-422-7. [Google Scholar]
  2. Cherif, A. Tunisia’s water issue in north-eastern regions: The need, local resources, and inter-regional transfers. In Eau et Environnement: Tunisie et Milieux Méditerranéens; Arnould, P., Hotyat, M., Eds.; Sociétés, Espaces, Temps; ENS Éditions: Lyon, France, 2003; pp. 53–61. ISBN 978-2-84788-422-7. [Google Scholar]
  3. FAO. Country Profile—Tunisia; Food and Agriculture Organization of the United Nations: Rome, Italy, 2015; p. 20. [Google Scholar]
  4. Falkenmark, M.; Naturvetenskapliga, F. The Massive Water Scarcity Now Threatening Africa—Why Isn’t It Being Addressed? Ambio 1989, 18, 112–118. [Google Scholar]
  5. Caretta, M.A.; Mukherji, A.; Arfanuzzaman, M.; Betts, R.A.; Gelfan, A.; Hirabayashi, Y.; Lissner, T.K.; Liu, J.; Lopez Gunn, E.; Morgan, R.; et al. Water. In Climate Change 2022: Impacts, Adaptation and Vulnerability. Contribution of Working Group II to the Sixth Assessment Report of the Intergovernmental Panel on Climate Change; Pörtner, H.-O., Roberts, D.C., Tignor, M., Poloczanska, E.S., Mintenbeck, K., Alegría, A., Craig, M., Langsdorf, S., Löschke, S., Möller, V., et al., Eds.; Cambridge University Press: Cambridge, UK; New York, NY, USA, 2022; pp. 551–712. [Google Scholar]
  6. Tramblay, Y.; Koutroulis, A.; Samaniego, L.; Vicente-Serrano, S.M.; Volaire, F.; Boone, A.; Le Page, M.; Llasat, M.C.; Albergel, C.; Burak, S.; et al. Challenges for Drought Assessment in the Mediterranean Region under Future Climate Scenarios. Earth-Sci. Rev. 2020, 210, 103348. [Google Scholar] [CrossRef]
  7. Tramblay, Y.; Llasat, M.C.; Randin, C.; Coppola, E. Climate Change Impacts on Water Resources in the Mediterranean. Reg. Environ. Change 2020, 20, 83. [Google Scholar] [CrossRef]
  8. Treguer, D.; Verner, D.; Redwood, J.; Christensen, J.; McDonnell, R.; Elbert, C.; Konishi, Y.; Belghazi, S. Climate Variability, Drought, and Drought Management in Morocco’s Agricultural Sector; World Bank: Washington, DC, USA, 2018. [Google Scholar]
  9. Horchani, A. Water in Tunisia: A National Perspective 2007. In Agricultural Water Management: Proceedings of a Workshop in Tunisia; The National Academies Press: Washington, DC, USA, 2007. [Google Scholar]
  10. Ministry of Agriculture, Water Resources and Fisheries, Bureau of Planning and Water Balance. Development of the Vision and Strategy for the Water Sector in Tunisia by 2050; STUDI International: Tunis, Republic of Tunisia; KfW: Frankfurt, Germany; GIZ: Tunis, Republic of Tunisia; African Development Bank: Abidjan, Côte d’Ivoire, 2022. Available online: http://www.onagri.nat.tn/uploads/secteur-eau/1.pdf (accessed on 15 September 2024).
  11. Wilks, D.S. Statistical Methods in the Atmospheric Sciences, 4th ed.; Elsevier: Amsterdam, The Netherlands, 2019; ISBN 978-0-12-815823-4. [Google Scholar]
  12. Smida, H.; Abdellaoui, C.; Zairi, M.; Dhia, H.B. Mapping of Areas Vulnerable to Agricultural Pollution Using the DRASTIC Method Coupled with a Geographic Information System (GIS): Case of the Chaffar Aquifer (Southeastern Tunisia). Sci. Chang. Planétaires/Sécheresse 2010, 21, 131–146. [Google Scholar]
  13. Anis, Z.; Wissem, G.; Vali, G.; Smida, H.; Essghaier, G.M. GIS-Based Landslide Susceptibility Mapping Using Bivariate Statistical Methods in North-Western Tunisia. Open Geosci. 2019, 11, 708–726. [Google Scholar] [CrossRef]
  14. Trabelsi, R.; Zaïri, M.; Smida, H.; Dhia, H.B. Coastal Aquifer Salinization: Case of the Northern Sahel Aquifer of Sfax, Tunisia. Comptes Rendus Geosci. 2005, 337, 515–524. [Google Scholar] [CrossRef]
  15. Fisher, R.A. The Correlation between Relatives on the Supposition of Mendelian Inheritance. Earth Environ. Sci. Trans. R. Soc. Edinb. 1919, 52, 399–433. [Google Scholar] [CrossRef]
  16. Fisher, R.A. Studies in Crop Variation. I. An Examination of the Yield of Dressed Grain from Broadbalk. J. Agric. Sci. 1921, 11, 107–135. [Google Scholar] [CrossRef]
  17. Scheffé, H. The Analysis of Variance; John Wiley & Sons: Hoboken, NJ, USA, 1956; ISBN 978-0-471-34505-3. [Google Scholar]
  18. Eisenhart, C. The Assumptions Underlying the Analysis of Variance. Biometrics 1947, 3, 1–21. [Google Scholar] [CrossRef]
  19. Lix, L.M.; Keselman, J.C.; Keselman, H.J. Consequences of Assumption Violations Revisited: A Quantitative Review of Alternatives to the One-Way Analysis of Variance “F” Test. Rev. Educ. Res. 1996, 66, 579–619. [Google Scholar] [CrossRef]
  20. Jiang, W.; Liu, J.; Peng, A.; Liu, G.; Zhang, R. Quantifying the Contribution of Uncertainty Sources of Artificial Neural Network Models Using ANOVA for Reservoir Power Generation. Hydrol. Res. 2022, 53, 1455–1467. [Google Scholar] [CrossRef]
  21. Mashauri, F.; Mbuluyo, M.; Nkongolo, N. Influence Des Paramètres Hydro-Morphométriques Sur l’écoulement Des Eaux Des Sous-Bassins Versants de La Tshopo, République Démocratique Du Congo. RIG 2023, 32, 79–98. [Google Scholar] [CrossRef]
  22. Massuel, S.; Séguis, L.; Niel, H.; Cappelaere, B.; Delclaux, F.; Peugeot, C. Typology of watersheds in advance of hydrological modelling of a Sahelian region. In Proceedings of the International Conference “Hydrology of the Mediterranean and Semiarid Regions”, Montperllier, France, 1–4 April 2003; IASH Publication: Wallingford, UK, 2003. [Google Scholar]
  23. Mohammed, A. Application of Anova Statistical Tool for Water Quality Management of Kainji Reservoir. UJET 2017, 3, 9–25. [Google Scholar]
  24. Oudin, L. Search for a Relevant Potential Evapotranspiration Model as Input to a Global Rainfall-Runoff Model. Ph.D. Thesis, ENGREF (AgroParisTech), Paris, France, 2004. [Google Scholar]
  25. NASA POWER|Prediction of Worldwide Energy Resources. Available online: https://power.larc.nasa.gov/ (accessed on 15 April 2025).
  26. Suarez, M.J.; da Silva, A.; Dee, D.; Bloom, S.; Bosilovich, M.; Pawson, S.; Schubert, S.; Wu, M.-L.; Sienkiewicz, M.; Stajner, I. Documentation and Validation of the Goddard Earth Observing System (GEOS) Data Assimilation System, Version 4; 2005. Available online: https://ntrs.nasa.gov/citations/20050175690 (accessed on 15 September 2024).
  27. Reichle, R.H.; Draper, C.S.; Liu, Q.; Girotto, M.; Mahanama, S.P.P.; Koster, R.D.; Lannoy, G.J.M.D. Assessment of MERRA-2 Land Surface Hydrology Estimates. J. Clim. 2017, 30, 2937–2960. [Google Scholar] [CrossRef]
  28. Reichle, R.H.; Liu, Q.; Koster, R.D.; Draper, C.S.; Mahanama, S.P.P.; Partyka, G.S. Land Surface Precipitation in MERRA-2. J. Clim. 2017, 30, 1643–1664. [Google Scholar] [CrossRef]
  29. Abubakar, I.M.; Idi, B.Y. Statistical Analysis of NASA POWER Meteorological Data for the Assessment of Climate Variability in Adamawa State. Environ. Technol. Sci. J. 2024, 15, 119–129. [Google Scholar] [CrossRef]
  30. Oderinde, F.O.; Ayelokun, O.; Oderinde, F.O.; Aiyelokun, O. Decadal and Trend Analysis of Potential Evapotranspiration in Oluyole, LGA, Oyo State Nigeria. J. Meteorol. Clim. Sci. 2021, 19, 1–9. [Google Scholar]
  31. Mouelhi, S.; Madani, K.; Lebdi, F. A Structural Overview through GR(s) Models Characteristics for Better Yearly Runoff Simulation. Open J. Mod. Hydrol. 2013, 3, 179–187. [Google Scholar] [CrossRef]
  32. Oudin, L.; Hervieu, F.; Michel, C.; Perrin, C.; Andréassian, V.; Anctil, F.; Loumagne, C. Which Potential Evapotranspiration Input for a Lumped Rainfall–Runoff Model? Part 2—Towards a Simple and Efficient Potential Evapotranspiration Model for Rainfall–Runoff Modelling. J. Hydrol. 2005, 303, 290–306. [Google Scholar] [CrossRef]
  33. Feir-Walsh, B.J.; Toothaker, L.E. An Empirical Comparison of the ANOVA F-Test, Normal Scores Test and Kruskal-Wallis Test under Violation of Assumptions. Educ. Psychol. Meas. 1974, 34, 789–799. [Google Scholar] [CrossRef]
  34. Norman, G. Likert Scales, Levels of Measurement and the “Laws” of Statistics. Adv. Health Sci. Educ. Theory Pract. 2010, 15, 625–632. [Google Scholar] [CrossRef] [PubMed]
  35. Blanca, M.J.; Alarcón, R.; Arnau, J.; Bono, R.; Bendayan, R. Non-Normal Data: Is ANOVA Still a Valid Option? Psicothema 2017, 29, 552–557. [Google Scholar] [CrossRef] [PubMed]
  36. Wilkinson, M.D.; Dumontier, M.; Aalbersberg, I.J.; Appleton, G.; Axton, M.; Baak, A.; Blomberg, N.; Boiten, J.-W.; da Silva Santos, L.B.; Bourne, P.E.; et al. The FAIR Guiding Principles for Scientific Data Management and Stewardship. Sci. Data 2016, 3, 160018. [Google Scholar] [CrossRef] [PubMed]
  37. RStudio Team. RStudio: Integrated Development Environment for R; RStudio, PBC: Boston, MA, USA, 2024. [Google Scholar]
  38. de Mendiburu, F.; Yaseen, M. Agricolae: Statistical Procedures for Agricultural Research; 2020. Available online: https://cran.r-project.org/web/packages/agricolae/index.html (accessed on 15 September 2024).
  39. Wickham, H. Ggplot2: Elegant Graphics for Data Analysis; Springer: New York, NY, USA, 2016; ISBN 978-3-319-24277-4. [Google Scholar]
  40. Iannone, R.; Cheng, J.; Schloerke, B.; Hughes, E.; Lauer, A.; Seo, J.; Brevoort, K.; Roy, O. Gt: Easily Create Presentation-Ready Display Tables; 2025. Available online: https://gt.rstudio.com (accessed on 15 September 2024).
  41. QGIS Development Team. QGIS Geographic Information System; QGIS Association. Available online: https://www.qgis.org (accessed on 15 September 2024).
  42. Quarto Development Team. Quarto: Open-Source Scientific and Technical Publishing System; Posit Software, PBC: Boston, MA, USA, 2024. [Google Scholar]
  43. Mouelhi, S.; Saida, N.; Sihem, J.; Mohamed, S.; Mouelhi, S.; Nemri, S.; Jebari, S.; Slimani, M. Using the Markov Chain for the Generation of Monthly Rainfall Series in a Semi-Arid Zone. Open J. Mod. Hydrol. 2016, 6, 51–65. [Google Scholar] [CrossRef]
Figure 1. Process’s computing (PET: Ludovic et al., 2004) [24].
Hydrology 12 00096 g001
Figure 2. Locations of dams.
Hydrology 12 00096 g002
Figure 3. Data characterization (Oudin and al. 2005 [32]).
Hydrology 12 00096 g003
Figure 4. Normality assumption for P/PET coefficients Oudin and al. 2005 [32]).
Hydrology 12 00096 g004
Figure 5. Duncan’s classification test Oudin and al. 2005 [32]).
Hydrology 12 00096 g005
Figure 6. Kruskal–Wallis classification test Oudin and al. 2005 [32]).
Hydrology 12 00096 g006
Table 1. Main descriptive statistics.
NAMES OF DAMSPPETCOEF = P/PET
MinMeanSDMaxMinMeanSDMaxMinMeanSDMax
ABID03833200681102315703835198
BARBARA05242258491023016506363407
BENMETIR05242258491023016506363407
BEZIRK03533198641092616103635201
BIRMCHERGA04033170551073016904441240
BOUHEURTMA05242258491023016506363407
CHIBA03533198641092616103635201
ELBREK0363227337933316004854528
ELHAOUAREB03229231561103217403334325
GAMGOUM05242221581052716305957323
GHEZALA05242221581052716305957323
HARKA05242221581052716305957323
HMA04033170551073016904441240
JOUMINE05242221581052716305957323
KASSEB05446230621062415806058331
KEBIR05446230621062415806058331
LAKHMESS0463723343973116205959410
LEBNA03533198641092616103635201
MASRI03533198641092616103635201
MELAH05242221581052716305957323
MELLEGUE05242258491023016506363407
MOULA05446230621062415806058331
NEBHANA03731189541073017004039268
RMIL05041237501023016506162372
SARRAT0473723541973216206162426
SEJNANE05242221581052716305957323
SFICIFA03831213451013216704545350
SIDIAICH01618152511083517301825237
SIDIELBARRAK05446230621062415806058331
SIDISAAD03229231561103217403334325
SIDISALEM05041237501023016506162372
SILIANA0463723343973116205959410
TINE05242221581052716305957323
ZARGA05446230621062415806058331
ZIATINE05242221581052716305957323
Source: https://power.larc.nasa.gov/ (accessed on 15 September 2024). Period: January 1983–December 2023. PET model: Oudin et al. (2005) [32].
Disclaimer/Publisher’s Note: The statements, opinions and data contained in all publications are solely those of the individual author(s) and contributor(s) and not of MDPI and/or the editor(s). MDPI and/or the editor(s) disclaim responsibility for any injury to people or property resulting from any ideas, methods, instructions or products referred to in the content.

