Abstract
Accurately determining the hydraulic properties of soilless growing media is essential for optimizing water management in container-based horticulture and agriculture. The very rapid estimation of hydraulic properties using a Mini Disk Infiltrometer has great potential for practical use compared to the very time-consuming standard methods. The objectives of this study were (1) to calibrate simulated cumulative stepwise infiltration under different suctions with the measured data from Mini Disk Infiltrometer, (2) to evaluate the efficiency of the Hydrus-2D inverse model to predict water dynamics through substrates, (3) to compare the substrate hydraulic parameters obtained through the numerical inversion model to those obtained via laboratory methods, and (4) to provide recommendations on how to effectively use the MDI-based method for practical applications. This study employs numerical inversion of Mini Disk Infiltrometer (MDI) data to estimate the hydraulic parameters of three different growing media, namely white peat, thermally treated wood fibre (WF4), and Seedling substrate. Infiltration experiments were conducted under suction-controlled conditions using varying initial moisture contents, followed by numerical simulations using the Hydrus-2D model and the Van Genuchten equation to describe the hydraulic parameters. The results demonstrated strong agreement between observed and simulated infiltration data, particularly under moistened conditions, with high R2 > 0.9 values indicating the model’s effectiveness. However, discrepancies were observed for substrates in their initial dry state, suggesting limitations in capturing early-stage infiltration dynamics. The findings highlighted the potential of numerical inversion methods for estimating substrate hydraulic properties but also revealed the need for methodological refinements. Modifying the Van Genuchten model or exploring alternative approaches such as the Brooks and Corey model may enhance accuracy. Extending the suction range of measurement techniques is also recommended to improve parameter estimation. This study provides important evidence that the inverse method based on MDI is an effective tool for rapidly determining the hydraulic functions of substrates, which are important in promoting sustainable horticultural practices. Future research should focus on refining parameter estimation methods and addressing model limitations to enhance the reliability of hydraulic property assessments in soilless growing media.
1. Introduction
Soilless cultivation methods for plants have gained significant traction in recent years due to the pressing necessity to ensure a secure food supply for an expanding global population. This phenomenon is especially noticeable in developing arid and semiarid areas. Moreover, there is a rising demand within the industrial sector for premium, seasonal fruits, vegetables, and ornamental plants [1]. To enhance the sustainability of their operations, many speciality crop growers of vegetables, woody ornamental plants, small fruits, and fruit trees are transitioning to container-based production [2]. These significant transformations in various sectors have been demonstrated through extensive research to alleviate the burdens associated with transportation logistics [3], mitigate the presence of harmful pathogens that pose risks to plant health [4], promote the conservation of essential resources that are vital for sustainable development [5], and effectively diminish the volume of agricultural and industrial waste products that can harm regional ecosystems. When compared to conventional cultivation techniques, containerized production might therefore provide better environmental stewardship and plant health [6]. Nevertheless, poor management and supervision of containerized substrate can have negative effects on crop productivity, resulting in major issues like excessive water resource depletion and the harmful loss of vital nutrients that can seep into nearby water bodies and harm the environment. Thus, it is imperative to guarantee that the growing media used in these systems have hydraulic properties optimized for efficient water retention and drainage to address and mitigate these urgent concerns. This emphasizes the need to develop thorough and reliable methods for precisely characterizing the different substrates used in containerized production systems [7].
Characteristics of soilless substrates have been determined using the standard methods. With these standards, the substrate characteristics are assumed to remain constant over time. The goal of these measurements is to determine if a substrate achieves an acceptable water and air balance shortly after irrigation or water flux [8]. Nonetheless, static analysis overlooks crucial dynamic properties, like unsaturated hydraulic conductivity and gas diffusivity, which have the overriding influence on water retention and aeration during the cultivation period [2,9]. Changes in the properties of substrates can greatly influence water movement and availability for plants to uptake. Research has shown that the ratio of air to water alters as substrates experience structural modifications by mixing different substrates, such as changes in pore structure, and particle degradation [10,11]. Additionally, hysteresis—the phenomenon whereby water retention depends on the substrate’s wetting and drying history—is a key factor in soilless growing media [12]. However, there is still considerable uncertainty about how to effectively measure the hydraulic characteristics of these soilless substrates and apply this knowledge to enhance models predicting water flow and storage in potted plant systems.
Unlike mineral soil, peat substrates are continuously mixed with other coarse substrates like wood fibre and tree bark to improve the physical properties of the growing media. However, when combining two or more substrates with different textures and structures, their physical and hydraulic properties change, particularly their hydraulic parameters. The hydraulic parameters are vital for modelling water flow and solute transport through growing media. Direct measurement of the empirical parameters is tedious and time-consuming. Furthermore, according to Angullo-Jaramillo et al. [13], hydraulic properties are often derived from tension infiltrometer data using Wooding’s approximate analytical solution [14] for steady infiltration from a circular source with constant pressure head at the soil surface [15]. A common method, proposed by Reynolds and Elrick [16], uses steady-state infiltration data from a single disk at multiple pressure heads, modelling the hydraulic conductivity of unsaturated soils as a piece-wise continuous exponential function with parameters varying between consecutive pressure head pairs. However, these analytical approaches assume steady-state infiltration rates at each pressure head, which can be problematic, as reaching steady-state is time-intensive, requires large water volumes, and is uncertain, particularly for fine-textured soils [17]. Recent studies [17,18] suggest that parameter optimization through inverse simulation of transient flow data from a tension infiltrometer offers an alternative to these analytical methods.
Computational modelling is a valuable tool for simulating water dynamics in porous media. Hydrus-1D/2D, a widely used numerical model, applies the Richards equation [19] to quantify water movement in variably-saturated conditions. While extensively used for mineral soils in direct simulation and inverse simulation, its application in soilless substrates remains underexplored, particularly for wood fibre-based substrates. Additionally, the standard procedure, sand box, takes more than eight days to determine the water retention curve for one sample, while transient infiltration with MDI takes one day or less to determine the water retention curve for one sample. Therefore, there is a need to investigate the hydraulic properties of horticultural substrates using a Mini Disk Infiltrometer (MDI) in combination with the numerical inversion technique, which could be an easier and quicker method for determining the hydraulic parameters of growing media.
This study aimed to test the quality of the numerical inversion of MDI data to determine the hydraulic parameters of growing media. The objectives of this study were (1) to calibrate the simulated cumulative stepwise infiltration under different suctions with the measured data from the Mini Disk Infiltrometer, (2) to evaluate the efficiency of the Hydrus-2D inverse model to predict water dynamics through substrates with different textures under initially dry and moistened conditions, (3) to compare the substrates’ hydraulic parameters obtained through the numerical inversion model to those obtained by the laboratory methods, and (4) to provide recommendations on how to effectively use the MDI-based method for practical applications.
2. Materials and Methods
2.1. Properties of the Substrates
In this study, three types of growing media were selected to cover a broad range of particle size, organic matter content, and raw materials, including peat-free substrate. The substrates included garden market potted media for end users (garden market), growing media for commercial producers (wholesale companies), and pure treated wood fibre (WF4) (Table 1). The basic physical and chemical properties of the growing media were initially characterized (Table 2). EC (electrical conductivity; 1 substrate: 5 distilled water, vol/vol) and pH(1 substrate: 2.5 CaCl2 with 0.02 mol/L, vol/vol) of the substrates were determined according to [20]. The pH values ranged from 3.2 (peat) to 5.7 (Seedling), and EC from 0.05 dS m−1 (Peat) to 0.28 dS m−1 (Seedling), depending on the materials and the fertilizers added. Organic matter percentages were determined by ignition loss according to [21], ranging from 89.9%mas (Seedling) to 99.4%mas (WF4). The mean weighted diameter ranged from very fine (1.18 mm; Peat) to coarse (2.08 mm; Seedling substrate) (Table 2). The particle density was estimated from ignition loss [21]. Pore volume and container capacity were determined according to DIN EN 13041 [22]. Additionally, the saturated hydraulic conductivity of the substrates was determined by the constant head method [23].

Table 1.
Type and composition of the growing media.
Table 2.
Basic physical and chemical properties of the growing media.
2.2. Laboratory Experiment
2.2.1. Drying Water Retention Curve
The standard method to determine the water retention properties of growing media is the reference DIN method [22]. The procedure is as follows: for each material, two polyethylene vinyl chloride (PVC) pipes (16 cm height, 16 cm diameter) of 3.2 litres were filled with the substrate without compaction. The filled PVC pipes were placed in a water bath. Water was incrementally added to the water bath from the bottom of the PVC pipes up to one centimetre below the top of the pipe over 30 minutes. The saturation was initiated from the bottom of the pipes to avoid air entrapping within substrate pores. The samples were saturated for 24 h. After saturation, the samples were subjected to −50 hPa on a sandbox suction table for 48 h to equilibrate. Each substrate variant was then poured onto a tray and mixed thoroughly. Four double rings (as four replications) were filled with the substrate for each variant. The double rings comprised lower and upper ring. The internal dimensions of each ring were 5 × 10 cm in height and diameter, respectively. The bottom of the lower ring was secured with a non-biodegradable synthetic gauze. All the sample rings were transferred to the sand suction table, and pressure heads of −5, −10, and −50 hPa (corresponding to pF 0.7, 1.0, and 1.7) were applied. The pressure heads were measured from the centre of the lower ring; for details, see [22]. After the first suction (pF 0.7), the upper ring and the excess materials were carefully removed. After each pressure head and equilibration, the samples were weighed. After the last suction step (pF 1.7), the gravimetric water content and the dry matter of the lower ring material were determined after drying at 105 °C for 48 h. The dry bulk density (BD) was calculated based on the dried sample weight and volume.
Additional pressure heads of −100, −316, −1000, and −3162 hPa (corresponding to pF 2.0, 2.5, 3.0, and 3.5) were applied using small rings (1 cm height, 5 cm diameter) in a pressure plate apparatus [24]. The water content/suction results were used to construct the water retention curve. The container capacity (CC) was calculated at pF1.0 [22]. The water retention curve was fitted to the measured data by the Van Genuchten equation (see Equation (6), Section 2.4) using the Microsoft Excel solver procedure, keeping the saturated water content (θs) and the residual water content (θr) constant. θs was considered as the measured total pore volume and θr was set to 0.13 vol/vol because it was approximated with the laboratory data estimation.
2.2.2. Wetting Water Retention Curve
The wetting water retention curve based on capillary rise is a critical tool for understanding the hydraulic properties of soilless substrates. In this study, the methodology involved using a cylindrical tube composed of six stacked rings, a technique developed by [25]. Each ring had a height of 2 cm, and the tubes were systematically filled with the substrates according to their pre-determined bulk densities to ensure consistency across samples. After stacking the rings, the bottommost ring of the cylindrical tube was secured with gauze.
To maintain experimental reliability, three replications were prepared for each type of soilless substrate. The filled rings were then positioned on a levelled tray, and water was introduced into the tray up to a height of 1 cm from the base of the lowest ring. This water level was precisely maintained over 48 h to allow for the equilibration of moisture within the substrate columns through capillary action.
Following the equilibration period, three small samples were extracted from each 2 cm ring to determine the gravimetric water content. This approach enabled the precise measurement of moisture distribution throughout the vertical profile of the substrate column. The experimental setup created a range of matric potentials, varying from −2 cm (=−2 hPa) in ring no. 2 (i.e., the centre of the ring was 2 cm above the water table) up to −10 cm (=−10 hPa) in ring no. 6 (i.e., the centre of the ring was 10 cm above the water table).
The collected data were used to plot the wetting water retention curve. This curve characterizes how the substrates retain water under varying suction pressures. A commonly used assumption is that the wetting and drying water retention curves only differ in their α value [26] and the other Van Genuchten parameters can be assumed as constant and identical to the drying curve. The α parameter of the wetting curve (αw) was estimated using the Microsoft Excel solver procedure.
2.3. Infiltration Experiment
The Mini Disk Infiltrometer (METER Group, Pullman, WA, USA) operates by applying a small negative pressure (tension) to the water within the device. This tension prevents free-flowing water from entering the substrate, allowing water to infiltrate only when the substrate exerts sufficient capillary force. Air enters the reservoir through a narrow tube, balancing the negative pressure and enabling controlled water movement into the substrate through the basal disk. Before initiating the infiltration measurement, it should be ensured that there is no entrapped air in the filled infiltrometer tower. Secondly, the infiltrometer tower should be secured with a clamp to prevent disruptive movements to minimize experimental error. For each suction setting, the infiltrated water volume was recorded every 20 to 50 s, depending on the infiltration velocity. Each infiltration measurement was independently repeated 3 times. The number of infiltration measurements ranged from 32 to 37 steps, depending on the substrate type and thus infiltration velocity. At each step, approximately 40–60 cm3 of water (corresponding to 2.51 to 3.77 cm) was infiltrated into the substrate column. Cumulative infiltration depth (cm) was calculated by dividing the infiltrated water volume by the infiltration area (sintered steel disk). The cumulative infiltration data were then used as input for the inverse solution approach, applying the modified Richards equation for axisymmetric water flow. This method allowed for the calculation of fitted cumulative infiltration and, ultimately, the determination of the substrate hydraulic properties.
The infiltration experiment was conducted to evaluate the hydraulic properties of three different substrates: Peat, WF4, and Seedling. Each of the three substrates was prepared with a predefined bulk density and placed into cylindrical containers with dimensions of 10 cm in diameter and 20 cm in height. However, the containers were only filled up to 16 cm in height, creating the defined flow domain for infiltration measurements. Each substrate was tested with three replications. The initial water content (θi) of each substrate was measured before the infiltration tests (Table 3). The experiments were conducted under both dry and moistened (wet) conditions to assess the effect of initial moisture content on infiltration behaviour. The dry condition is the case where the samples were directly taken from the bag, and the wet condition is the case where the samples were brought to almost one-third to one-fourth of the saturated water content.
Table 3.
Input parameters used for the inverse simulation.
The Mini Disk Infiltrometer was used to apply three different suction levels: −6 cm, −4.5 cm, and −3 cm. This tension-controlled infiltration approach allowed for the simulation of water infiltration without ponding. After completing the infiltration at the final suction level (−3 cm), three small substrate samples were collected from beneath the stainless disk of the infiltrometer to measure the final water content (θf) of the substrate at its upper boundary (Table 3).
2.4. Inverse Solution Approach
The inverse analysis of tension infiltrometer data was carried out using the Hydrus-2D model, which relies on numerical solutions of a modified form of the Richards equation. The Richards equation governs radially symmetric Darcian flow. This equation accounts for the movement of water through unsaturated porous media, driven by pressure and gravitational gradients. The radial symmetry assumption simplifies the flow dynamics, allowing for a detailed characterization of soil hydraulic properties such as hydraulic conductivity and water retention under varying tension conditions:
where θ is the volumetric water content (L−3·L−3), h is the pressure head (L), K is the hydraulic conductivity (L·T−1), r is a radial coordinate (L), z is the vertical coordinate (L) positive upward with z = 0 corresponding to the soil surface, and t is time (T). The substrates were assumed to be isotropic during the numerical experiment. Equation (1) was numerically solved for the following initial and boundary conditions [27]:
Initial conditions:
Upper boundary condition below the MDI:
Upper boundary condition outside the MDI:
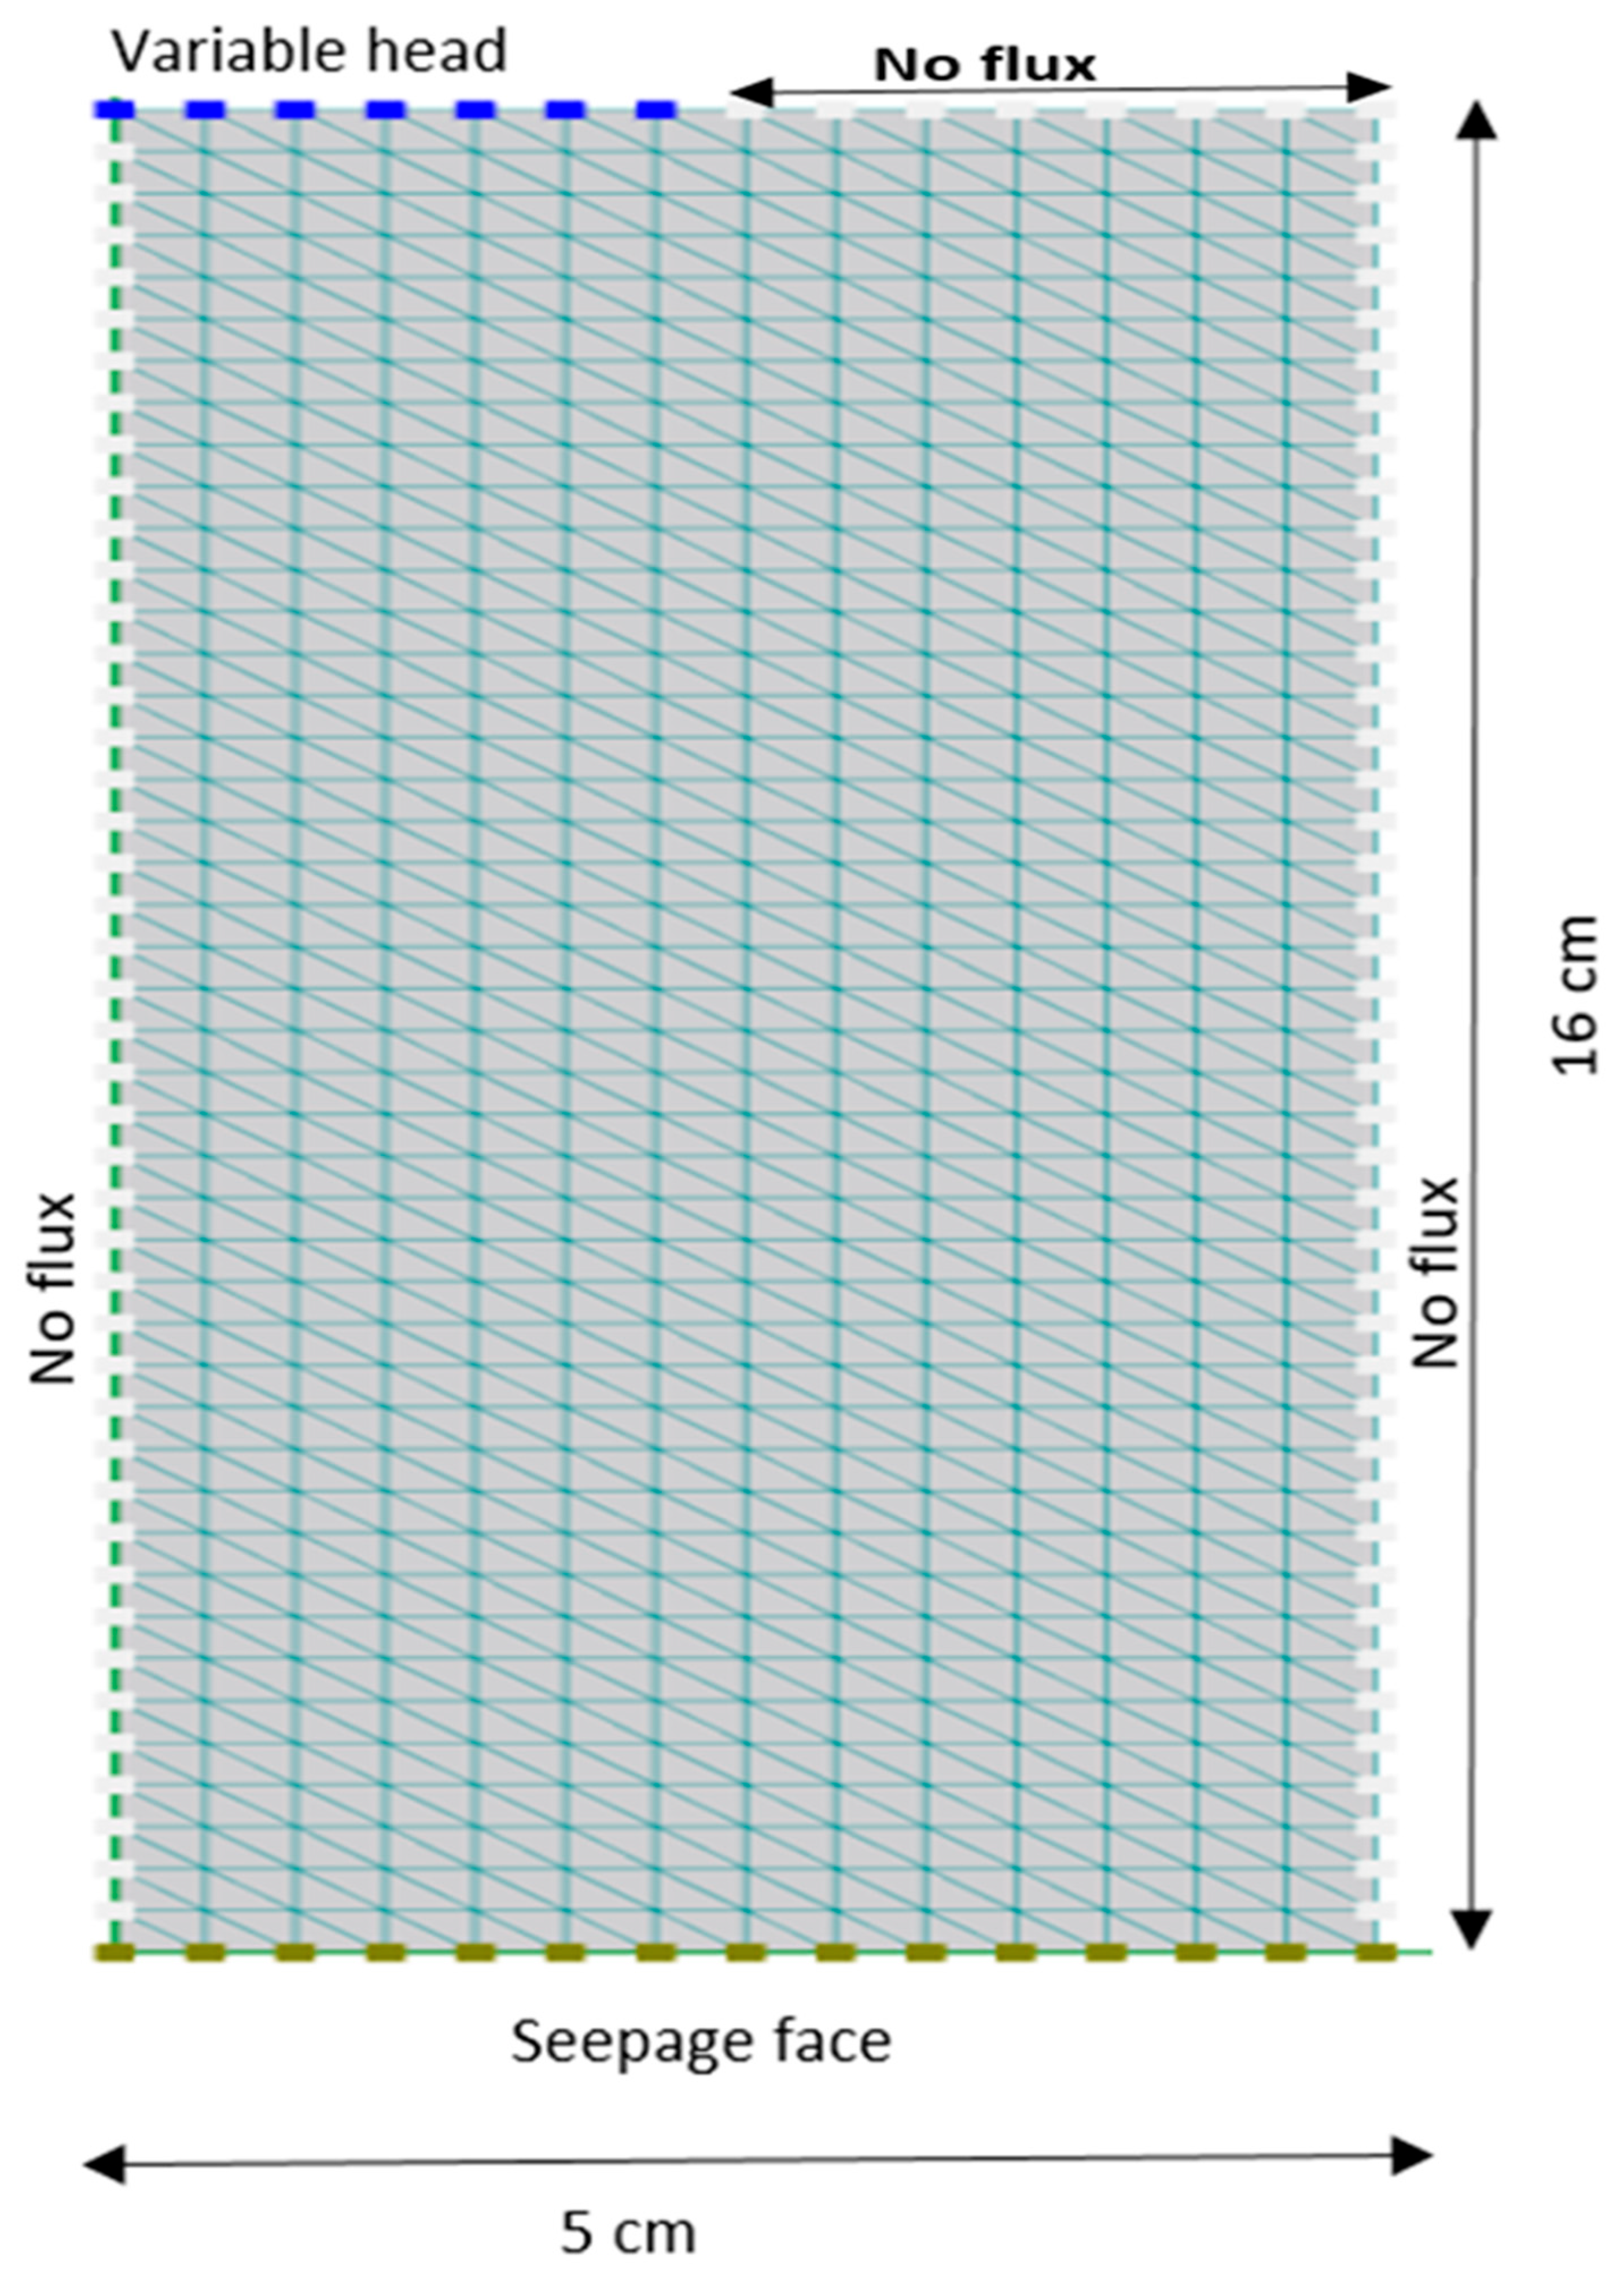
where θi is the initial water content (L3·L−3), hi is the initial pressure head (L), ho(t) is the time-variable supply pressure head imposed by the Mini Disk Infiltrometer (L), and ro is the radius of the disk. Equation (2) specifies the initial condition of the flow domain in terms of initial water content and initial pressure head respectively. Equation (3) prescribes the time-variable pressure head under the tension Mini Disk Infiltrometer. Meanwhile, Equation (4) represents a zero flux at the remainder of the substrate surface. Equation (5) assumes that all the other boundaries are sufficiently far away from the infiltration source, so they do not impact the infiltration process. Equation (1) was subjected to the above initial and boundary conditions and solved numerically by the quasi-three-dimensional (axisymmetric) finite element codes in Hydrus-2D [28] (Figure 1). The upper part of the flow domain (dashed blue line) represents variable head by the MDI infiltrometer. The rest of the upper part and the vertical sides of the flow domain were set to no flux boundaries. Finally, the seepage face boundary was applied to the lower part of the flow domain.
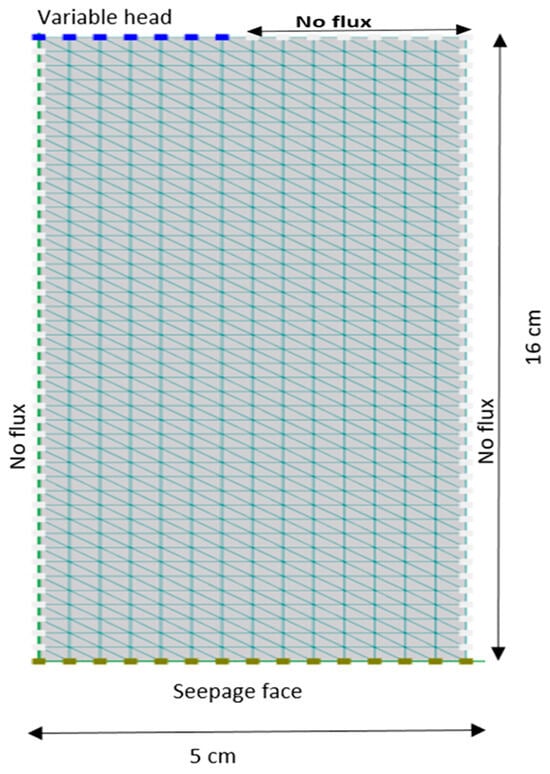
Figure 1.
Finite element mesh and boundary conditions for the axisymmetric flow domain in Hydrus-2D.
The inverse solution requires parameterization for the unsaturated soil hydraulic properties. In this study, the Van Genuchten model [29] was selected. The soil hydraulic functions are described as follows:
where Se is effective saturation; θr and θs denote the residual and saturated water contents, respectively (L3·L−3); Ks is the saturated hydraulic conductivity (L·T−1); l is a pore-connectivity parameter (-); and α (L−1), n (-), and m = 1-1/n (-) are empirical parameters. The pore-connectivity parameter l in the hydraulic conductivity function has been estimated [30] to be 0.5 as an average for many mineral soils. However, this value has not yet been proved to be valid for usually much coarser soilless substrates. The hydraulic characteristics defined by Equations (6) and (7) contain six unknown parameters: θr, θs, α, n, l, and Ks. Simunek and Van Genuchten [31] stated that the selected soil hydraulic functions and the unknown parameters being parameterized impact the uniqueness and stability of the inverse model. However, it is difficult to obtain unique parameter sets when estimating too many parameters simultaneously. Therefore, similar to the estimation of the Van Genuchten parameters for the measured water retention values, θs and θr were kept constant and only α, n, l, and Ks were estimated during the inverse approach.
Furthermore, the tension disk infiltration represents the wetting branch of the unsaturated hydraulic properties [32] in Equations (6) and (7). To compare the results with the commonly determined drying branch of the hydraulic properties, a conversion is necessary. As mentioned before, a commonly used assumption is that the wetting and drying water retention curves only differ in their α value. For mineral soils, the αw value for the wetting branch retention curve is about two times greater than that of the drying branch (αd) [26]. However, a comparative study on the determination of substrate hydraulic properties of 16 different substrates was conducted by [33]. The authors found that αw is approximately 5.3 times greater than that of αd in organic soilless substrates. Therefore, the αw values obtained through the inversion approach were converted to αd by multiplication with a factor of 5.3 in this study.
The inverse solution approach defined by Simunek and Van Genuchten [31] is based on the minimization of the following objective function, Φ:
where qm represents the number of different measured data sets such as cumulative infiltration data (I), the final water content (θf), or other additional information used in the analysis; nj is the number of measurements in a particular set; is the specific measurement at time for the jth measurement set; β is the vector of optimized parameters (θr, θs, α, n, l, and Ks); represents the corresponding model predictions for the parameters’ vector β; and and are weights associated with a particular measurement set or point, respectively. Simunek et al., 1998 [34], used the value of one for the weighting coefficients in Equation (8), thus assuming that variances of the errors inside a particular measurement set are all the same. The weighting coefficients minimize the difference in weighting between different data types because of the different absolute values and numbers of data involved, which are given by
The objective function (Equation (8)) is defined as the average weighted squared deviation, normalized by the measurement variances . Because the final water content is represented by a single value with an undefined variance, its weight is assumed to be one.
Minimization of the objective function in Hydrus-2D was accomplished using the Levenberg–Marquardt nonlinear minimization method [35]. In our study, the objective function ( was defined in terms of the measured cumulative infiltration data at three consecutive suctions (−6, −4.5, and −3) cm, and the initial and final water contents.
2.5. Statistical Analysis
Statistical metrics including R-squared (R2), Mean Error (ME), Mean Absolute Error (MAE), and Root Mean Square Error (RMSE) were used to analyse the results. These metrics evaluated the inverse model’s performance by assessing the proportion of variance explained (R2), the model’s bias (ME), overall accuracy (MAE), and the magnitude of prediction errors (RMSE). Together, they provided a comprehensive assessment of the agreement between the model predictions and the laboratory method results, addressing bias, precision, and significant deviations.
3. Results and Discussion
3.1. Cumulative Infiltration Simulated with Inverse Approach
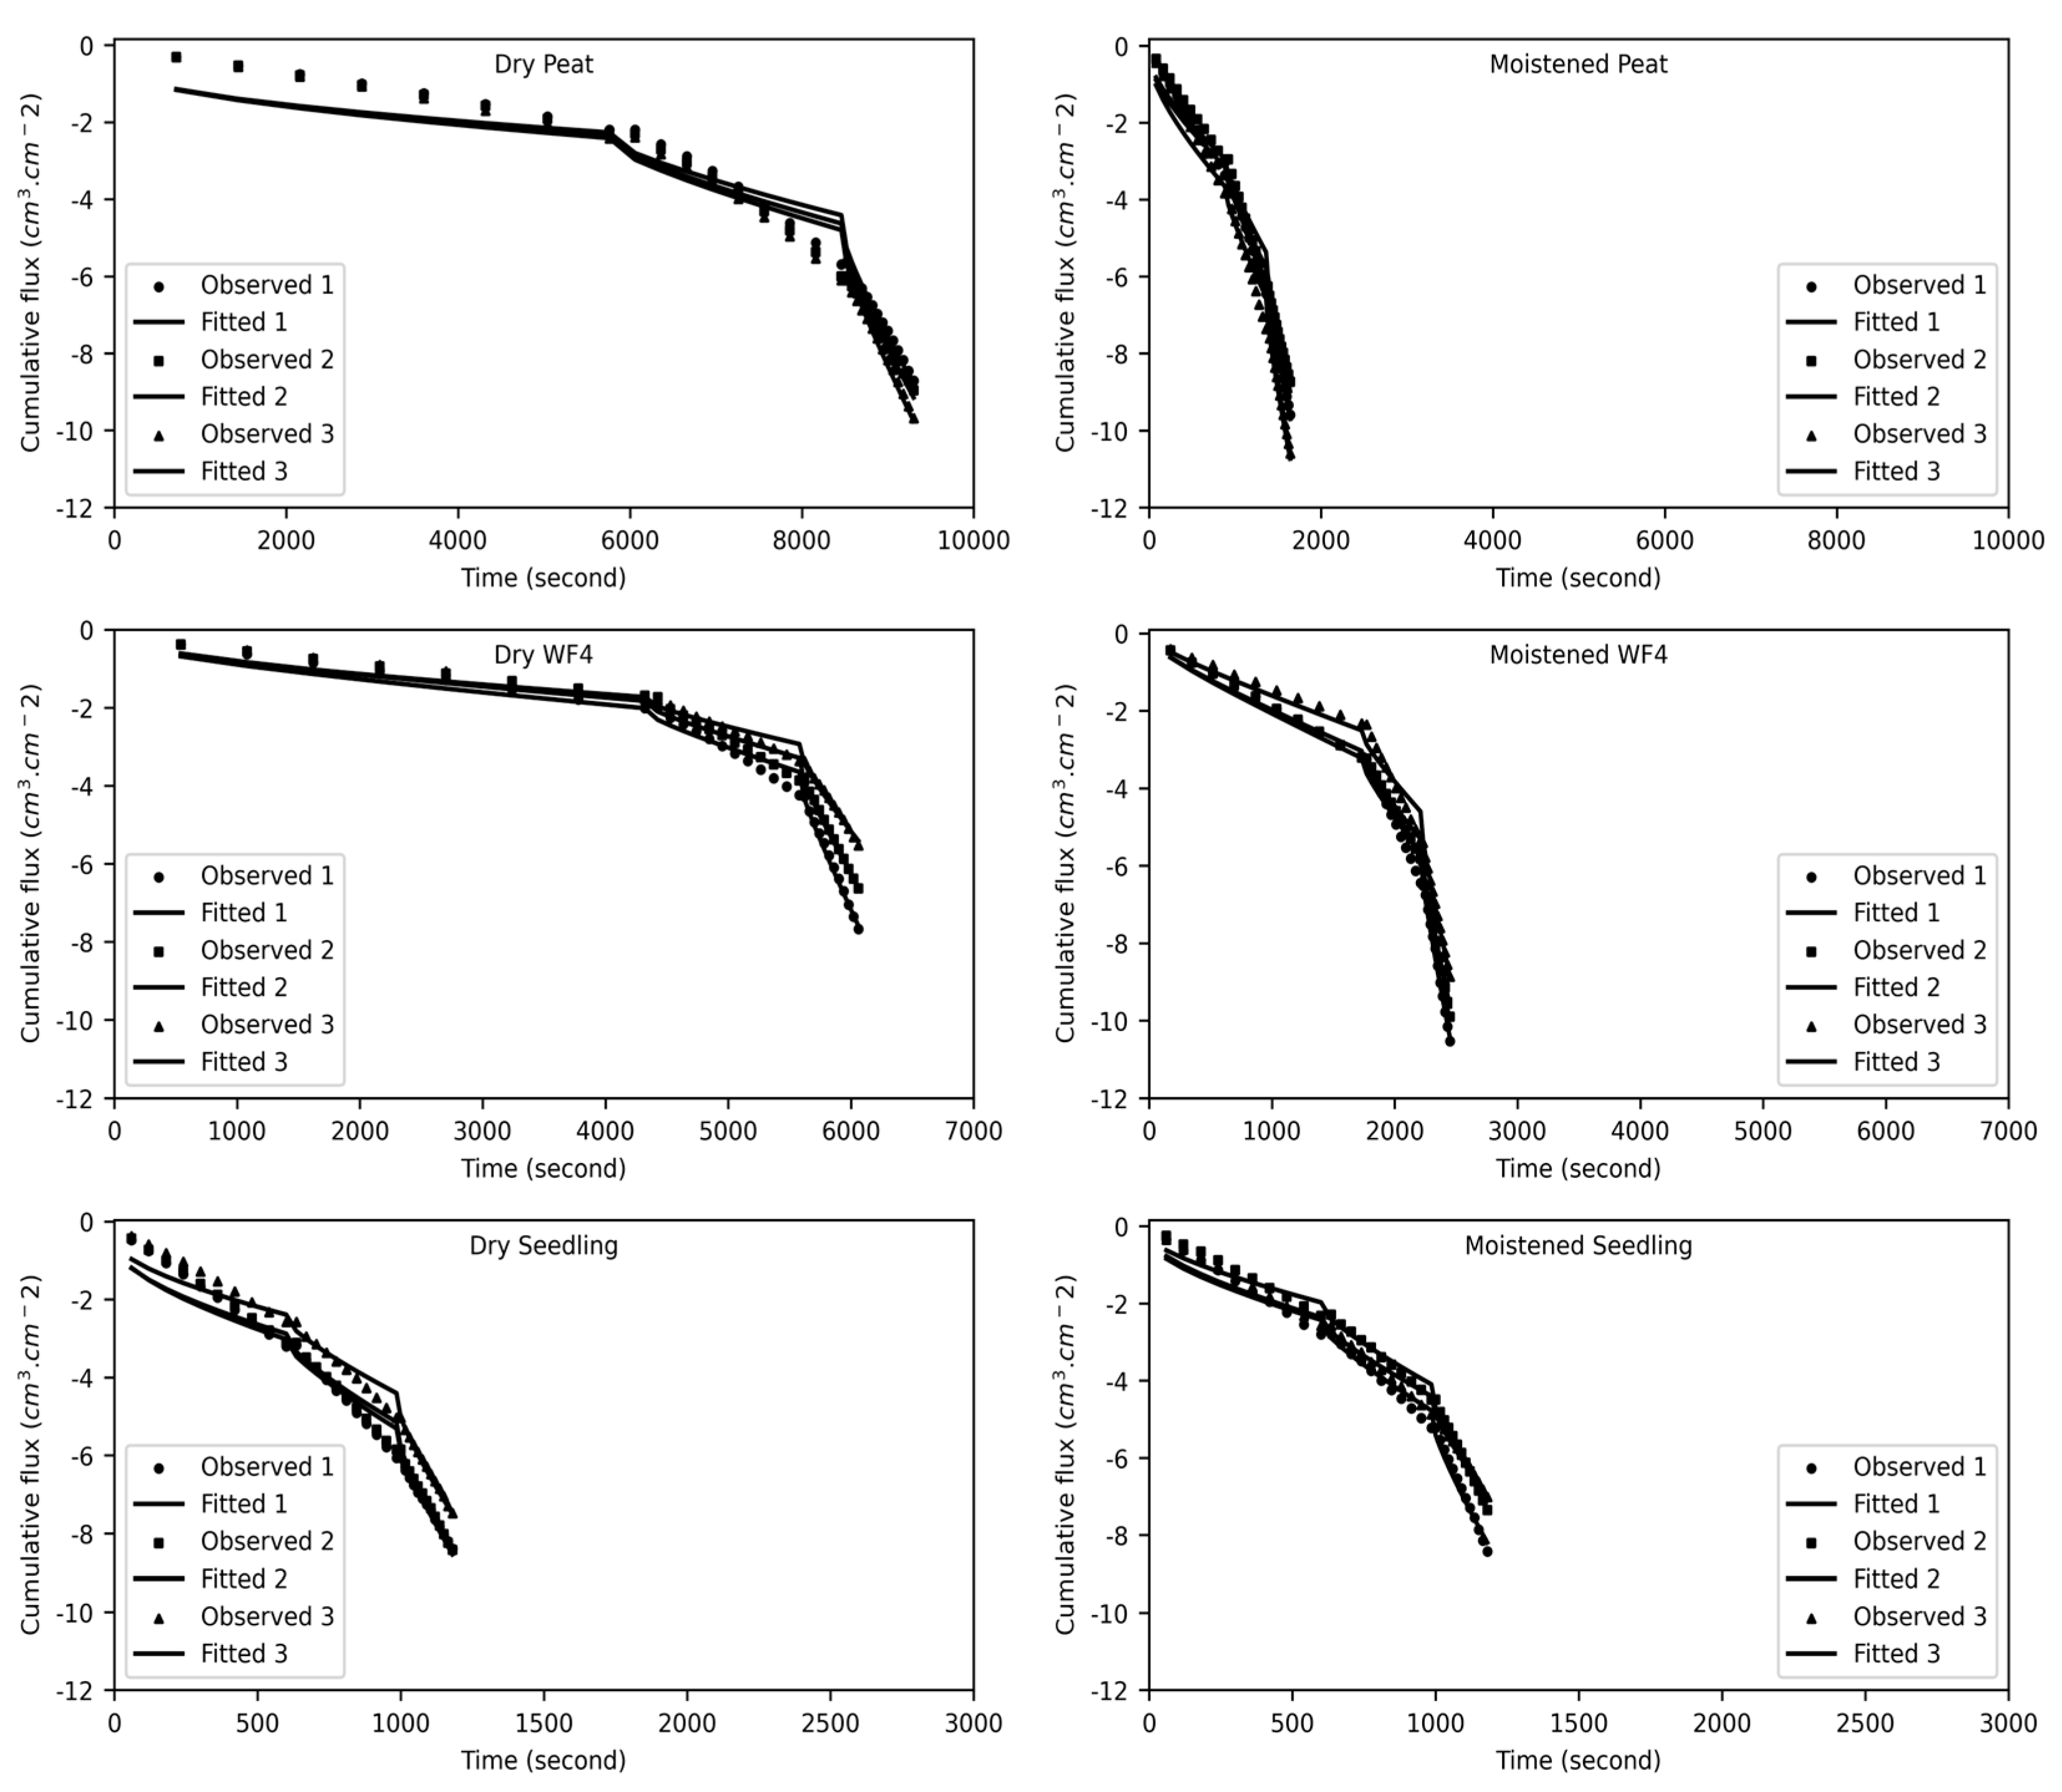
Figure 2 demonstrates the variations influenced by the initial moisture content. The statistical measures from the simulations, as shown in Table 4, provided insights into the performance and accuracy of the predictive models for each substrate.

Figure 2.
Effect of initial moisture content of substrates on measured and simulated cumulative infiltration. The numbers 1, 2, and 3 denote the three replications.
Table 4.
The main statistical measures to compare the simulated infiltration to the measured infiltration.
For all substrates—Peat, WF4, and Seedling—the coefficient of determination (R2) was very high (>0.98) and almost similar, indicating a consistently strong correlation between observed and simulated values across both dry and moistened conditions. However, small differences emerged when analysing the other statistical metrics (ME, MAE, and RMSE). For dry peat, the ME, MAE, and RMSE suggested moderate variability in the model’s accuracy under dry conditions, indicating some challenges in precisely capturing infiltration dynamics. In contrast, moistened peat showed lower values for ME, MAE, and RMSE, reflecting improved simulation accuracy and reduced error, which underscores the stabilizing effect of initial moisture. In the case of dry WF4, the ME, MAE, and RMSE indicated that while the model effectively captured infiltration trends, some discrepancies persisted, pointing to slightly higher errors compared to moistened conditions. Moistened WF4 exhibited the lowest ME, MAE, and RMSE among all samples, highlighting its superior predictability and minimal error in moistened states. This further emphasizes the benefit of pre-wetting. The dry Seedling substrate displayed ME, MAE, and RMSE values that reflected slight variability in water infiltration dynamics, likely due to its unique hydraulic properties under dry conditions, suggesting higher errors compared to other dry substrates. However, moistened Seedling substrate showed reduced ME, MAE, and RMSE, indicating a significant improvement in model accuracy and alignment with observed data when pre-moistened.
Overall, the findings indicate that while R2 remains almost similar across all substrates, the initial water content of the substrate plays a crucial role in influencing the ME, MAE, and RMSE. The consistently lower errors in moistened conditions across all substrates suggest that pre-wetting significantly stabilizes the infiltration characteristics, enhancing the model’s predictability and reducing variability in these error metrics. This phenomenon was also observed in a previous study on substrate water dynamics, emphasizing moisture’s stabilizing effect on measuring hydraulic properties.
3.2. Optimized α and n Parameters
The comparison of the α (inverse of the air entry suction) and n (pore-size distribution parameter) values obtained by the MDI-based inversion model and the DIN standard laboratory method revealed notable trends across different substrates, as shown in Table 5. These parameters are critical in understanding the water retention characteristics and pore structure of the substrates. The significant differences between methods, as identified through ANOVA analysis with a p-value < 0.05, are noted in the following results.
Table 5.
Statistical analysis for laboratory-measured (drying branch) and MDI-based inversion model-estimated α and n values.
For Peat, the MDI-based inversion model yielded an αd value of 0.115 cm−1 (αd[MDI dry]) under dry conditions, closely matching the laboratory-determined value of 0.116 cm−1 (αd[lab.]), indicating strong agreement between methods for dry conditions. The αd value obtained using the MDI-based inversion model aligned closely with the α value 0.120 cm−1 of Peat, reported by Londra [36] using the standing column-laboratory procedure. However, under moistened conditions, the MDI-based αd value increased to 0.210 cm−1 (αd[MDI wet]), significantly exceeding the laboratory value, which suggests enhanced water retention capacity as estimated by the inversion model under wetter conditions. This discrepancy may reflect differences in how the MDI-based inversion model accounts for moisture-induced changes in pore water dynamics. The n value from the MDI-based inversion model also varied: it increased to 2.165 (n[MDI dry]) under dry conditions compared to the laboratory value of 1.712 (n[lab.]), indicating a broader pore-size distribution, but decreased to 1.535 (n[MDI wet]) under moistened conditions, suggesting a narrower distribution than the laboratory measurement, likely due to water saturation of smaller pores. Compared to the n value of 2.06 for Peat substrate using DIN EN (13041) by [37], the n value of Peat using the MDI-based numerical inversion model was reasonable, particularly under moistened conditions.
For WF4, the MDI-based inversion model produced αd values of 0.213 cm−1 (αd[MDI dry]) for dry conditions and 0.250 cm−1 (αd[MDI wet]) for moistened conditions, both of which were lower than the laboratory-determined value of 0.396 cm−1 (αd[lab.]). This consistent underestimation by the inversion model, with the moistened condition showing a significant difference, may point to methodological differences or assumptions in the MDI approach that affect the estimation of water retention compared to the DIN method. The n value from the MDI model increased to 2.304 (n[MDI dry]) under dry conditions, surpassing the laboratory value of 1.913 (n[lab.]), suggesting a wider pore-size distribution. However, under moistened conditions, the n value rose only marginally to 1.983 (n[MDI wet]), indicating relatively stable pore structure changes compared to the laboratory measurement, with no significant difference.
For Seedling, the MDI-based inversion model estimated higher αd values than the laboratory method: 0.150 cm−1 (αd[MDI dry]) for dry conditions and 0.156 cm−1 (αd[MDI wet]) for moistened conditions, compared to the laboratory value of 0.106 cm−1 (ad[lab.]). This suggests that the inversion model predicts improved water retention characteristics relative to the laboratory results, with significant differences under both moisture conditions. The n value from the MDI-based inversion model also exceeded the laboratory measurement, increasing to 1.798 (n[MDI dry]) under dry conditions from 1.524 (n[lab.]), indicating a broader pore-size distribution, but decreasing to 1.607 (n[MDI wet]) under moistened conditions, reflecting a narrower distribution than the laboratory value, likely due to water filling smaller pores, with significant differences noted.
The observed differences between the MDI-based inversion model results and the laboratory-determined values, with significant variations noted, highlight the influence of moisture conditions and measurement methods on substrate hydraulic properties. The MDI-based inversion model, which adjusts wetting α values to drying values (multiplication by 5.32 to account for the wetting-to-drying conversion), offers insights into substrate behaviour under varying water content. However, the discrepancies, particularly the lower α values for WF4 and higher values for Seedling and Peat under moist conditions, suggest that further investigation into methodological biases or substrate-specific responses may be necessary. Finally, the closeness and discrepancy between the measured and optimized parameters are common in soilless media. Such behaviours aligned with findings by [12] on substrate-specific hydraulic behaviour.
3.3. Wetting Water Retention Curves
The αw values (inverse of the air entry suction) for Peat, WF4, and Seedling were measured in the laboratory and estimated using the MDI-based inversion model under dry (αw[MDI dry]) and wet (αw[MDI wet]) conditions, as shown in Table 6. For Peat, the MDI dry estimation of 0.612 and MDI wet estimation of 1.115 differ from the laboratory-measured αw value of 0.727, with the dry estimation being lower and the wet estimation significantly higher, indicating inconsistent model performance across moisture states. Compared to the results of αw 1.600 for the Peat substrate [25] using the laboratory method, the αw [MDI wet] of Peat in our study was in between the results of our laboratory value and the literature result. For WF4, the MDI dry estimation of 1.134 and MDI wet estimation of 1.330 are both higher than the laboratory αw of 0.855, suggesting consistent overestimation by the model. The Seedling substrate showed closer alignment, with a MDI dry estimation of 0.797 and MDI wet estimation of 0.832 compared to the laboratory αw of 0.641, though slight overestimation persists in wet conditions, indicating better model performance for this substrate. These discrepancies, particularly for Peat and WF4, highlight the need for substrate-specific calibration of the MDI model to align estimated αw values more accurately with laboratory-measured data across varying moisture levels.
Table 6.
Statistical analysis for laboratory-measured (wetting branch) and MDI-based inversion model-estimated α values.
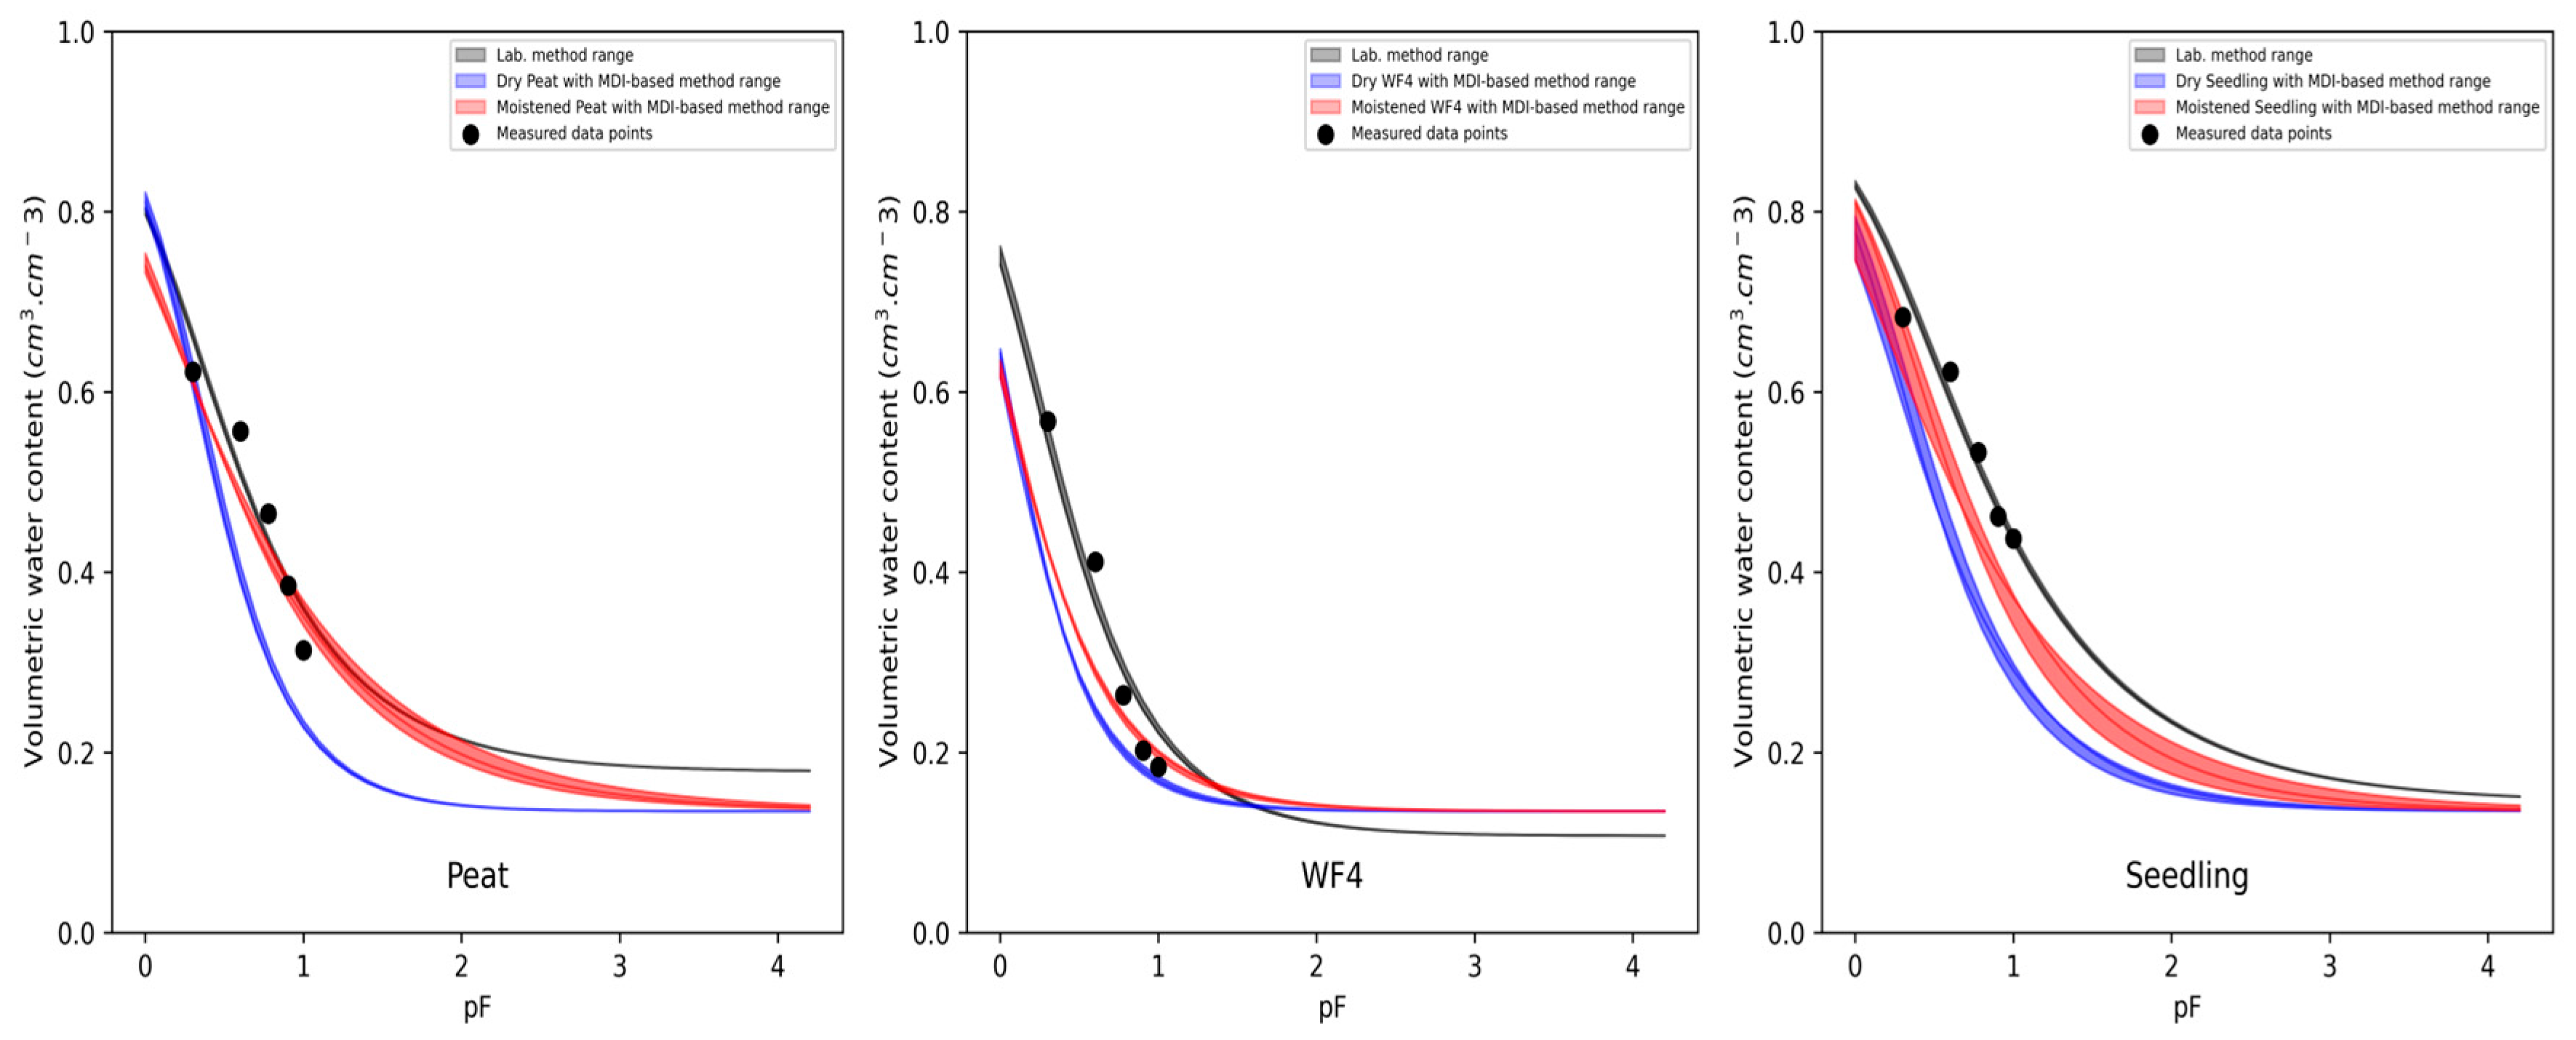
The results from the laboratory measurements and the numerical inversion model (Figure 3) demonstrate the main wetting characteristics of the tested substrates. The curve-fitting analysis highlights critical differences in substrate-wetting behaviour.
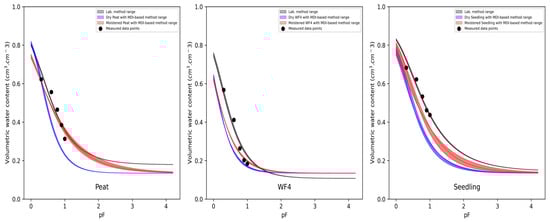
Figure 3.
Comparison between the measured and the MDI-based numerical inversion method wetting branch of the water retention curve.
The MDI-based inversion model curves demonstrate a relatively good correlation with the measured wetting curves. This observation suggests that substrates with higher initial moisture content or those that have been pre-moistened exhibit improved wetting characteristics, likely due to enhanced hydraulic conductivity, reduced resistance to water absorption, and less hydrophobicity. It is evident from Figure 3 that the moistened peat with the MDI-based inversion model curve agrees slightly better with the measured curve (R2 = 0.97) compared to the WF4 (R2 = 0.90) and Seedling (R2 = 0.95) substrates (Table 7). One reason may be that peat has a higher wettability than WF4. This phenomenon has been documented by a few studies (e.g., [38,39]). However, slight underestimations are observed in the MDI-based inversion model wetting curves for all the three substrates. Despite these discrepancies, the overall MDI-based inversion model water retention curves are close to the measured curves, indicating that the numerical inversion model could effectively capture the general trends of wetting behaviour. Such underestimations may be attributed to the inherent assumptions and simplifications within the inverse model, which might not fully account for substrate-specific factors like heterogeneity in pore structure and particle size distribution. Furthermore, substrates with a greater proportion of fine particles typically displayed smoother and more predictable wetting curve shapes, as in the case of the Peat substrate with a mean weighted diameter of 1.18 mm (Table 2), while coarser or heterogeneous substrates exhibited more variability in the fitting curve due to irregular pore sizes and shapes, as in the case of the Seedling substrate with a mean weighted diameter of 2.08. Another factor that influenced the fitting curves was the parameter restriction during the optimization. More specifically, the two main hydraulic parameters, namely, saturated water content (θs) and residual water content (θr), were not optimized but rather were fixed. Fixing one or more parameters of the water retention curve was reported to be problematic and changed the smooth transition of the curve. Therefore, [40] recommended that all soil hydraulic parameters should be optimized simultaneously. However, our findings showed that optimizing the parameter θr in particular yielded very high deviations between measured and simulated water retention curves, meaning that fixing θr seems to be appropriate. The laboratory experiment for the wetting retention curve aimed to validate the MDI-based numerical inversion model’s results against measured data, with findings largely supporting the model’s utility. As reported by [34,41], tension disk infiltrometers are effective in producing the wetting branch of water retention curves. This approach aligned well with the experimental setup used in this study, providing a robust basis for comparing numerical simulations and empirical data. The model demonstrated the reliability of numerical inversion for analysis of the wetting curve in soilless substrates, which supports the methodology employed here. The reliability of this numerical model for soilless substrates has been recently affirmed by [2].
Table 7.
Statistical measures to compare the MDI-based inversion model curve to the laboratory-produced wetting curve.
The general efficiency of the model, as shown in Table 7, appears robust across different substrates (Peat, WF4, and Seedling) and states (dry and wet), with R2 values ranging from 0.8091 to 0.9469, indicating strong explanatory power in predicting the target variable. The low Mean Absolute Error (MAE) and Root Mean Squared Error (RMSE) values, typically below 0.1 cm3·cm−3, suggest high prediction accuracy with minimal average deviation from actual values, while the small Mean Error (ME) values indicate little systematic bias. Overall, the model performs well, with the wet materials performing slightly better than the dry materials.
3.4. Drying Water Retention Curves
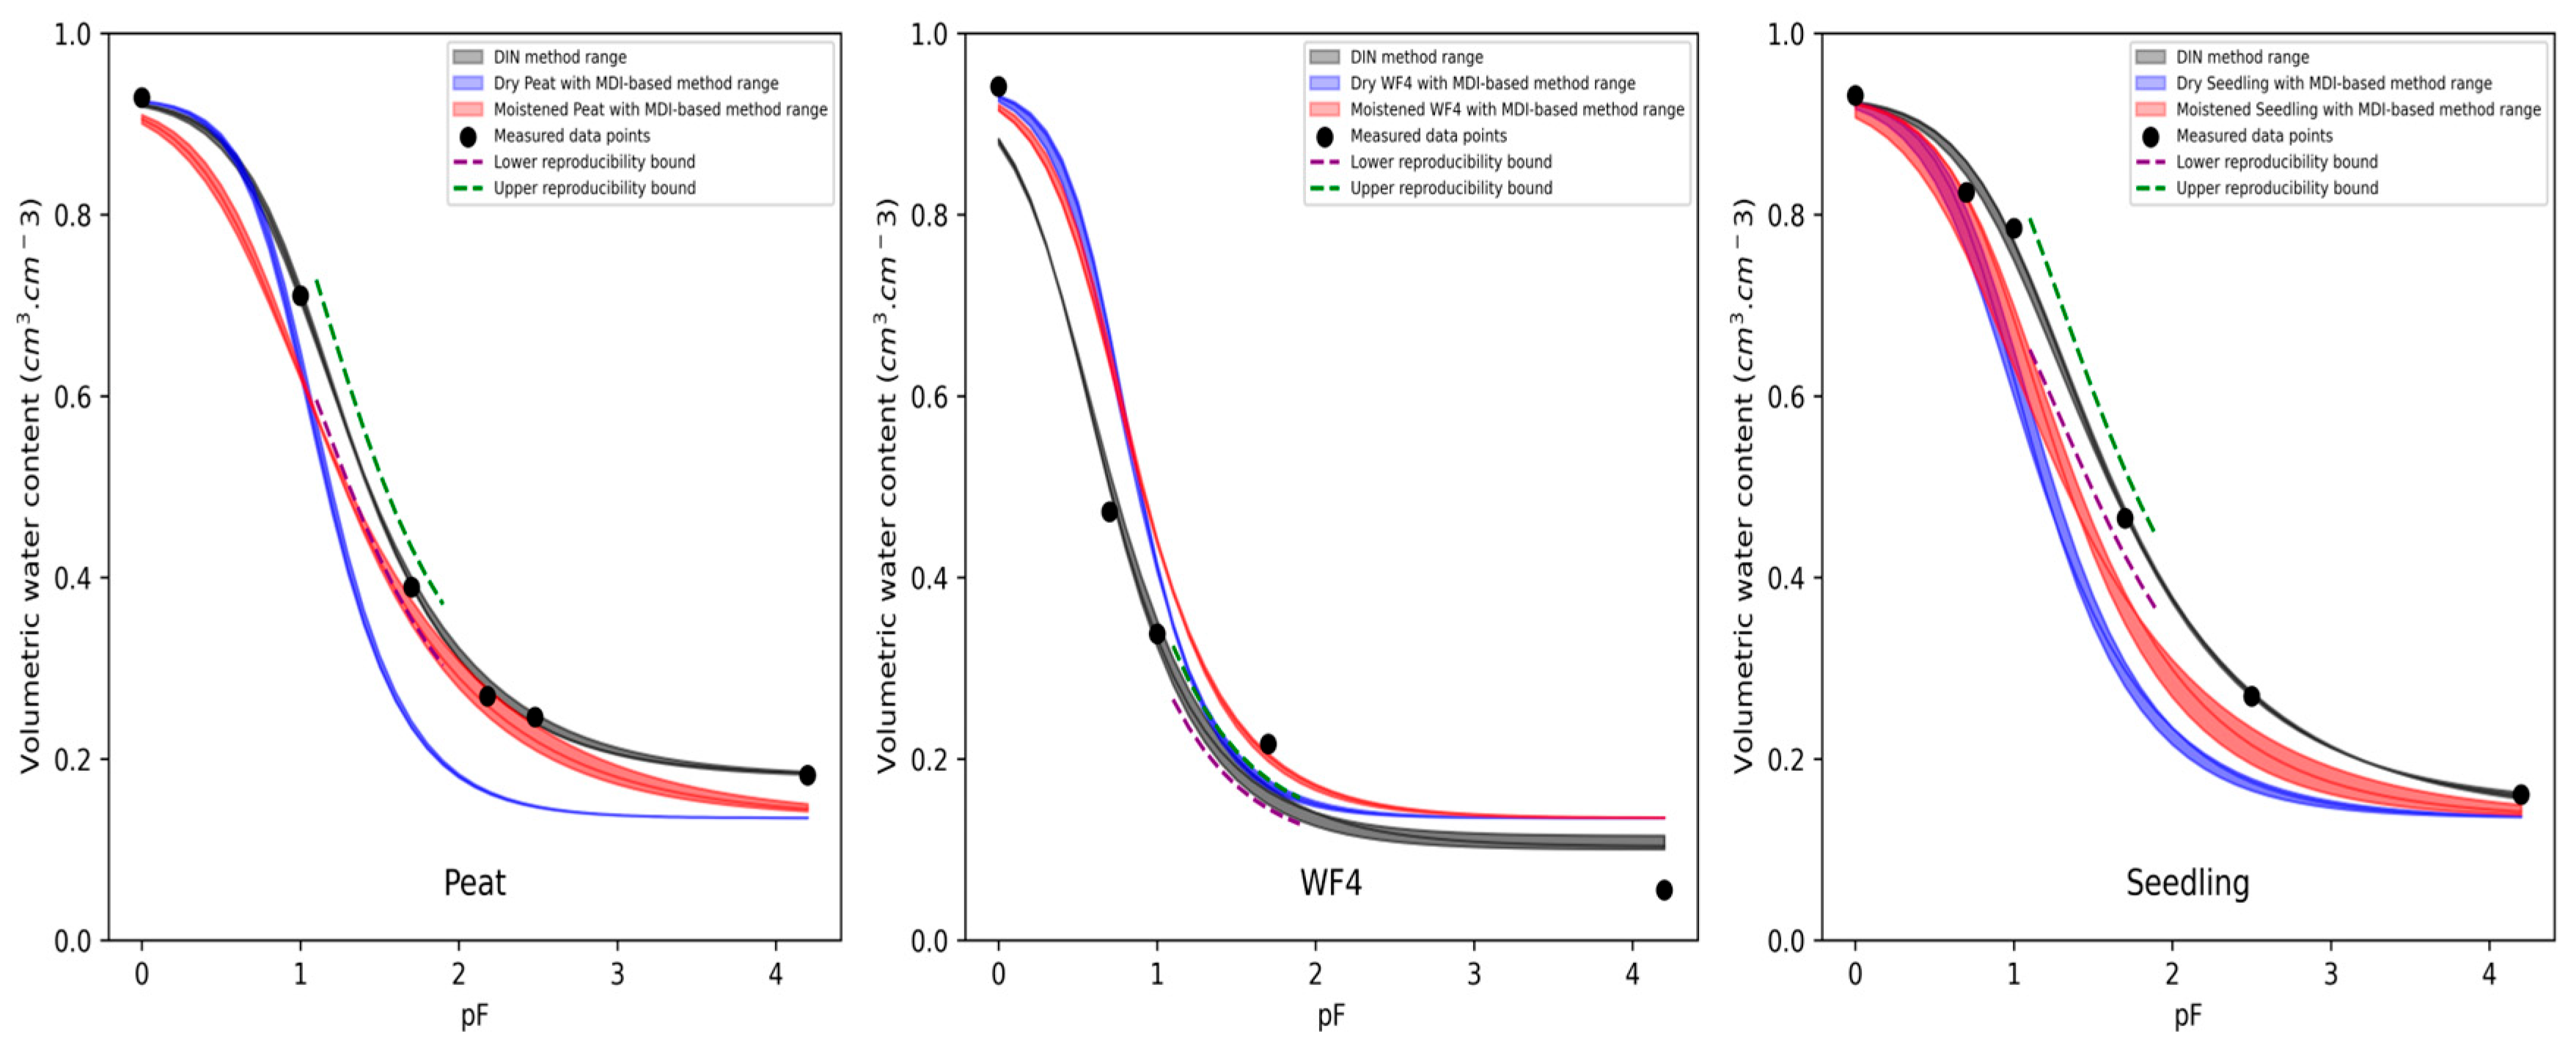
The drying water retention curves derived from the MDI-based numerical inversion model were compared with those obtained through the DIN standard laboratory procedure, as shown in Figure 4. The MDI-based numerical inversion model drying retention curves were obtained by converting only the optimized αw value to a drying αd value while keeping the other hydraulic parameters as optimized by the numerical inversion model for the wetting retention curve.
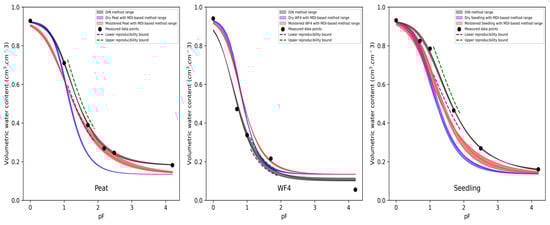
Figure 4.
Comparison between the drying water retention curves obtained through the numerical inversion of the Mini Disk Infiltrometer data and the standard DIN laboratory method. The green lines denote the average reproducibility interval of the DIN method.
For the moistened substrates of Peat, WF4, and Seedling, the water retention curves derived from the MDI-based numerical inversion model closely match those obtained using the DIN procedure. This suggests that the MDI-based numerical inversion model represents water retention behaviour under moistened conditions well, demonstrating its reliability in such cases. However, for the initially dry substrates, the MDI-based numerical inversion model shows less agreement with the DIN procedure, as quantified in the performance metrics provided in Table 8.
Table 8.
Statistical measures to compare the MDI-based inversion model curve to the laboratory-produced drying curve.
Table 8 presents key statistical indicators—R2, ME, MAE, and RMSE—for each substrate under dry and wet conditions. For dry Peat, the MDI-based model achieves a high R2 (0.89), indicating a good fit, but exhibits a negative ME, suggesting a slight underestimation of water retention, with corresponding MAE and RMSE values. In contrast, wet Peat shows an even stronger fit with a high R2 (0.97) and fewer errors (ME, MAE, and RMSE), underscoring the model’s accuracy under moistened conditions. Similarly, dry WF4 had a high R2 (0.92) with a positive ME, MAE, and RMSE. The wet WF4 shows a high R2 (0.92) and positive ME, MAE, and RMSE as well. For dry Seedling, the R2 (0.86) is lower with a negative ME, MAE, and RMSE, indicating underestimation, whereas wet Seedling improves significantly with a high R2 (0.94) and a negative ME, MAE, and RMSE.
Figure 4 further illustrates these trends, displaying the volumetric water content (θ) against the matric potential (pF) for Peat, WF4, and Seedling under both dry and moistened conditions. The curves for moistened substrates (red curves) closely align with the measured data points and the DIN method range (dark grey curve), confirming the MDI-based model’s reliability in these scenarios. However, for dry substrates (blue curves), the MDI-based model tends to underestimate water retention, particularly for Peat and Seedling, as evidenced by the divergence from the DIN method range and measured data points. This underestimation is visually apparent in the figure, where the blue curves for dry Peat and Seedling fall below the dark grey curve, indicating lower predicted water retention compared to the standard DIN procedure.
This discrepancy suggests that the MDI-based numerical inversion might not fully account for the initial moisture distribution or the associated changes in pore structure and hydraulic properties under dry conditions. The observed differences could also result from the model’s assumptions, such as the conversion of wetting αw to drying αd, which may not adequately capture the hysteresis or structural changes in dry substrates. However, discrepancies between measured values and results of laboratory infiltration methods have also been reported in other studies (e.g., [36], which used different hydraulic models (Van Genuchten and Brooks–Corey)).
The results of interlaboratory trials of the DIN method (DIN 13041) were used to evaluate the importance of this discrepancy for practical applications. The reproducibility limit is the value below or equal to which the magnitude of the difference between two laboratories can be expected with a probability of 95%. The reproducibility of the standard method was determined on average to be 0.098 cm3·cm−3 at pF 1.0, 0.111 cm3·cm−3 at pF 1.7, and 0.124 cm3·cm−3 at pF 2.0 [17]. Figure 4 shows that the curves developed under wet conditions were all within the reproducibility limits of the standard method, further emphasizing the usability of the inverse approach for practical applications.
3.5. Hydraulic Conductivity Curves
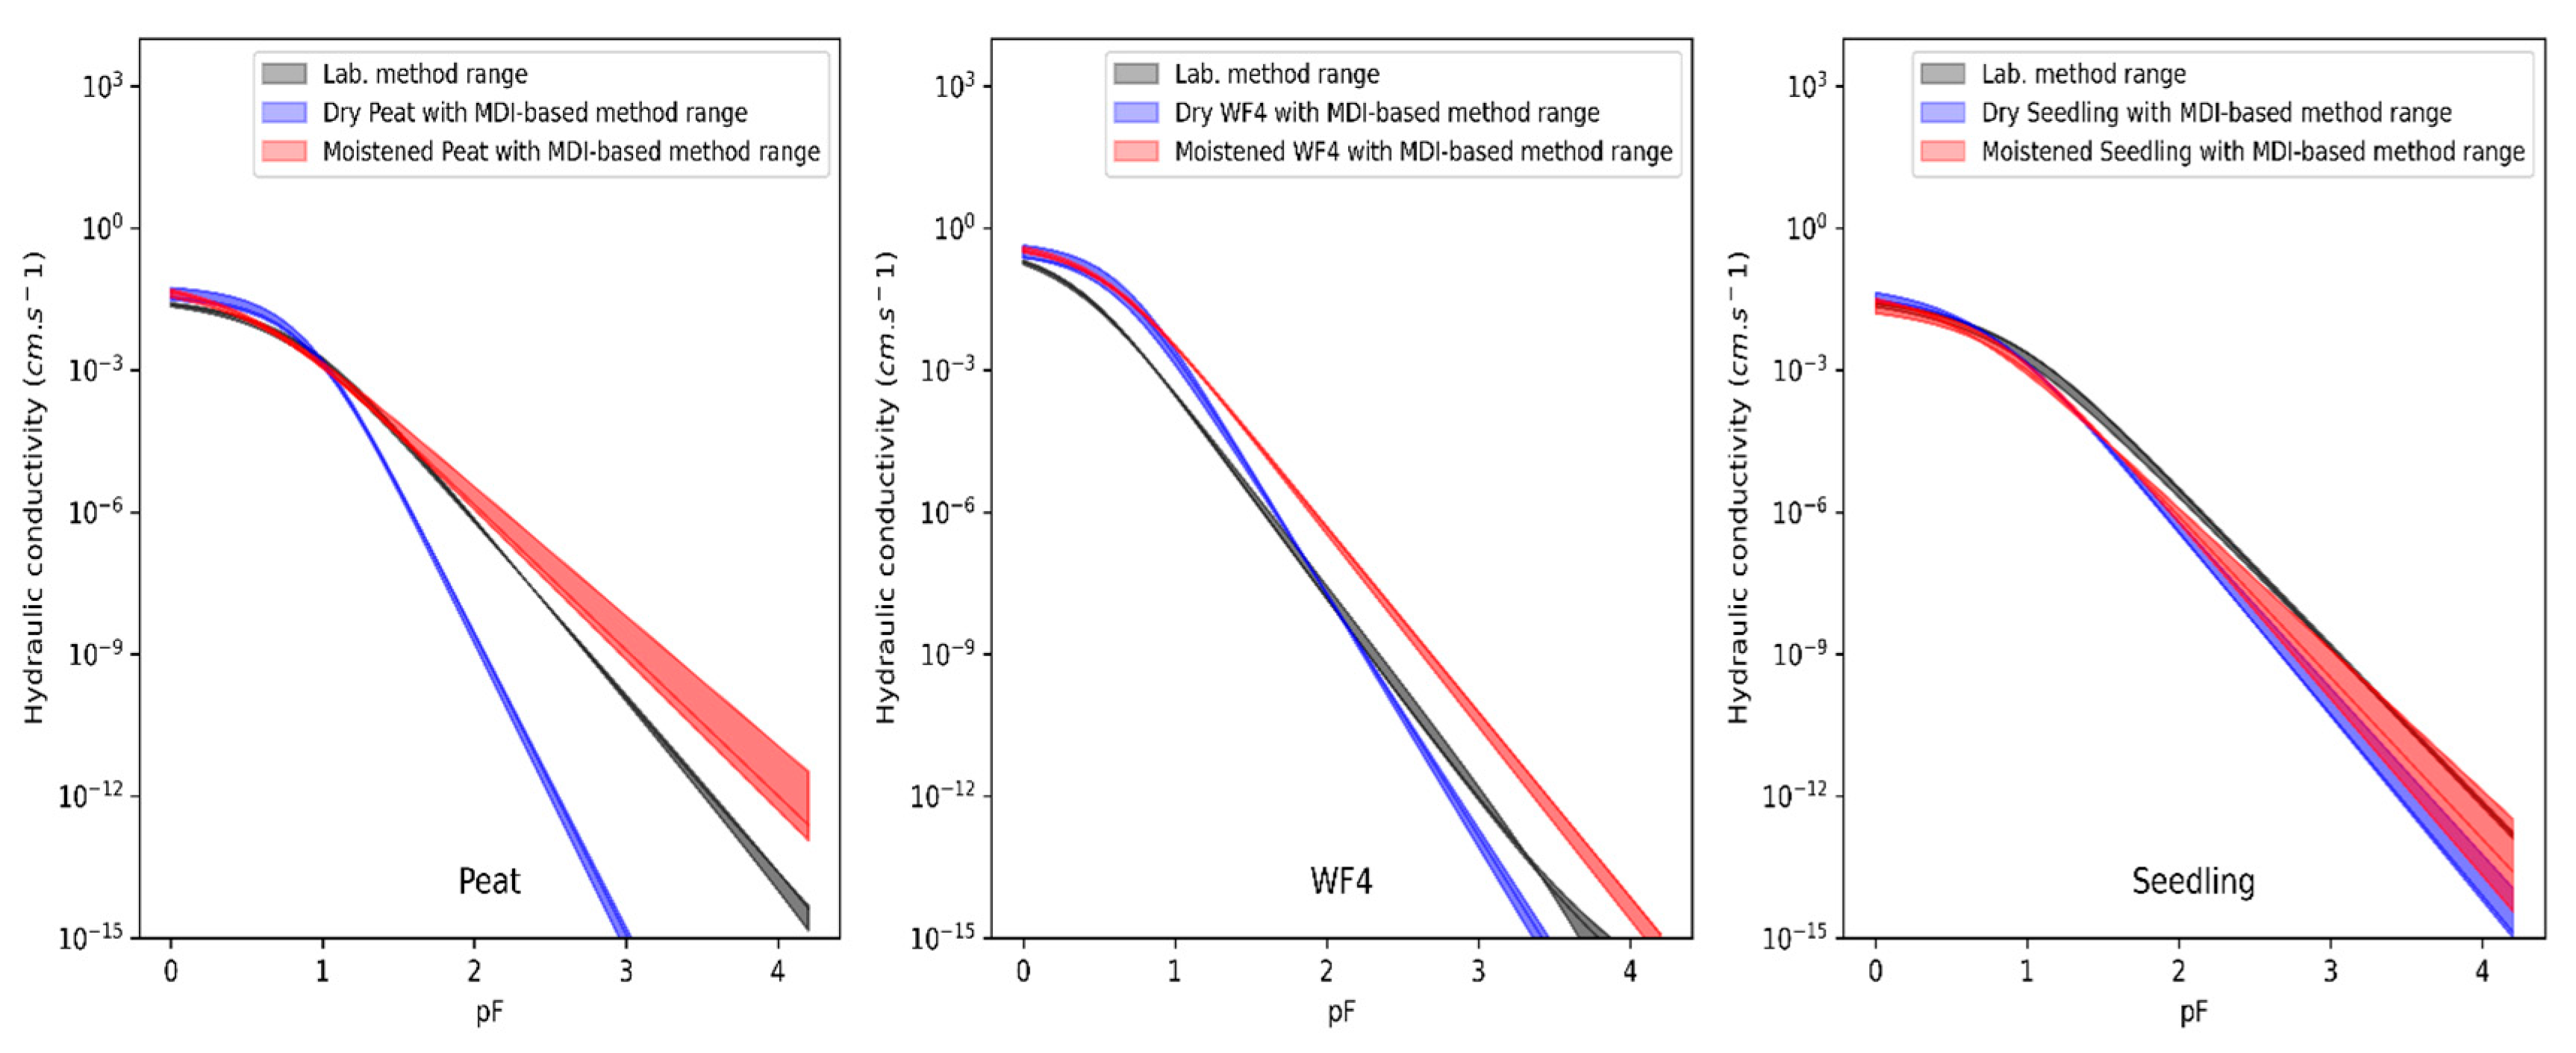
Figure 5 demonstrates the unsaturated hydraulic conductivity curves under partially saturated conditions. Generally, the parameters θr, θs, l, and Ks interact to define these curves. Residual water content (θr) controls the lower asymptote of the unsaturated hydraulic conductivity curve, while saturated water content (θs) determines the upper limit of the curve.

Figure 5.
MDI-based inversion model and laboratory-determined unsaturated hydraulic conductivity curves under dry and wet initial conditions.
Due to small deviations between the measured and MDI-based inversion model saturated hydraulic conductivity, statistically significant differences were not found, except the Ks value of wet Peat with the MDI-based inversion model (Table 9). The Ks value of wet Peat obtained through the MDI-based inversion model was three times higher than the laboratory value. This overestimation by the inversion model for the Peat substrate was also reported by [2]. The authors found that the Ks value of Peat with the inversion model was four times higher than the standard laboratory method. It should be noted that Ks is a single parameter from the whole hydraulic conductivity process. Therefore, the focus is placed on the unsaturated hydraulic conductivity. The unsaturated hydraulic conductivity (Figure 5) showed that all the curves agreed well at pF 0 because the main factor driving the curves in the saturated zone is the Ks rather than the other hydraulic parameters. In other words, Ks serves as a scaling factor for the entire curve. The MDI-based inversion model for Ks values observed in moistened conditions (Peat and WF4) amplified conductivity across the suction range. This indicated more efficient water transport under partially saturated states. The numerical inversion method aligned moderately well with the laboratory method under moistened conditions (R2 = 0.57, −0.43, and 0.99 for Peat, WF4, and Seedling, respectively; Table 10). However, under dry conditions, the curves agreed less well and were underestimated (R2 = 0.30, −0.23, and 0.85 for Peat, WF4, and Seedling, respectively), likely due to insufficient representation of pre-existing water retention forces. The relatively steep transition zones observed in their curves highlight the rapid depletion of conductivity as saturation decreased. The Peat and WF4 substrates exhibited overestimation of conductivity over the entire curve by the MDI-based numerical inversion compared to the laboratory method under moistened conditions. This discrepancy might originate from the higher Ks optimized by the MDI-based numerical inversion, which exaggerated water mobility in the optimized model (Table 9).
Table 9.
Statistical analysis for laboratory-estimated and MDI-based inversion model-estimated l and Ks values.
Table 10.
Statistical measures to compare the MDI-based inversion model curve to the laboratory-produced unsaturated hydraulic conductivity curves.
The zero or nearly negligible pore connectivity parameter (l) values for all Peat and WF4 under the moistened conditions further confirm the limited role of pore connectivity in shaping their conductivity curves. The MDI-based inversion model’s tendency to minimize or nullify (l) indicates that pore connectivity exerts a minimal direct influence on conductivity curve shapes. On the other hand, the statistical analysis (Table 9) shows that the pore connectivity parameter (l) of Peat by the MDI-based inversion model was three times greater than the laboratory-estimated value under the initial water content (dry condition).
Instead, l served as a calibration parameter to adjust for microstructural differences not explicitly modelled. Thus, the interaction between θr, θs, and Ks dominated the curve dynamics.
It should be noted that in our study, the residual water content (θr) was not optimized during the inversion process, based on the fact that the soilless substrates are characterized by hydrocysts. The hydrocysts are the small pores where moisture is stored and cannot be removed by the water retention suction range. Therefore, the θr never reaches zero value. The θr is defined as the water content at which the gradient becomes zero in the unsaturated zone. However, ref. [42] determined θr as the water content at the matric potential of 300 cm. So far, there is not a consensus on the determination of the θr value for soilless substrates. The only way to obtain the θr value is the fitting of a parametric model. The most widespread parametric model for the hydraulic properties of mineral soil and soilless substrate is the Van Genuchten model. A comparative study for the performance of 22 water retention models was carried out by [43]. The author investigated the performance of the models with respect to the soil residual water content (θr), reporting that the Van Genuchten model (traditional) performed worse than the other segmental models. Additionally, a recent research paper on using transient infiltration with the Mini Disk Infiltrometer to determine substrate hydraulic properties was published by [44]. The authors avoided using the Van Genuchten model; instead, they used the Brooks and Corey model [45] to fit the hydraulic curve to the measured data with the purpose of excluding the residual water content (θr).
To conclude, analysis of the unsaturated hydraulic conductivity curves for soilless substrates, as presented in Table 10, revealed distinct performance differences between the MDI-based inversion model and laboratory measurements across Peat, WF4, and Seedling substrates under dry and wet conditions. Dry conditions generally showed poorer fits, suggesting challenges in modelling pre-existing water retention forces. Overall, while the MDI-based inversion model effectively captures conductivity dynamics for some substrates, its limitations under certain conditions highlighted the need for refined parameterization, particularly for θr and pore connectivity (l), to improve accuracy across diverse soilless media.
4. Conclusions
This study evaluated the hydraulic properties of soilless growing media using numerical inversion of Mini Disk Infiltrometer (MDI) data. The results demonstrate strong agreement between simulated and observed infiltration data, particularly for moistened substrates, confirming the model’s potential for estimating key hydraulic parameters. However, discrepancies under initial water content conditions suggest that the MDI-based inversion model requires further refinement to accurately capture substrate water dynamics across a broader moisture range.
Concerning the objectives of the study, the following conclusions can be drawn:
- (1)
- The MDI produced sufficient data to calibrate the simulated infiltration flux versus the measured infiltration flux with R2 > 0.98.
- (2)
- The built-in inverse model of Hydrus-2D was relatively efficient in predicting water dynamics through the substrate, particularly under wet conditions.
- (3)
- The MDI inversion method was able to produce the wetting curve with a minimum R2 of 0.90, and the drying curve with a minimum R2 of 0.92 under wet conditions for the substrates. However, the MDI inversion method showed poor results for unsaturated hydraulic conductivity of Peat (R2 = 0.57) and WF4 (R2 = −0.43) under both dry and wet conditions.
- (4)
- Initial water content of the substrates is recommended to be one-third to one-fourth of the saturated water content before running the MDI experiment.
The MDI inversion method takes only around 1 day to determine the whole water retention curve compared to up to 8.5 days required by the usual DIN approach. Only a Mini Disk Infiltrometer and a 2D simulation model (such as Hydrus-2D) are necessary for the process. Thus, the MDI inversion method can contribute significantly to saving time, and laboratory and personnel effort, thus reducing costs.
A key limitation was the restricted suction range of the MDI (−1 cm to −7 cm), which may not have covered the full spectrum of suction required to characterize substrate water retention properties, particularly at lower water contents. Since soilless substrates exhibit unique hydraulic behaviours due to their organic composition and complex pore structures, future studies should incorporate measurement techniques that extend the suction range to evaluate the model’s accuracy.
The findings have significant implications for substrate hydraulic properties assessment and substrate management in horticulture and controlled environment agriculture. Accurate hydraulic characterization supports optimized water distribution, reduces water waste, and enhances plant growth by ensuring substrates have suitable water-holding capacities and drainage properties. Additionally, the results emphasized the importance of moisture conditioning in infiltration-based measurements, with pre-wetting improving model predictability.
Use of the MDI inversion method has a range of practical applications: researchers and producers of growing media often have to evaluate many different mixtures with different materials and proportions when developing new substrates with certain substrate physical properties. A theoretical assessment of new physical properties for mixtures is hardly possible; instead, the properties must be determined by laboratory analysis. The MDI inversion method may serve as a quick and simple test for these practical problems.
Given the observed discrepancies, we recommend modifying or adjusting the Van Genuchten model by adding tuneable parameters to smoothen the curve near the residual water content zone to better represent the hydraulic properties of soilless substrates, as the residual water content (θr) by the Van Genuchten model sometimes approaches near zero in the inverse modelling. Variations in optimized α and n parameters indicated that the standard formulation may not fully capture the unique properties of these media. Future research should refine parameterization methods or explore alternative models, such as the Brooks and Corey model, or other substrate hydraulic models for possibly improved accuracy. Additionally, investigating the role of pore connectivity and hysteresis effects will enhance the robustness of hydraulic property estimation.
In conclusion, while numerical inversion of MDI data is a promising tool for characterizing soilless substrate hydraulic properties, methodological refinements—such as extending suction ranges and modifying hydraulic models—are needed for greater accuracy.
Author Contributions
H.H.M.: writing—original draft; methodology; visualization; formal analysis. R.A.: supervision; investigation; conceptualization; data curation. D.D.: validation; funding acquisition; project administration. All authors have read and agreed to the published version of the manuscript.
Funding
The study was partly financed by the German Federal Ministry of Food and Agriculture (BMEL), Project promotor FNR, Project NaKuHo, FKZ 2220MT001A.
Data Availability Statement
Data supporting this work will be made available upon request.
Conflicts of Interest
The authors declare that they have no known competing financial interests or personal relationships that could have appeared to influence the work reported in this paper.
References
- Raviv, M.; Lieth, J.H.; Bar-Tal, A. Soilless Culture: Theory and Practice: Theory and Practice; Elsevier: Amsterdam, The Netherlands, 2019; ISBN 0444636978. [Google Scholar]
- Fields, J.S.; Owen, J.S.; Stewart, R.D.; Heitman, J.L.; Caron, J. Modeling water fluxes through containerized soilless substrates using HYDRUS. Vadose Zone J. 2020, 19, e20031. [Google Scholar] [CrossRef]
- Knox, G.W.; Chappell, M. Alternatives to Petroleum-Based Containers for the Nursery Industry: ENH1193/EP454, 11/2011. EDIS 2011, 2011. [Google Scholar] [CrossRef]
- Carlile, W.R.; Cattivello, C.; Zaccheo, P. Organic growing media: Constituents and properties. Vadose Zone J. 2015, 14, vzj2014-09. [Google Scholar] [CrossRef]
- Fonteno, W.C. Problems and considerations in determining the physical properties of horticultural substrates. Acta Hortic. 1993, 342, 197–204. [Google Scholar] [CrossRef]
- Barrett, G.E.; Alexander, P.D.; Robinson, J.S.; Bragg, N.C. Achieving environmentally sustainable growing media for soilless plant cultivation systems—A review. Sci. Hortic. 2016, 212, 220–234. [Google Scholar] [CrossRef]
- Chamindu Deepagoda, T.; Chen Lopez, J.C.; Møldrup, P.; de Jonge, L.W.; Tuller, M. Integral parameters for characterizing water, energy, and aeration properties of soilless plant growth media. J. Hydrol. 2013, 502, 120–127. [Google Scholar] [CrossRef]
- Bilderback, T.; Boyer, C.; Chappell, M.; Fain, G.; Fare, D.; Gilliam, C.; Jackson, B.E.; Lea-Cox, J.; LeBude, A.V.; Niemiera, A. Best Management Practices: Guide for Producing Nursery Crops; Southern Nursery Association: Acworth, GA, USA, 2013. [Google Scholar]
- Turunen, M.; Hyväluoma, J.; Heikkinen, J.; Keskinen, R.; Kaseva, J.; Koestel, J.; Rasa, K. Quantifying physical properties of three Sphagnum-based growing media as affected by drying–wetting cycles. Vadose Zone J. 2019, 18, 190033. [Google Scholar] [CrossRef]
- Woznicki, T.; Jackson, B.E.; Sønsteby, A.; Kusnierek, K. Wood fiber from Norway spruce—A stand-alone growing medium for hydroponic strawberry production. Horticulturae 2023, 9, 815. [Google Scholar] [CrossRef]
- Anlauf, R.; Muhammed, H.H.; Reineke, T.; Daum, D. Water retention properties of wood fiber based growing media and their impact on irrigation strategy. Acta Hortic. 2024, 227–236. [Google Scholar] [CrossRef]
- Naasz, R.; Michel, J.-C.; Charpentier, S. Measuring hysteretic hydraulic properties of peat and pine bark using a transient method. Soil Sci. Soc. Am. J. 2005, 69, 13–22. [Google Scholar] [CrossRef]
- Angulo-Jaramillo, R.; Vandervaere, J.-P.; Roulier, S.; Thony, J.-L.; Gaudet, J.-P.; Vauclin, M. Field measurement of soil surface hydraulic properties by disc and ring infiltrometers: A review and recent developments. Soil Tillage Res. 2000, 55, 1–29. [Google Scholar] [CrossRef]
- Wooding, R.A. Steady infiltration from a shallow circular pond. Water Resour. Res. 1968, 4, 1259–1273. [Google Scholar] [CrossRef]
- White, I.; Sully, M.J. Macroscopic and microscopic capillary length and time scales from field infiltration. Water Resour. Res. 1987, 23, 1514–1522. [Google Scholar] [CrossRef]
- Reynolds, W.D.; Elrick, D.E. Determination of hydraulic conductivity using a tension infiltrometer. Soil Sci. Soc. Am. J. 1991, 55, 633–639. [Google Scholar] [CrossRef]
- Ventrella, D.; Losavio, N.; Vonella, A.V.; Leij, F.J. Estimating hydraulic conductivity of a fine-textured soil using tension infiltrometry. Geoderma 2005, 124, 267–277. [Google Scholar] [CrossRef]
- Báťková, K.; Miháliková, M.; Matula, S. Hydraulic properties of a cultivated soil in temperate continental climate determined by mini disk infiltrometer. Water 2020, 12, 843. [Google Scholar] [CrossRef]
- Richards, L.A. Capillary conduction of liquids through porous mediums. Physics 1931, 1, 318–333. [Google Scholar] [CrossRef]
- VDLUFA (Association of German Agricultural Analytic and Research Institutes). Methods Book I “Soil Analysis” (1st–6th Supplement Delivery), 4th ed.; VDLUFA-Verlag: Darmstadt, Germany, 1991. [Google Scholar]
- DIN EN 13039; Soil Improvers and Growing Media—Determination of Organic Content and Ash. German Version. Beuth: Berlin, Germany, 2009.
- DIN EN 13041; Soil Improvers and Growing Media-Determination of Physical Properties-Dry Bulk Density, Air Volume, Water Volume, Shrinkage Value and Total Pore Space. European Committee for Standardization: Brussels, Belgium, 2011.
- DIN 19683; Methods of Soil Investigations for Agricultural Engineering—Physical Laboratory Tests-Part 9: Determination of the Saturated Hydraulic Water Conductivity in the Cylindrical Core-Cutter. Beuth Verlag GmbH: Berlin, Germany, 1998.
- DIN EN ISO 11274; Soil Quality—Determination of the Water-Retention Characteristic—Laboratory Methods. International Organization for Standardization: Geneva, Switzerland, 2019.
- Anlauf, R.; Rehrmann, P.; Schacht, H. Simulation of water uptake and redistribution in growing media during ebb-and-flow irrigation. J. Hortic. For. 2012, 4, 8–21. [Google Scholar] [CrossRef]
- Šimůnek, J.; Kodešová, R.; Gribb, M.M.; van Genuchten, M.T. Estimating hysteresis in the soil water retention function from cone permeameter experiments. Water Resour. Res. 1999, 35, 1329–1345. [Google Scholar] [CrossRef]
- Warrick, A.W. Models for disc infiltrometers. Water Resour. Res. 1992, 28, 1319–1327. [Google Scholar] [CrossRef]
- Šimůnek, J.; Šejna, M.; van Genuchten, M.T. The HYDRUS-2D Software Package for Simulating the Two-Dimensional Movement of Water, Heat, and Multiple Solutes in Variably-Saturated Media: Version 2.0; US Salinity Laboratory, Agricultural Research Service, US Department of Agriculture: Riverside, CA, USA, 1999. [Google Scholar]
- van Genuchten, M.T. A closed-form equation for predicting the hydraulic conductivity of unsaturated soils. Soil Sci. Soc. Am. J. 1980, 44, 892–898. [Google Scholar] [CrossRef]
- Mualem, Y. A new model for predicting the hydraulic conductivity of unsaturated porous media. Water Resour. Res. 1976, 12, 513–522. [Google Scholar] [CrossRef]
- Šimůnek, J.; van Genuchten, M.T. Estimating unsaturated soil hydraulic properties from tension disc infiltrometer data by numerical inversion. Water Resour. Res. 1996, 32, 2683–2696. [Google Scholar] [CrossRef]
- Simunek, J.; Wang, D.; Shouse, P.J.; van Genuchten, M.T. Analysis of field tension infiltrometer data by parameter estimation. Int. Agrophysics 1998, 12, 167–180. [Google Scholar]
- Muhammed, H.H.; Schumm, L.; Anlauf, R.; Reineke, T.; Daum, D. Validity of a Centrifuge-Based Method for Determining the Water Retention Curve of Growing Media. Horticulturae 2024, 10, 1255. [Google Scholar] [CrossRef]
- Šimůnek, J.; Angulo-Jaramillo, R.; Schaap, M.G.; Vandervaere, J.-P.; van Genuchten, M.T. Using an inverse method to estimate the hydraulic properties of crusted soils from tension-disc infiltrometer data. Geoderma 1998, 86, 61–81. [Google Scholar] [CrossRef]
- Marquardt, D.W. An algorithm for least-squares estimation of nonlinear parameters. J. Soc. Ind. Appl. Math. 1963, 11, 431–441. [Google Scholar] [CrossRef]
- Londra, P.A. Simultaneous determination of water retention curve and unsaturated hydraulic conductivity of substrates using a steady-state laboratory method. HortScience 2010, 45, 1106–1112. [Google Scholar] [CrossRef]
- Cannavo, P.; Hafdhi, H.; Michel, J.-C. Impact of root growth on the physical properties of peat substrate under a constant water regimen. HortScience 2011, 46, 1394–1399. [Google Scholar] [CrossRef]
- Kerloch, E.; Michel, J.-C. Pore tortuosity and wettability as main characteristics of the evolution of hydraulic properties of organic growing media during cultivation. Vadose Zone J. 2015, 14, vzj2014-11. [Google Scholar] [CrossRef]
- Naasz, R.; Michel, J.-C.; Charpentier, S. Water repellency of organic growing media related to hysteretic water retention properties. Eur. J. Soil Sci. 2008, 59, 156–165. [Google Scholar] [CrossRef]
- van Genuchten, M.T.; Nielsen, D.R. On describing and predicting the hydraulic properties. Ann. Geophys. 1985, 3, 615–628. [Google Scholar]
- Schaap, M.G.; van Genuchten, M.T. A modified Mualem–van Genuchten formulation for improved description of the hydraulic conductivity near saturation. Vadose Zone J. 2006, 5, 27–34. [Google Scholar] [CrossRef]
- Fonteno, W.C.; Nelson, P.V. Physical properties of and plant responses to rockwool-amended media. J. Am. Soc. Hortic. Sci. 1990, 115, 375–381. [Google Scholar] [CrossRef]
- Du, C. Comparison of the performance of 22 models describing soil water retention curves from saturation to oven dryness. Vadose Zone J. 2020, 19, e20072. [Google Scholar] [CrossRef]
- Wolcott, C.C.; Owen, J.S.; Stewart, R.D. (Eds.) Quantifying functional pore sizes in pine bark growing media. In Proceedings of the I International Symposium on Growing Media, Compost Utilization and Substrate Analysis for Soilless Cultivation, Québec, QC, Canada, 11 June 2023; International Society for Horticultural Science: Leuven, Belgium, 2023; pp. 215–226. [Google Scholar]
- Brooks, R.H.; Corey, A. Hydraulic Properties of Porous Media; Colorado State University: Fort Collins, CO, USA, 1964; ISBN 1084094258. [Google Scholar]
Disclaimer/Publisher’s Note: The statements, opinions and data contained in all publications are solely those of the individual author(s) and contributor(s) and not of MDPI and/or the editor(s). MDPI and/or the editor(s) disclaim responsibility for any injury to people or property resulting from any ideas, methods, instructions or products referred to in the content. |
© 2025 by the authors. Licensee MDPI, Basel, Switzerland. This article is an open access article distributed under the terms and conditions of the Creative Commons Attribution (CC BY) license (https://creativecommons.org/licenses/by/4.0/).