1. Introduction
Detrimental reservoir eutrophication often caused by nutrients affects water use [
1,
2]. Reservoir water quality managers often limit nutrients, such as phosphorus (P), to the reservoir. This is difficult, as P comes from many sources, including dust particulate matter [
1,
3,
4,
5,
6,
7,
8]. Often, these approaches have minimal impact to water quality [
9]. One potential reason is sediments that can release P to the water column [
9,
10,
11,
12,
13,
14] reducing the effectiveness of other measures [
15]. Reservoirs are susceptible to nutrient recycling because of sediment delta re-cutting and residence times [
16].
Most reservoirs do not have any, or at best, have limited data on nutrients in the sediments [
17]. Even though P is a major driver of eutrophication, the literature has minimal information on sediment P distributions [
18], likely because of the difficulty in collecting these data [
1,
19]. For most reservoirs, the sediment delta is of higher concern because of the annual drawdown and sediment re-cutting cycle [
20,
21]. Fabre [
22] showed that sediments in the reservoir delta can be resuspended by adding nutrients to the water column. Most reported sediment P studies use a few core samples or laboratory experiments [
12,
23,
24,
25,
26], and cannot evaluate spatial distribution patterns or impacts.
Deer Creek Reservoir (DCR) is an important water supply reservoir in northern Utah. The reservoir was completed in the early 1940s [
27]. Owing to DCR’s importance as a water supply reservoir, researchers and government agencies have performed several water quality studies [
28,
29,
30,
31,
32].
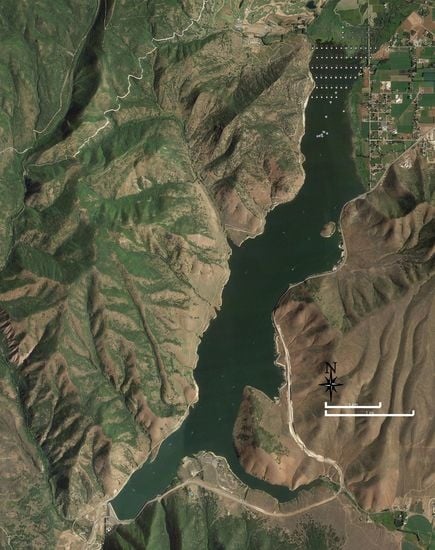
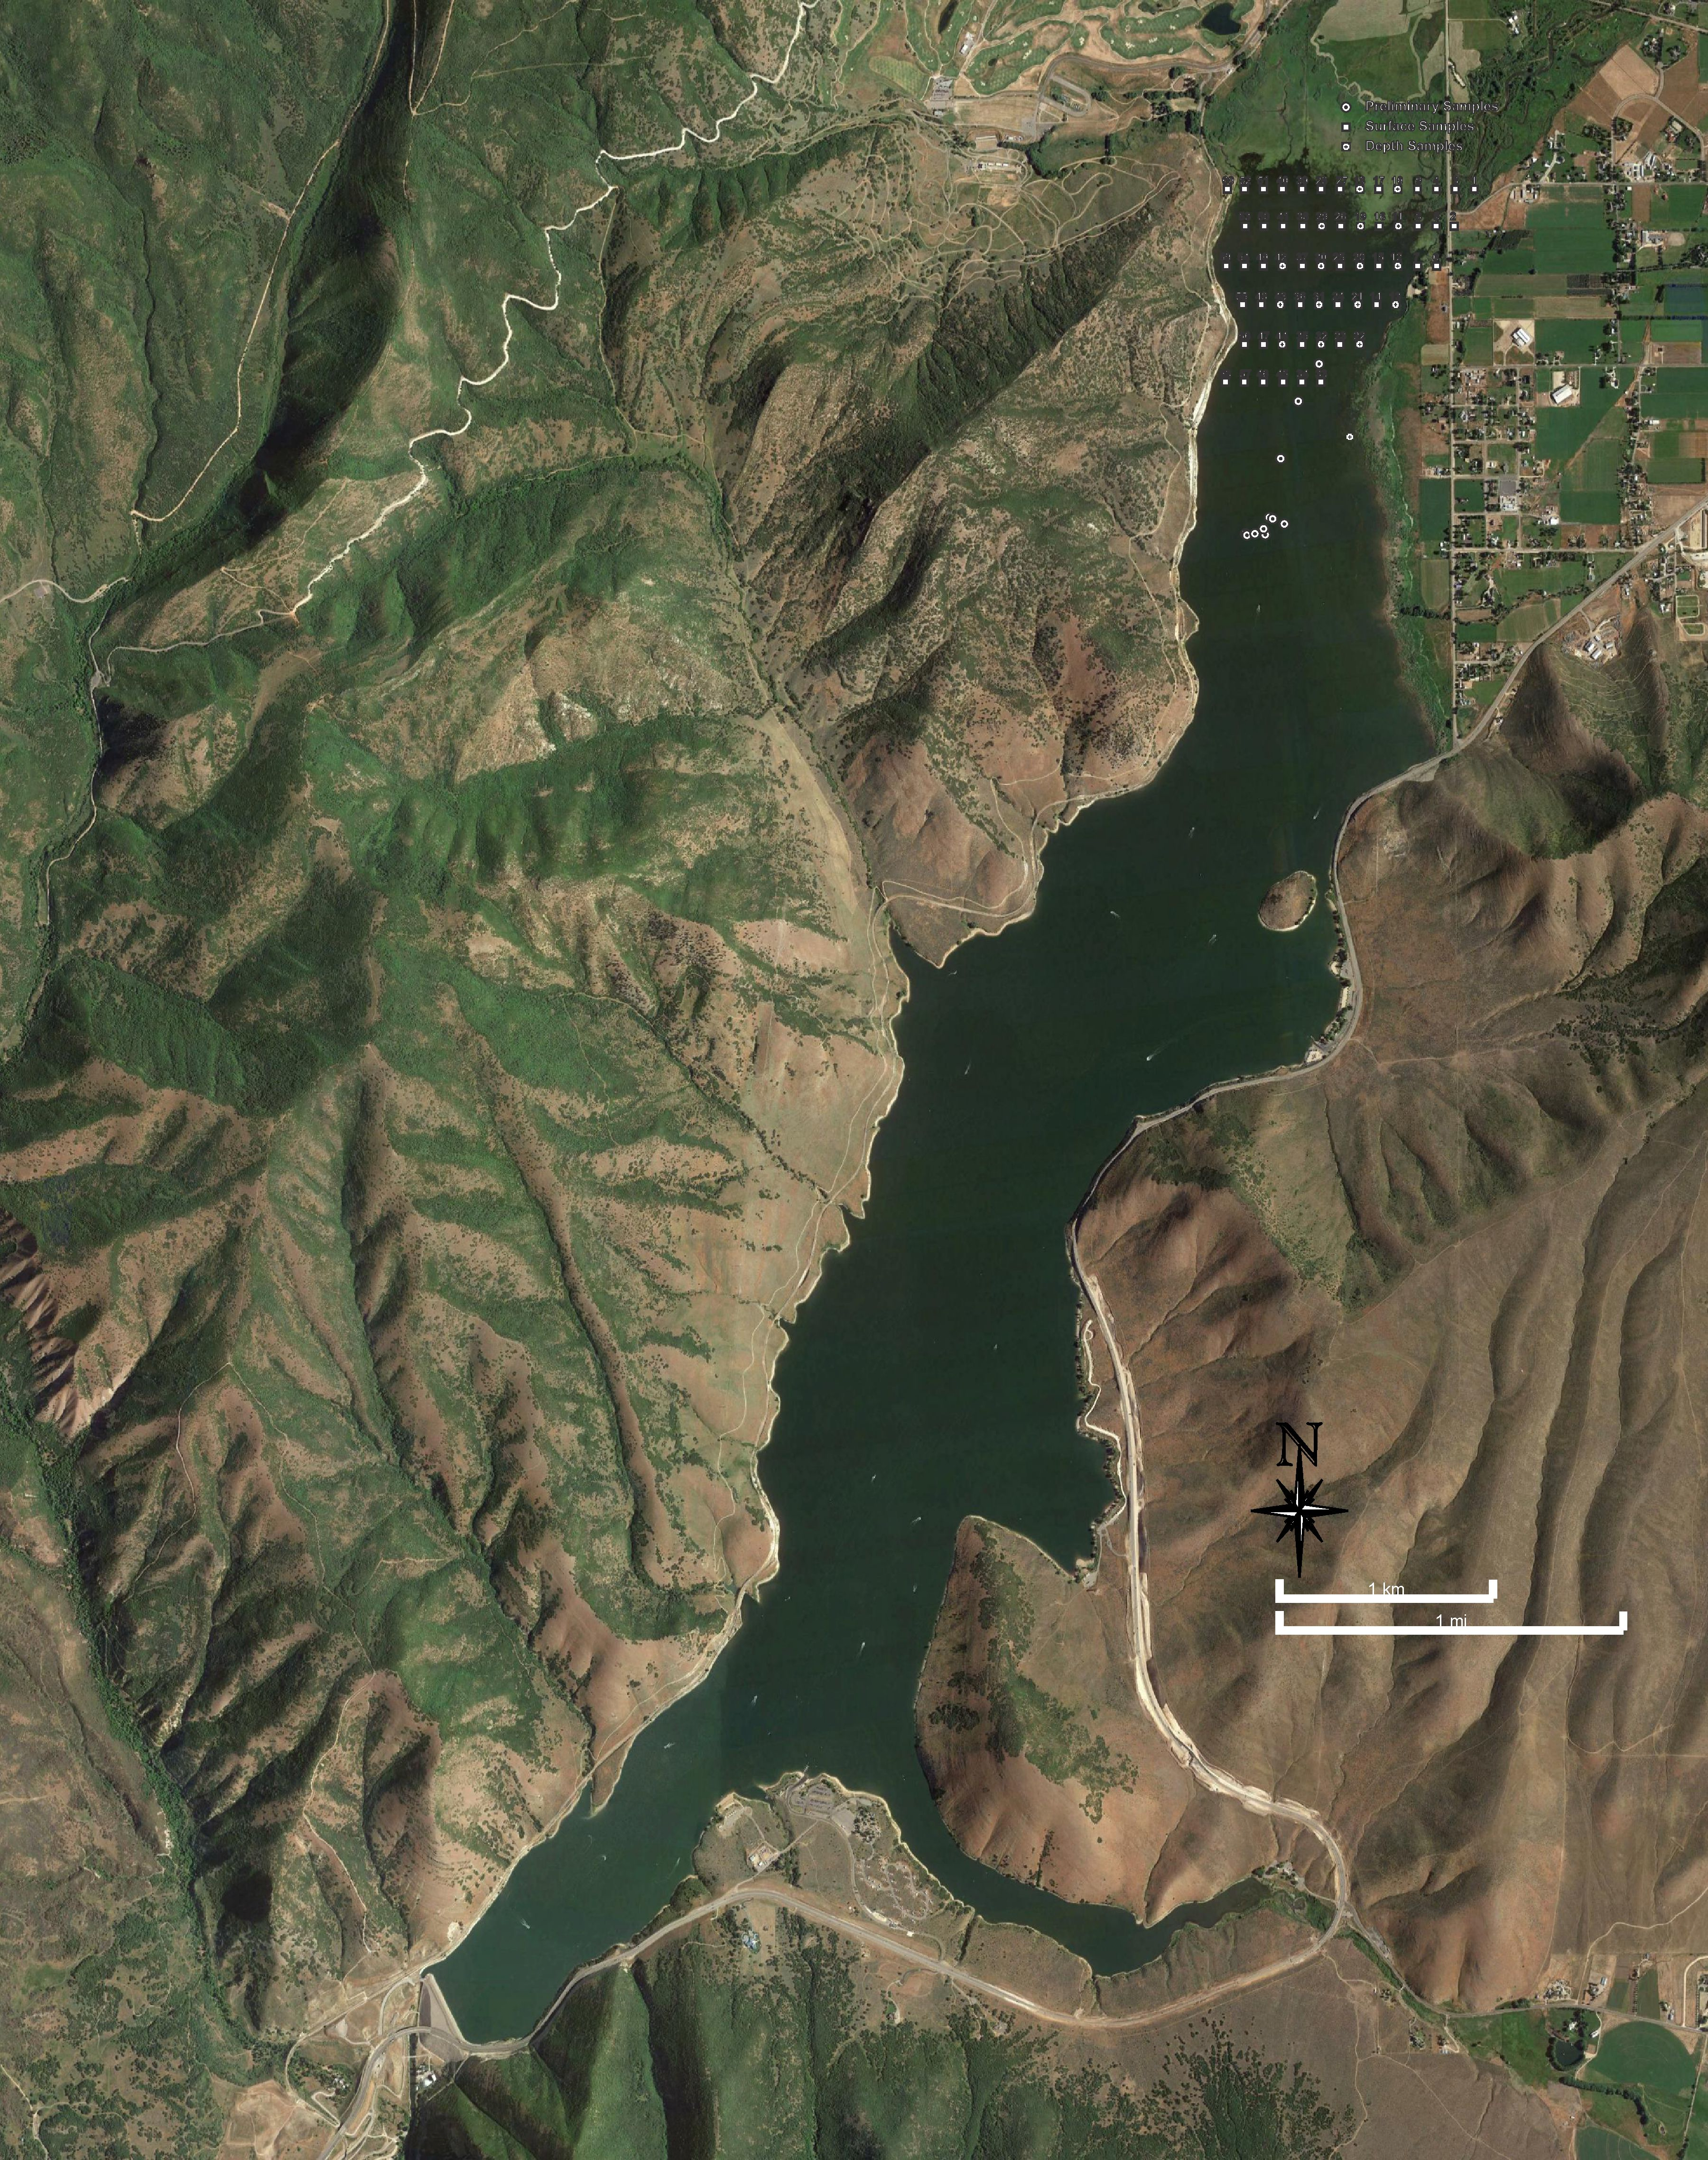
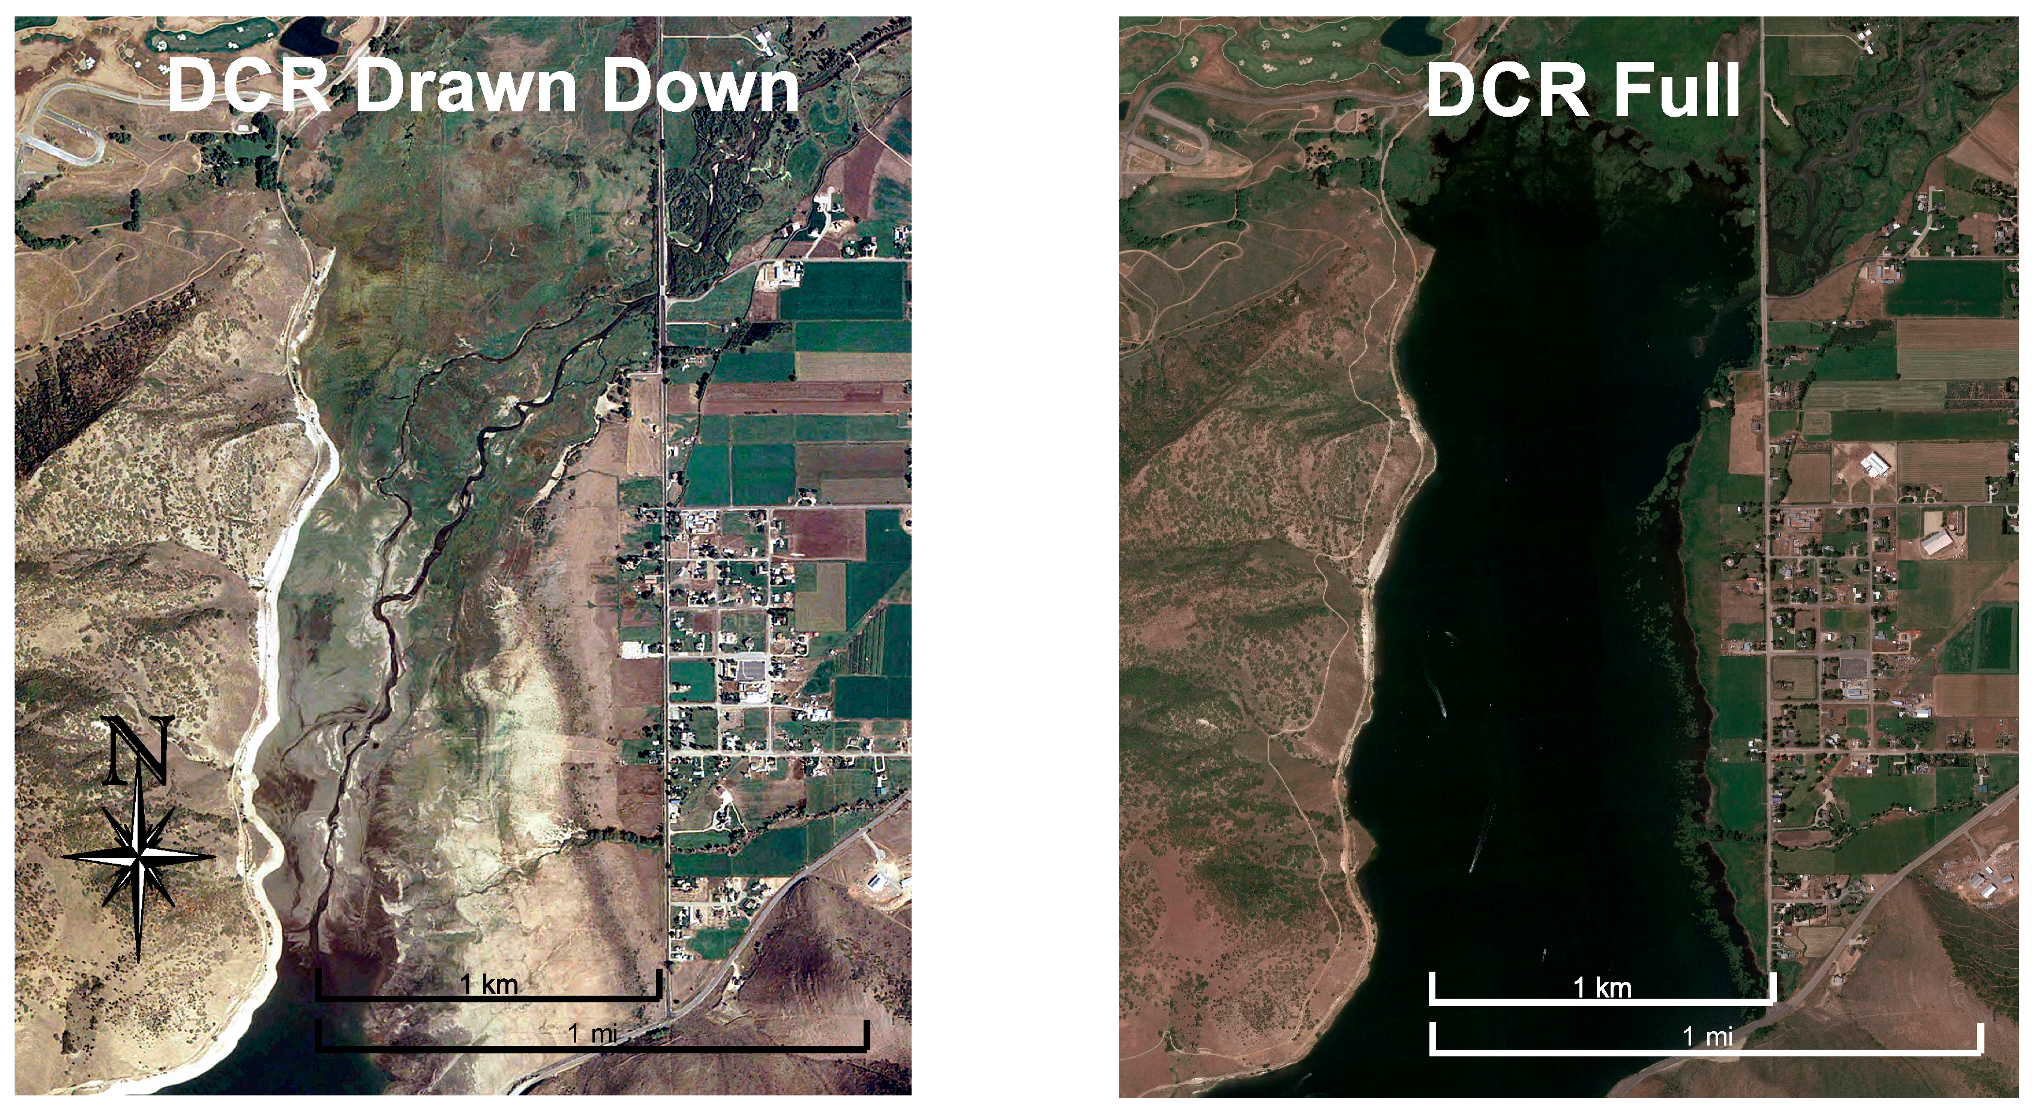
The DCR drawdown for dam reconstruction allowed access to approximately 5 km of the sediment delta that had previously been inundated. This exposed area is shown in
Figure 1, and it allowed access to most of the sediment delta. The drawdown, shown in
Figure 1, exposed over 5 km of sediments. This allowed for easier sample collection on a high-resolution grid, over a large portion of the sediment delta. There has been another study that evaluated the P distribution in DCR sediments, but it only used 4 locations [
33,
34]. The previous study did not evaluate spatial distributions, even though the data indicated that there were variations [
34]. A historical DCR drawdown in 2001, recut the sediment delta and caused taste and odor problems because of the resulting geosmin release [
32]. This indicated that delta re-cutting impacts DCR water quality.
Our work provides field data that is useful for understanding how delta sediments affect nutrient dynamics within the DCR, by quantifying the types and amounts of different P pools across the delta, along with their spatial distribution. We expect this data set will help researchers to generalize this work to other reservoirs with similar problems, because this data set provides a more detailed characterization of P distribution at a higher spatial resolution than normally available. This data set should help researchers address an important area of concern in reservoirs.
We provided this data set, with detailed method descriptions, to the community as a resource to support research into this important topic. Better understanding of the impacts of internal P cycling, and the role played by sediment resuspension and recycling can help reservoir and water quality managers to better address nutrient issues. This work addresses resuspension by providing a high-resolution data set, which includes fractionation results. Understanding P fractionation is important, as much of the P in sediments is not available to the water column on resuspension. We compare our results from samples collected on an exposed sediment delta (exposed for about 1 year) to results from about 25 years earlier, using submerged samples collected in the hypolimnion [
34] to provide a very basic insight into potential differences. Both sets of samples were collected in the same region of the reservoir.
3. Results
We analyzed 161 solutions for P concentrations. Of the 91 samples, we analyzed 72 for water-soluble P and Fr.W only. We completed a full fractionation for the remaining 19 samples. Complete fractionation determines P content in all five pools. We provide the complete results and coordinates for all sample locations in the electronic
Supplemental File associated with this manuscript.
3.1. Fr.W (Water Soluable Fraction)
In the 72 samples analyzed only for Fr.W, the average P concentration was 5.19 × 10⁻³ and 5.12 × 10⁻³ mg/g dry sediment, for the 72 samples only analyzed for Fr.W and for all the samples, respectively. The standard deviation, σ, of the Fr.W only samples was 3.95 × 10⁻³, which was relatively high ~76% of average. This high standard deviation indicated variation in P-distribution.
Table 2,
Table 3 and
Table 4 present P with variations by depth, longitudinally, and laterally, respectively.
Table 2 presents average Fr.W concentration data by depth (6 inches, 1 foot, and 2 feet) and it indicates a decreasing trend with depth.
In
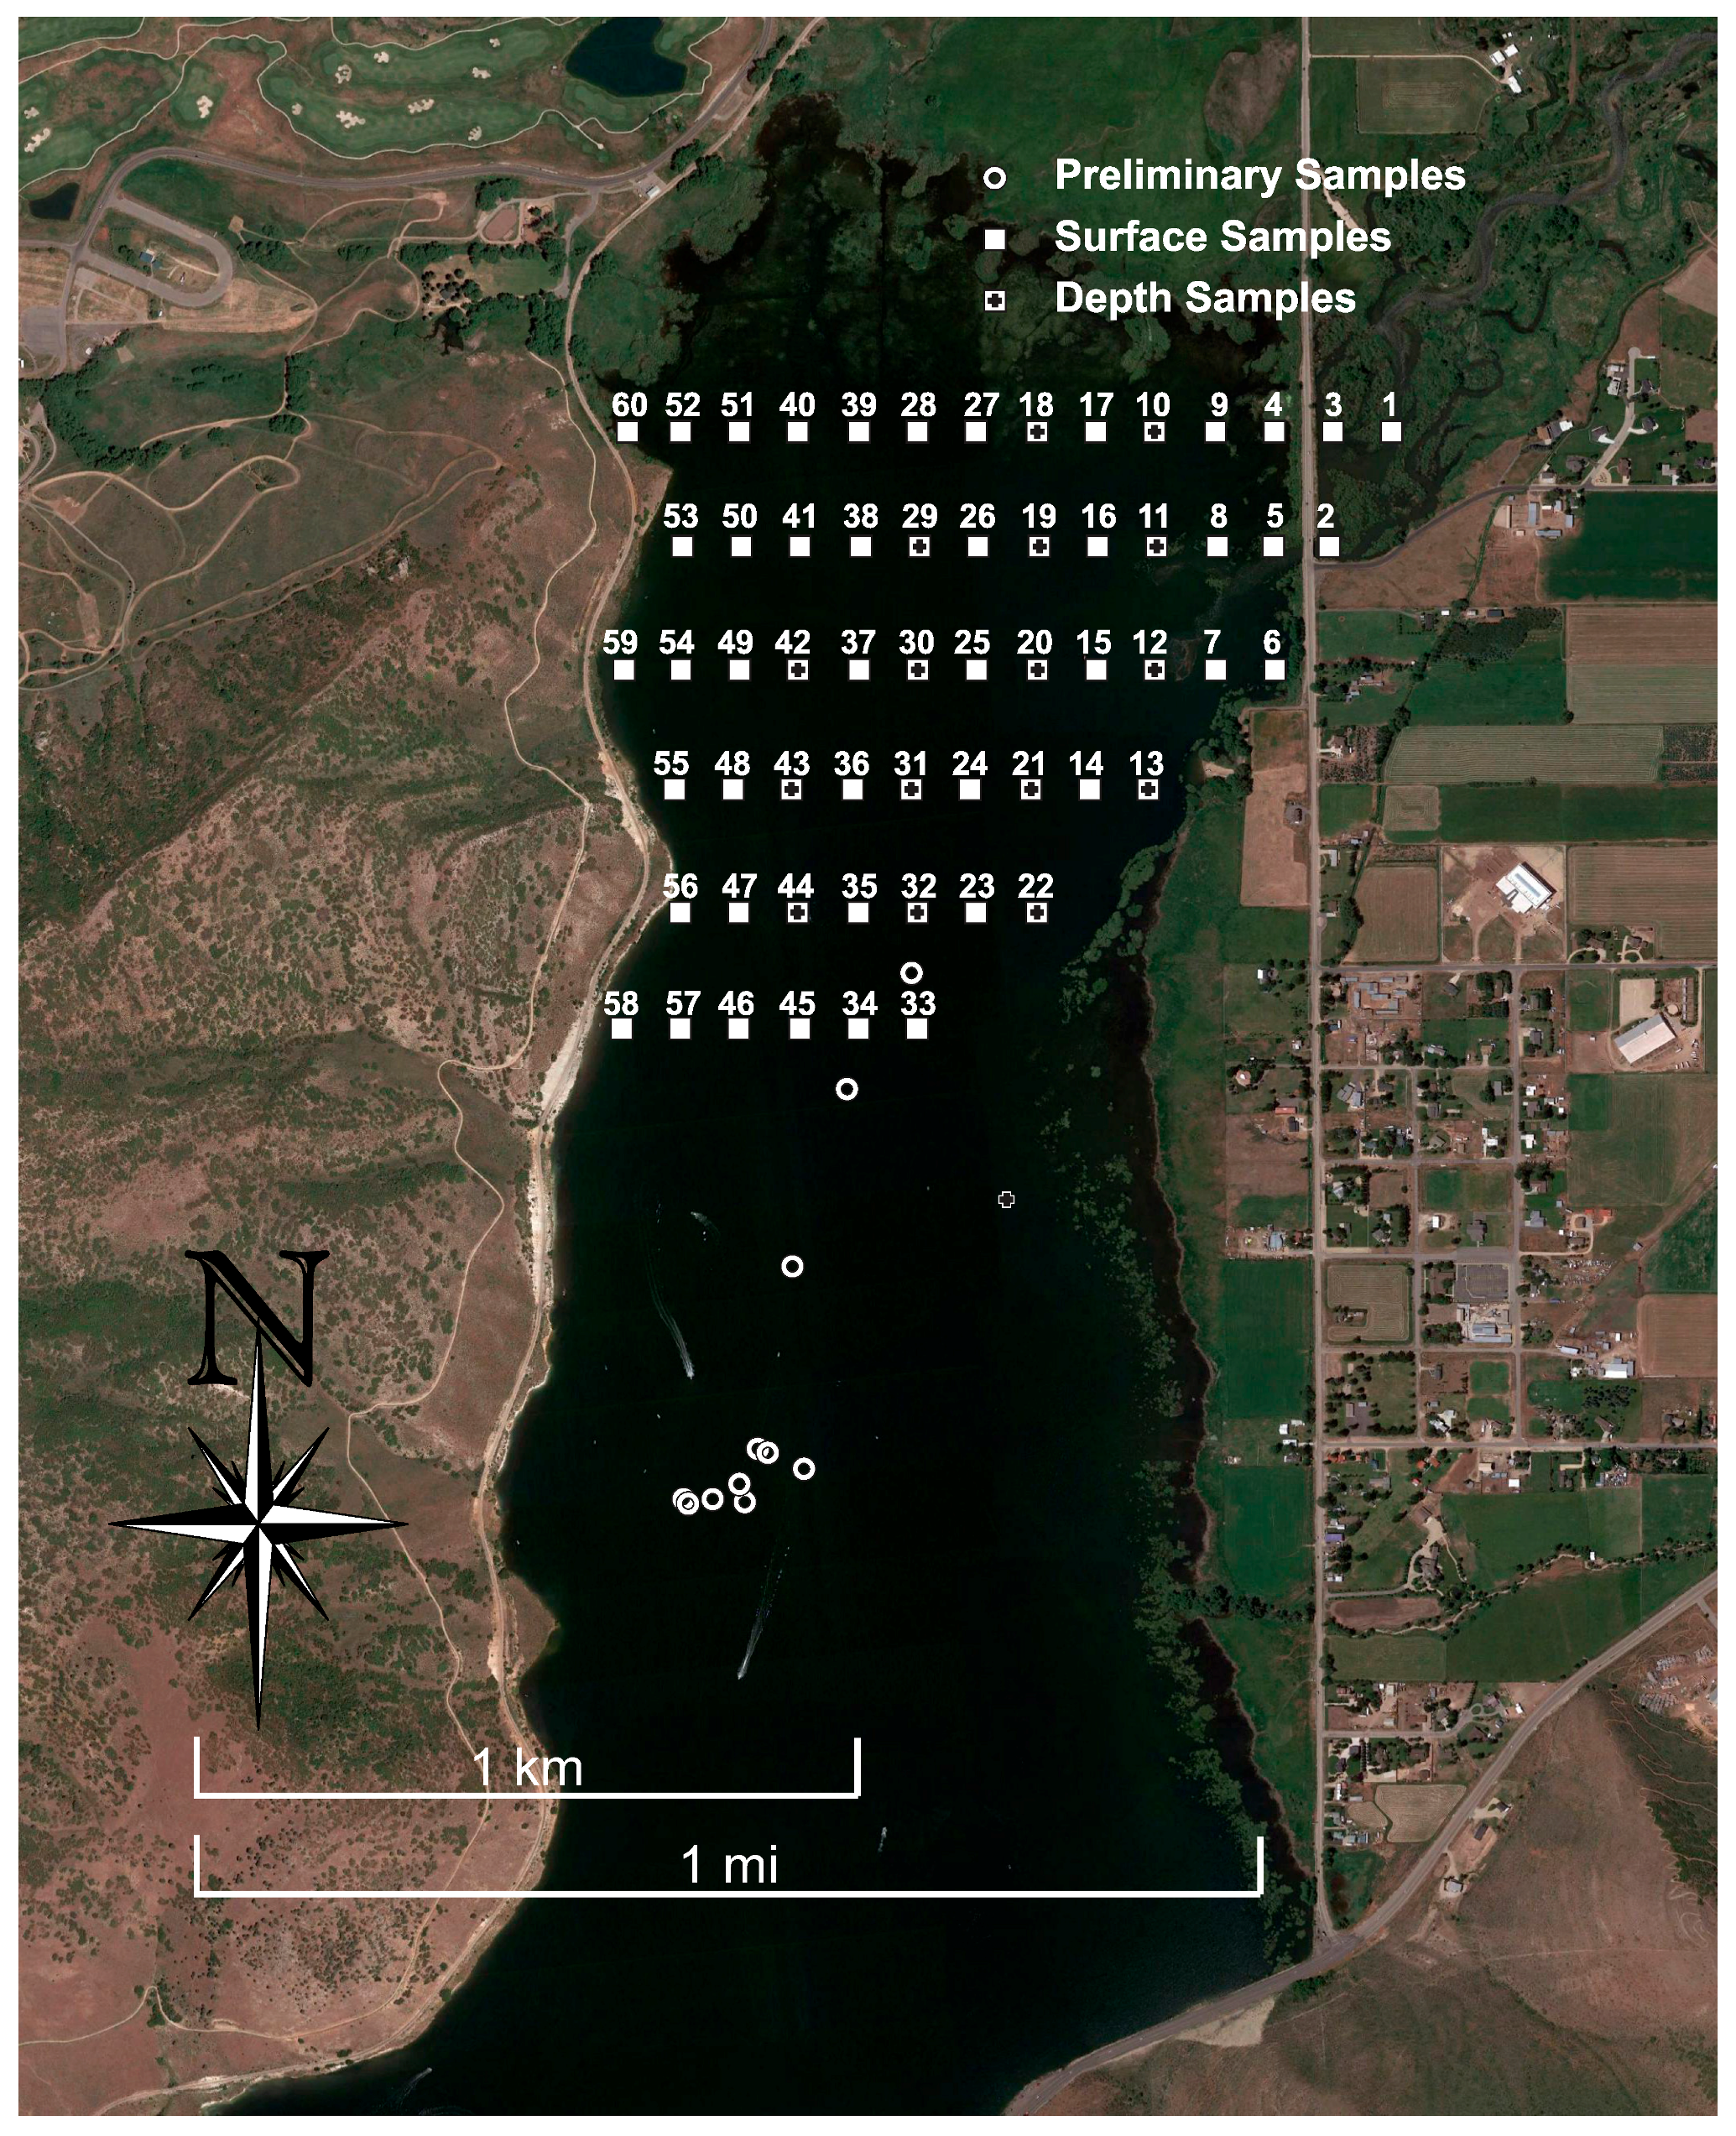
Table 3, the sampling area is presented as transects (as shown in
Figure 1), with the first being the most upstream, or nearest in the reservoir inflow. By observation, the data showed a general trend of decreasing concentrations in the downstream direction, though transect 2 is a notable exception.
Table 4 presents the data spatially organized by columns (as shown in
Figure 1), with column 1 on the right when facing upstream. In general, these data showed higher concentrations on the right side and lower concentrations on the left side across the width of the delta.
Table 2,
Table 3 and
Table 4 indicate directional trends. Whilst there are various potential processes that could cause these trends, we did not collect data to explore this question.
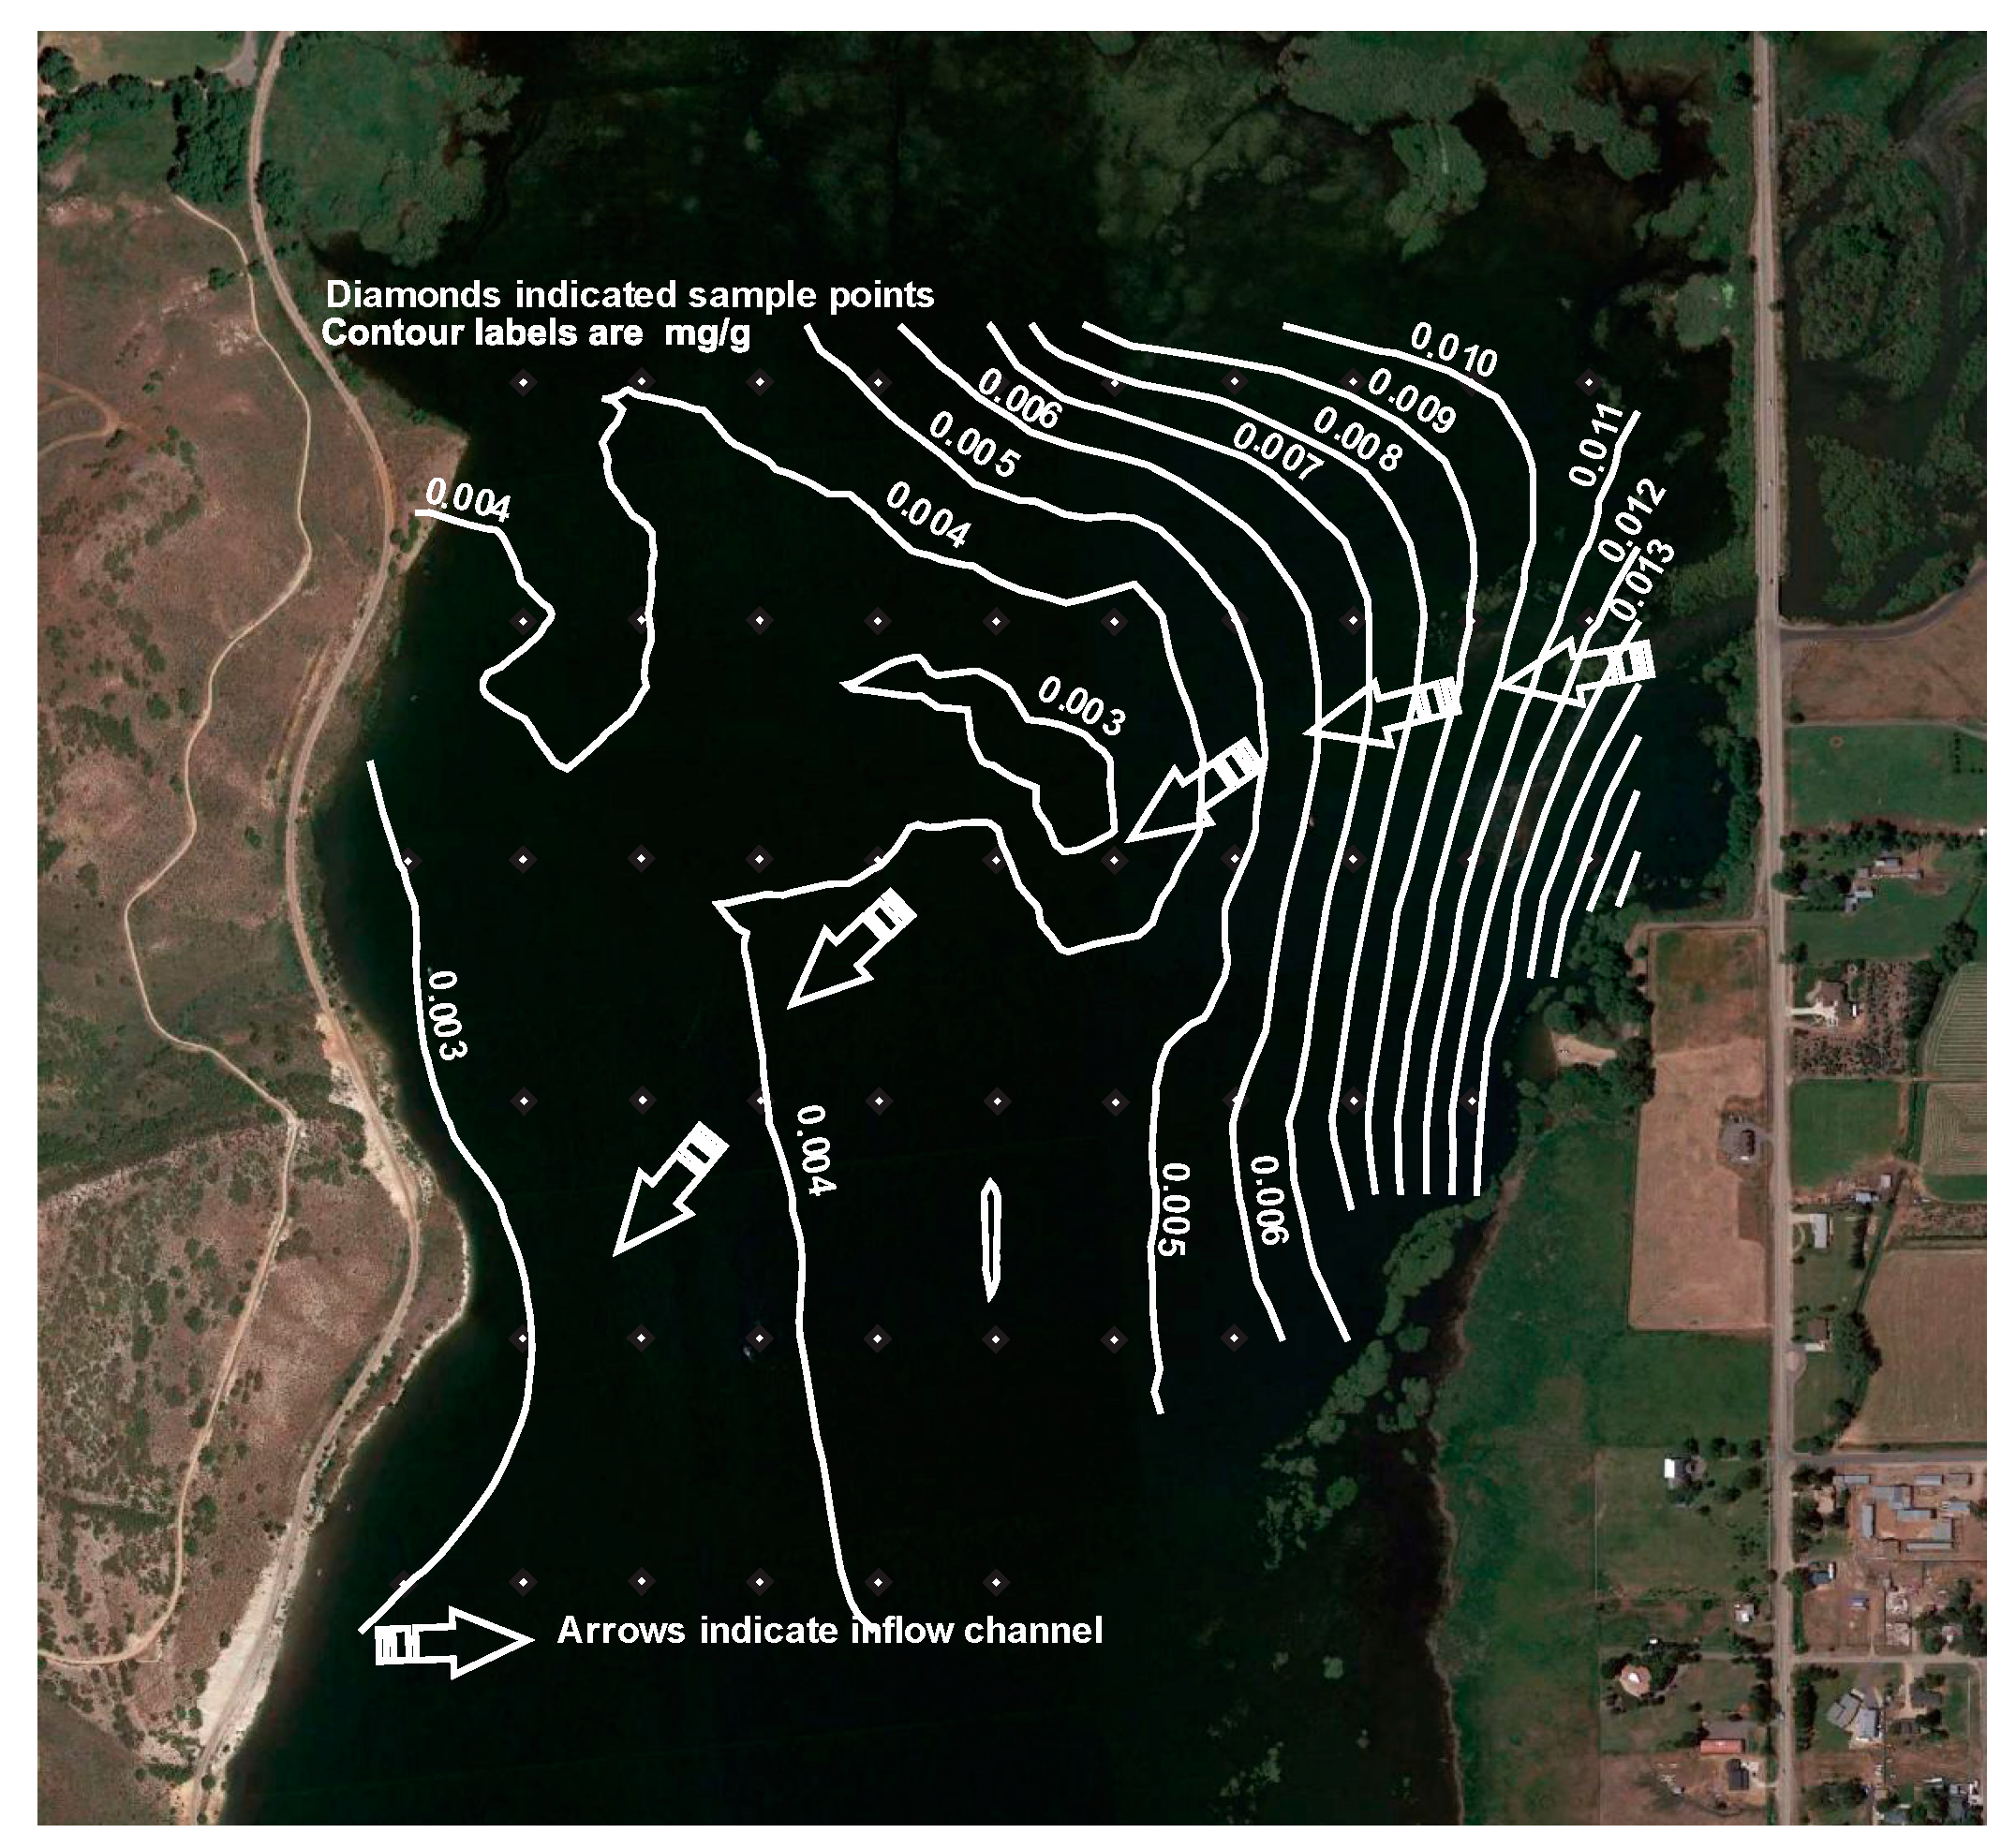
We estimated a continuous P-distribution map to visualize P concentration across the delta, we used kriging implemented in the Groundwater Modeling System (GMS) [
45]. Using Kriging, we interpolated an estimated Fr.W P distribution map using the Fr.W P concentrations (
n = 55).
Figure 3 shows this distribution as contour data.
The direction trends implied by
Table 3 and
Table 4, are more clearly shown in
Figure 3. P-concentration profiles seemed to follow the existing talweg. Maps of other P-pools were similar. We attribute the difference to the smaller number of samples available to guide the estimation. We do not present these maps, as they are based on a relatively few number of samples. However, we provide the data for other researchers to explore these issues.
This work is preliminary in nature, and further geostatistical analysis should confirm and expand on some of these initial findings regarding anisotropy of P content across the delta, and the potential causes of such variation. Additional study could use co-kriging or other methods to better estimate other P-fraction concentrations at sample locations, where we only measured the Fr.W fraction.
3.2. Complete Fractionation
Table 5 presents the average P concentrations in each of the five fractions. We performed complete fractionation on 19 samples. We provide the complete data set in the electronic supplement.
The sediments, on average, contained much less P in the water soluble (Fr.W) and KCl-extractable pools than in the other pools, whilst there was significantly more (over two orders of magnitude) in the NaOH-extractable, the HCl-extractable, and the residual P pools. Apatite P, extracted with HCl (Fr.HCl), was present in significant amounts, as expected from results of previous work [
33,
34], and because these sediments were largely calcareous [
32]. The residual P (organic, plus P not extracted in previous steps) was the largest fraction present.
3.3. Comparison with Previous Study
Table 6 compares average sediment P concentrations for similar fractions of the current and the previous Messer DCR study [
34]. Concentrations reported from Messer et al. [
34] (their
Table 2) were from their upper sampling location, which is likely within our study area based on their map. The fractionation schemes were slightly different as shown in
Table 6, not only in extractants used, but also in other aspects, such as shaking time and quantity of sediment extracted. Additionally, sediments collected in the previous study [
34] were taken from the bottom of the reservoir, whilst those used in this study were taken from the exposed delta. Obviously, there is a substantial time difference (~25 years) between the two studies, and several changes have occurred (e.g., completion of the Jordanelle Reservoir upstream, and limitations on influent P based on management reforms), which could have affected P content of sediments.
As shown in
Table 6, Messer et al., [
34] performed one step (Fr.NH
4Cl), whilst we performed two steps (Fr.W and Fr.KCl) to start the fractionation. The sediments contained much less P from these pools in the current study, though this might be reasonable when considering that our sample sediments came from the exposed delta, whilst theirs were from the hypolimnion of the reservoir (exposed v. in solution). Levels of Fr.NaOH P were very comparable, with slightly higher amounts in the current work. This is most likely due to the distinct environments, where P may resorb to or co-precipitate with Fe minerals upon drying of sediments. Apatite P content was much higher in the sediments from the current work. This might be due to pools, perhaps from the CBD step that we did not perform, dissolving into solution with the strong acid. Authigenically formed apatite might be part of the explanation as well; these Ca-P complexes are more likely to dissolve in solution than detrital forms of apatite. Alternatively, the greater amounts of apatite could provide evidence that limitations on external P loading have worked, since this P pool was not regulated as other pools were [
34].
There were significant amounts of residual P present in both studies, and this is another point of departure between the two studies. In the current work, we calculated total P by the summation of concentrations of individual pools, whilst in the previous work total P was determined by digestion of a separate aliquot of sediment. To compare, we could calculate residual P for the previous study by subtracting inorganic P from the total P they obtained. However, they extracted more inorganic P (897.8 mg·kg
−1 by summation of Fr.NaOH, Fr.CBD, and Fr.HCl) than they obtained by total digestion (825.8 mg·kg
−1) (see
Table 6 for summary of results), so we do not place any confidence in this comparison. The anomaly in their data might be due to resorption of P in the fractionation process or because of P entrained in solutions.
Our study and the previous study used different fractionation schemes. Initially it seems that we should be able to compare P concentrations by cumulative sums, but Wang
, et al. [
46] show that the fractions extracted by various schemes are not well defined. They note that each fractionation scheme yielded operationally defined pools, that cannot be used to identify specific P compounds. This means that quantitative comparisons between different schemes is difficult, and comparisons are limited to qualitative discussions. One specific issue that affects different schemes is reabsorption to CaCO
3 [
46]. As DCR sediments are calcareous, this could significantly affect the behavior of different fractionation schemes.
4. Conclusions
This work makes available a unique data set for researchers. It is part of a larger project attempting to understand, characterize, and model water quality issues at DCR. We gathered these data to characterize how deposited delta sediments might provide a recycled nutrient, specifically P source to the water column, in the case of reservoir flooding (refilling after withdrawal) over the exposed delta. This study provided useful data and insights for further work in this area.
Fr.W P concentrations have spatial trends both horizontally and vertically. Based on our limited data, the other fractions of P behaved similarly [
47], which was supported by P-distribution maps. By observation, it appeared that the general ratios between the P-fractions was relatively constant, allowing co-kriging or other methods to be used to evaluate spatial distributions in more detail. As noted, we used kriging to characterize these distributions that follow the general Fr.W patterns.
We hope that researchers will use this unique data set to better understand processes in reservoir sediment deltas, including re-cutting and resuspension and the resulting spatial trends. This can inform reservoir managers about the impact that reservoir drawdowns could have, as the drawdowns affect nutrient concentrations due to re-cutting and resuspension of delta sediments.
Our initial results suggest that there is more apatite-P in the exposed delta sediments than in submerged sediments sampled previously, based on comparison of our results with those of Messer et al. [
34]. This could have repercussions on refilling reservoirs, as some of the apatite-P found in delta sediments might be of authigenic (precipitated in area previously covered by water), instead of detrital origin. This type of process might have implications in the Western United States, where the extended droughts over recent years have significantly lowered many reservoirs exposing delta sediments. This modified P might more easily become available as the reservoir is refilled, releasing additional nutrients to the water column.
This increased apatite fraction may also indicate that the external P loading reductions started in 1981, as described by Reference [
32], have been successful. Apatite-P is the least bioavailable pool due to high insolubility, so Messer et al. [
34] recommended that this pool not be targeted for reduction. Our data showed an increased percentage for this pool and it may be evidence of reduction in the other P pools that were targeted for reduction. We expect to explore these issues further, and hope that by providing these field data to the research community, we can spur additional insight.


