Abstract
The Niger Delta is the most climate-vulnerable region in Nigeria. Flooding events are recorded annually in settlements along the River Niger and its tributaries, inundating many towns and displacing people from their homes. In this study, climate change impacts from extreme meteorological events over the period 2010–2099 are predicted and analyzed. Four coupled model intercomparison project phase 5 (CMIP5) global climate models (GCMs) under respectively concentration pathways (RCP4.5 and RCP8.5) emission scenarios were used for climate change predictions. Standardized precipitation indices (SPI) of 1-month and 12-month time steps were used for extreme event assessment. Results from the climate change scenarios predict an increase in rainfall across all future periods and under both emission scenarios, with the highest projected increase during the last three decades of the century. Under the RCP8.5 emission scenario, the rainfall at Port Harcourt and Yenagoa Stations is predicted to increase by about 2.47% and 2.62% while the rainfall at Warri Station is predicted to increase by about 1.39% toward the end of the century. The 12-month SPI under RCP4.5 and RCP8.5 emission scenarios predict an exceedance in the extreme wet threshold (i.e., SPI > 2) during all future periods and across all study locations. These findings suggest an increasing risk of flooding within the projected periods. The finding can be useful to policymakers for the formulation and planning of flood mitigation and adaptation measures.
1. Introduction
The industrialization of developed and developing countries increases the concentration of greenhouse gases (GHGs), which enhances climate variability [1]. Climate change has become an enormous challenge for developmental planning in many countries, especially for developing countries like Nigeria. The IPCC report [2] shows that an increase in the frequency of extreme rainfall is likely to occur in most areas during the 21st century with different emissions scenarios. Recent studies by [3,4] reported that human activities played a leading role in increasing climate change impacts. The projected results of these changes include flooding, damage to crops, soil erosion, adverse effects on surface and groundwater quality, water scarcity, water contamination, disease outbreak, loss of properties, disruption of the settlement, and other socio-economic challenges [5].
Floods are the result of weather events occurring at variable time frequencies in many areas around the world [6]. Many cities are hotspots of risk from extreme weather events, which is growing due to a combination of climate change and anthropogenic activities [7]. Different regions in Nigeria are seasonally affected by flood, which significantly alters both the national and regional economic development depending on its severity. Studies in Nigeria [8,9,10,11] reported that flood displaces more people in the country than any other natural disaster, with an estimated 20% of the population at risk. The impacts are recognized more by vulnerable communities, who often build homes along the floodplains, causing millions of people to relocate, destroying their businesses, and polluting water resources, which increase the risk of diseases [8,12].
The Niger Delta part of Nigeria is the most vulnerable part of the country to impacts of climate change [13,14]. Flooding events are recorded annually in the coastal Niger Delta states located along the River Niger and its tributaries [13]. Devastating floods often inundate two-thirds of the coastal communities in the Niger Delta region for at least a quarter of each year [13,15,16,17,18]. Studies on the vulnerability of communities in three Niger Delta States [15,16] reported that a total of 1110 towns are at risk of being inundated and about 7,120,028 people risk displacement. It has, therefore, become very vital to study the impact of climate change on extreme weather events to predict the possible occurrence of associated risks, which can assist in the planning and management of such incidents. One of the significant effects of climate change is the variation of rainfall. As high rainfall may result in flood, its deficit may lead to drought. Therefore, the prediction of variation in future rainfall trends is necessary for assessing the impact of climate change.
The cost of climate change adaptation can significantly be reduced through adequate policies and flood control investment plans. There is, therefore, a need for systematic studies of indices that are useful for continuous monitoring of high-risk associated with future extreme weather events. The standardized precipitation index (SPI) [19,20], although developed for drought monitoring, can be successfully applied for flood monitoring purposes [6,21,22,23]. SPI can also serve as an indicator for the development of soil-saturation conditions, leading to flooding potential.
General circulation models (GCMs) are essential tools for assessing the impact of climate change on a range of human and natural systems [24]. Simulations at these inner scales are of considerable interest to hydrologists in assessing the possible impact of climate change on water resources and extreme weather events [25]. Different climate models have been used globally for climate impact assessment studies. Climate models, particularly the GCMs, provide an essential source of information for constructing scenarios of climate change and providing such information at a higher spatial resolution. GCMs are based on physical laws and physical-based empirical relationships and are mathematical representations of the atmosphere, ocean, and land surface processes [24].
Though few researchers [13,15,16,17,18] have studied the vulnerability of the Niger Delta States to flooding, no study has investigated the spatial and temporal variations of future extreme weather events in the context of climate change. In this study, the spatiotemporal variations in rainfall over the Niger Delta, for the observed period (1980 to 2005) and the predicted period (2010 to 2099) under RCP4.5 and RCP8.5 were investigated for extreme events. The results help in the analysis of extreme weather events as part of the strategies in climate change impact mitigation.
2. Description of the Study Area
The study area is comprised by three states in the Niger Delta part of Nigeria namely the Delta, Bayelsa, and Rivers States (Figure 1), which are geographically located at a latitude of 4.15° N and a longitude of 6.01° E, and covers an area about 29,100 km2. It is a low lying coastal area that is drained by the Kwa-Ibo, Imo, Bonny, and Aba Rivers and their tributaries.
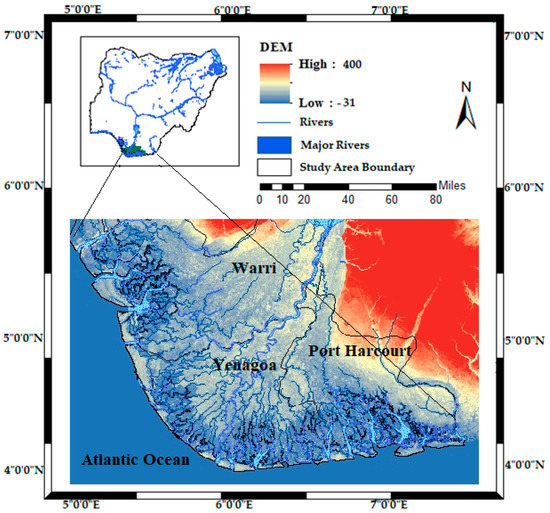
Figure 1.
Location of the study area in Nigeria.
The study area is classified as an equatorial climate toward the southern coast and subequatorial climate toward the northern tropical rainforest [26]. The altitude of the area under the influence of high coastal tides results in flooding, especially during the rainy season [27]. The area is characterized by typical tropical dry seasons (November to February) and wet season (March to October) with a mean annual rainfall increasing from 2000 mm around the northern fringe to about 4500 mm around the coastal margin [28]. Recent studies reported that during the last 20 years [13], a trend of increase in precipitation, flood frequencies, maximum and minimum temperature were observed over the years in the Niger Delta due to global warming, which show a clear sign of climate change with a variable future climate over the region [16,17,18,29].
The mean monthly temperatures are high up to 26.7 °C around March/April and as low as 24.4 °C during July/August giving a small annual range of 2.7 °C. The relative humidity of the area is relatively high, often reaching 90% and are associated with warm, wet southwesterly winds blowing inland most of the year whereas dust-laden, warm and dry northeasterly winds occasionally reach the coast for small periods of the year [30].
3. Materials and Methods
3.1. Meteorological Datasets
The datasets used in this study are daily rainfall time series datasets obtained from the Climate Research Unit (CRU) for the historical periods of 1980 to 2005 over the Niger Delta part of Nigeria due to the scarcity of reliable long time records of hydroclimatological stations in the area. The CRU datasets are observation-based gridded rainfall and temperature datasets, which are widely used globally because of their extensive spatial and temporal coverage [31,32,33]. A study by [34] found the CRU datasets to be the best-fit datasets that replicate the distribution patterns, spatial, and temporal variability of the Niger Delta’s observed hydroclimatological datasets.
3.2. Coupled Model Inter-Comparison Project Phase 5 (CMIP5) General Circulation Models (GCM) Datasets
In this study, four GCMs of the ISI-MIP (Inter-Sectoral Impact Model Inter-comparison Project) (Table 1) and two carbon emission and historical scenarios (RCP4.5 and RCP8.5) for the years (2010–2099) were extracted at a grid resolution of 0.5° × 0.5° for the study area coordinates consistent with the observed climate datasets. These GCMs were selected based on their better performance over the Niger Delta in a study conducted by [35].

Table 1.
Coupled model inter-comparison project phase 5 (CMIP5) general circulation models used in the study at 0.5° × 0.5° grid.
The RCP4.5 and RCP8.5 emission scenarios were selected for this study, as these two scenarios are assumed to provide a possible complete range of impact. The RCP4.5 denotes the common pathway scenario depicting good agreement with the latest lower greenhouse gas emissions policy by the global community. In contrast, RCP8.5 denotes the business-as-usual scenario, consistent with a future with no change in climate policy on emissions reduction [36]. Therefore, as many studies recommend using ensemble results of several climate change models [37], the ensemble of the four best performing GCMs [35] was used in this study.
3.3. Bias Correction
Raw GCM outputs typically contain biases when compared with observations [38]. In this study, the CRU dataset for the periods 1980 to 2005 was used to correct the biases in the historical raw GCMs (1980–2005), which were then used to validate the bias-corrected GCM outputs. The differences in mean and variability between the raw GCM outputs and the observed CRU datasets were later used to correct the biases in the projected raw GCMs (2005–2099). The easiest and most common bias correction method, which is the multiplicative method, was adopted to correct the biases in the daily time series rainfall from the four GCM outputs [33,39,40]. In the multiplicative bias correction method, a multiplicative correction factor for each month is used, and the modified daily rainfall is expressed in Equation (1):
where P is the rainfall (mm day−1); is the long-term mean rainfall; and i, j, k are the day, month, and year counters, respectively.
3.4. Meteorological Drought Assessment
The methodology adopted in this study consists of applying the standardized precipitation index (SPI) to investigate the susceptibility of the selected meteorological stations to flooding events. SPI was developed to identify meteorological flood and drought events from precipitation time series data for monitoring and evaluation of extreme events [19,20]. A wet period for a time scale i is defined as the period during which the SPI is continuously positive and reaches a value of +1 or higher [19]. SPI is calculated by taking the difference in monthly precipitation (xi) from the monthly mean (), then divided by the standard deviation (σ) [21].
Positive SPI values show higher precipitation than the mean, while negative values indicate less than mean precipitation [41]. In this study, the SPI index was calculated for time scales of 1-month and 12-month rainfall series for each of the selected locations. One-month SPI plots are very similar to a time series plot displaying the percentage of average rainfall for 30 days and reflect short-term conditions. A 12-month SPI indicates long-term rainfall patterns that represent a comparison of the precipitation for 12 consecutive months and that recorded in the same 12 consecutive months during all the previous years of available data [22]. In this study, the SPI package in R [42] was used for the computation analysis. Wet dynamics were graphically analyzed for each scale, each RCP emission scenario, and all the projected durations and each location. The definition of the SPI values in drought characterizations are summarized in Table 2.
Table 2.
Categories for standardized precipitation index (SPI) values [19,22].
3.5. Performance Assessment of the Models
The performance evaluation of the developed models was carried out using three statistical indicators: root mean squared error (RMSE); coefficient of correlation (R2); and the Nash–Sutcliffe efficiency (NSE) [43]. RMSE is considered as a robust measure of accuracy [44,45].
The coefficient of determination (R2) is an indicator of the strength of the relationship between the observed and simulated values, which is considered more accurate if it is approximately equal to one [43].
The Nash–Sutcliffe efficiency (NSE) is a normalized statistic that determines the relative magnitude of the residual variance compared to the measured data variance. NSE also indicates how well the plot of the observed versus simulated data fits. NSE ranges between −∞ and 1, with NSE = 1 being the optimum value. Values between 0 to 1 are viewed as an acceptable level of performance, whereas values of 0.0 indicate that the mean observed value is a better predictor than the simulated value, which indicates unacceptable performance [44].
where is the observed precipitation at the ith time; is the predicted rainfall at the th time; is the mean of the observed rainfall levels; is the mean of the predicted rainfall, and n is the total number of observations.
4. Results and Discussion
4.1. Performance Assessment of GCM Ensemble
The performance of the four GCM ensemble models during the historical period (1980–2005) was assessed using the root mean square error (RMSE), coefficient of correlation (R2), and Nash–Sutcliff efficiency (NSE). The results obtained are summarized in Table 3, and the mean monthly distribution of observed and ensemble rainfall in Figure 2a–f shows that the ensemble model performed very well in depicting the observed CRU datasets at each of the three study locations. The statistical indicators showed a low RMSE with high NSE and R2 values across all of the study locations, which indicate that the model is fit for simulations/projections of the area’s future rainfall.
Table 3.
Performance assessment of rainfall in the general circulation model (GCM) ensemble.
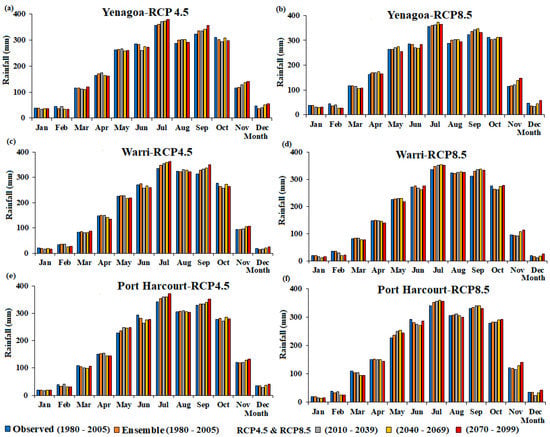
Figure 2.
Seasonal variation of observed and predicted precipitation in (a) Yenagoa-RCP4.5, (b) Yenagoa-RCP8.5, (c) Warri-RCP4.5, (d) Warri-RCP8.5, (e) Port Harcourt-RCP4.5 and (f) Port Harcourt-RCP8.5, during the future periods.
4.2. Observed and Predicted Rainfall Scenarios
The distribution of mean monthly observed and predicted rainfall scenarios in the study locations are shown in Figure 2a–f, respectively. The projected models were grouped into three time periods of 2010–2039, 2040–2069, and 2070–2099. The monthly distribution, as presented in Figure 2, shows that the projected rainfall, in comparison with the observed rainfall, predicts an increasing trend across all stations and all predicted durations. The highest increase across all three stations was projected to be during the 2070–2099 period. In Port-Harcourt, the rainfall is projected to increase by 1.06% under RCP4.5, and 2.47% under RCP8.5. Yenagoa is also projected to experience an increase of about 1.27% under RCP4.5 and 2.62% under RCP8.5. In comparison, Warri Station is also predicted to experience an increase of about 1.24% under RCP4.5, and 1.39% under RCP8.5 toward the end of the century, as shown in Figure 3. This projected increase in rainfall confirms the report of the IPCC [25] in response to greenhouse gases forcing, which is consistent with other parts of the world [46,47,48,49].
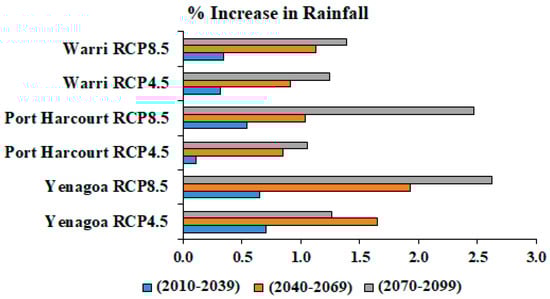
Figure 3.
Percentage increase in predicted future rainfall in comparison with the observed rainfall across the study locations under the RCP4.5 and RCP8.5 emission scenarios.
4.3. Meteorological Drought Assessment
The 1-month and 12-month time-steps in the standardized precipitation index were calculated for the base period (1980–2005) and the predicted duration (2010–2099) across the three study locations. Results of the computed SPI for the base period is shown in Figure 4a,b. In contrast, the results of all the projected periods divided into thirty year time periods (2010–2039, 2040–2069, and 2070–2099) across all stations, and both emission scenarios are shown in Figure 5, Figure 6 and Figure 7. The most striking characteristic is the change in frequency as the time scale changes, as shown in all figures. On the 1-month scale, the wet frequency increases, but its duration decreases while in the 12-month time scale, the wet events become less frequent but last longer. This trend implies that on the shorter time scales, the wet events become more frequent but last for a short period. The figures show that extremely wet weather (i.e., SPI > 2, as classified in Table 2) is likely to occur across most of the stations, especially when using the 12-month time steps. However, all the figures show that very wet event weather (i.e., 1.5 > SPI < 1.99, as classified in Table 2) is expected to occur across all the study locations almost on an annual basis and all the predicted durations using all the time steps. Using the 1-month and 12-month SPI, three well-defined extremely wet weather events were identified in all three locations from the base period series analyzed, which depicted three major floods associated with three of the weather events (Figure 4a,b).
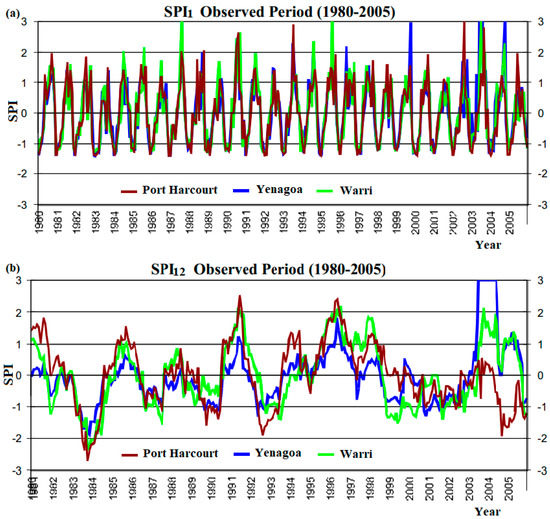
Figure 4.
Computed standardized precipitation index (SPI) for the base period across the study locations.
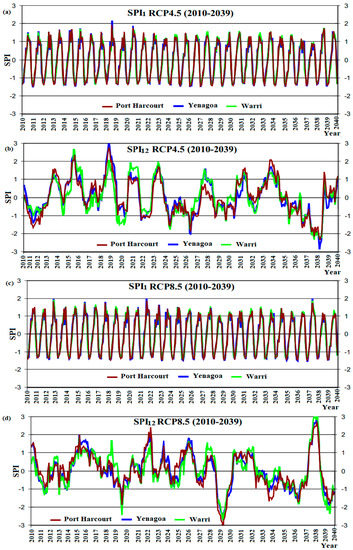
Figure 5.
Computed (a) 1-month RCP4.5 SPI, (b) 12-month RCP4.5 SPI, (c) 1-month RCP8.5 SPI, and (d) 12-month RCP8.5 SPI for the projected periods from 2010 to 2039 across the study locations.
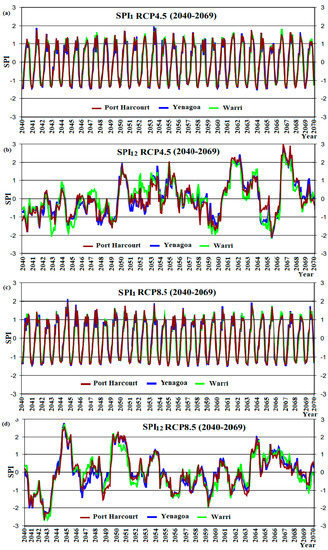
Figure 6.
Computed (a) 1-month RCP4.5 SPI, (b) 12-month RCP4.5 SPI, (c) 1-month RCP8.5 SPI, and (d) 12-month RCP8.5 SPI for the projected periods from 2040 to 2069 across the study locations.
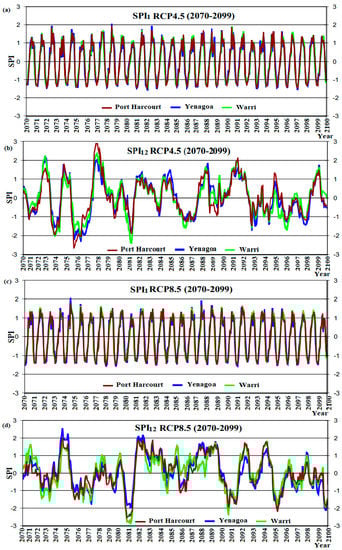
Figure 7.
Computed (a) 1-month RCP4.5 SPI, (b) 12-month RCP4.5 SPI, (c) 1-month RCP8.5 SPI, and (d) 12-month RCP8.5 SPI for the projected periods from 2070 to 2099 across the study locations.
Attention has not been given to flood intensity measurements and records storage in Nigeria. Hence, no historical datasets are available to validate the findings of the historical period. However, the findings of this study match those of the reported extreme flood incidents [9,11] in the study area during the 1999 and 2001 rainstorms, which submerged houses, schools, markets, farmlands, and displacement of over 425,839.5 people in Delta State between March 1999 and April 2001. Additionally, in Bayelsa State, over 273,266 people were displaced by floods in 1999, and 382,000 people in March 2001 [10,11]. Comparisons of the reported extreme weather events across the study locations with the computed extremely wet events (i.e., SPI > 2) during the historical period in Figure 4 confirm the findings of the base period.
Analysis of SPI variability for the period 2010 to 2039 across the study area shows that the 1-month SPI predicted an exceedance in extreme wet event threshold (i.e., SPI > 2) at Yenagoa Station once under RCP4.5 (Figure 5a) and twice under RCP8.5 (Figure 5c) during the thirty year mean. The 12-month SPI under RCP4.5 and RCP8.5 in Figure 5b,d also predict an exceedance in extreme wet event threshold (i.e., SPI > 2) twice during the thirty year mean, similar to the baseline period. No station predicted the risk of severe dryness (i.e., −1.0 >SPI < 1.49) using the 1-month SPI. However, the 12-month SPI suggests that during those periods (2010–2039), the climate at Warri and Port Harcourt Stations exceeds the severely dry threshold (i.e., 1.5 >SPI < 1.99) once under RCP4.5 and three times under RCP8.5 (Figure 5d) for the thirty year mean period.
For the periods covering 2040 to 2069, (Figure 6a–d), the 12-month SPI under the RCP4.5 and RCP8.5 emission scenarios projected an exceedance in the extreme wet event threshold (i.e., SPI > 2) twice during the thirty year mean. However, no station showed a risk of severe dryness (i.e., −1.0 > SPI < 1.49) under RCP4.5. The 12-month SPI under the RCP8.5 (Figure 6d) emission scenario predicted the risk of a severely dry event (i.e., −1.0 >SPI < 1.49) once during the thirty year mean and across all study locations. Similarly, during the periods covering 2070 to 2099, the 1-month time step SPI in Figure 7a,c under RCP4.5 and RCP8.5 projected an exceedance in the extreme wet threshold (i.e., SPI > 2) once during the thirty year mean. However, the 12-month SPI predicted the exceedance in the extreme wet threshold (i.e., SPI > 2) twice under RCP4.5 (Figure 7b), and three times under RCP8.5 (Figure 7d) during the thirty year mean. The drought magnitude at the Port Harcourt and Warri Stations exceeded the severely dry threshold (i.e., 1.5 > SPI < 1.99) once under RCP4.5 and three times under RCP8.5 for the thirty year (2070 to 2099) mean.
5. Discussion
Adaptation and Planning Strategy
It is evident in several studies [13,15,16,17,18] that the Niger Delta experiences periodic vulnerability in terms of flooding, rendering millions of people homeless by submerging their houses, schools, and markets and destroying their farmlands, which is often attributed to climate change. The geographical location of the study area being a low-lying part of Nigeria exacerbates the situation, causing the area to be easily submerged during heavy rainfall events. The condition of such areas have forced people to adapt to the frequent seasonal flooding rather than control or mitigating measures. Hence, studies geared toward extreme weather events projections in low-lying areas are necessary. This will create awareness for an urgent collaborative effort between government, stakeholders, and other relevant agencies to support town planning, and in developing strategic plans for mitigating the possible impacts of extreme weather events in the Niger Delta to prevent its long-range consequences. Prevention of common practices such as construction in flood-prone zones should be encouraged to ensure an adequate buffer along the river channels.
The projected increase in rainfall across the three study locations confirmed the IPCC [25] report as well as the results in [26,35,50,51,52] for this region. These findings highlight that the region might be at risk of extreme wet events, which could result in the risk of flooding within the projected periods. These might pose a considerable threat to lives and properties, which might consequently harm the socio-economic growth and livelihood of the region [13,15,16,17,18,29]. Therefore, routine monitoring and measurement of water levels in rivers, streams, and dams, especially along the Niger River for potential risk of flooding should be enforced to forestall the possible disaster. Sufficient information or warning systems could be put in place across the years predicted by this study to educate the public against the dangers of flooding as well as the government policies for its mitigation adaptation measures.
6. Conclusions
In determining the potential impact of climate change on extreme events in the Niger Delta part of Nigeria, rainfall has been projected from 2010 to 2099 using an ensemble of four GCMs under RCP4.5 and 8.5 emission scenarios. The results showed an increase in the projected future rainfall scenarios across all study locations, which suggest a wetter future in the coastal Niger Delta. The extreme weather events at the stations were investigated using the standardized precipitation index (SPI). The SPI index projects an extreme wet event at least once under RCP4.5 and three times under RCP8.5 for the thirty year mean across the study locations. These findings suggest high rainfall in the future climate of this area across all of the projected durations. Hence, adequate plans for flood mitigation should be put in place. The findings can also be useful to policymakers for the formulation and planning of mitigation and adaptation measures for climate change.
Author Contributions
I.H. and R.M.K. designed the research; I.H. wrote the original draft.; R.M.K., C.J.W., and J.A.A. reviewed and edited the manuscript, provided technical help, and proposed significant additions to the model and manuscript.; R.M.K. gave critical views on the manuscript for further improvement. All authors have read and agreed to the published version of the manuscript.
Funding
This research was funded by the Petroleum Technology and Development Fund (PTDF) under the Overseas PhD scholarship scheme and supported by the Scottish Government under the Climate Justice Fund Water Futures Program, awarded to the University of Strathclyde (R.M. Kalin).
Conflicts of Interest
The authors declare no conflicts of interest.
References
- Worku, L.Y. Climate change impact on variability of rainfall intensity in the Upper Blue Nile Basin. Proc. Int. Assoc. Hydrol. Sci. 2015, 366, 135–136. [Google Scholar] [CrossRef][Green Version]
- IPCC. Mitigation of Climate Change: Contribution of Working Group III to the Fourth Assessment Report of the Intergovernmental Panel on Climate Change; Cambridge University Press: Cambridge, UK; New York, NY, USA, 2007; pp. 226–230. [Google Scholar]
- Chen, X.; Li, X.; Yuan, X.; Zeng, G.; Liang, J.; Li, X.; Xu, W.; Luo, Y.; Chen, G. Effects of human activities and climate change on the reduction of visibility in Beijing over the past 36 years. Environ. Int. 2018, 116, 92–100. [Google Scholar] [CrossRef]
- Li, X.; Chen, X.; Yuan, X.; Zeng, G.; León, T.; Liang, J.; Chen, G.; Yuan, X. Characteristics of particulate pollution (PM2.5 and PM10) and their spacescale-dependent relationships with meteorological elements in China. Sustainability 2017, 9, 2330. [Google Scholar] [CrossRef]
- IPCC. Climate Change 2007 Synthesis Report; Synthesis Report. Contribution of Working Groups I, II and III to the Fourth Assessment Report of the Intergovernmental Panel on Climate Change; IPCC: Geneva, Switzerland, 2007; p. 104. [Google Scholar]
- Seiler, R.A.; Hayes, M.; Bressan, L. Using the standardized precipitation index for flood risk monitoring. Int. J. Climatol. 2002, 22, 1365–1376. [Google Scholar] [CrossRef]
- Ranger, N.; Hallegatte, S.; Bhattacharya, S.; Bachu, M.; Priya, S.; Dhore, K.; Rafique, F.; Mathur, P.; Naville, N.; Henriet, F.; et al. An assessment of the potential impact of climate change on flood risk in Mumbai. Clim. Chang. 2011, 104, 139–167. [Google Scholar] [CrossRef]
- Cirella, G.T.; Iyalomhe, F.O. Flooding conceptual review: Sustainability-focalized best practices in Nigeria. Appl. Sci. 2018, 8, 1558. [Google Scholar] [CrossRef]
- Etuonovbe, A.K. The Devastating Effect of Flooding in Nigeria. J. Hydrogr. Environ. 2011, 18–22. [Google Scholar]
- UNOCHA. Humanitarian Bulletin Nigeria; United Nations Office for the Coordination of Humanitarian Affairs: Abuja, Nigeria, 2015; Available online: https://www.unocha.org/story/niger-heavy-rains-and-floods-force-more-400000-people-their-homes (accessed on 12 November 2019).
- Oluwaseyi, A. Plant Genetic Resources (PGR) in Nigeria and the Reality of Climate Change—A Review. Asian J. Environ. Ecol. 2017, 2, 1–24. [Google Scholar] [CrossRef]
- Brown, I.; Chikagbum, W. Planning response to water related disasters in Nigeria the Rivers state experience. Int. J. Sci. Eng. Res. 2015, 6, 32–44. [Google Scholar]
- Mmom, P.C.; Aifesehi, P.E. Vulnerability and Resilience of Niger Delta Coastal Communities to Flooding. IOSR J. Humanit. Soc. Sci. 2013, 10, 27–33. [Google Scholar] [CrossRef]
- Hazards, N.; Education, W.; Education, W. The Niger Delta’ s vulnerability to river floods due to sea level rise. Nat. Hazards Earth Syst. Sci. 2014, 14, 3317–3329. [Google Scholar]
- Amangabara, G.T.; Gobo, A.E. Factors that influence the flooding of the middle and lower Ntamogba stream catchments, Port Harcourt, Nigeria. J. Environ. Hydrol. 2007, 15, 1–11. [Google Scholar]
- Amangabara, G.; Obenade, M. Flood Vulnerability Assessment of Niger Delta States Relative to 2012 Flood Disaster in Nigeria. Am. J. Environ. Prot. 2015, 3, 76–83. [Google Scholar]
- Ologunorisa, T.E.; Adeyemo, A. Public perception of flood hazard in the Niger Delta, Nigeria. Environmentalist 2005, 25, 39–45. [Google Scholar] [CrossRef]
- Tawari-fufeyin, P.; Paul, M.; Godleads, A.O. Some Aspects of a Historic Flooding in Nigeria and Its Effects on some Niger-Delta Communities. Am. J. Water Resour. 2015, 3, 7–16. [Google Scholar]
- Mckee, T.B.; Doesken, N.J.; Kleist, J. The relationship of drought frequency and duration to time scales. In Proceedings of the Eighth Conference on Applied Climatology, Anaheim, CA, USA, 17–22 January 1993. [Google Scholar]
- Mckee, T.B.; Doesken, N.J.; Kleist, J. Drought Monitoring with Multiple Time Scales. In Proceedings of the 9th Conference on Applied Climatology, Dallas, TX, USA, 15–20 January 1995. [Google Scholar]
- Komuscu, A.U. Using the SPI to Analyze Spatial and Temporal Patterns of Drought in Turkey Using the SPI to Analyze Spatial and Temporal Patterns of Drought in Turkey. Drought Netw. News 1999, 11, 6–13. [Google Scholar]
- Svoboda, M.; Hayes, M.; Wood, D. Standradized Precipitation Index User Guide. World Meteorol. Organ. 2012, 21, 1333–1348. [Google Scholar]
- Shahid, S. Spatial and temporal characteristics of droughts in the western part of Bangladesh. Hydrol. Process. Wiley Intersci. 2008, 2274, 2267–2274. [Google Scholar]
- IPCC. Climate Change: The IPCC Scientific Assessment; Cambridge University Press: Cambridge, UK, 1990; Volume 1, p. 414. [Google Scholar]
- IPCC. Climate Change 2007: Impacts, Adaptation and Vulnerability: Contribution of Working Group II to the Fourth Assessment Report of the Intergovernmental Panel on Climate Change; Cambridge University Press: Cambridge, UK, 2007; p. 976. [Google Scholar]
- Matemilola, S.; Adedeji, O.H.; Elegbede, I.; Kies, F. Mainstreaming climate change into the EIA process in Nigeria: Perspectives from projects in the Niger Delta Region. Climate 2019, 7, 29. [Google Scholar] [CrossRef]
- Amadi, A.N. Impact of Gas-Flaring on the Quality of Rain Water, Groundwater and Surface Water in Parts of Eastern Niger Delta, Nigeria. J. Geosci. Geomat. 2014, 2, 114–119. [Google Scholar]
- Adejuwon, J.O. Rainfall seasonality in the Niger Delta Belt, Nigeria. J. Geogr. Reg. Plan. 2012, 5, 51–60. [Google Scholar]
- Ologunorisa, T.E.; Tersoo, T. The changing rainfall pattern and its implication for flood frequency in Makurdi, Northern Nigeria. J. Appl. Sci. Environ. Manag. 2006, 10, 97–102. [Google Scholar] [CrossRef]
- Ituen, E.U.; Alonge, A.F. Niger Delta Region of Nigeria, Climate Change and the way Forward. In Proceedings of the Bioenergy Engineering, Washington, DC, USA, 11–14 October 2009. [Google Scholar]
- Harris, I.; Jones, P.D.; Osborn, T.J.; Lister, D.H. Updated high-resolution grids of monthly climatic observations—The CRU TS3.10 Dataset. Int. J. Climatol. 2014, 34, 623–642. [Google Scholar] [CrossRef]
- Jones, P.D.; Harris, I.C. Climatic Research Unit (CRU) Time-Series Datasets of Variations in Climate with Variations in Other Phenomena. NCAS British Atmospheric Data Centre; University of East Anglia: Norwich, UK, 2008; Available online: http://catalogue.ceda.ac.uk/uuid/3f8944800cc48e1cbc29a5ee12d8542d (accessed on 13 June 2017).
- Ashraf Vaghefi, S.; Abbaspour, N.; Kamali, B.; Abbaspour, K.C. A toolkit for climate change analysis and pattern recognition for extreme weather conditions—Case study: California-Baja California Peninsula. Environ. Model. Softw. 2017, 96, 181–198. [Google Scholar] [CrossRef]
- Hassan, I.; Kalin, R.M.; White, C.J.; Aladejana, J.A. Evaluation of Daily Gridded Meteorological Datasets over the Niger Delta Region of Nigeria and Implication to Water Resources Management. Atmos. Clim. Sci. 2020, 10, 21–39. [Google Scholar] [CrossRef]
- Hassan, I.; Kalin, R.M.; White, C.J.; Aladejana, J.A. Selection of CMIP5 GCM ensemble for the projection of Spatio-temporal changes in precipitation and temperature over the Niger Delta, Nigeria. Water 2020, 12, 385. [Google Scholar] [CrossRef]
- Wang, L.; Ranasinghe, R.; Maskey, S.; van Gelder, P.H.A.J.M.; Vrijling, J.K. Comparison of empirical statistical methods for downscaling daily climate projections from CMIP5 GCMs: A case study of the Huai River Basin, China. Int. J. Climatol. 2016, 36, 145–164. [Google Scholar] [CrossRef]
- Teutschbein, C.; Seibert, J. Bias correction of regional climate model simulations for hydrological climate-change impact studies: Review and evaluation of different methods. J. Hydrol. 2012, 456–457, 12–29. [Google Scholar] [CrossRef]
- Mehrotra, R.; Sharma, A. Correcting for systematic biases in multiple raw GCM variables across a range of timescales. J. Hydrol. 2015, 520, 214–223. [Google Scholar] [CrossRef]
- Beyer, R.; Krapp, M.; Manica, A. A systematic comparison of bias correction methods for paleoclimate simulations. Clim. Past Discuss. 2019, 11, 1–23. [Google Scholar]
- Xu, Y. Hydrology and Climate Forecasting R Package for Data Analysis and Visualization 2018. Available online: https://cran.r-project.org/web/packages/hyfo/hyfo.pdf (accessed on 12 October 2019).
- Lloyd-Hughes, B.; Saunders, M.A. A drought climatology for Europe. Int. J. Climatol. 2002, 22, 1571–1592. [Google Scholar] [CrossRef]
- Neves, J. Package ‘Spi’: Compute SPI Index. 2015. Available online: https://cran.r-project.org/web/packages/spi/spi.pdf (accessed on 20 October 2019).
- Willmott, C.J. On the validation of models. Phys. Geogr. 1981, 2, 184–194. [Google Scholar] [CrossRef]
- Moriasi, D.N.; Arnold, J.G.; Liew, M.W.; Van Bingner, R.L.; Harmel, R.D.; Veith, T.L. Model Evaluation Guidelines for Systematic Quantification of Accuracy in Watershed Simulations. Am. Soc. Agric. Biol. Eng. 2007, 50, 885–900. [Google Scholar]
- Moriasi, D.; Arnold, J.; Liew, M.W.V. Model Evaluation Guidelines for Systematic Quantification of Accuracy in Watershed Simulations. Available online: https://www.researchgate.net/publication/43261199_Model_Evaluation_Guidelines_for_Systematic_Quantification_of_Accuracy_in_Watershed_Simulations (accessed on 12 January 2020).
- Krinner, G.; Germany, F.; Shongwe, M.; Africa, S.; France, S.B.; Uk, B.B.B.B.; Germany, V.B.; Uk, O.B.; France, C.B.; Uk, R.C.; et al. Long-Term Climate Change: Projections, Commitments and Irreversibility. Available online: https://www.ipcc.ch/site/assets/uploads/2018/02/WG1AR5_Chapter12_FINAL.pdf (accessed on 20 Noveber 2019).
- Expósito, F.J.; González, A.; Pérez, J.C.; Díaz, J.P.; Taima, D. High-resolution future projections of temperature and precipitation in the Canary Islands. J. Clim. 2015, 28, 7846–7856. [Google Scholar] [CrossRef]
- Rangwala, I.; Miller, J.R. Climate change in mountains: A review of elevation-dependent warming and its possible causes. Clim. Chang. 2012, 114, 527–547. [Google Scholar] [CrossRef]
- Martín, J.L.; Bethencourt, J.; Cuevas-Agulló, E. Assessment of global warming on the island of Tenerife, Canary Islands (Spain). Trends in minimum, maximum and mean temperatures since 1944. Clim. Chang. 2012, 114, 343–355. [Google Scholar] [CrossRef]
- Agumagu, O.; Todd, M. Modelling the Climatic Variability in the Niger Delta Region : Influence of Climate Change on Hydrology. Earth Sci. Clim. Chang. 2015, 6, 1–7. [Google Scholar]
- Obroma Agumagu, O.A. Projected Changes in the Physical Climate of the Niger Delta Region of Nigeria. Available online: https://www.semanticscholar.org/paper/Projected-Changes-in-the-Physical-Climate-of-the-of-Agumagu-Agumagu/c5e717ebcd21acd09109553f3c11804f94ece611 (accessed on 13 Noveber 2019).
- Ike, P.C.; Emaziye, P.O. An Assessment of the Trend and Projected Future Values of Climatic Variables in Niger Delta Region, Nigeria. Available online: https://www.researchgate.net/publication/268202347_An_Assessment_of_the_Trend_and_Projected_Future_Values_of_Climatic_Variables_in_Niger_Delta_Region_Nigeria (accessed on 28 Noveber 2019).


© 2020 by the authors. Licensee MDPI, Basel, Switzerland. This article is an open access article distributed under the terms and conditions of the Creative Commons Attribution (CC BY) license (http://creativecommons.org/licenses/by/4.0/).