Seepage Velocity: Large Scale Mapping and the Evaluation of Two Different Aquifer Conditions (Silty Clayey and Sandy)

 ,
,  , ,
, , 
Abstract
:1. Introduction
2. Study Area
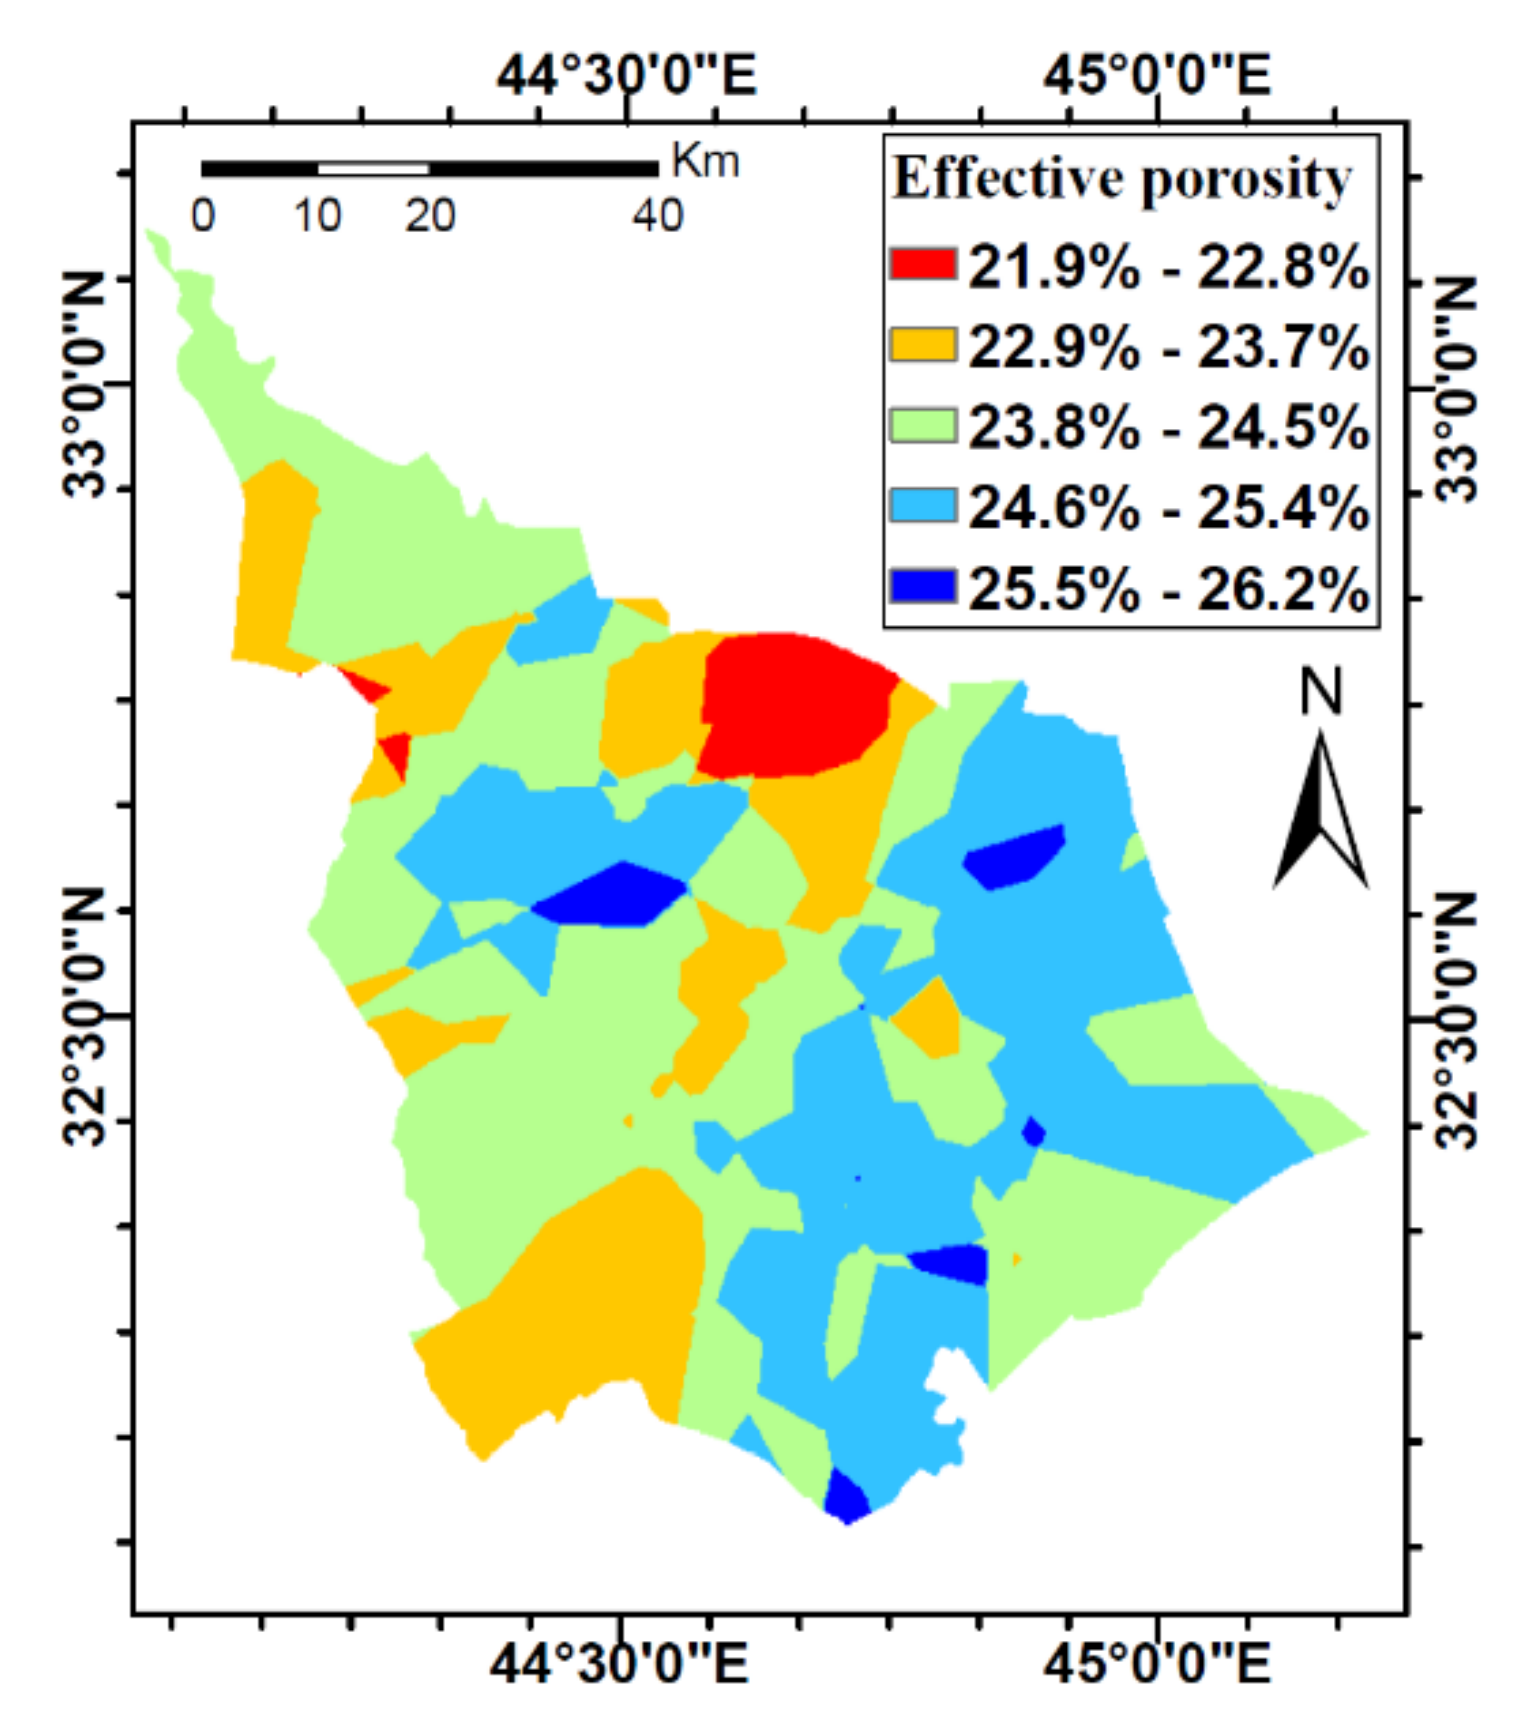
2.1. Babylon
- Mesopotamia fluvial basin sediments: these are fluvial sediments belonging to the Pleistocene epoch and comprising inner bedding varying from sandy gravel to silty clay. Sand prevails in this layer followed by silt. Its thickness ranges from 58 to 174 m [111];
- river terraces: these are well developed along the cliffs bordering the Euphrates flood plain in the vicinity of Iskandariyah. They belong to the Pleistocene epoch. They comprise inter-bedding ranging from sandy gravel to sand; however, local laminated horizons of silty clay are also found in some places. Their thickness reaches 6 m in the vicinity of Iskandariyah [111];
- flood plain sediments: Babylon province can be represented by a vast fertile flood plain comprising the Euphrates (primary) and Tigris (secondary) rivers. These sediments belong to the Holocene epoch. They consist predominantly of silty clay, but loamy sand and sandy loam are also recorded frequently. Their thickness ranges from 15 to 20 m [111];
- Aeolian sediments: these are situated in the southeastern parts of the province. It is believed that these sediments belong to the late Holocene epoch. The sediments essentially comprise fine sand, silt, and clay. The main sources of these sediments are the flood plain sediments of the Euphrates and Tigris rivers. Its thickness reaches 5 m [111,112,113].
2.2. Dibdibba Basin
3. Materials and Methods
3.1. Theory and Equations
3.2. ArcMap/GIS Software
- groundwater elevation head;
- aquifer effective porosity;
- aquifer saturated thickness;
- aquifer transmissivity.
- the rasters of the four maps must have the same extent and cell size;
- the rasters of the four maps must be a floating point;
- the maps should be dimensionally homogeneous, i.e., data should be consistent in units, using the same unit for time (years, days, seconds) and length (meters, feet) for all data.
3.3. Methodology
4. Results
4.1. Babylon
4.2. Dibdibba Region
5. Discussion
5.1. Dibdibba Study Area
5.2. Babylon Study Area
6. Conclusions
Author Contributions
Funding
Acknowledgments
Conflicts of Interest
References
- Martin, J.L.; Maris, V.; Simberloff, D.S. The need to respect nature and its limits challenges society and conservation science. Proc. Natl. Acad. Sci. USA 2016, 113, 6105–6112. [Google Scholar] [CrossRef] [Green Version]
- World Economic Forum. The Global Risks Report 2017 (12th Edition). Available online: http://www3.weforum.org/docs/GRR17_Report_web.pdf (accessed on 1 July 2020).
- Voulvoulis, N.; Burgman, M.A. The contrasting roles of science and technology in environmental challenges. Crit. Rev. Environ. Sci. Technol. 2019, 49, 1079–1106. [Google Scholar] [CrossRef] [Green Version]
- Krämer, L. Global Environmental Challenges and the EU; ERA Forum; Springer: Berlin/Heidelberg, Germany, 2019. [Google Scholar]
- Nazarova, Y.A.; Sopilko, N.Y.; Kovaleva, E.A.; Kulakov, A.V.; Orlova, A.F.; Gavlovskaya, G.V. How to solve water shortage problem by means of renewable power generation? Int. J. Energy Econ. Policy 2019, 9, 244–249. [Google Scholar]
- Falkenmark, M.; Lindh, G. Water for a Starving World; Routledge: New York, NY, USA, 1976. [Google Scholar]
- Dwianika, A.; Murwaningsari, E.; Suparta, W. Analysis of water awareness, accountability, and governance to improve sustainability of firm′s performance in urban areas. Geogr. Tech. 2020, 15, 39–50. [Google Scholar]
- (WRI) WRI. Water. Available online: https://www.wri.org/our-work/topics/water (accessed on 5 June 2020).
- NASA. Freshwater Stores Shrank in Tigris-Euphrates Basin. Available online: https://earthobservatory.nasa.gov/images/80613/freshwater-stores-shrank-in-tigris-euphrates-basin (accessed on 5 June 2020).
- Voss, K.A.; Famiglietti, J.S.; Lo, M.; De Linage, C.; Rodell, M.; Swenson, S.C. Groundwater depletion in the Middle East from GRACE with implications for transboundary water management in the Tigris-Euphrates-Western Iran region. Water Resour. Res. 2013, 49, 904–914. [Google Scholar] [CrossRef] [Green Version]
- World of Change: Mesopotamia Marshes. Available online: https://earthobservatory.nasa.gov/world-of-change/iraq.php (accessed on 5 June 2020).
- Drought in Iraq. Available online: https://earthobservatory.nasa.gov/images/38914/drought-in-iraq (accessed on 5 June 2020).
- United States Department of Agricultre USDA (Foreign Agricultural Service). IRAQ: Drought Reduces 2008/09 Winter Grain Production; United States Department of Agricultre USDA (Foreign Agricultural Service): Washington, DC, USA, 2008. [Google Scholar]
- The Water Cycle. NASA. Available online: https://earthobservatory.nasa.gov/features/Water/page1.php (accessed on 5 June 2020).
- Famiglietti, J.S. The global groundwater crisis. Nat. Clim. Chang. 2014, 4, 945–948. [Google Scholar] [CrossRef]
- Kundzewicz, Z.W.; Döll, P. Will groundwater ease freshwater stress under climate change? Hydrol. Sci. J. 2009, 54, 665–675. [Google Scholar] [CrossRef] [Green Version]
- Voss, K.; Swenson, S.; Rodell, M.; Richey, A.S.; Thomas, B.F.; Lo, M.H.; Reager, J.T.; Famiglietti, J.S. Quantifying renewable groundwater stress with GRACE. Water Resour Res. 2015, 51, 5217–5238. [Google Scholar]
- Alexandra, S.R.; Thomas, B.F.; Lo, M.H.; Famiglietti1, J.S.; Swenson, S.; Rodell, M. Uncertainty in global groundwater storage estimates in a Total Groundwater Stress framework. Water Resour. Res. 2015, 51, 5198–5216. [Google Scholar]
- Huang, F.; Zhang, Y.; Zhang, D.; Chen, X. Environmental groundwater depth for groundwater-dependent terrestrial ecosystems in arid/semiarid regions: A review. Int. J. Environ. Res. Public Health 2019, 16, 763. [Google Scholar] [CrossRef] [Green Version]
- NASA. Study: Third of Big Groundwater Basins in Distress. Available online: https://www.jpl.nasa.gov/news/news.php?feature=4626 (accessed on 5 June 2020).
- Wang, Z.; Yang, L.; Sun, N. Research on optimal design of slope anti-seepage. IOP Conf. Ser. Earth Environ. Sci. 2019, 304, 1–5. [Google Scholar] [CrossRef] [Green Version]
- Wang, L.; Wu, C.; Gu, X.; Liu, H.; Mei, G.; Zhang, W. Probabilistic stability analysis of earth dam slope under transient seepage using multivariate adaptive regression splines. Bull. Eng. Geol. Environ. 2020, 79, 2763–2775. [Google Scholar] [CrossRef]
- Li, T.; Liu, G.; Wang, C.; Wang, X.; Li, Y. The Probability and Sensitivity Analysis of Slope Stability Under Seepage Based on Reliability Theory. Geotech. Geol. Eng. 2020, 38, 3469–3479. [Google Scholar] [CrossRef]
- Han, Z.; Chen, X.; Huang, Y.; Luo, B.; Xing, H.; Huang, Y. Effect of slope gradient on the subsurface water flow velocity of sand layer profile. J. Mt. Sci. 2020, 17, 641–652. [Google Scholar] [CrossRef]
- Liu, J.; Chen, Z.; Kanungo, D.P.; Song, Z.; Bai, Y.; Wang, Y.; Li, D.; Qian, W. Topsoil reinforcement of sandy slope for preventing erosion using water-based polyurethane soil stabilizer. Eng. Geol. 2019, 252, 125–135. [Google Scholar] [CrossRef]
- Liu, G.; Zheng, F.; Jia, L.; Jia, Y.; Zhang, X.; Hu, F.; Zhang, J. Interactive effects of raindrop impact and groundwater seepage on soil erosion. J. Hydrol. 2019, 578, 124066. [Google Scholar] [CrossRef]
- Qiu, P.T.; Chen, Z.Q.; Pu, H.; Zhang, L.Y. Non-Darcian seepage stability analysis of non-Newtonian fluid. Therm. Sci. 2019, 23, 1393–1399. [Google Scholar] [CrossRef] [Green Version]
- Chouireb, M.; Djehiche, A. Simulation of seepage flow through an earthen dam with vertical drain and comparison of results with observations data (case study: Harreza dam-Algeria). Arab. J. Geosci. 2019, 12, 406. [Google Scholar] [CrossRef]
- Asmaranto, R.; Priyantoro, D.; Rini, D.Y.; Aini, A.K. Safety evaluation of the existing Grawan dam based on hydro-geotechnical behaviour conditions to ensure the availability of water resources. IOP Conf. Ser. Earth Environ. Sci. 2020, 437, 012006. [Google Scholar] [CrossRef]
- Ren, J.; Zhang, W.; Yang, J. Morris sensitivity analysis for hydrothermal coupling parameters of embankment dam: A case study. Math. Probl. Eng. 2019, 2019, 2196578. [Google Scholar] [CrossRef] [Green Version]
- Li, H.; Zhao, F.; Li, J. Seepage analysis of clay core wall dam based on ABAQUS. IOP Conf. Ser. Earth Environ. Sci. 2019, 384, 012015. [Google Scholar] [CrossRef]
- Kacimov, A.R.; Yakimov, N.D.; Šimůnek, J. Phreatic seepage flow through an earth dam with an impeding strip. Comput. Geosci. 2020, 24, 17–35. [Google Scholar] [CrossRef] [Green Version]
- Sidiropoulos, P.; Tziatzios, G.; Vasiliades, L.; Mylopoulos, N.; Loukas, A. Groundwater nitrate contamination integrated modeling for climate and water resources scenarios: The case of Lake Karla over-exploited aquifer. Water 2019, 11, 1201. [Google Scholar] [CrossRef] [Green Version]
- Li, Y.; Luo, Y. Application of Computational Fluid Dynamics in Groundwater Pollution Remediation. J. Phys. Conf. Ser. 2019, 1300, 012070. [Google Scholar] [CrossRef]
- Agarwal, R.; Yadav, M.P.; Agarwal, R.P.; Goyal, R. Analytic solution of fractional advection dispersion equation with decay for contaminant transport in porous media. Mat. Vesn. 2019, 71, 5–15. [Google Scholar]
- Siddiqui, D.A.; Peltier, E.F.; Young, B.; Sullivan, P.L. Modelling Influent Runoff and Retention Time in Storm Water Wetland Systems. In World Environmental and Water Resources Congress 2019; ASCE Library: Reston, VA, USA, 2019; pp. 400–410. [Google Scholar]
- Li, Z.; Chen, J.; Sugimoto, M.; Ge, H. Numerical simulation model of artificial ground freezing for tunneling under seepage flow conditions. Tunn. Undergr. Space Technol. 2019, 92, 103035. [Google Scholar] [CrossRef]
- Li, Z.; Chen, J.; Sugimoto, M.; Mao, C. Thermal Behavior in Cross-Passage Construction during Artificial Ground Freezing: Case of Harbin Metro Line. J. Cold Reg. Eng. 2020, 34, 1–13. [Google Scholar] [CrossRef]
- Uprety, M.; Ochoa-Tocachi, B.F.; Paul, J.D.; Regmi, S.; Buytaert, W. Improving water resources management using participatory monitoring in a remote mountainous region of Nepal. J. Hydrol. Reg. Stud. 2019, 23, 100604. [Google Scholar] [CrossRef]
- Jaiswal, R.K.; Yadav, R.N.; Lohani, A.K.; Tiwari, H.L.; Yadav, S. Water balance modeling of Tandula (India) reservoir catchment using SWAT. Arab. J. Geosci. 2020, 13, 148. [Google Scholar] [CrossRef]
- Li, Z.; Gui, J.; Wang, X.; Feng, Q.; Zhao, T.; Ouyang, C.; Guo, X.; Zhang, B.; Shi, Y. Water resources in inland regions of central Asia: Evidence from stable isotope tracing. J. Hydrol. 2019, 570, 1–16. [Google Scholar] [CrossRef]
- Liu, Q.; Hanati, G.; Danierhan, S.; Zhang, Y.; Zhang, Z. Simulation of Groundwater Level in Ephemeral Streams with an Improved Groundwater Hydraulics Model. Groundwater 2019, 57, 969–979. [Google Scholar] [CrossRef] [PubMed]
- Ren, J.; Cheng, J.; Zhang, W.; Yang, J.; Zhou, Y.; Men, L.; Dai, J. Vertical fluid flux in the hyporheic zone: Field investigation, model, and comparative analysis. Arab. J. Geosci. 2020, 13, 1–14. [Google Scholar] [CrossRef]
- Lewandowski, J.; Meinikmann, K.; Krause, S. Groundwater—Surface Water Interactions: Recent Advances and Interdisciplinary Challenges. Water 2020, 12, 296. [Google Scholar] [CrossRef] [Green Version]
- Ma, D.; Wang, J.; Li, Z. Effect of particle erosion on mining-induced water inrush hazard of karst collapse pillar. Environ. Sci. Pollut. Res. 2019, 26, 19719–19728. [Google Scholar] [CrossRef]
- Yang, B.; Yang, T.; Xu, Z.; Liu, H.; Yang, X.; Shi, W. Impact of particle-size distribution on flow properties of a packed column. J. Hydrol. Eng. 2019, 24, 1–11. [Google Scholar] [CrossRef]
- Zhang, B.Y.; Lin, Z.B. Seepage Property of Crushed Mudstone Rock in Collapse Column. Adv. Civ. Eng. 2020, 2020, 1–10. [Google Scholar] [CrossRef]
- Zhang, W.; Zhang, L.; Cui, P.; Gao, Y.; Liu, J.; Yu, M. Investigation of the influence of groundwater seepage on the heat transfer characteristics of a ground source heat pump system with a 9-well group. In Building Simulation; Tsinghua University Press: Beijing, China, 2019; Volume 12, pp. 857–868. [Google Scholar]
- Wang, R.; Yang, C.; Ni, L.; Yao, Y. Experimental study on heat transfer of soil with different moisture contents and seepage for ground source heat pump. Indoor Built Environ. 2020, 29, 1–11. [Google Scholar] [CrossRef]
- Gossler, M.A.; Bayer, P.; Zosseder, K. Experimental investigation of thermal retardation and local thermal non-equilibrium effects on heat transport in highly permeable, porous aquifers. J. Hydrol. 2019, 578, 124097. [Google Scholar] [CrossRef]
- Liu, X.; Li, W.; Liu, J.; Li, S.; Li, J. Experimental study of influence factors on heat transfer characteristics of brine aquifer. Appl. Therm. Eng. 2019, 146, 495–504. [Google Scholar] [CrossRef]
- Chen, J.; Xiong, F.; Zheng, J.; Ge, Q.; Cheng, F. The influence of infiltration angle on the identification effect of seepage with linear heat source method. Meas. J. Int. Meas. Confed. 2019, 148, 106974. [Google Scholar] [CrossRef]
- Huang, Y.; Zhang, Y.; Yu, Z.; Ma, Y.; Zhang, C. Experimental investigation of seepage and heat transfer in rough fractures for enhanced geothermal systems. Renew. Energy 2019, 135, 846–855. [Google Scholar] [CrossRef]
- Luo, Z.; Xu, H. Numerical simulation of heat and mass transfer through microporous media with lattice Boltzmann method. Therm. Sci. Eng. Prog. 2019, 9, 44–51. [Google Scholar] [CrossRef]
- Zhang, W.; Zhang, L.; Gao, Y.; Gao, X.; Zhang, H.; Yu, M. The annual fluctuation of underground temperature response caused by ground heat exchanger in the condition of groundwater seepage. Energy Build. 2019, 186, 37–45. [Google Scholar] [CrossRef]
- Jiang, Y.; Wang, X.; Li, M.; Gao, Q. Investigations on heat flow characteristics of the aquifer for groundwater heat pump (GWHP) composed of different well types. Int. J. Green Energy 2019, 16, 857–866. [Google Scholar] [CrossRef]
- Zhou, X.; Gao, Q.; Chen, X.; Yu, M.; Zhao, X. Numerically simulating the thermal behaviors in groundwater wells of groundwater heat pump. Energy 2013, 61, 240–247. [Google Scholar] [CrossRef]
- Klepikova, M.; Wildemeersch, S.; Hermans, T.; Jamin, P.; Orban, P.; Nguyen, F.; Brouyère, S.; Dassargues, A. Heat tracer test in an alluvial aquifer: Field experiment and inverse modelling. J. Hydrol. 2016, 540, 812–823. [Google Scholar] [CrossRef] [Green Version]
- Wildemeersch, S.; Jamin, P.; Orban, P.; Hermans, T.; Klepikova, M.; Nguyen, F.; Brouyère, S.; Dassargues, A. Coupling heat and chemical tracer experiments for estimating heat transfer parameters in shallow alluvial aquifers. J. Contam. Hydrol. 2014, 169, 90–99. [Google Scholar] [CrossRef]
- Fleuchaus, P.; Godschalk, B.; Stober, I.; Blum, P. Worldwide application of aquifer thermal energy storage —A review. Renew. Sustain. Energy Rev. 2018, 94, 861–876. [Google Scholar] [CrossRef]
- Vonsée, B.; Crijns-Graus, W.; Liu, W. Energy technology dependence—A value chain analysis of geothermal power in the EU. Energy 2019, 178, 419–435. [Google Scholar] [CrossRef]
- Kumari, W.G.; Ranjith, P.G. Sustainable development of enhanced geothermal systems based on geotechnical research—A review. Earth-Sci. Rev. 2019, 199, 102955. [Google Scholar] [CrossRef]
- Şen, Z. Innovative methodologies in renewable energy: A review. Int. J. Energy Res. 2019, 43, 5621–5658. [Google Scholar] [CrossRef]
- Tsagarakis, K.P.; Efthymiou, L.; Michopoulos, A.; Mavragani, A.; Anđelković, A.S.; Antolini, F.; Bacic, M.; Bajare, D.; Baralis, M.; Bogusz, W.; et al. A review of the legal framework in shallow geothermal energy in selected European countries: Need for guidelines. Renew. Energy 2020, 147, 2556–2571. [Google Scholar] [CrossRef]
- Hoekstra, N.; Pellegrini, M.; Bloemendal, M.; Spaak, G.; Gallego, A.A.; Comins, J.R.; Grotenhuis, T.; Picone, S.; Murrell, A.J.; Steeman, H.J.; et al. Increasing market opportunities for renewable energy technologies with innovations in aquifer thermal energy storage. Sci. Total Environ. 2020, 709, 136–142. [Google Scholar] [CrossRef]
- Halaj, E.; Kepinska, B. Conjunctive uses of the geothermal water resources from lower cretaceous formations in the Mogilno–Lodz trough; Poland. Sustain. Water Resour. Manag. 2019, 5, 1479–1494. [Google Scholar] [CrossRef] [Green Version]
- Mannah, M.A.; Makki, L.; Haddad, A.; Bazzi, H. Renewable Energy Technologies Penetration in MENA Region (2010–2030). J. Electr. Eng. 2016, 4, 99–107. [Google Scholar]
- IEA. Renewables 2019, Market Analysis and Forecast from 2019 to 2024; IEA: Paris, France, 2019; pp. 1–7. [Google Scholar]
- Cetin, A.; Kadioglu, Y.K.; Paksoy, H. Underground thermal heat storage and ground source heat pump activities in Turkey. Sol. Energy 2020, 200, 22–28. [Google Scholar] [CrossRef]
- Al-Kayiem, H.H.; Mohammad, S.T. Potential of renewable energy resources with an emphasis on solar power in Iraq: An outlook. Resources 2019, 8, 42. [Google Scholar] [CrossRef] [Green Version]
- Al-Madhlom, Q.; Al-Ansari, N.; Laue, J.; Nordell, B.; Hussain, H.M. Site selection of aquifer thermal energy storage systems in shallow groundwater conditions. Water 2019, 11, 1393. [Google Scholar] [CrossRef] [Green Version]
- Al-Madhlom, Q.; Nordell, B.; Chabuk, A.; Al-Ansari, N.; Lindblom, J.; Laue, J.; Hussain, H.M. Potential use of UTES in Babylon Governorate, Iraq. Groundw. Sustain. Dev. 2020, 10, 100283. [Google Scholar] [CrossRef]
- Todd, D.K.; Mays, L.W. Groundwater Hydrology, 3rd ed.; John Wiley & Sons, Inc.: Hoboken, NJ, USA, 2005. [Google Scholar]
- Kovalevsky, V.S.; Kruseman, G.P.; Rushton, K.R. Groundwater Studies: An International Guide for Hydrogeological Investigations; UNESCO: Paris, France, 2004. [Google Scholar]
- Delleur, J.W. (Ed.) The Handbook of Groundwater Engineering, 2nd ed.; Crc Press Inc., Taylor & Francis Group, LLC: New York, NY, USA, 2007. [Google Scholar]
- Fetter, C.W.J. Applied Hydrogeology, 4th ed.; Pearson Education Limited: Harlow, UK, 2014. [Google Scholar]
- Fetter, C.W.; Boving, T.; Kreamer, D. Contaminant Hydrogeology, 3rd ed.; Waveland Press, Inc.: Long Grove, IL, USA, 2018. [Google Scholar]
- Hiscock, K.M.; Bense, V.F. Hydrogeology: Principles and Practice, 2nd ed.; Wiley & Sons Ltd.: West Sussex, UK, 2014. [Google Scholar]
- Rahmane, A.; Bentafat, A. Reality and prospect of electricity production from renewable energies in Arab countries: Analytical study (1990–2017). Int. J. Energy Econ. Policy 2018, 8, 39–47. [Google Scholar]
- Renewable Energy Potential in the Arab Region. Available online: https://www.eolss.net/Sample-Chapters/C08/E6-106-46.pdf (accessed on 4 June 2020).
- Bhutto, A.W.; Bazmi, A.A.; Zahedi, G.; Klemeš, J.J. A review of progress in renewable energy implementation in the Gulf Cooperation Council countries. J. Clean. Prod. 2014, 71, 168–180. [Google Scholar] [CrossRef]
- Zureikat, Y. Challenges and Strategies for Increasing Adoption of Renewable Energy in the MENA Region; Massachusetts Institute of Technology: Cambridge, MA, USA, 2019. [Google Scholar]
- Ghaebi, H.; Bahadori, M.N.; Saidi, M.H. Different operational alternatives of aquifer thermal energy storage system for cooling and heating of a residential complex under various climatic conditions in Iran. Sci. Iran. 2019, 26, 1281–1292. [Google Scholar] [CrossRef] [Green Version]
- De Schepper, G.; Paulus, C.; Bolly, P.Y.; Hermans, T.; Lesparre, N.; Robert, T. Assessment of short-term aquifer thermal energy storage for demand-side management perspectives: Experimental and numerical developments. Appl. Energy 2019, 242, 534–546. [Google Scholar] [CrossRef] [Green Version]
- Lu, H.; Tian, P.; Guan, Y.; Yu, S. Integrated suitability, vulnerability and sustainability indicators for assessing the global potential of aquifer thermal energy storage. Appl. Energy 2019, 239, 747–756. [Google Scholar] [CrossRef]
- Gao, L.; Zhao, J.; An, Q.; Liu, X.; Du, Y. Thermal performance of medium-to-high-temperature aquifer thermal energy storage systems. Appl. Therm. Eng. 2019, 146, 898–909. [Google Scholar] [CrossRef]
- Pophillat, W.; Bayer, P.; Teyssier, E.; Blum, P.; Attard, G. Impact of groundwater heat pump systems on subsurface temperature under variable advection, conduction and dispersion. Geothermics 2020, 83, 101721. [Google Scholar] [CrossRef]
- Sathe, S.S.; Mahanta, C. Groundwater flow and arsenic contamination transport modeling for a multi aquifer terrain: Assessment and mitigation strategies. J. Environ. Manag. 2019, 231, 166–181. [Google Scholar] [CrossRef]
- Karimi, L.; Motagh, M.; Entezam, I. Modeling groundwater level fluctuations in Tehran aquifer: Results from a 3D unconfined aquifer model. Groundw. Sustain. Dev. 2019, 8, 439–449. [Google Scholar] [CrossRef]
- Qi, Q.Q.; Xu, Y.X.; Song, S.H.; Zhang, Z.Z. Application of a groundwater modelling system in groundwater environmental impact assessment of river and lake connection in western Jilin region. Appl. Ecol. Environ. Res. 2019, 17, 5059–5066. [Google Scholar] [CrossRef]
- Aquaveo. GMS—Groundwater Modeling System. Available online: https://www.aquaveo.com/software/gms-groundwater-modeling-system-introduction (accessed on 5 June 2020).
- Jaxa-Rozen, M.; Kwakkel, J.H.; Bloemendal, M. A coupled simulation architecture for agent-based/geohydrological modelling with NetLogo and MODFLOW. Environ. Model. Softw. 2019, 115, 19–37. [Google Scholar] [CrossRef]
- Hameed, M.R.; Kadhim, Y.M.; Abbas, E.H.; Khudhair, Y.S. Simulation of Lowering Groundwater in the Right Bank of Derbendikhan Dam. Int. J. Civ. Eng. Technol. 2019, 10, 3003–3014. [Google Scholar]
- Patil, N.S.; Chetan, N.L.; Nataraja, M.; Suthar, S. Climate change scenarios and its effect on groundwater level in the Hiranyakeshi watershed. Groundw. Sustain. Dev. 2020, 10, 100323. [Google Scholar] [CrossRef]
- Waterloo Hydrogeologic. Visual MODFLOW Flex. Available online: https://www.waterloohydrogeologic.com/visual-modflow-flex/ (accessed on 5 June 2020).
- Naranjo-Fernández, N.; Guardiola-Albert, C.; Montero-González, E. Applying 3D geostatistical simulation to improve the groundwater management modelling of sedimentary aquifers: The case of Doñana (Southwest Spain). Water 2018, 11, 39. [Google Scholar] [CrossRef] [Green Version]
- Lekula, M.; Lubczynski, M.W. Use of remote sensing and long-term in-situ time-series data in an integrated hydrological model of the Central Kalahari Basin, Southern Africa. Hydrogeol. J. 2019, 27, 1541–1562. [Google Scholar] [CrossRef] [Green Version]
- Nonterah, C.; Xu, Y.; Osae, S. Groundwater occurrence in the Sakumo wetland catchment, Ghana: Model–setting–scenario approach. Hydrogeol. J. 2019, 27, 983–996. [Google Scholar] [CrossRef]
- United States Geological Survey (USGS). ModelMuse: A Graphical User Interface for Groundwater Models. Available online: https://www.usgs.gov/software/modelmuse-a-graphical-user-interface-groundwater-models (accessed on 5 June 2020).
- Rehman, H.U.; Ahmad, Z.; Ashraf, A.; Ali, S.S. Predicting groundwater potential zones in Upper Thal Doab, Indus Basin through integrated use of RS and GIS techniques and groundwater flow modeling. Arab. J. Geosci. 2019, 12, 621. [Google Scholar] [CrossRef]
- Kaushik, S.; Dhote, P.R.; Thakur, P.K.; Nikam, B.R.; Aggarwal, S.P. An integrated approach for identification of waterlogged areas using RS and GIS technique and groundwater modelling. Sustain. Water Resour. Manag. 2019, 5, 1887–1901. [Google Scholar] [CrossRef]
- Nhu, V.H.; Rahmati, O.; Falah, F.; Shojaei, S.; Al-Ansari, N.; Shahabi, H.; Shirzadi, A.; Górski, K.; Nguyen, H.; Ahmad, B.B. Mapping of groundwater spring potential in karst aquifer system using novel ensemble bivariate and multivariate models. Water 2020, 12, 985. [Google Scholar] [CrossRef] [Green Version]
- Al-Madhlom, Q.; Hamza, B.; Al-Ansari, N.; Laue, J.; Nordell, B.; Hussain, H.M. Site Selection Criteria of UTES Systems in Hot Climate Critères de sélection du site des systèmes UTES dans un climat chaud. In Proceedings of the XVII ECSMGE-2019, Reykjavik, Iceland, 1–7 September 2019. [Google Scholar]
- Naicker, K.; Cukrowska, E.; McCarthy, T.S. Acid mine drainage arising from gold mining activity in Johannesburg, South Africa and environs. Environ. Pollut. 2003, 122, 29–40. [Google Scholar] [CrossRef]
- Tomiyama, S.; Igarashi, T.; Tabelin, C.B.; Tangviroon, P.; Ii, H. Modeling of the groundwater flow system in excavated areas of an abandoned mine. J. Contam. Hydrol. 2020, 230, 103617. [Google Scholar] [CrossRef]
- Ta, D.; Cao, S.; Steyl, G.; Yang, H.; Li, Y. Prediction of Groundwater Inflow into an Iron Mine: A Case Study of the Thach Khe Iron Mine, Vietnam. Mine Water Environ. 2019, 38, 310–324. [Google Scholar] [CrossRef]
- Bayer-Raich, M.; Credoz, A.; Guimerà, J.; Jordana, S.; Sampietro, D.; Font-Capó, J.; Nief, N.; Grossemy, M. Estimates of Horizontal Groundwater Flow Velocities in Boreholes. Groundwater 2019, 57, 525–533. [Google Scholar] [CrossRef] [PubMed]
- Fang, X.; Xiong, F.; Chen, J. An Experimental Study on Fiber Bragg Grating-Point Heat Source Integration System for Seepage Monitoring. IEEE Sens. J. 2019, 19, 12346–12352. [Google Scholar] [CrossRef]
- Environmental Systems Research Institute ESRI. ArcMap 10.6 (10.6.1) Software. 2018. Available online: https://support.esri.com/en/products/desktop/arcgis-desktop/arcmap/10-6 (accessed on 5 June 2020).
- Yacoub, S.Y. Geomorphology of the mesopotamia plain. Iraqi Bull. Geol. Min. 2011, 4, 7–32. [Google Scholar]
- Yacoub, S.Y. Stratigraphy of the Mesopotamia plain. Iraqi Bull. Geol. Min. 2011, Special Issue, 47–82. Available online: https://www.iasj.net/iasj?func=fulltext&aId=61737 (accessed on 9 June 2020).
- Sissakian, V.K.; Fouad, S.F. Geological map of Iraq, scale 1: 1000 000, 4th edition, 2012. Iraqi Bull. Geol. Min. 2015, 11, 9–16. [Google Scholar]
- Jassim, S.Z.; Goff, J.C. Geology of Iraq; Dolin (Prague and Moravian Museum): Brno, Czechia, 2006. [Google Scholar]
- Al-Jiburi, H.K.; Al-Basrawi, N.H. Hydrogeology of the Mesopotamia plain. Iraqi Bull. Geol. Min. 2011, Special Issue, 1–21. [Google Scholar]
- Al-Jiburi, H.K.; Al-Basrawi, N.H. Hydrological map of Iraq, scale 1:1000,000, 2nd edition, 2013. Iraqi Bull. Geol. Min. 2015, 11, 17–26. [Google Scholar]
- Sissakian, V.K.; Buthaina, S.M. Stratigraphy. Iraqi Bull. Geol. Min. 2007, Special Issue, 51–124. Available online: http://ibgm-iq.org/ibgm/index.php/ibgm/article/view/61 (accessed on 3 June 2020).
- Al-kubaisi, Q.Y.; Al-abadi, A.M.; Al-ghanimy, M.A. Mapping groundwater quality Index for irrigation in the Dibdibba aquifer at Karbala—Najaf plateau, central of Iraq. Iraqi J. Sci. 2018, 59, 1636–1652. [Google Scholar]
- Allaby, M. A Dictionary of Geology and Earth Sciences, 4th ed.; Oxford University Press: Oxford, UK, 2013. [Google Scholar]
- Hassan, K.M. Stratigraphy of Karbala—Najaf Area, Central Iraq. Iraqi Bull. Geol. Min. 2007, 3, 53–62. [Google Scholar]
- Al-Madhlom, Q.; Al-Ansari, N.; Hussain, H.M.; Lindblom, J.; Abdullah, T.; Hamza, B.A.; Knutsson, S. Seepage Velocity of Dibdibba Formation in Karbala, Iraq. Engineering 2017, 9, 279–290. [Google Scholar] [CrossRef] [Green Version]
- Jassim, R. Gypsum deposits in Iraq: An overview. Iraqi Bull. Geol. Min. 2019, Special Issiue, 241–261. [Google Scholar]
- Gupta, R.S. Hydrology & Hydraulic Systems, 4th ed.; Waveland Press Inc.: Long Grove, IL, USA, 2017. [Google Scholar]
- Estabragh, A.R.; Soltani, A.; Javadi, A.A. Models for predicting the seepage velocity and seepage force in a fiber reinforced silty soil. Comput. Geotech. 2016, 75, 174–181. [Google Scholar] [CrossRef]
- Environmental Systems Research Institute (ESRI). ArcMap. Available online: https://desktop.arcgis.com/en/arcmap/ (accessed on 3 June 2020).
- Environmental Systems Research Institute (ESRI). Darcy Velocity. Available online: https://desktop.arcgis.com/en/arcmap/10.3/tools/spatial-analyst-toolbox/darcy-velocity.htm (accessed on 7 June 2020).
- Environmental Systems Research Institute (ESRI). How Darcy Flow and Darcy Velocity Work. Available online: https://desktop.arcgis.com/en/arcmap/10.3/tools/spatial-analyst-toolbox/how-darcy-flow-and-darcy-velocity-work.htm (accessed on 5 June 2020).
- Environmental Systems Research Institute (ESRI). Projection Basics the GIS Professional Needs to Know. Available online: http://webhelp.esri.com/arcgisdesktop/9.3/index.cfm?TopicName=ProjectionbasicstheGISprofessionalneedstoknow#:~:text=Coordinatesystems%2Calsoknownas,areaontheearth’ssurface (accessed on 7 June 2020).
- Environmental Systems Research Institute (ESRI). Universal Transverse Mercator (UTM). Available online: http://webhelp.esri.com/arcgisdesktop/9.3/index.cfm?TopicName=Universal_Transverse_Mercator (accessed on 7 June 2020).
- Al-Ani, A.A. Selection of Best Technique to Evaluate Groundwater Recharge a Case Study of Dibdiba Aquifer in Area of Karballa-Najaf. Ph.D. Thesis, University of Baghdad, Baghdad, Iraq, 2004. [Google Scholar]
- Al-Jiburi, H.K.; and Al-Basrawi, N.H. Hydrogeology. Iraqi Bull. Geol. Min. 2007, Special Issue, 125–144. [Google Scholar]
- Hameed, W. Kriging of Groundwater Level—A Case Study of Dibdiba Aquifer in Area of Karballa-Najaf. J. Kerbala Univ. 2008, 6, 170–182. [Google Scholar]
- Al-Dabbas, M.; Khafaji, R.; Al-Jaberi, M.H. Impact of climate changes on the hydrogeological aquifers- case study Dibdiba aquifer at Karbala Najaf area, Iraq. Int. J. Res. Sci. Technol. 2015, 5, 24–39. [Google Scholar]
- Thabit, J.M.; Khalid, F.H. Resistivity imaging survey to delineate subsurface seepage of hydrocarbon contaminated water at Karbala Governorate, Iraq. Environ. Earth Sci. 2016, 75, 1–7. [Google Scholar] [CrossRef]
- Al-Sudani, H.I. Hydrogeological Properties of Groundwater in Karbala’a Governorate—Iraq Introduction. J. Univ. Babylon Eng. Sci. 2018, 26, 70–84. [Google Scholar]
- Al-Abadi, A.M.; Handhal, A.M.; Al-Ginamy, M.A. Evaluating the Dibdibba Aquifer Productivity at the Karbala–Najaf Plateau (Central Iraq) Using GIS-Based Tree Machine Learning Algorithms. Nat. Resour. Res. 2020, 29, 1989–2009. [Google Scholar] [CrossRef]
- Al-Areedhi, H.H. Modelling of Groundwater Flow for the Iraqi Aquifers. Ph.D. Thesis, University of Technology, Baghdad, Iraq, 2019. [Google Scholar]
- Saleh, S.A.; Al-ansari, N.; Abdullah, T. Groundwater Hydrology in Iraq. J. Earth Sci. Geotech. Eng. 2020, 10, 155–197. [Google Scholar]
- Al-Ansari, N.; Sissakian, V.K.; Adamo, N. Hydrogeology of the Mesopotamian Plain: A Critical Review. J. Earth Sci. Geotech. Eng. 2020, 10, 111–124. [Google Scholar]
- Al Maimuri, N.M. Radon (222Rn) occurrence in quaternary deposits, annual dosage, and groundwater recirculation in Hashimiya, Iraq. Sustain. Water Resour. Manag. 2017, 5050, 11. [Google Scholar] [CrossRef]


| Region | Actual Effective Porosity (as Percent) | Material | Total Porosity (as Percent), [73] |
|---|---|---|---|
| Babylon | 21.9–26.2 | Silt | 46 |
| Clay | 42 | ||
| Dibdibba | 23–29.3 | Sandstone, medium grained | 37 |
| Property | Unit | Babylon | Dibdibba |
|---|---|---|---|
| Groundwater elevation | m.a.s.l. | 16–38.27 | 17.53–40.19 |
| Effective porosity range | % | 21.9–26.2 | 23–29.3 |
| Saturated thickness | m | 8.82–32.51 | 18.75–45.47 |
| Transmissivity | m2/d | 52–157 | 29.21–426.61 |
| Hydraulic gradient | m/km | 0–8.37 | 0–5.95 |
| Seepage velocity magnitude | m/d | 2.12 × 10⁻⁶–0.185 | 0–0.272 |
| Seepage velocity direction | - | Northwest to southeast | West to east |
© 2020 by the authors. Licensee MDPI, Basel, Switzerland. This article is an open access article distributed under the terms and conditions of the Creative Commons Attribution (CC BY) license (http://creativecommons.org/licenses/by/4.0/).
Share and Cite
Al-Madhlom, Q.; Al-Ansari, N.; Hamza, B.A.; Laue, J.; Hussain, H.M. Seepage Velocity: Large Scale Mapping and the Evaluation of Two Different Aquifer Conditions (Silty Clayey and Sandy). Hydrology 2020, 7, 60. https://doi.org/10.3390/hydrology7030060
Al-Madhlom Q, Al-Ansari N, Hamza BA, Laue J, Hussain HM. Seepage Velocity: Large Scale Mapping and the Evaluation of Two Different Aquifer Conditions (Silty Clayey and Sandy). Hydrology. 2020; 7(3):60. https://doi.org/10.3390/hydrology7030060
Chicago/Turabian StyleAl-Madhlom, Qais, Nadhir Al-Ansari, Bashar Abid Hamza, Jan Laue, and Hussain Musa Hussain. 2020. "Seepage Velocity: Large Scale Mapping and the Evaluation of Two Different Aquifer Conditions (Silty Clayey and Sandy)" Hydrology 7, no. 3: 60. https://doi.org/10.3390/hydrology7030060