The Influence of Snow and Ice Albedo towards Improved Lake Ice Simulations


Abstract
:1. Introduction
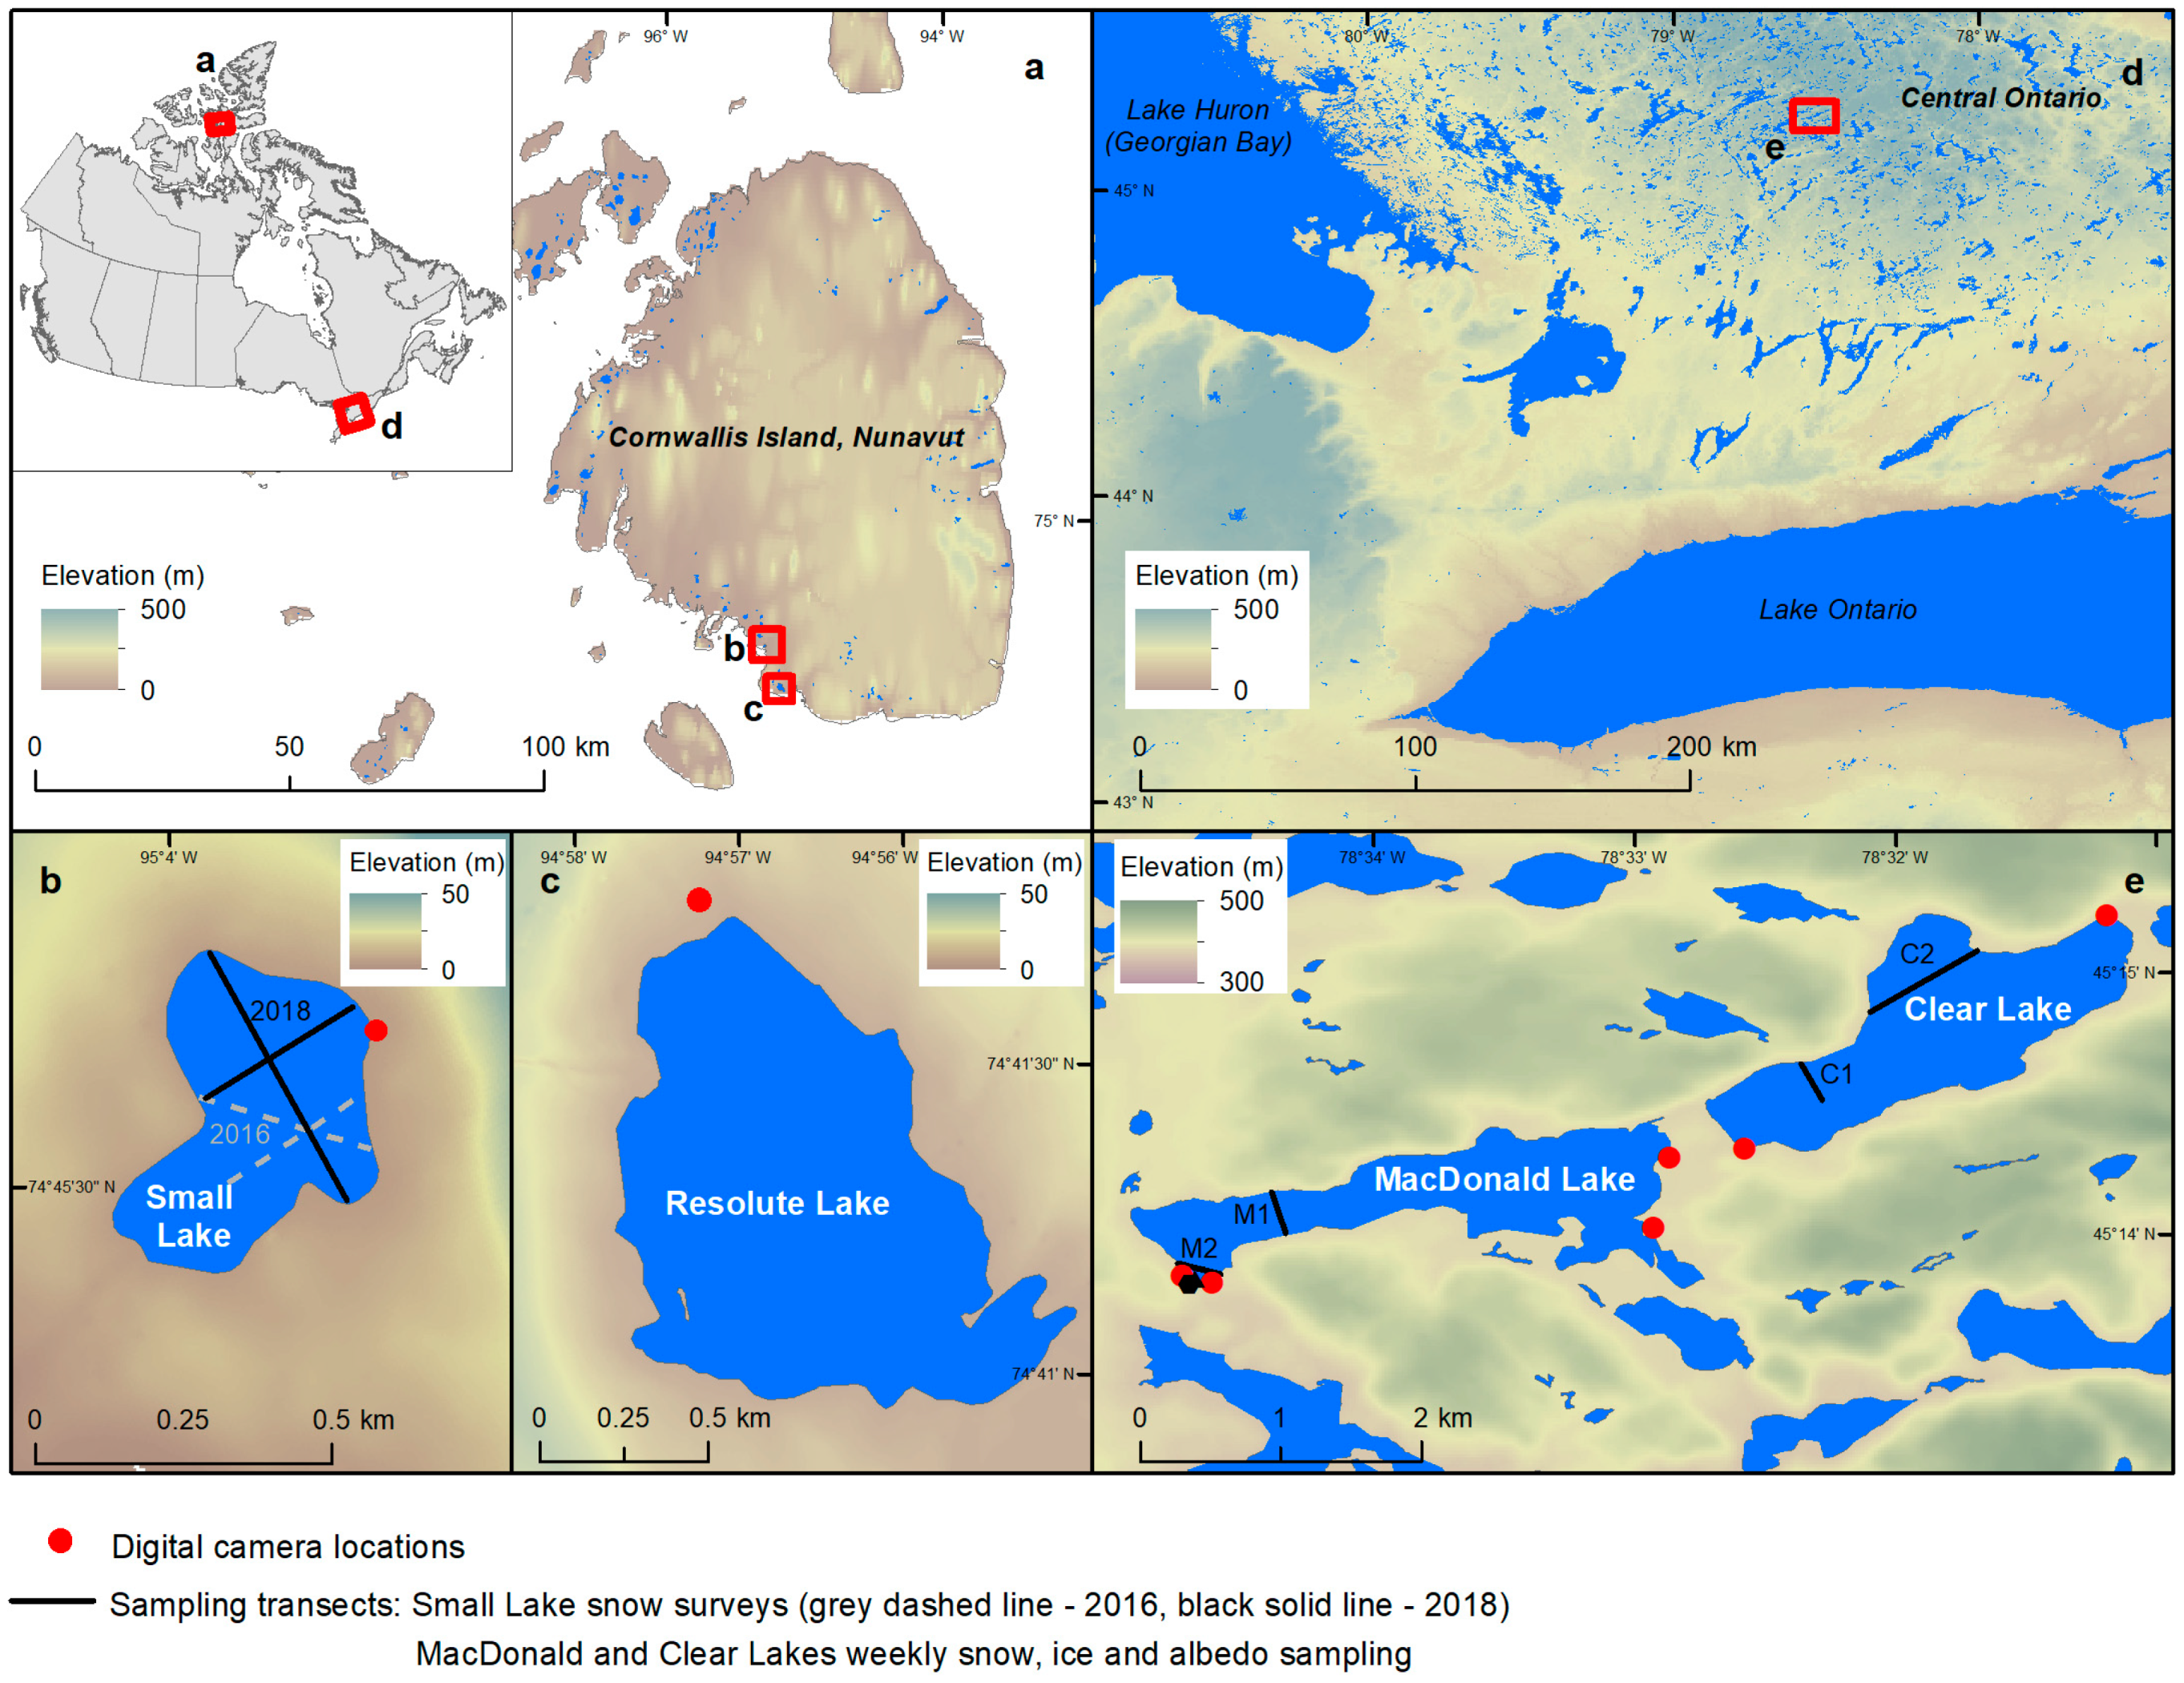
2. Study Areas
2.1. Study Area: High Arctic
2.2. Study Area: Temperate
3. Data and Methodology
3.1. Terminology
3.2. Data Collection
3.2.1. High Arctic
3.2.2. Temperate
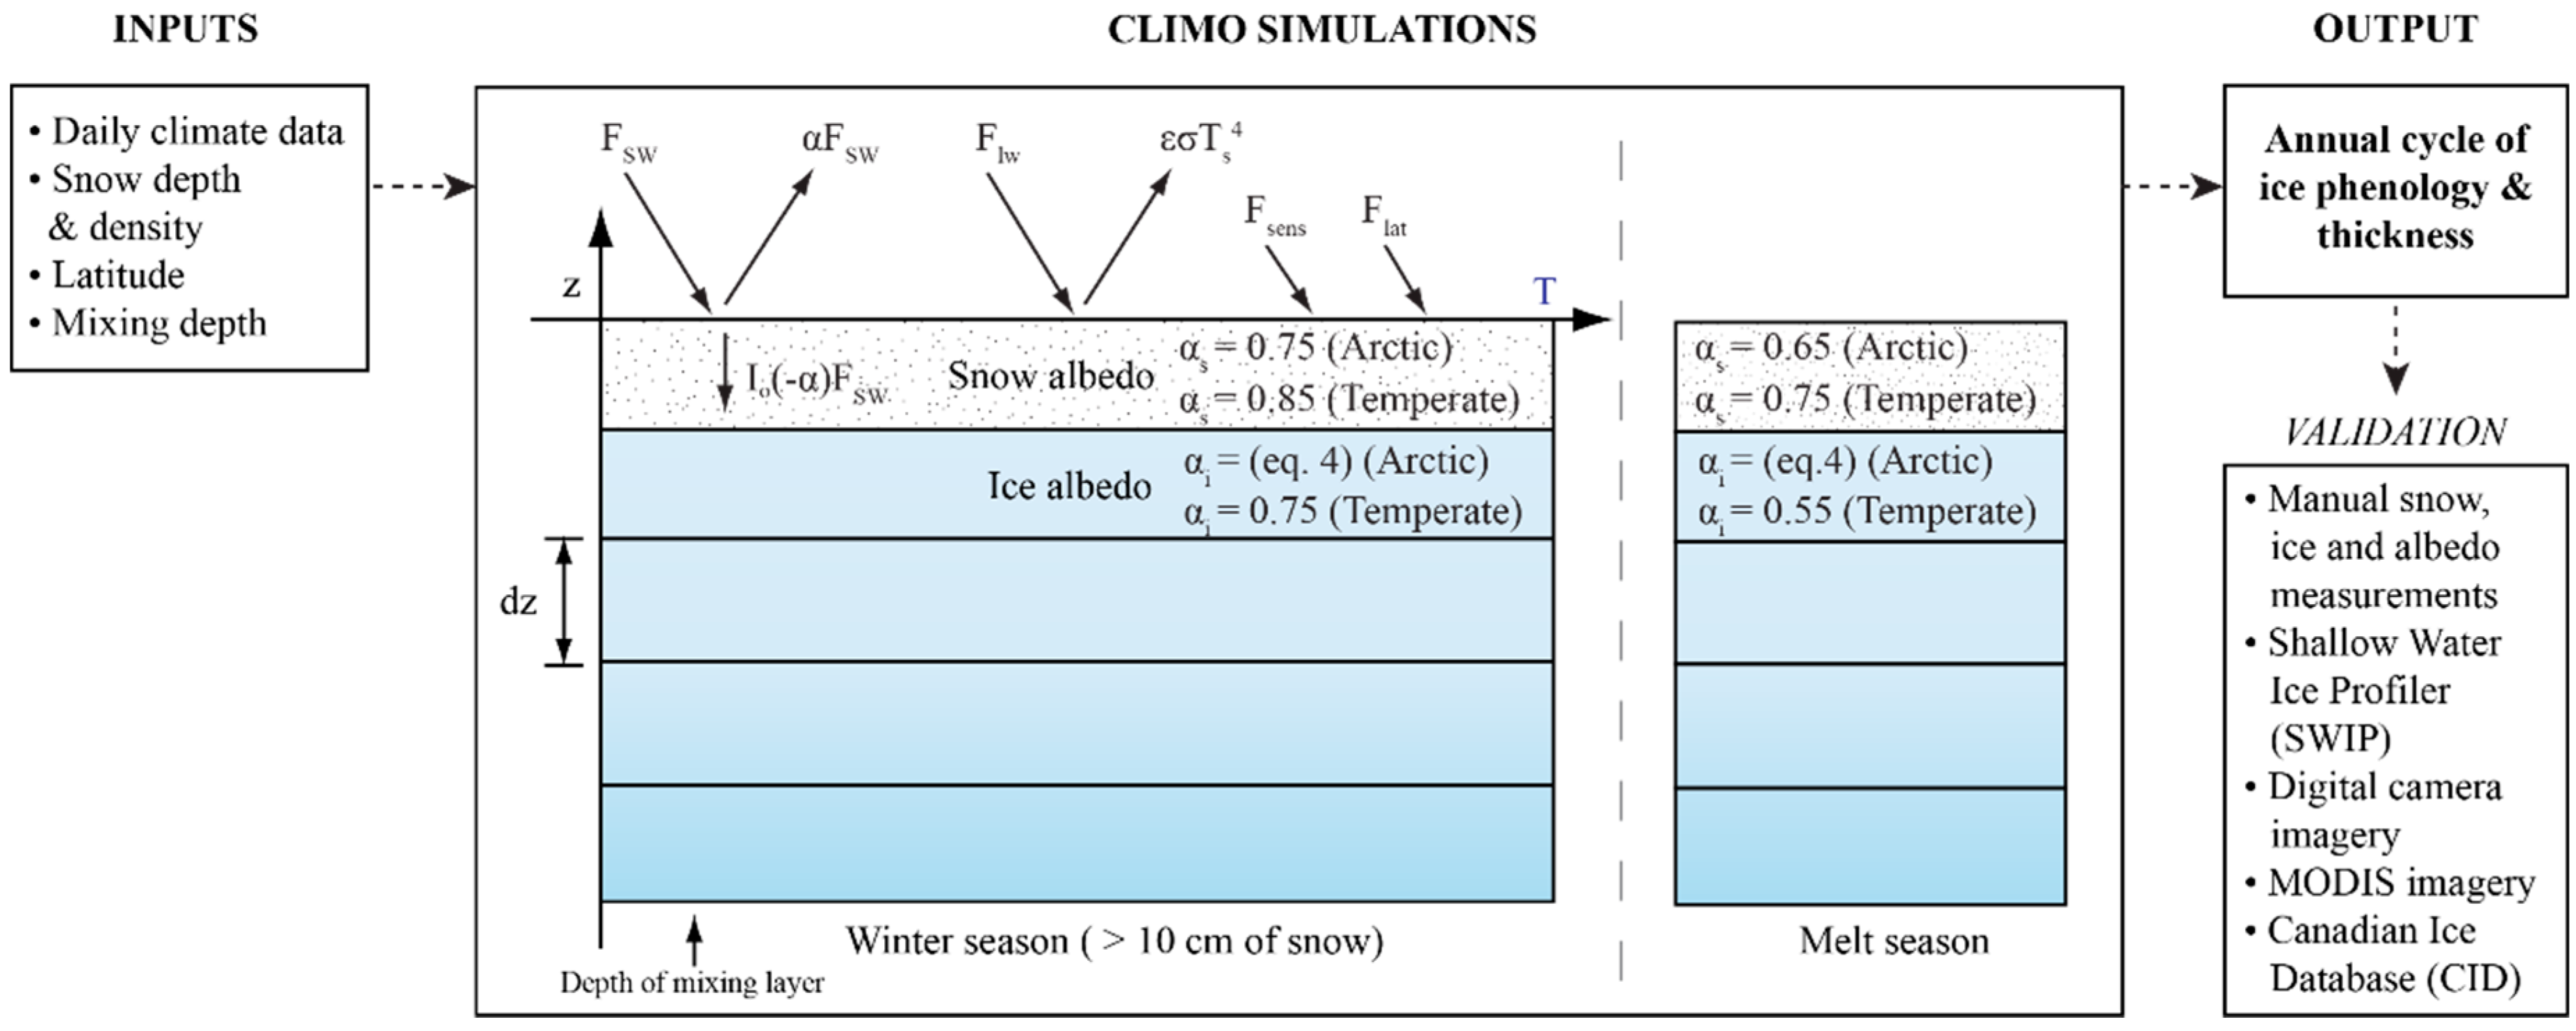
3.3. Lake Ice Model—For High Latitudes
3.4. Lake Ice Model—For Temperate Latitudes
3.5. Model Performance
4. Results and Discussion
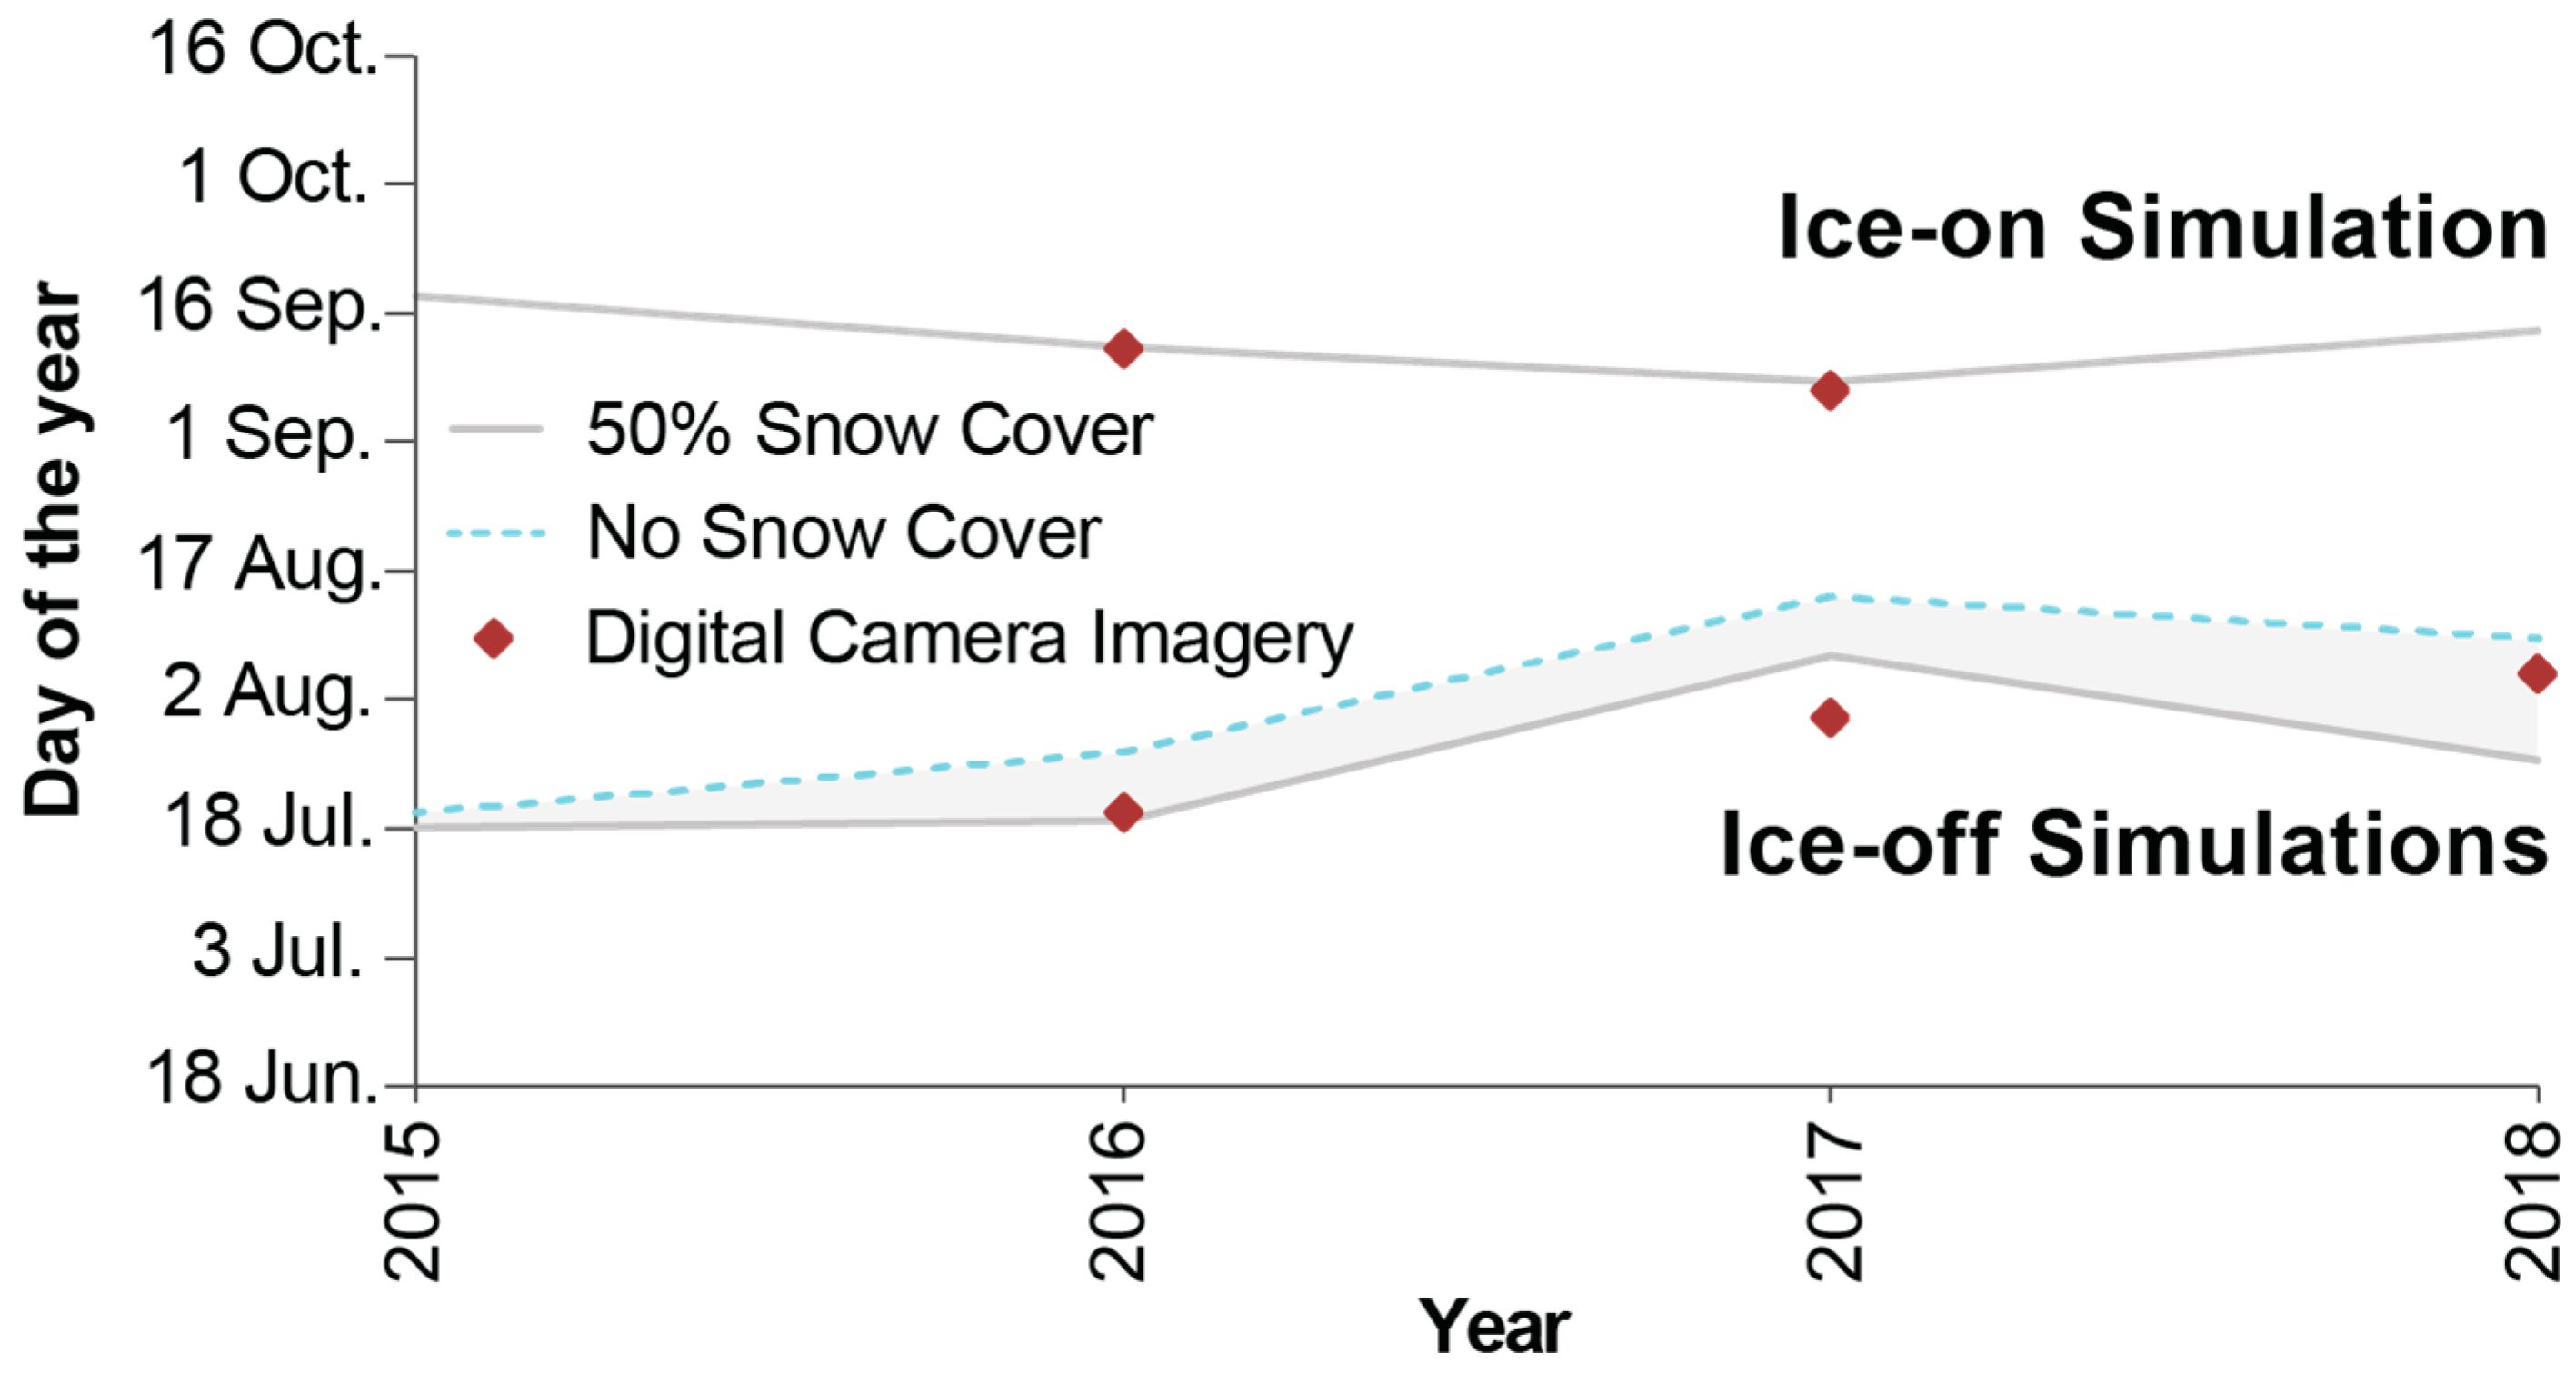
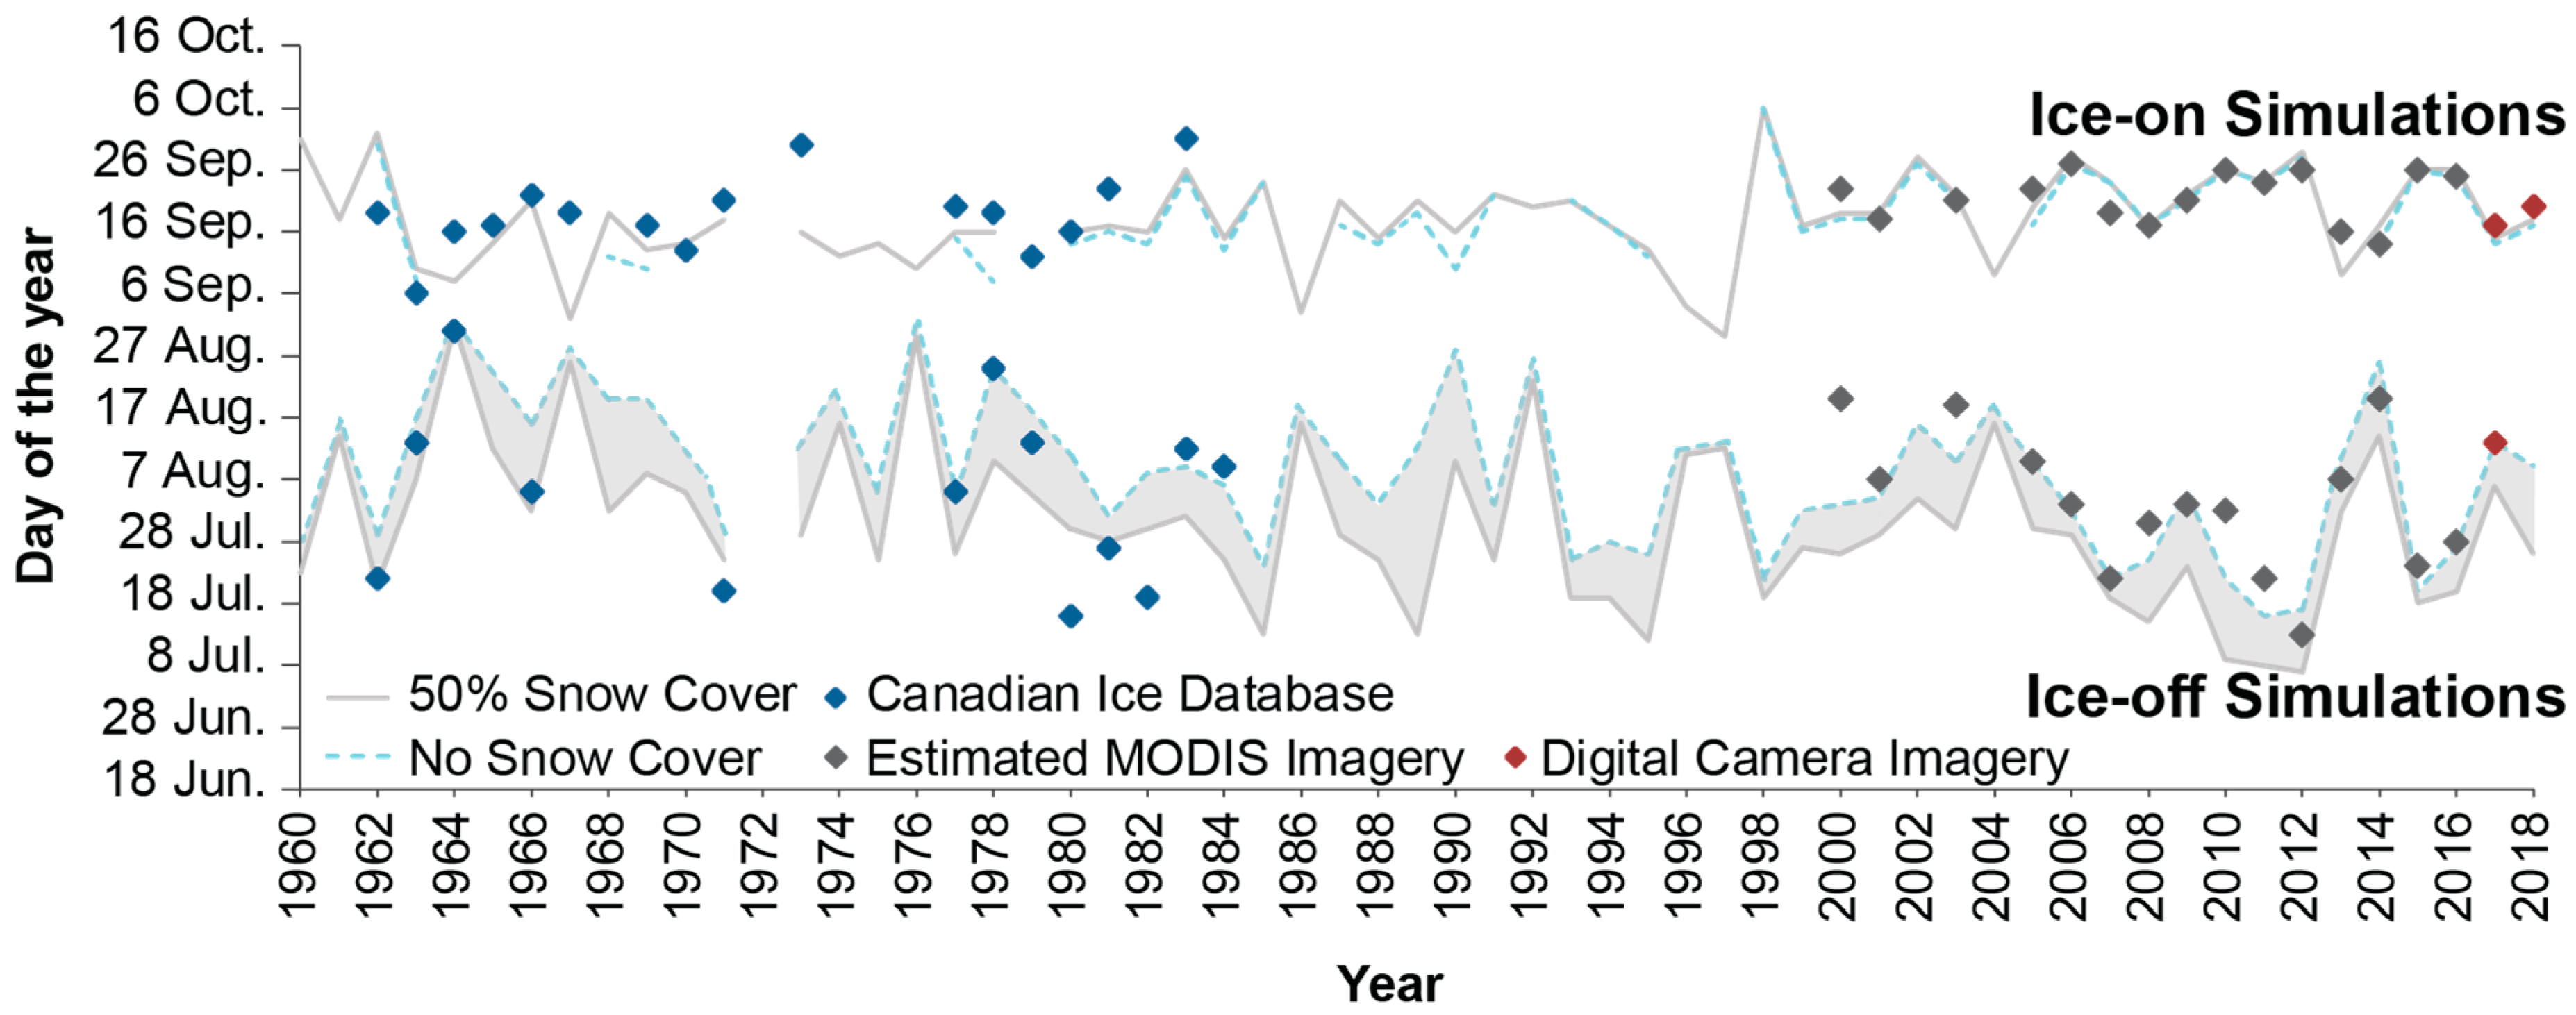
4.1. Model Simulations—High Arctic
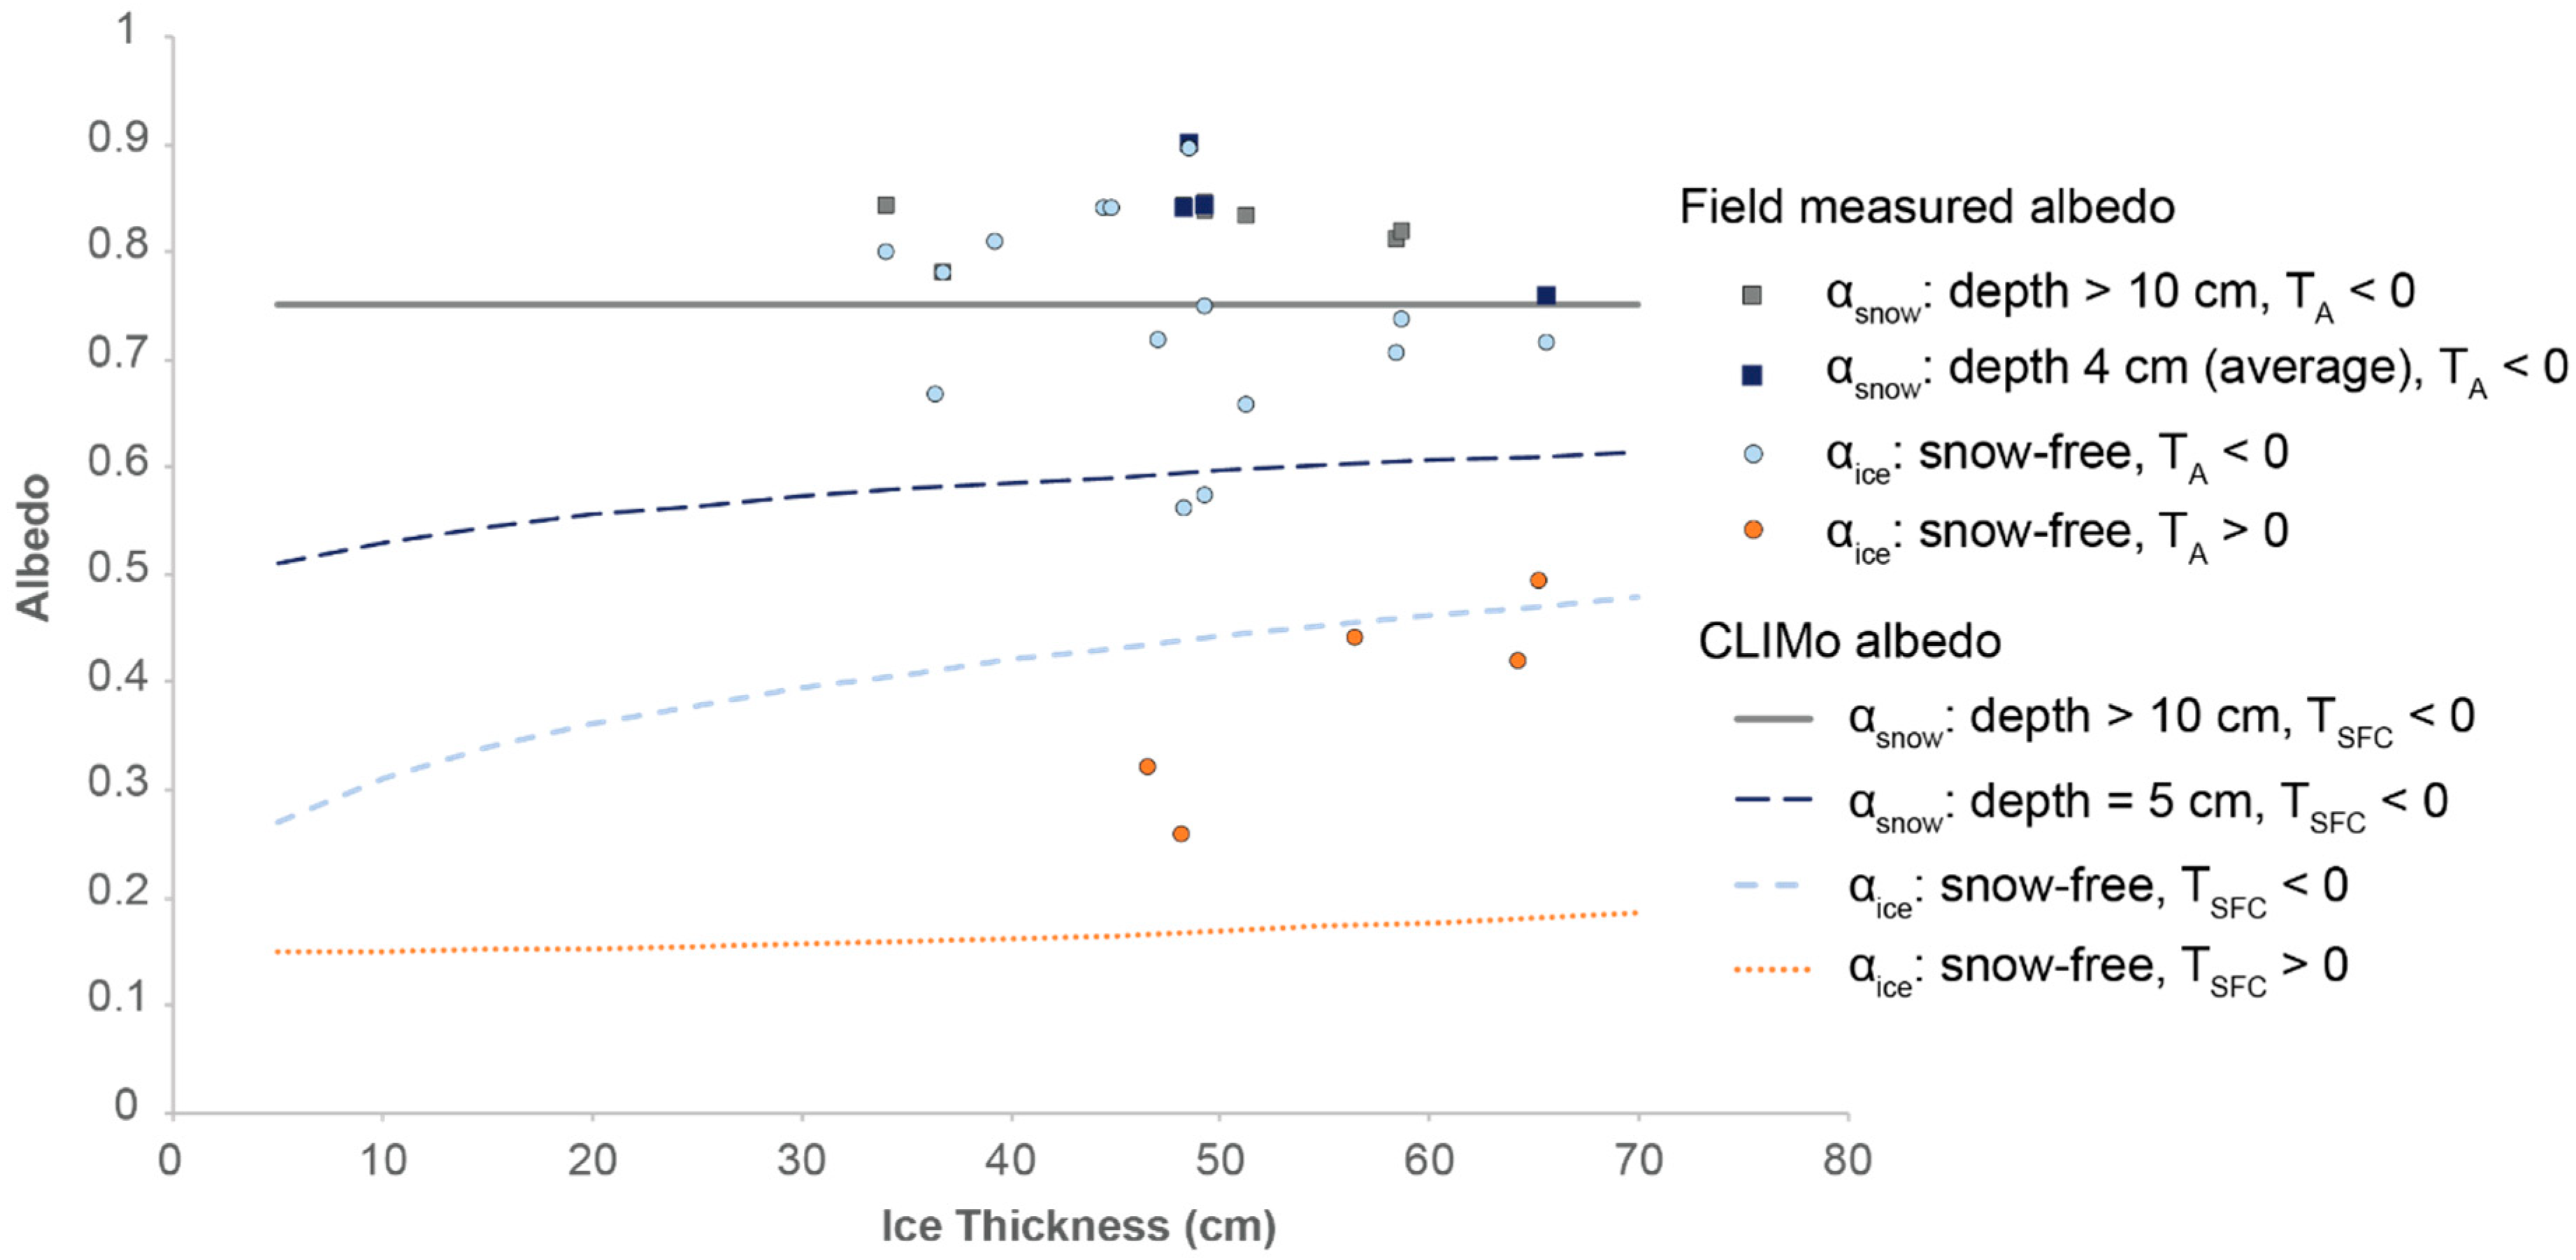
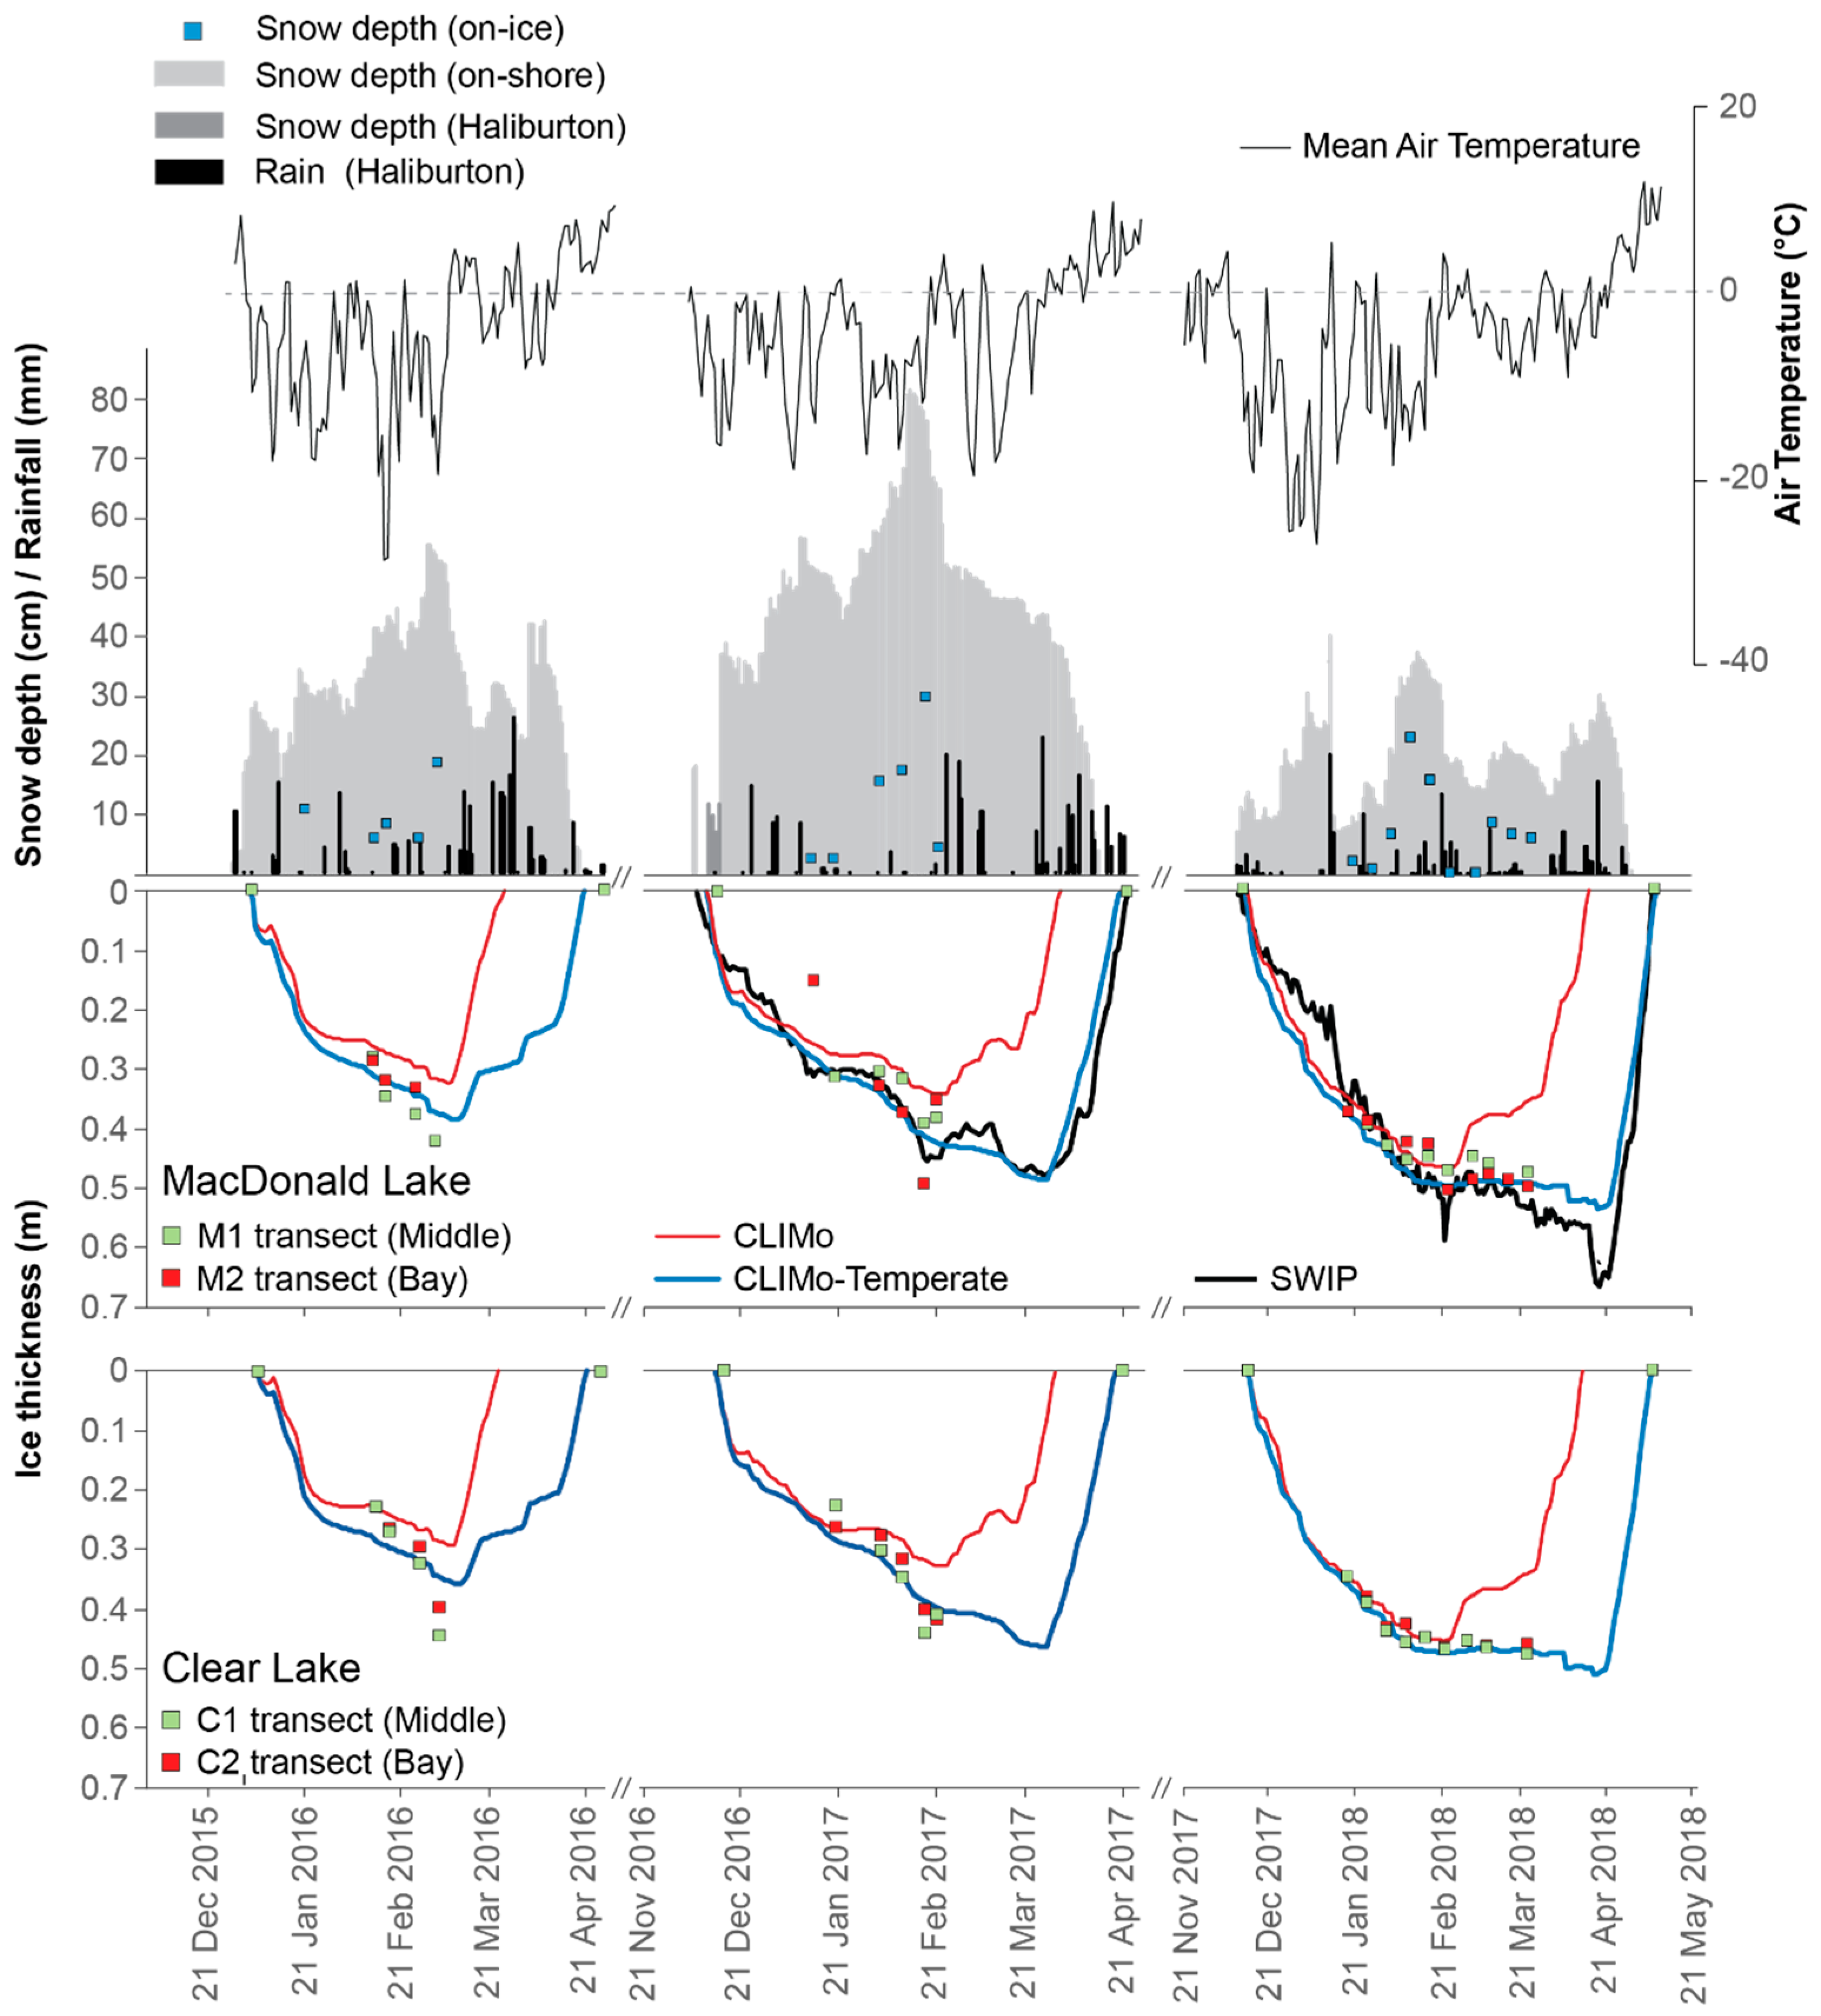
4.2. Model Simulations—Temperate
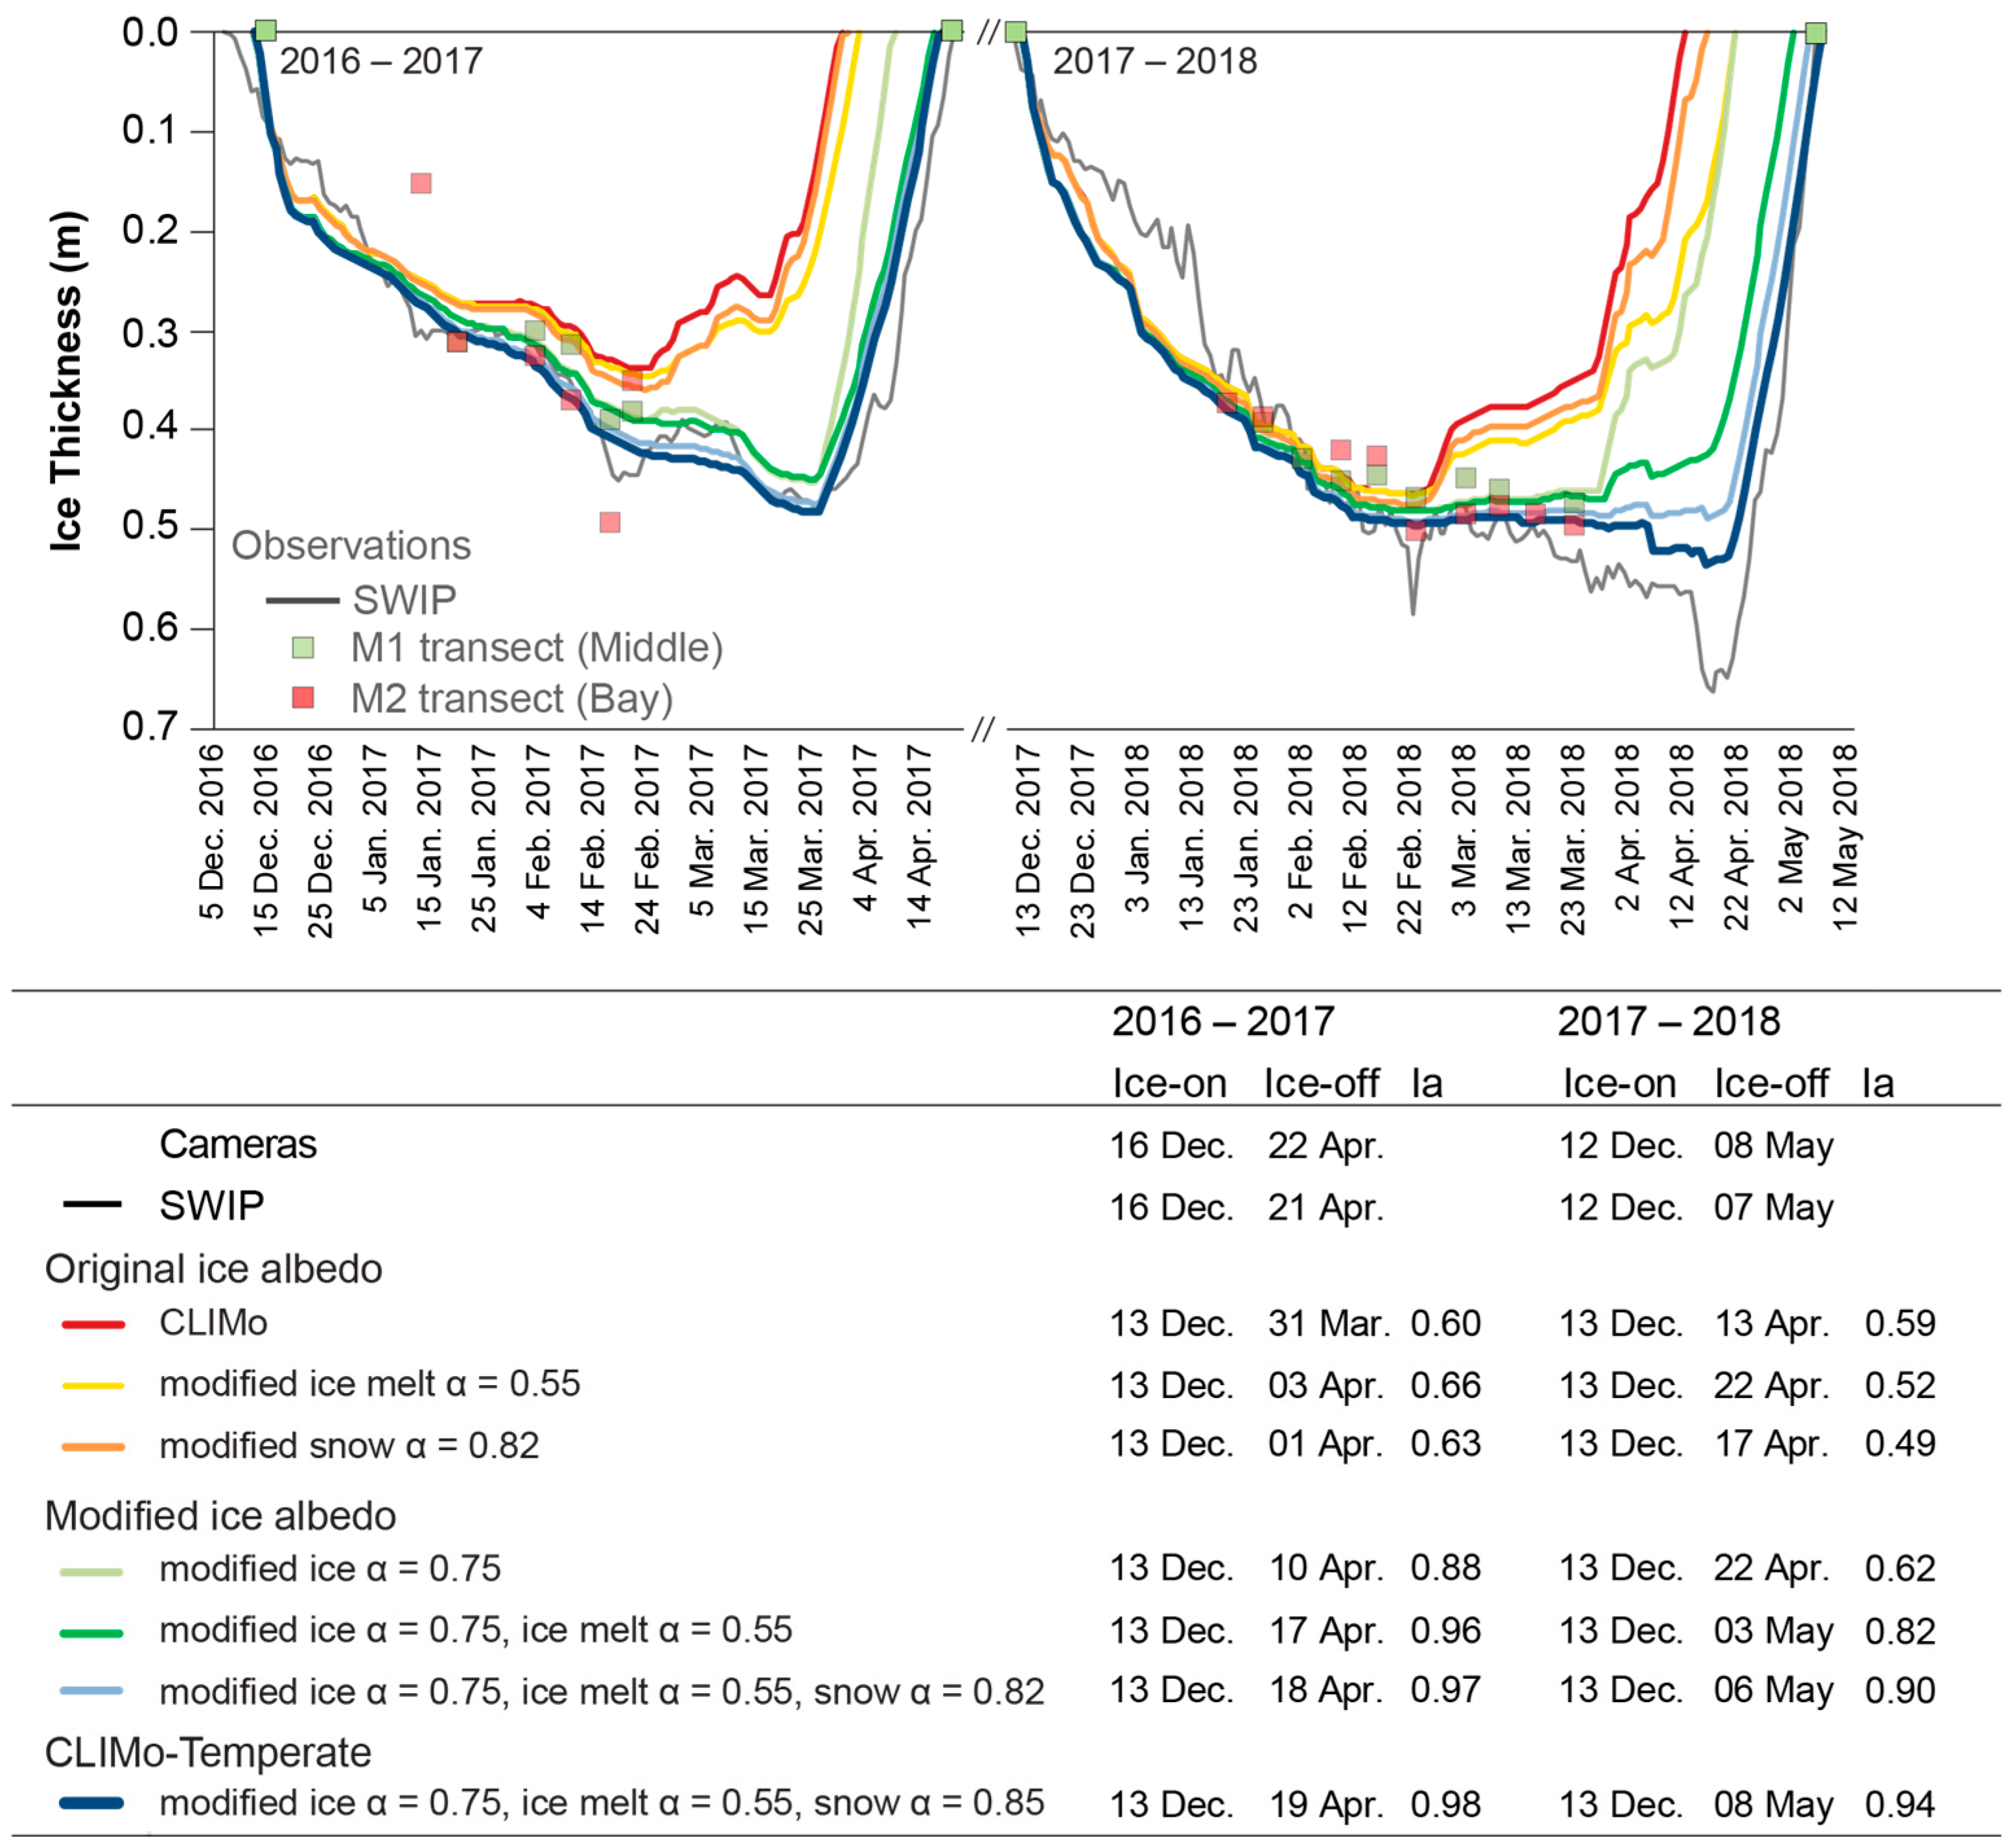
4.3. Improved Model Simulations—CLIMo-Temperate
5. Summary and Conclusions
Author Contributions
Funding
Data Availability Statement
Acknowledgments
Conflicts of Interest
References
- Verpoorter, C.; Kutser, T.; Seekell, D.A.; Tranvik, L.J. A global inventory of lakes based on high-resolution satellite imagery. Geophys. Res. Lett. 2014, 41, 6396–6402. [Google Scholar] [CrossRef]
- Benson, B.J.; Magnuson, J.J.; Jensen, O.P.; Card, V.M.; Hodgkins, G.; Korhonen, J.; Granin, N.G. Extreme events, trends, and variability in Northern Hemisphere lake-ice phenology (1855–2005). Clim. Chang. 2012, 112, 299–323. [Google Scholar] [CrossRef]
- Sharma, S.; Blagrave, K.; Magnuson, J.J.; O’Reilly, C.M.; Oliver, S.; Batt, R.D.; Magee, M.R.; Straile, D.; Weyhenmeyer, G.A.; Winslow, L.; et al. Widespread loss of lake ice around the Northern Hemisphere in a warming world. Nat. Clim. Chang. 2019, 9, 227–231. [Google Scholar] [CrossRef]
- Brown, L.C.; Duguay, C.R. The response and role of ice cover in lake-climate interactions. Prog. Phys. Geog. 2010, 34, 671–704. [Google Scholar] [CrossRef]
- Arp, C.D.; Jones, B.M.; Liljedahl, A.K.; Hinkel, K.M.; Welker, J.A. Depth, ice thickness, and ice-out timing cause divergent hydrologic responses among Arctic lakes. Water Resour. Res. 2015, 51, 9379–9401. [Google Scholar] [CrossRef]
- Duguay, C.R.; Bernier, M.; Gauthier, Y.; Kouraev, A. Remote Sensing of lake and river ice. In Remote Sensing of the Cryosphere; Tedesco, M., Ed.; Wiley Blackwell: Hoboken, NJ, USA, 2015; pp. 273–306. [Google Scholar] [CrossRef]
- Griffiths, K.; Michelutti, N.; Sugar, M.; Douglas, M.S.V.; Smol, J.P. Ice-cover is the principal driver of ecological change in High Arctic lakes and ponds. PLoS ONE 2017, 12, 1–25. [Google Scholar] [CrossRef]
- Hampton, S.E.; Galloway, A.W.; Powers, S.M.; Ozersky, T.; Woo, K.H.; Batt, R.D.; Labou, S.G.; O’Reilly, C.M.; Sharma, S.; Lottig, N.R.; et al. Ecology under lake ice. Ecol. Lett. 2017, 20, 98–111. [Google Scholar] [CrossRef]
- Hewitt, B.A.; Lopez, L.S.; Gaibisels, K.M.; Murdoch, A.; Higgins, S.N.; Magnuson, J.J.; Paterson, A.M.; Rusak, J.A.; Yao, H.; Sharma, S. Historical trends, drivers, and future projections of ice phenology in small North Temperate Lakes in the Laurentian Great Lakes Region. Water 2018, 10, 70. [Google Scholar] [CrossRef] [Green Version]
- AMAP. Snow, Water, Ice and Permafrost in the Arctic (SWIPA) 2017; Arctic Monitoring and Assessment Programme (AMAP): Oslo, Norway, 2017; p. xiv 269. ISBN 978-82-7971-101-8. [Google Scholar]
- Leppäranta, M. Freezing of Lakes and the Evolution of their Ice Cover; Springer: Berlin/Heidelberg, Germany, 2015; pp. 84–265. ISBN 978-3-642-29080-0. [Google Scholar]
- Ariano, S.S.; Brown, L.C. Ice processes on medium-sized north-temperate lakes. Hydrol. Process. 2019, 33, 2434–2448. [Google Scholar] [CrossRef]
- Duguay, C.R.; Flato, G.M.; Jeffries, M.O.; Ménard, P.; Morris, K.; Rouse, W.R. Ice-cover variability on shallow lakes at high latitudes: Model simulations and observations. Hydrol. Process. 2003, 17, 3465–3483. [Google Scholar] [CrossRef]
- Svacina, N.A.; Duguay, C.R.; Brown, L.C. Modelled and satellite-derived surface albedo of lake ice—Part I: Evaluation of the albedo parameterization scheme of the Canadian Lake Ice Model. Hydrol. Process. 2014, 28, 4550–4561. [Google Scholar] [CrossRef]
- Heron, R.; Woo, M.K. Decay of a High Arctic lake-ice cover: Observations and modelling. J. Glaciol. 1994, 40, 283–292. [Google Scholar] [CrossRef] [Green Version]
- Henneman, H.E.; Stefan, H.G. Albedo models for snow and ice on a freshwater lake. Cold Reg. Sci. Technol. 1999, 29, 31–48. [Google Scholar] [CrossRef]
- Jakkila, J.; Leppäranta, M.; Kawamura, T.; Shirasawa, K.; Salonen, K. Radiation transfer and heat budget during the ice season in Lake Pääjärvi, Finland. Aquat. Ecol. 2009, 43, 681–692. [Google Scholar] [CrossRef]
- Zdorovennova, G.; Palshin, N.; Efremova, T.; Zdorovennov, R.; Gavrilenko, G.; Volkov, S.; Bogdanov, S.; Terzhevik, A. Albedo of a small ice-covered boreal lake: Daily, meso-scale and interannual variability on the background of regional climate. Geosci. J. 2018, 8, 206. [Google Scholar] [CrossRef] [Green Version]
- Semmler, T.; Cheng, B.; Yang, Y.; Rontu, L. Snow and ice on Bear Lake (Alaska) sensitivity experiments with two lake ice models. Tellus A 2012, 64, 1–14. [Google Scholar] [CrossRef] [Green Version]
- Svacina, N.A.; Duguay, C.R.; King, J.M.L. Modelled and satellite-derived surface albedo of lake ice—Part II: Evaluation of MODIS albedo products. Hydrol. Process. 2014, 28, 4562–4572. [Google Scholar] [CrossRef]
- Lang, J.; Lyu, S.; Li, Z.; Ma, Y.; Su, D. An investigation of the ice surface albedo and its influence on the High-Altitude lakes of the Tibetan Plateau. Remote Sens. 2018, 10, 218. [Google Scholar] [CrossRef]
- Brown, L.C.; Duguay, C.R. A comparison of simulated and measured lake ice thickness using a Shallow Water Ice Profiler. Hydrol. Process. 2011, 25, 2932–2941. [Google Scholar] [CrossRef]
- Yang, Y.; Leppäranta, M.; Cheng, B.; Li, Z. Numerical modelling of snow and ice thicknesses in Lake Vanajavesi, Finland. Tellus A 2012, 64, 1–12. [Google Scholar] [CrossRef] [Green Version]
- Cheng, B.; Vihma, T.; Rontu, L.; Kontu, A.; Kheyrollah Pour, H.; Duguay, C.; Pulliainen, J. Evolution of snow and ice temperature, thickness and energy balance in Lake Orajärvi, northern Finland. Tellus A 2014, 66, 1–20. [Google Scholar] [CrossRef]
- Ménard, P.; Duguay, C.R.; Flato, G.M.; Rouse, W.R. Simulation of ice phenology on a large lake in the Mackenzie River Basin (1960–2000). In Proceedings of the 59th Eastern Snow Conference, Stowe, VT, USA, 5–7 June 2002. [Google Scholar]
- Morris, K.; Jeffries, M.; Duguay, C.R. Model simulation of the effects of climate variability and change on lake ice in central Alaska, USA. Ann. Glaciol. 2005, 40, 1–6. [Google Scholar] [CrossRef] [Green Version]
- Brown, L.C.; Duguay, C.R. The fate of lake ice in the North American Arctic. Cryosphere 2011, 5, 869–892. [Google Scholar] [CrossRef] [Green Version]
- Kheyrollah Pour, H.; Duguay, C.R.; Martynov, A.; Brown, L.C. Simulation of surface temperature and ice cover of large northern lakes with 1-D models: A comparison with MODIS satellite data and in situ measurements. Tellus A 2012, 64, 1–19. [Google Scholar] [CrossRef] [Green Version]
- Surdu, C.M.; Duguay, C.R.; Brown, L.C.; Fernández Prieto, D. Response of ice cover on shallow lakes of the North Slope of Alaska to contemporary climate conditions (1950–2011): Radar remote-sensing and numerical modeling data analysis. Cryosphere 2014, 8, 167–180. [Google Scholar] [CrossRef] [Green Version]
- Maykut, G.A. Large-scale heat exchange and ice production in the Central Arctic. J. Geophys. Res. Oceans 1982, 87, 7971–7984. [Google Scholar] [CrossRef]
- Heron, R. Decay of a High Arctic Lake Ice Cover. Ph.D. Thesis, Department of Biology, McMaster University, Hamilton, ON, Canada, 1985. [Google Scholar]
- Ariano, S.S. An Investigation of Temperate Region Lake Ice in Central Ontario. Master’s Thesis, University of Toronto, Toronto, ON, Canada, 2017. [Google Scholar]
- Xiao, K.; Griffis, T.J.; Baker, J.M.; Bolstad, P.V.; Erickson, M.D.; Lee, X.; Wood, J.D.; Hu, C.; Nieber, J.L. Evaporation from a temperate closed-basin lake and its impact on present, past, and future water level. J. Hydrol. 2018, 561, 59–75. [Google Scholar] [CrossRef]
- Yao, H.; Samal, N.R.; Joehnk, K.D.; Fang, X.; Bruce, L.C.; Pierson, D.C.; Rusak, J.A.; James, A. Comparing ice and temperature simulations by four dynamic lake models in Harp Lake: Past performance and future predictions. Hydrol. Process. 2014, 28, 4587–4601. [Google Scholar] [CrossRef]
- Stefan, H.G.; Fang, X. Simulated climate change effects on ice and snow covers on lakes in a temperate region. Cold Reg. Sci. Technol. 1997, 25, 137–152. [Google Scholar] [CrossRef]
- Martynov, A.; Sushama, L.; Laprise, R. Simulation of temperate freezing lakes by one-dimensional lake models: Performance assessment for interactive coupling with regional climate models. Boreal Environ. Res. 2010, 15, 143–164. [Google Scholar] [CrossRef]
- Woo, M.K. Permafrost Hydrology; Springer: Heidelberg, Germany, 2012; pp. 305–344. ISBN 978-3-642-23462-0. [Google Scholar]
- Brown, L.C.; University of Toronto, Canada. Personal communication, 2016.
- Lescord, G.L.; Kidd, K.A.; Kirk, J.L.; O’Driscoll, N.J.; Wang, X.; Muir, D.C.G. Factors affecting biotic mercury concentrations and biomagnification through lake food webs in the Canadian high Arctic. Sci. Total Environ. 2015, 509, 195–205. [Google Scholar] [CrossRef] [PubMed]
- Lenormand, F.; Duguay, C.R.; Gauthier, R. Development of a historical ice database for the study of climate change in Canada. Hydrol. Process. 2002, 16, 3707–3722. [Google Scholar] [CrossRef]
- Environment and Climate Change Canada (ECCC). Canadian Climate Normals 1981–2010. Available online: https://climate.weather.gc.ca/climate_normals/ (accessed on 6 March 2017).
- Woo, M.K.; Heron, R.; Marsh, P.; Steer, P. Comparison of weather station snowfall with winter snow accumulation in high arctic basins. Atmos. Ocean 1983, 21, 312–325. [Google Scholar] [CrossRef] [Green Version]
- Yang, D.; Woo, M.K. Representativeness of local snow data for large scale hydrologic investigations. Hydrol. Process. 1999, 13, 1977–1988. [Google Scholar] [CrossRef]
- Statistics Canada. Available online: https://www12.statcan.gc.ca/census-recensement/2011/geo/bound-limit/bound-limit-2016-eng.cfm (accessed on 27 September 2016).
- Natural Resources Canada. Available online: https://open.canada.ca/data/en/dataset/7f245e4d-76c2-4caa-951a-45d1d2051333 (accessed on 3 March 2018).
- Crins, W.J.; Gray, P.A.; Uhlig, P.W.C.; Wester, M.C. The Ecosystems of Ontario, Part 1: Ecozones and Ecoregions; Ministry of Natural Resources: Peterborough, ON, Canada, 2009; pp. 40–42. [Google Scholar]
- Hadley, K.R.; Paterson, A.M.; Hall, R.I.; Smol, J.P. Effects of multiple stressors on lakes in south-central Ontario: 15 years of change in lakewater chemistry and sedimentary diatom assemblages. Aquat. Sci. 2013, 75, 349–360. [Google Scholar] [CrossRef]
- Haliburton Forest; Wild Life Reserve. Haliburton Forest 4th Edition Fishing Guide; Haliburton Forest and Wild Life Reserve Ltd.: Haliburton, ON, Canada, 2012; p. 30. [Google Scholar]
- MSC (Meteorological Service of Canada). Canadian Snow Data CD-ROM: Daily Snow Depth and Snow Water Equivalent. Climate Processes and Earth Observation Division; MSC: Downsview, ON, Canada, 2000. [Google Scholar]
- Woo, M. A Guide for Ground Based Measurement of the Arctic Snow Cover; Climate Resolution Branch, Atmosphere, Environment Service: Downsview, ON, Canada, 1997; pp. 1–30. [Google Scholar]
- Sturm, M.; Liston, G.E. The snow cover on lakes of the Arctic Coastal Plain of Alaska U.S.A. J. Glaciol. 2003, 49, 370–380. [Google Scholar] [CrossRef] [Green Version]
- Melling, H.; Johnston, P.H.; Riedel, D.A. Measurements of the underside topography of sea ice by moored subsea sonar. J. Atmos. Ocean Tech. 1995, 12, 589–602. [Google Scholar] [CrossRef]
- Marko, J.R.; Fissel, D.B.; Jasek, M. Recent developments in ice and water column profiling technology. In Proceedings of the 18th IAHR symposium on river ice, Sapporo, Japan, 28 August–1 September 2006; pp. 1–8. [Google Scholar]
- WMO (World Meteorological Organization). Guide to Meteorological Instruments and Methods of Observation, 2018th ed.; WMO-No 8; World Meteorological Organization: Geneva, Switzerland, 2018; pp. 246–297. ISBN 978-92-63-10008-5. [Google Scholar]
- Gunn, G.E.; Duguay, C.R.; Brown, L.C.; King, J.; Atwood, D.; Kasurak, A. Freshwater lake ice thickness derived using X- and Ku-band FMCW scatterometers in the Hudson Bay Lowlands Near Churchill, Manitoba. Cold Reg. Sci. Technol. 2015, 120, 115–126. [Google Scholar] [CrossRef]
- Flato, G.M.; Brown, R.D. Variability and climate sensitivity of landfast Arctic sea ice. J. Geophys. Res. 1996, 101, 25767–25777. [Google Scholar] [CrossRef]
- Maykut, G.A.; Untersteiner, N. Some results from a time-dependent thermodynamic model of sea ice. J. Geophys. Res. Oceans 1971, 76, 1550–1575. [Google Scholar] [CrossRef]
- Shine, K.P. Parameterization of the shortwave flux over high albedo surfaces as a function of cloud thickness and surface albedo. Q. J. R. Meteorol. Soc. 1984, 110, 747–764. [Google Scholar] [CrossRef]
- Maykut, G.A.; Church, P.E. Radiation climate of Barrow, Alaska, 1962–1966. J. Appl. Meteorol. 1973, 12, 620–628. [Google Scholar] [CrossRef] [Green Version]
- Ebert, E.E.; Curry, J.A. An intermediate one-dimensional thermodynamic sea ice model for investigating ice–atmosphere interactions. J. Geophys. Res. 1993, 98, 10085–10109. [Google Scholar] [CrossRef]
- Weller, G. Radiation flux investigation. In Arctic Ice Dynamics Joint Experiment (AIDJEX) Bulletin; University of Washington: Seattle, WA, USA, 1972; Volume 14, pp. 28–30. [Google Scholar]
- Woo, M.K.; Young, K.L. Modeling arctic snow distribution and melt at the 1 km grid scale. Nord. Hydrol. 2004, 35, 295–307. [Google Scholar] [CrossRef]
- Willmott, C.J. On the validation of models. Phys. Geogr. 1981, 2, 184–194. [Google Scholar] [CrossRef]
- Zambrano-Bigirarini, M. hydroGOF: Goodness-of-Fit Functions for Comparison of Simulated and Observed Hydrological Time Series. Available online: https://cran.r-project.org/web/packages/hydroGOF/ (accessed on 1 October 2019).
- Lamigueiro, O.P. tdr:Target Diagram Package. Available online: https://cran.r-project.org/web/packages/tdr/index.html (accessed on 1 October 2019).
- Jeffries, M.O.; Morris, K.; Duguay, C.R. Lake ice growth and decay in central Alaska, USA: Observations and computer simulations compared. Ann. Glaciol. 2005, 40, 195–199. [Google Scholar] [CrossRef] [Green Version]
- Ashton, G.D. River and Lake Ice Engineering; Water Resources Publications: Littleton, CO, USA, 1986. [Google Scholar]


| Date | Snow Depth (cm) | Snow Density (kg m−3) |
|---|---|---|
| 22 May 2016 | 17.2 (11.8) | 356.5 (64.4) |
| 16 May 2018 | 11.4 (21.5) | 307.7 (29.9) |
| Date | Snow Depth (cm) | Snow Density (kg m−3) | Corresponding Average Bi-Weekly Canadian Snow CD Density (kg m−3) |
|---|---|---|---|
| 22 Jan. 2016 | 13.9 (1.3) | 196.2 (64.3) | 204 |
| 12 Feb. 2016 | 8.8 (2.4) | 183.5 (35.6) | 215 |
| 16 Feb. 2016 | 12.3 (0.8) | 165.3 (41.9) | 242 |
| 26 Feb. 2016 | 8.5 (2.1) | 305.2 (73.9) | 242 |
| 04 Mar. 2016 | 22.2 (2.0) | 193.5 (58.1) | 265 |
| 13 Jan. 2017 | 2.3 (1.2) | 376.6 (104.3) | 195 |
| 20 Jan. 2017 | 3.0 (0.9) | 424.7 (60.8) | 204 |
| 03 Feb. 2017 | 15.9 (1.2) | -- | 215 |
| 10 Feb. 2017 | 17.7 (1.7) | 371.2 (45.9) | 215 |
| 17 Feb. 2017 | 29.9 (4.2) | 206.5 (43.3) | 242 |
| 21 Feb. 2017 | 5.1 (4.1) | 307.4 (107.7) | 242 |
| 19 Jan. 2018 | -- | 297.7 (202.7) | 195 |
| 26 Jan. 2018 | 1.6 (1.0) | 102.0 (30.9) | 204 |
| 02 Feb. 2018 | 0.6 (0.4) | 87.6 (12.4) | 204 |
| 09 Feb. 2018 | 6.7 (0.2) | 163.3 (39.9) | 215 |
| 16 Feb. 2018 | 22.9 (1.6) | 109.8 (25.3) | 215 |
| 23 Feb. 2018 | 16.2 (1.6) | -- | 242 |
| 09 Mar. 2018 | -- | 120.8 (13.6) | 265 |
| 16 Mar. 2018 | 7.3 (1.7) | 450.3 (420.4) | 265 |
| 23 Mar. 2018 | 6.0 (0.8) | 190.7 (33.2) | 303 |
| Variable | High Arctic | Temperate |
|---|---|---|
| Air temperature | ECCC Resolute CARS (1958–2014), Resolute Bay A (2014–2018) | On-shore AWS (2015–2018): HMP60 Temperature and Relative humidity probe |
| Relative humidity | ECCC Resolute CARS (1958–2014), Resolute Bay A (2014–2018) | On-shore AWS (2015–2018): HMP60 Temperature and Relative humidity probe |
| Wind speed | ECCC Resolute CARS (1958–2014), Resolute Bay A (2014–2018) | On-shore AWS (2015–2018): RM Young Wind Monitor |
| Snow depth | ECCC Resolute CARS (1958–2014), Resolute Bay A (2014–2018) | On-shore AWS (2015–2018): SR50A Sonic Ranging Sensor |
| Cloud amount | ECCC 1958–2018 | MODIS MOD08_D3: Cloud Fraction (Daily 1 km product) |
| Snow density | ECCC: Snow CD End-of-season snow survey’s (Small Lake) 22 May 2016 and 16 May 2018 | ECCC: Snow CD Field survey’s weekly, 2016–2018 snow seasons |
| Other | ||
| Solar radiation | CNR4 Net Radiometer (2018–2019) Solarmeter® Model 10.0 Global Power Meter (weekly, 2018–2019) | |
| Barometric pressure | On-shore AWS (2015–2018): (CS106 Barometric Pressure Sensor) |
| Study Year | Ice-On (50% Snow Cover) | Ice-On (No Snow Cover) | Observed First Presence of Ice | Complete Ice-On | Ice-Off (50% Snow Cover) | Ice-Off (No Snow Cover) | Observed First Presence of Open Water ** | Complete Ice-Off |
|---|---|---|---|---|---|---|---|---|
| 2015–2016 | -- | -- | -- | -- | 19 Jul. | 27 Jul. | 17 Jun. | 21 Jul. |
| 2016–2017 | 12 Sep. | 12 Sep. | 12 Sep. | 28 Sep. | 8 Aug. | 15 Aug. | -- | 1 Aug. |
| 2017–2018 | 9 Sep. | 8 Sep. | 8 Sep. | 12 Sep. | 27 Jul. | 10 Aug. | 16 Jun. | 6 Aug. |
| 50% Snow Cover—MAE | No Snow Cover—MAE | |
|---|---|---|
| Compete Ice-on | 1 | 0 |
| Ice-off | 6 | 8 |
| Complete Ice-On | 50% Snow Cover | No Snow Cover |
| Ia | 0.65 | 0.79 |
| MBE (days) | −3 | −4 |
| MAE (days) | 6 | 6 |
| Ice-Off | 50% Snow Cover | No Snow Cover |
| Ia | 0.75 | 0.77 |
| MBE (days) | −2 | 7 |
| MAE (days) | 8 | 8 |
| Digital Camera | SWIP | CLIMo | CLIMo-Temperate | |||||
|---|---|---|---|---|---|---|---|---|
| Study Year | Ice-On | Ice-Off | Ice-On | Ice-Off | Ice-On | Ice-Off | Ice-On | Ice-Off |
| 2015–2016 | 4 Jan. | 27 Apr. | 4 Jan. | 25 Mar. | 4 Jan. | 20 Apr. | ||
| 2016–2017 | 16 Dec. | 22 Apr. | 11 Dec. | 21Apr. | 13 Dec. | 31 Mar. | 13 Dec. | 19 Apr. |
| 2017–2018 | 12 Dec. | 8 May | 12 Dec. | 7 May | 14 Dec. | 14 Apr. | 13 Dec. | 8 May |
| MAE (days) digital camera | 2 | 26 | 1 | 3 | ||||
| MAE (days) SWIP | 3 | 22 | 2 | 2 | ||||
| Digital Camera | CLIMo | CLIMo-Temperate | ||||
|---|---|---|---|---|---|---|
| Study Year | Ice-On | Ice-Off | Ice-On | Ice-Off | Ice-On | Ice-Off |
| 2015–2016 | 5 Jan. | 24 Apr. | 5 Jan. | 22 Mar. | 5 Jan. | 19 Apr. |
| 2016–2017 | 16 Dec. | 20 Apr. | 14 Dec. | 30 Mar. | 14 Dec. | 18 Apr. |
| 2017–2018 | 11 Dec. | 8 May | 14 Dec. | 13 Apr. | 14 Dec. | 8 May |
| MAE (days) digital camera | 2 | 26 | 2 | 2 | ||
| CLIMo | CLIMo-Temperate | |||||||
|---|---|---|---|---|---|---|---|---|
| Study Year | M-1 (cm) | M-2 (cm) | C-1 (cm) | C-2 (cm) | M-1 (cm) | M-2 (cm) | C-1 (cm) | C-2 (cm) |
| 2015–2016 | 7.7 | 3.7 | 6.4 | 5.6 | 3.5 | 1.2 | 4.8 | 3.7 |
| 2016–2017 | 3.7 | 7.3 | 7.2 | 4.7 | 3.0 | 4.9 | 2.8 | 2.5 |
| 2017–2018 | 3.8 | 6.3 | 4.3 | 4.4 | 2.8 | 2.1 | 1.1 | 1.5 |
| Overall | 5.0 | 5.8 | 6.0 | 4.9 | 3.1 | 2.7 | 2.9 | 2.6 |
| CLIMo vs. SWIP | CLIMo-Temperate vs. SWIP | |||||
|---|---|---|---|---|---|---|
| Study Year | Ia | MBE (cm) | MAE (cm) | Ia | MBE (cm) | MAE (cm) |
| 2016–2017 | 0.61 | −11.4 | 12.0 | 0.98 | −0.2 | 2.9 |
| 2017–2018 | 0.58 | −13.1 | 15.8 | 0.96 | 0.0 | 4.9 |
Publisher’s Note: MDPI stays neutral with regard to jurisdictional claims in published maps and institutional affiliations. |
© 2021 by the authors. Licensee MDPI, Basel, Switzerland. This article is an open access article distributed under the terms and conditions of the Creative Commons Attribution (CC BY) license (http://creativecommons.org/licenses/by/4.0/).
Share and Cite
Robinson, A.L.; Ariano, S.S.; Brown, L.C. The Influence of Snow and Ice Albedo towards Improved Lake Ice Simulations. Hydrology 2021, 8, 11. https://doi.org/10.3390/hydrology8010011
Robinson AL, Ariano SS, Brown LC. The Influence of Snow and Ice Albedo towards Improved Lake Ice Simulations. Hydrology. 2021; 8(1):11. https://doi.org/10.3390/hydrology8010011
Chicago/Turabian StyleRobinson, Alexis L., Sarah S. Ariano, and Laura C. Brown. 2021. "The Influence of Snow and Ice Albedo towards Improved Lake Ice Simulations" Hydrology 8, no. 1: 11. https://doi.org/10.3390/hydrology8010011