Abstract
Increased droughts and variable rainfall patterns may alter the capacity to provide ecosystem services, such as biomass production and clean water provision. The impact of these factors in a semi-arid region, especially on a dry tropical forest with Vertisols and under different land uses such as regenerated vegetation and thinned vegetation, is still unclear. This study analyzes hydrologic processes under precipitation pulses and intra-seasonal droughts, and suggests management practices for ecosystem services improvement. A local 43-year dataset showed a varying climate with a decrease in number of small events, and an increase in the number of dry days and in event rainfall intensity, in two catchments with different land use patterns and with Vertisols, a major soil order in semi-arid tropics. The onset of runoff depends on the expansive characteristics of the soil rather than land use, as dry spells promote micro-cracks that delay the runoff process. Forest thinning enhances groundcover development and is a better management practice for biomass production. This management practice shows a lower water yield when compared to a regenerated forest, supporting the decision of investing in forest regeneration in order to attend to an increasing water storage demand.
1. Introduction
Semi-arid regions, with an aridity index between 0.2 and 0.5, comprise 37% (22.6 × 10⁶ km2) of total dryland area, which accounts for 41% of the world’s land surface [1] and half of total dryland expansion [2]. These regions are home to 14% of the world’s population and their sustainability depends, besides other factors, on the scarce water availability. Human establishment in these areas demands the constant availability of water resources that compete with ecosystem maintenance requirements. Climate change scenarios suggest an increase in temperature, a reduction in rainfall and an increase in consecutive dry days, promoting an increase in dry spells and droughts [3,4].
Due to climate change, the growing season for rainfed crops is expected to decrease in length [5,6], which will imply either a reduction in yields, or a need for irrigation water to maintain productivity. Knowledge of hydrologic processes in these regions is of the utmost importance to the users and water agencies, in order to support long-term decisions in soil and water resource management to promote eco-efficiency [7,8]. The integrated management of water resources may improve the quality of living and sustain ecosystems, given the appropriate strategies and guidelines for water management.
In semi-arid tropical (SAT) regions with distinct wet and dry seasons that last for several months, we can find seasonally dry tropical forests (SDTFs) with temperatures greater than 18 °C, a potential evapotranspiration to rainfall ratio greater than 1.0 [9], summer rains and a 5- to 8-month dry period, and which are present in Africa, South America, and Asia [10]. SDTFs cover an area of approximately 106 km2, with the largest extent of continuous SDTF fragments in Bolivia, Paraguay and North Argentina, and in northeast Brazil [11]. These two areas represent 54% of the world’s SDTFs. A great part of these forests is degraded or is being subject to other land uses, such as cropland [12] and livestock production [13], with vegetation thinning the most common management practice for enhancing feed and biomass production.
SDTFs play a significant role in the direct provision of food, despite little research being done on the subject outside of Africa [14]. SAT regions with an average rainfall between 500 and 1000 mm have Vertisols as an important soil order [15]. There are 3.35 million km2 of these soils in the semi-arid regions of Africa, India, China, Australia, the American southwest, and South America [16,17], particularly in the Brazilian northeast [15], of which 1.5 million km2 are potentially agricultural areas. SDTFs are sensitive to droughts, and their resistance and resiliency to the intra- and interannual variability of rainfall need to be assessed in order to minimize impacts and adapt to challenging climate changes [9]. The dynamics of climate change in semi-arid regions might vary by location, depending on the effects of global- and regional-scale factors [18,19], hence the need to study the hydrologic processes of SDTFs.
The swelling nature of Vertisols promotes crack formation when dry, enhancing salt mobilization and salinization of the aquifer from cultivation [20], and surface sealing when wet, limiting drainage and increasing difficulty in land preparation for crop production [21]. Nonetheless, their high water-holding capacity due to the high expansive 2:1 clay content is adequate for dryland crop production in semi-arid environments under adequate management [15,21].
Some studies state that forest-to-grassland conversion in the high-elevation tropics results in little runoff increase [22], contrary to other studies that show that forest thinning promotes water yield over the native forest in temperate dry regions. The ultimate goal is to increase ecosystem services by adopting best management practices [23], such as restoring land use on marginal lands to enhance biomass production or water yield, purify surface and ground waters, and contribute to carbon sequestration [24,25]. Therefore, this study seeks to understand the watershed response to land use management in SATs under Vertisols.
The objective of this study is to propose best management practices that improve ecosystem services and minimize the effects of climate variability on SDTFs with Vertisols in semi-arid regions. To achieve this objective, we have analyzed the hydrologic response of SDTFs with expansive clay soil to variable rainfall and dry spells, and analyzed the hydrologic response to climate variability. The results may help decision makers (users and water agencies) define strategies to implement management practices that favor either water storage or biomass production in dry tropical forests.
2. Materials and Methods
2.1. Study Area
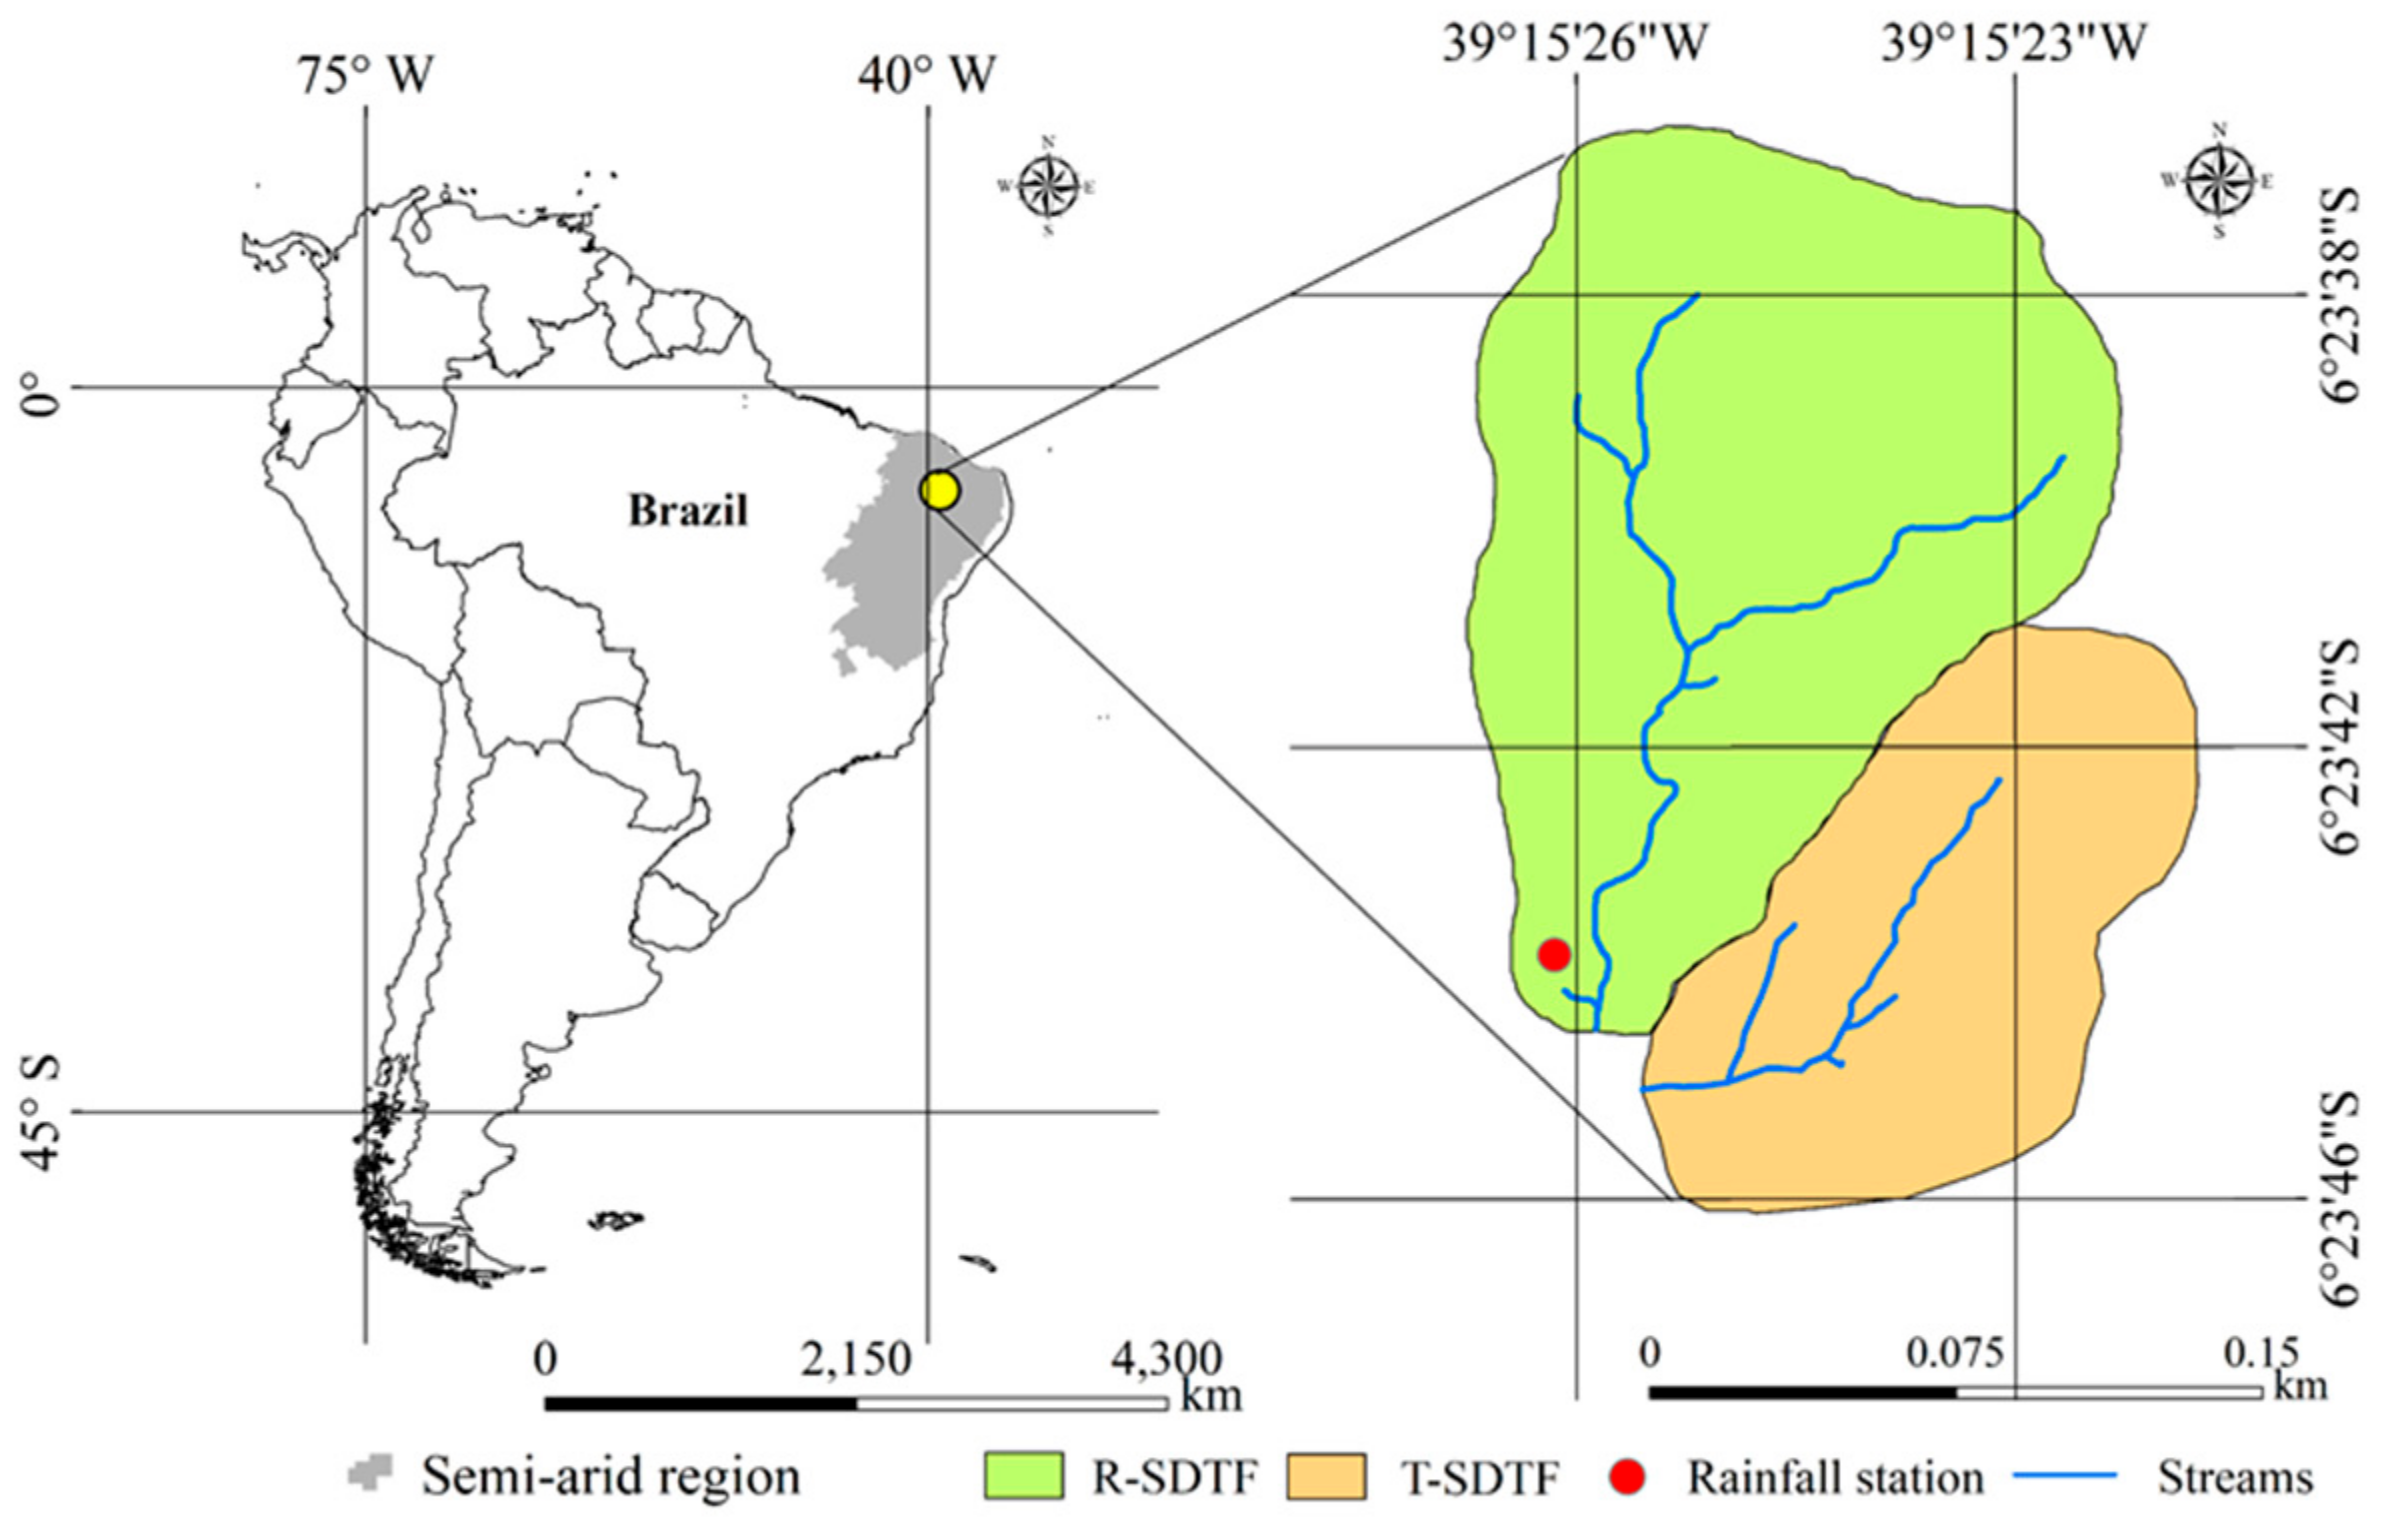
The hydrologic study was conducted on two small catchments located in the South-Central region of the state of Ceará, Brazil, part of the Federal Institute for Education, Science, and Technology of Ceará (IFCE), Campus Iguatu (Figure 1). Both catchments have an ephemeral second-order stream in areas of 2.1 ha and 1.1 ha, and average slopes of 10.6 and 8.7%, respectively.
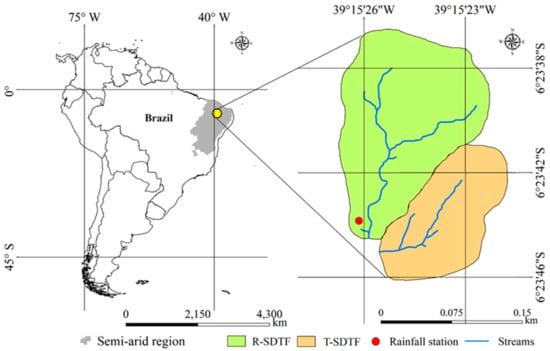
Figure 1.
Catchments’ locations.
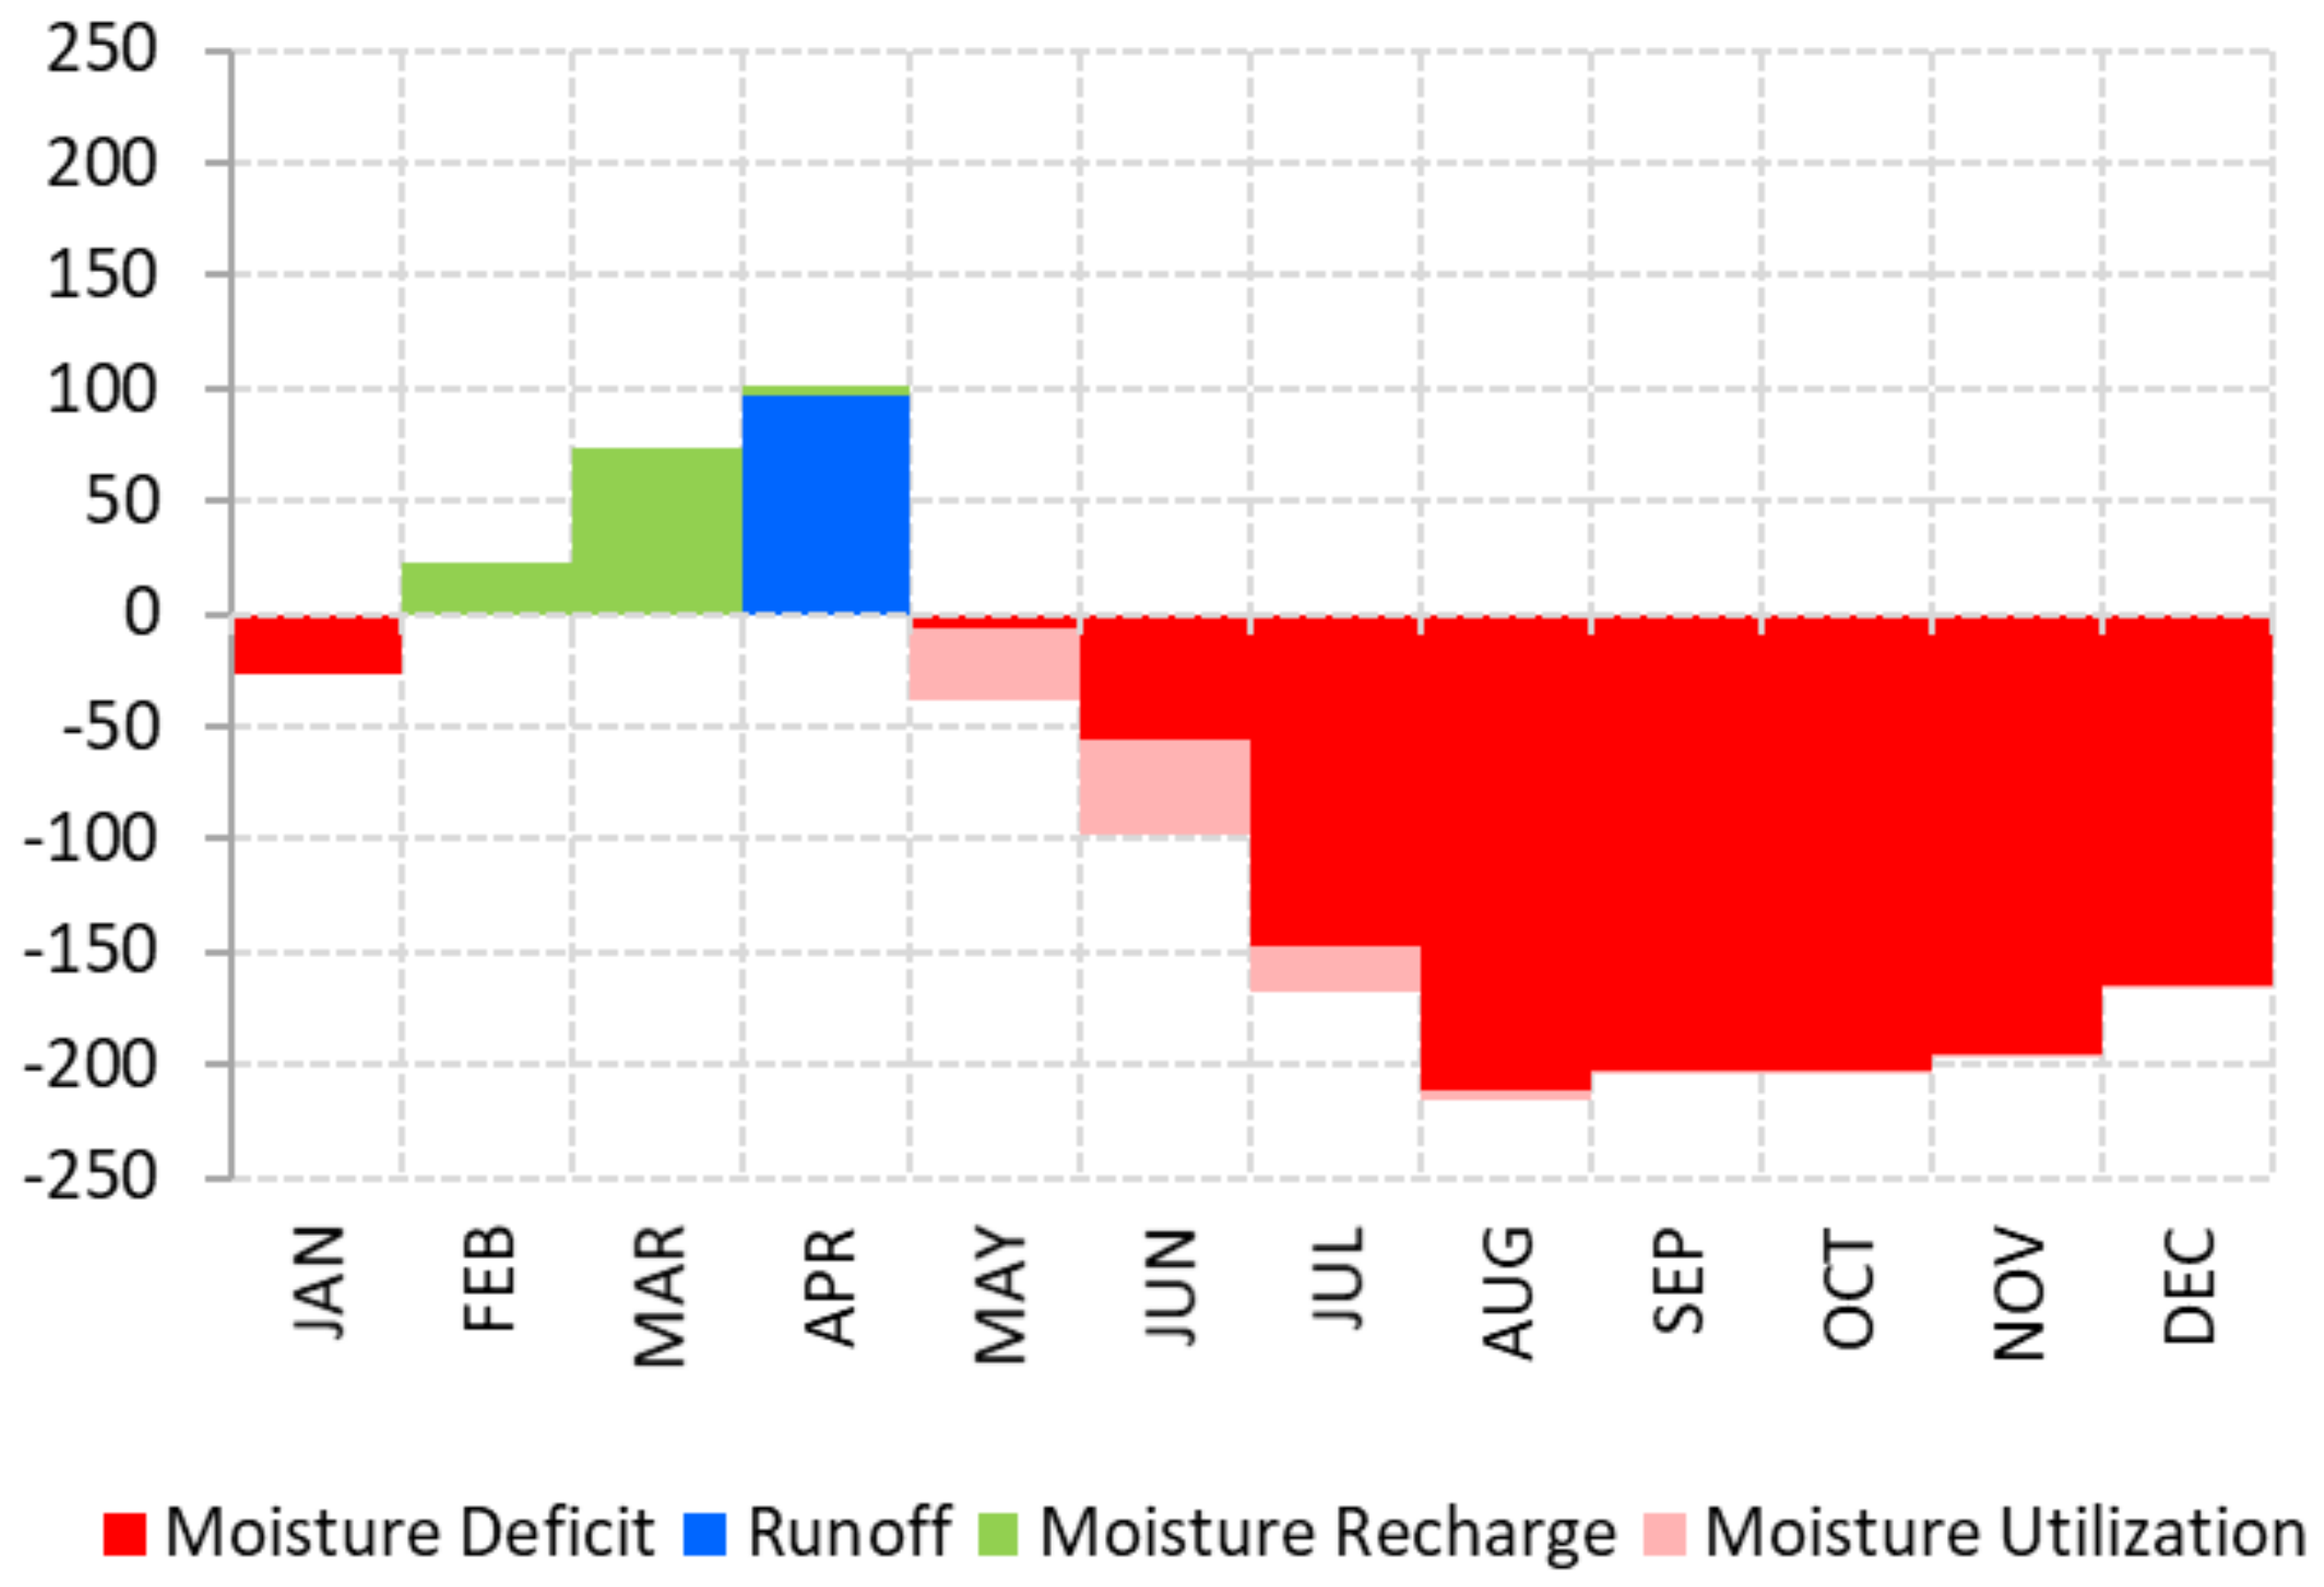
Although average annual rainfall in the region is 998 mm, the annual potential evapotranspiration is 2113 mm, with a Thornthwaite’s aridity index of 0.48, classifying the climate as semi-arid. This type of climate is confirmed by the Köppen climate classification (BS: semi-arid hot), and by the life zone chart introduced by Holdridge, 1968 [26], supported by the Food and Agriculture Organization [27]. This region is characterized by nine months of water deficit (Figure 2), emphasizing its semi-aridity, despite its total annual rainfall.
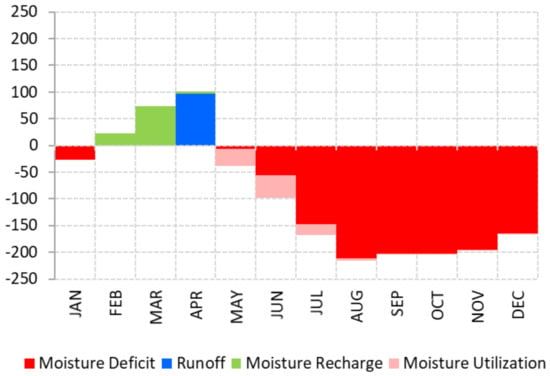
Figure 2.
Average annual water balance in the period (mm).
The vegetation is typical for a seasonally dry tropical forest (SDTF) with a wide variety of spine trees in secondary succession, with a prevalence of Aspidosperma pyrifolium, Commiphora leptophloeos (Mart.) J.B. Gillett, Mimosa caesalpiniaefolia (Benth.), Combretum leprosumi (Mart.), and Piptadenia stipulacea (Benth.) with a height between 7 and 15 m. The two adjacent catchments show different land uses: one is a seasonally dry tropical forest under regeneration for 40 years (R-SDTF) and the other was subject to thinning (T-SDTF) in December of 2008. In the thinning management, all vegetation with a diameter below 10 cm was cut, and the branches were left on site.
The two catchments have a similar soil type, typical Calcic Vertisol (Pellic), with a high content of expansive 2:1 montmorillonite clay characterized by X-ray diffraction (XRD) and X-ray fluorescence (XRF) techniques. The soils are 2 to 3 m deep, and develop cracks when dry and are sticky and sealed when wet. Due to the high clay content, these soils show low hydraulic conductivity (Table 1), as discussed by Pathak et al. (2013) [15].

Table 1.
Catchment properties for the seasonally dry tropical forest under regeneration (R-SDTF) and seasonally dry tropical forest subject to thinning (T-SDTF) [8].
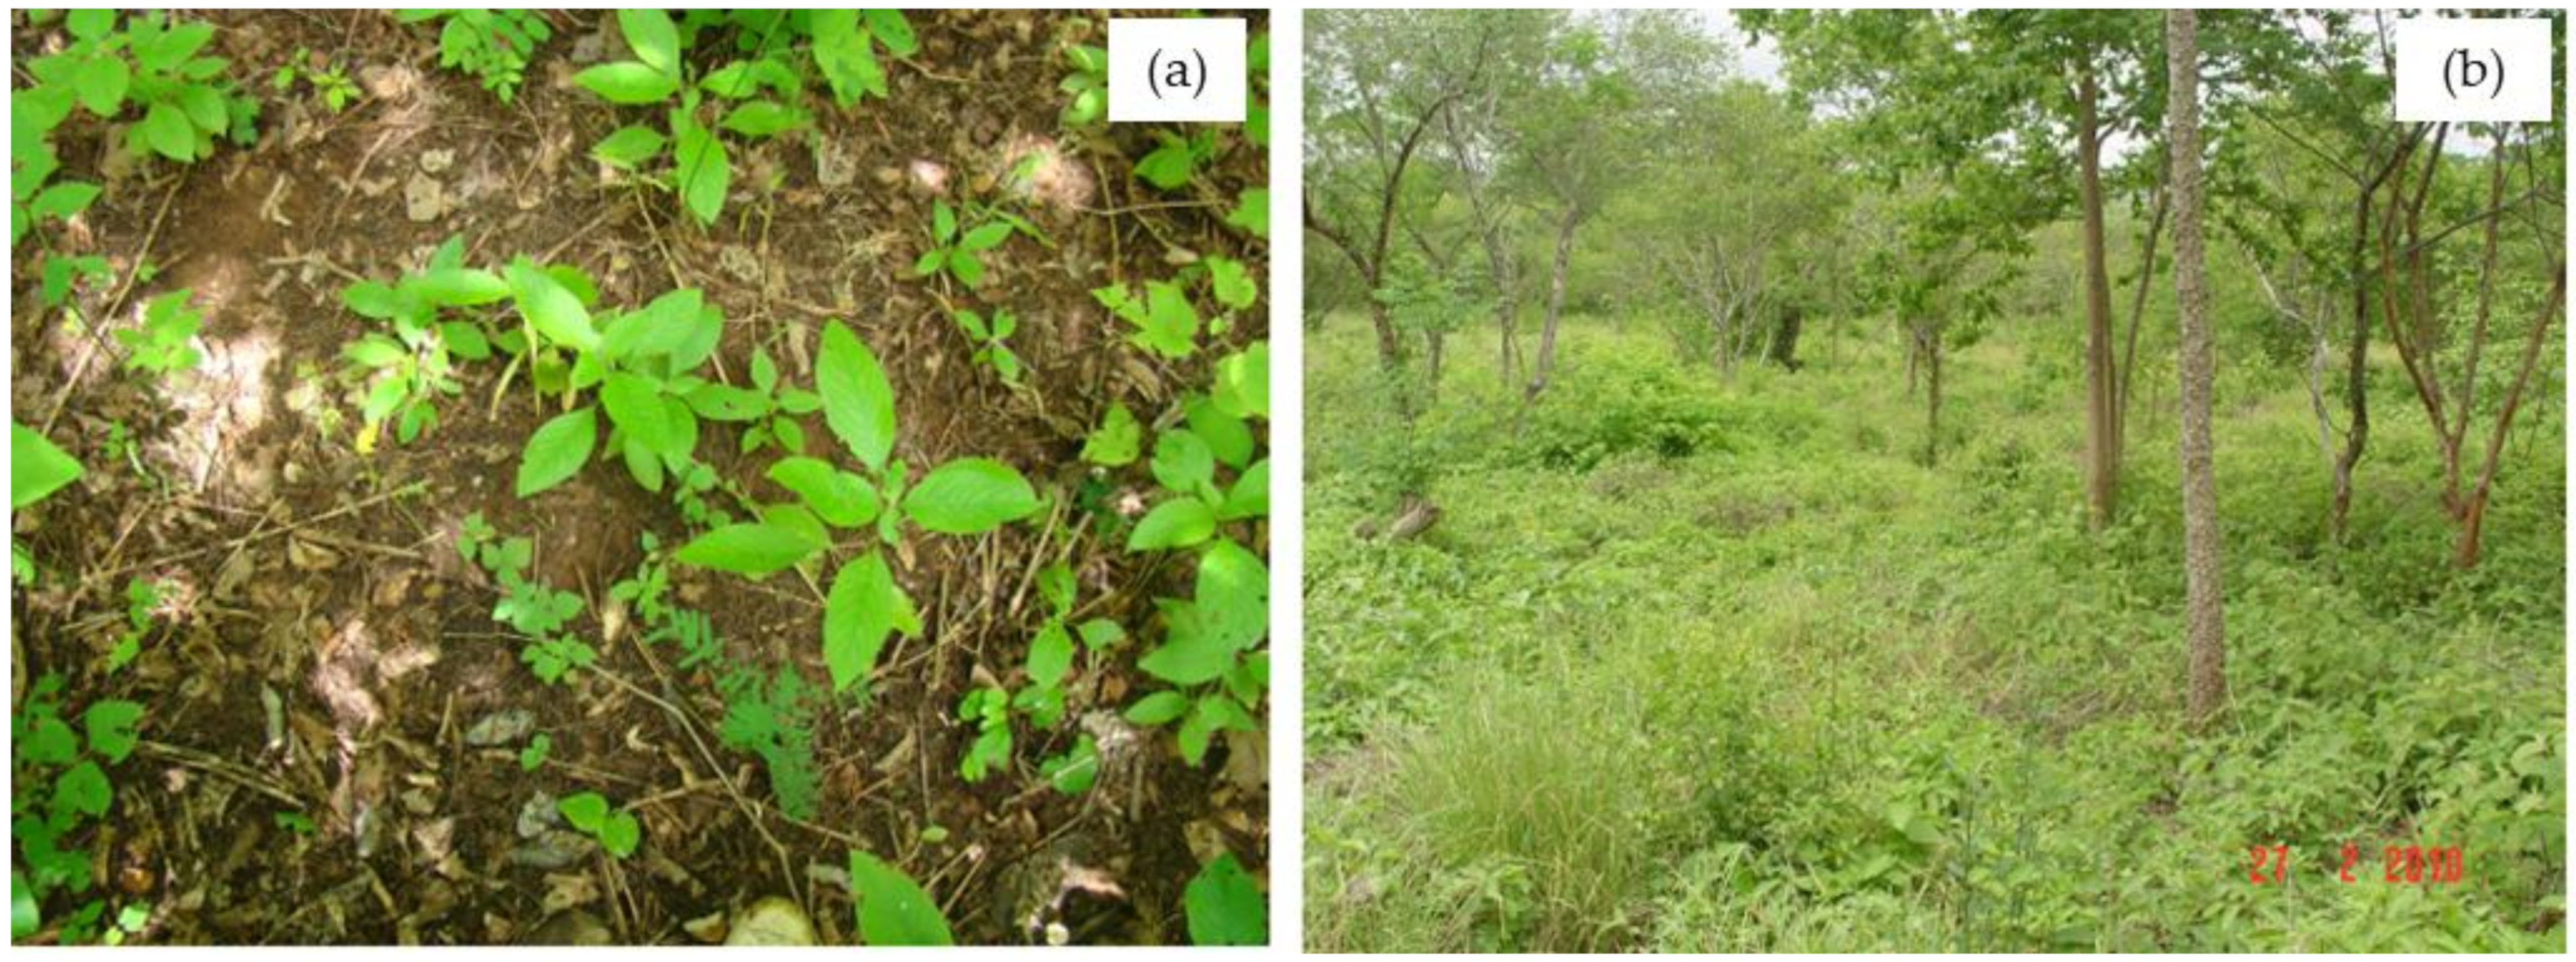
The canopy cover (90%) in the R-SDTF shades the groundcover (30%), limiting its growth (Figure 3a), whereas the sparser canopy cover (60%) in the T-SDTF allows solar radiation to reach the soil and improve the groundcover development (Figure 3b).
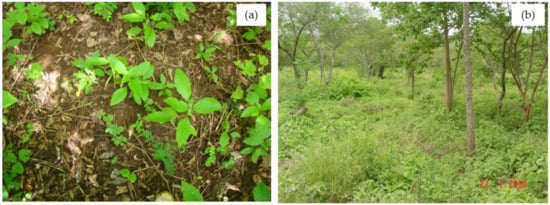
Figure 3.
Groundcover: (a) R-SDTF and (b) T-SDTF. Photos by the author.
2.2. Data Analysis
2.2.1. Long-Term Rainfall Series
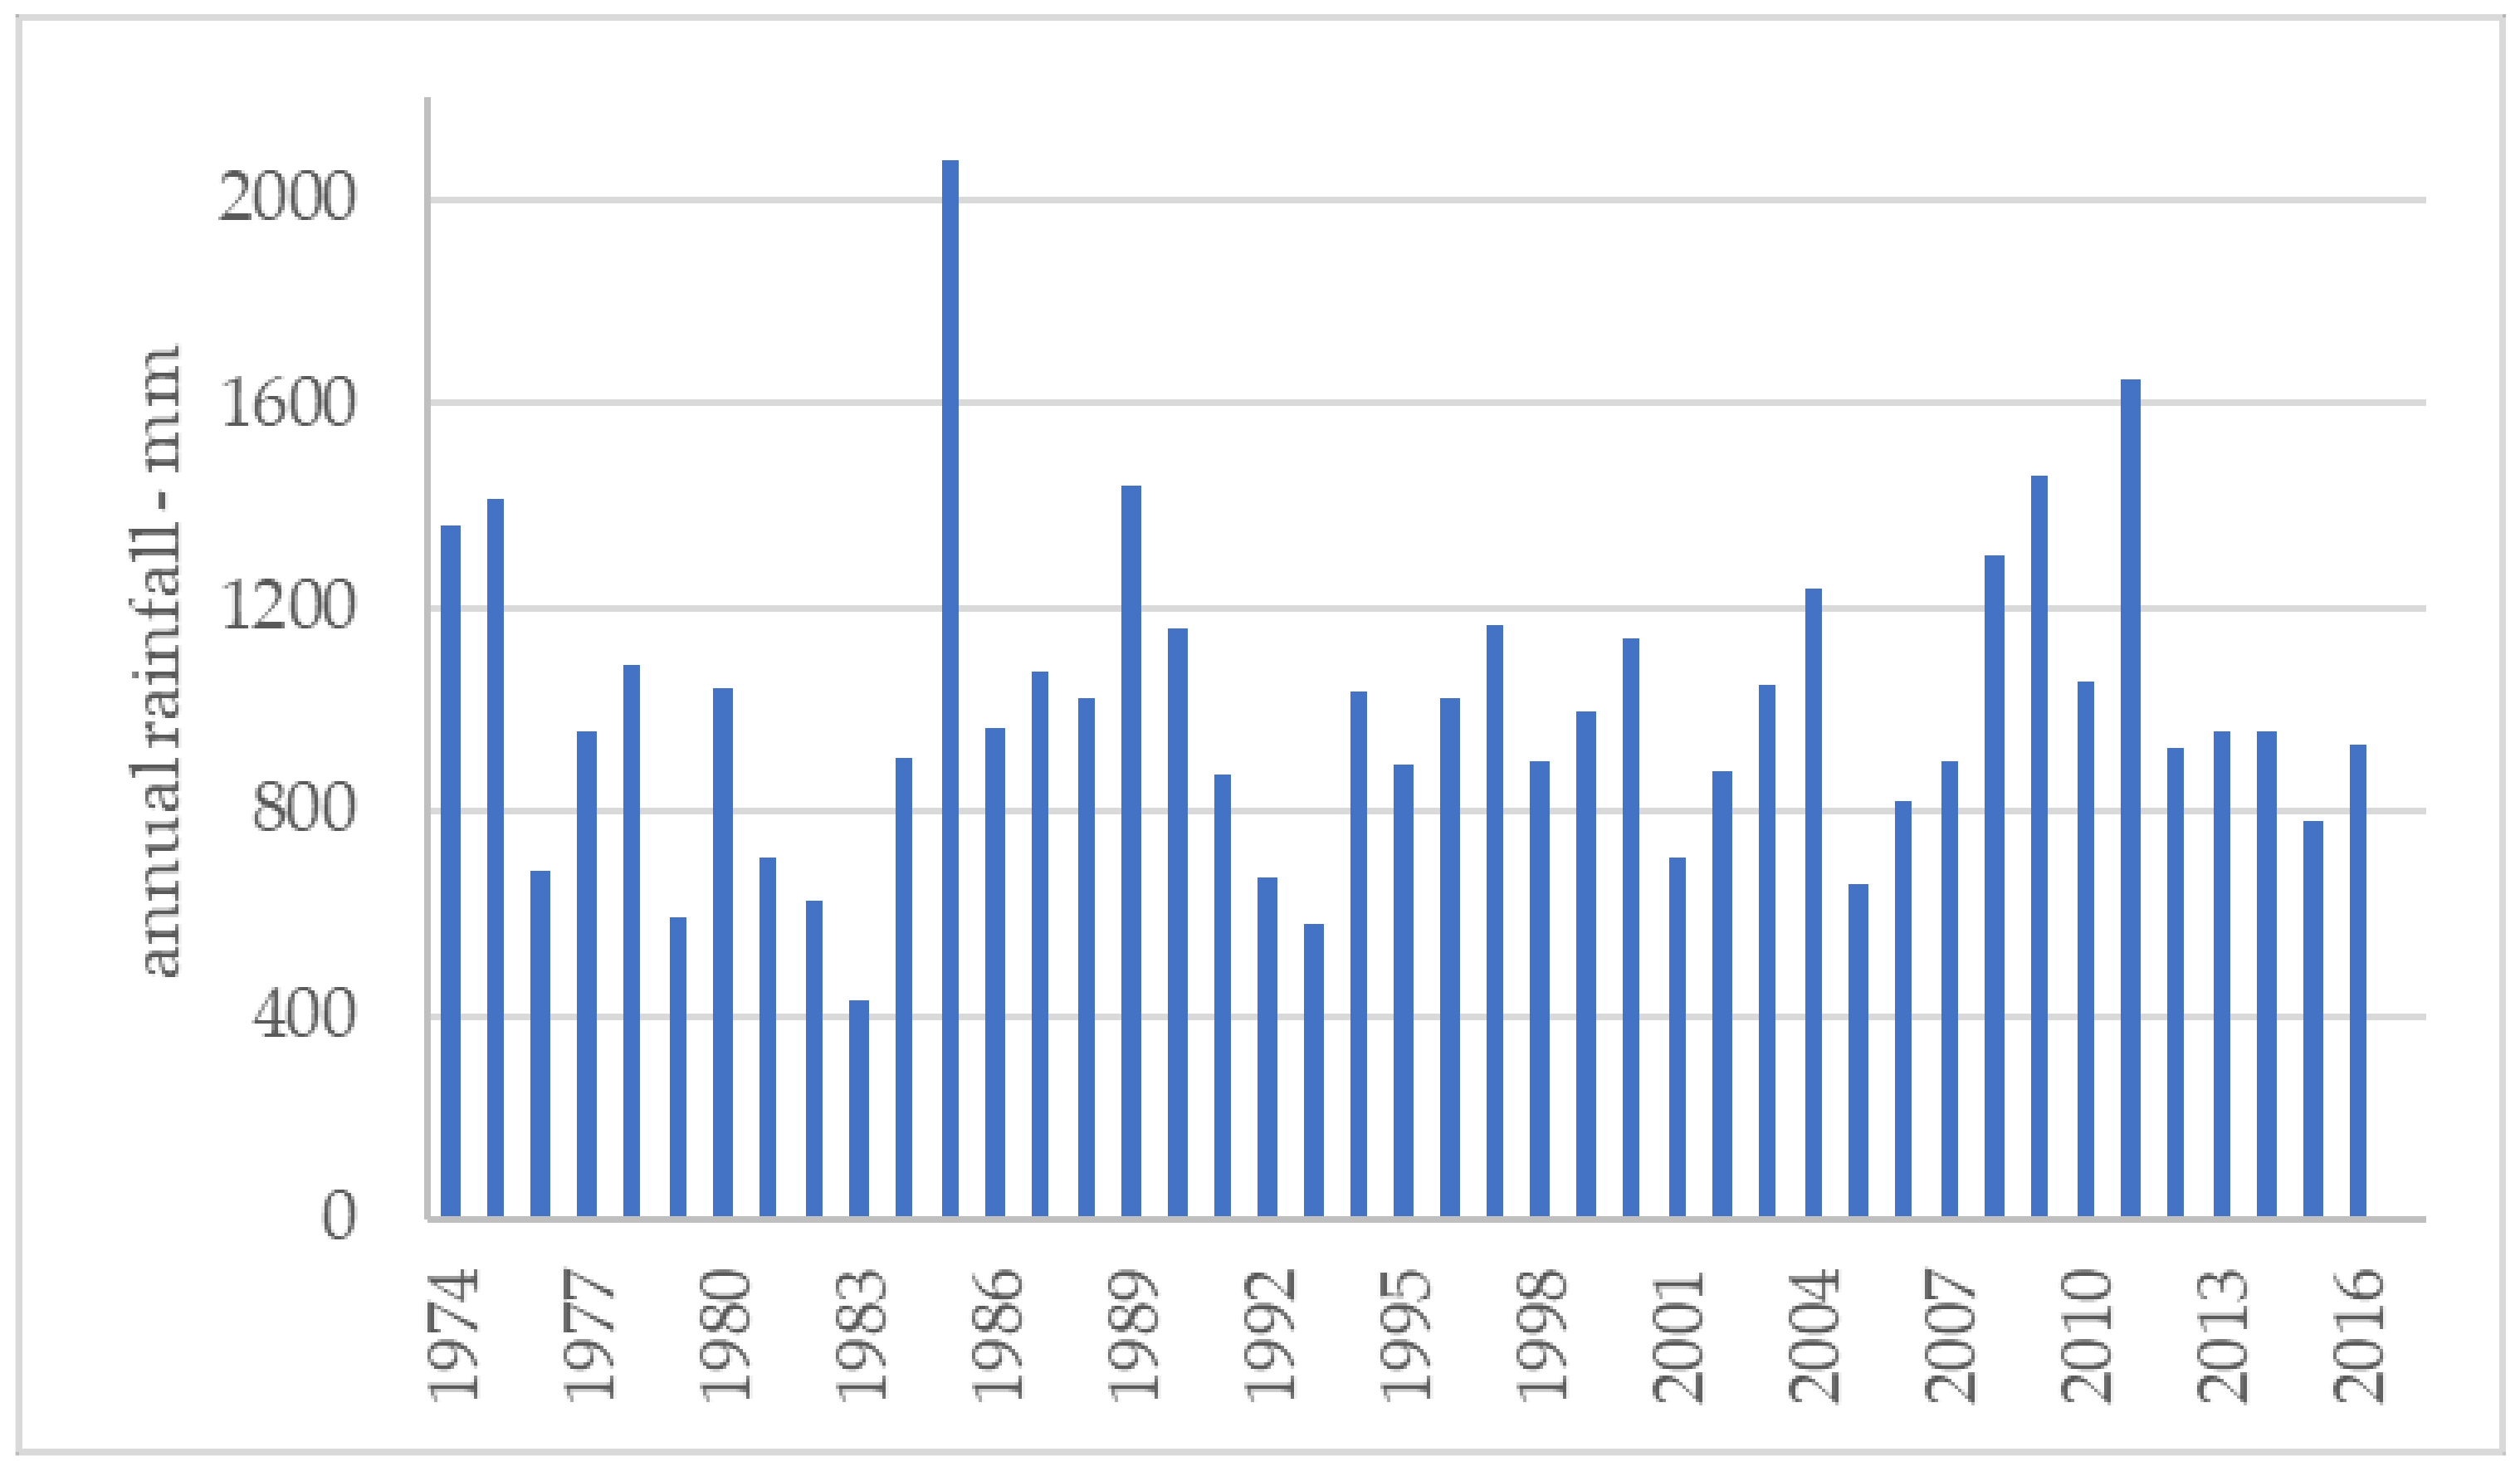
A 1974 to 2017 dataset from the Iguatu, CE, Brazil rain gauge (http://www.funceme.br, accessed on 13 May 2020) was used for the characterization of rainfall events, in the following categories: annual total, monthly distribution, monthly average continuous dry days (CDD) and continuous wet days (CWD), number of dry (DD) and wet days (WD), and mean daily rainfall. The mean annual rainfall for the studied area was 995 ± 305 mm (Figure 4). The temporal distribution of rainfall depth shows 85% to be concentrated from January to May, of which 27% occurs in March, on average.
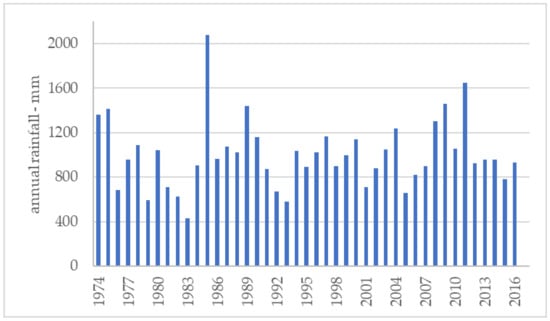
Figure 4.
Long-term annual rainfall from 1974 to 2017, Iguatu, Brazil.
2.2.2. Short-Term Rainfall Runoff Events
Catchment response was analyzed based on rainfall and runoff data collected between 2009 and 2017 during the wet season (January to May) at two catchments in Iguatu, CE, Brazil. Runoff data from 2012 and 2014 were rejected due to a sensor failure. A total of 259 rainfall events were recorded at the rain gauge shared by the two adjacent catchments. The R-SDTF and T-SDTF vegetation catchments produced 67 and 60 runoff events in the period, respectively.
2.2.3. Statistics
Descriptive statistical analyses were performed on the long-term daily rainfall series for total daily rainfall, number of wet days in the year and number of wet days in the wet season (Jan to May). Histograms were developed for total annual rainfall and number of dry days in a year. Trends in annual rainfall and for annual number of dry days for the 43 year-long series were evaluated based on the significance of the slope being statistically different from zero.
Descriptive statistics were also performed on the short-term daily rainfall series associated with the runoff data in both catchments—all rainfall events, rainfall that generated runoff, and rainfall that did not generate runoff.
A t-test to compare water yield from both land use management strategies was performed at the 95% confidence level.
3. Results and Discussion
3.1. Long-Term Rainfall Series
The larger dataset (1974–2017) shows that the average annual rainfall in Iguatu is 995 mm, across 55 wet days. On a rainy day, the expected mean value is 18.1 mm, and the median is 11.0 mm (Table 2).

Table 2.
Characteristics of daily rainfall at Iguatu, CE, Brazil (1974–2017).
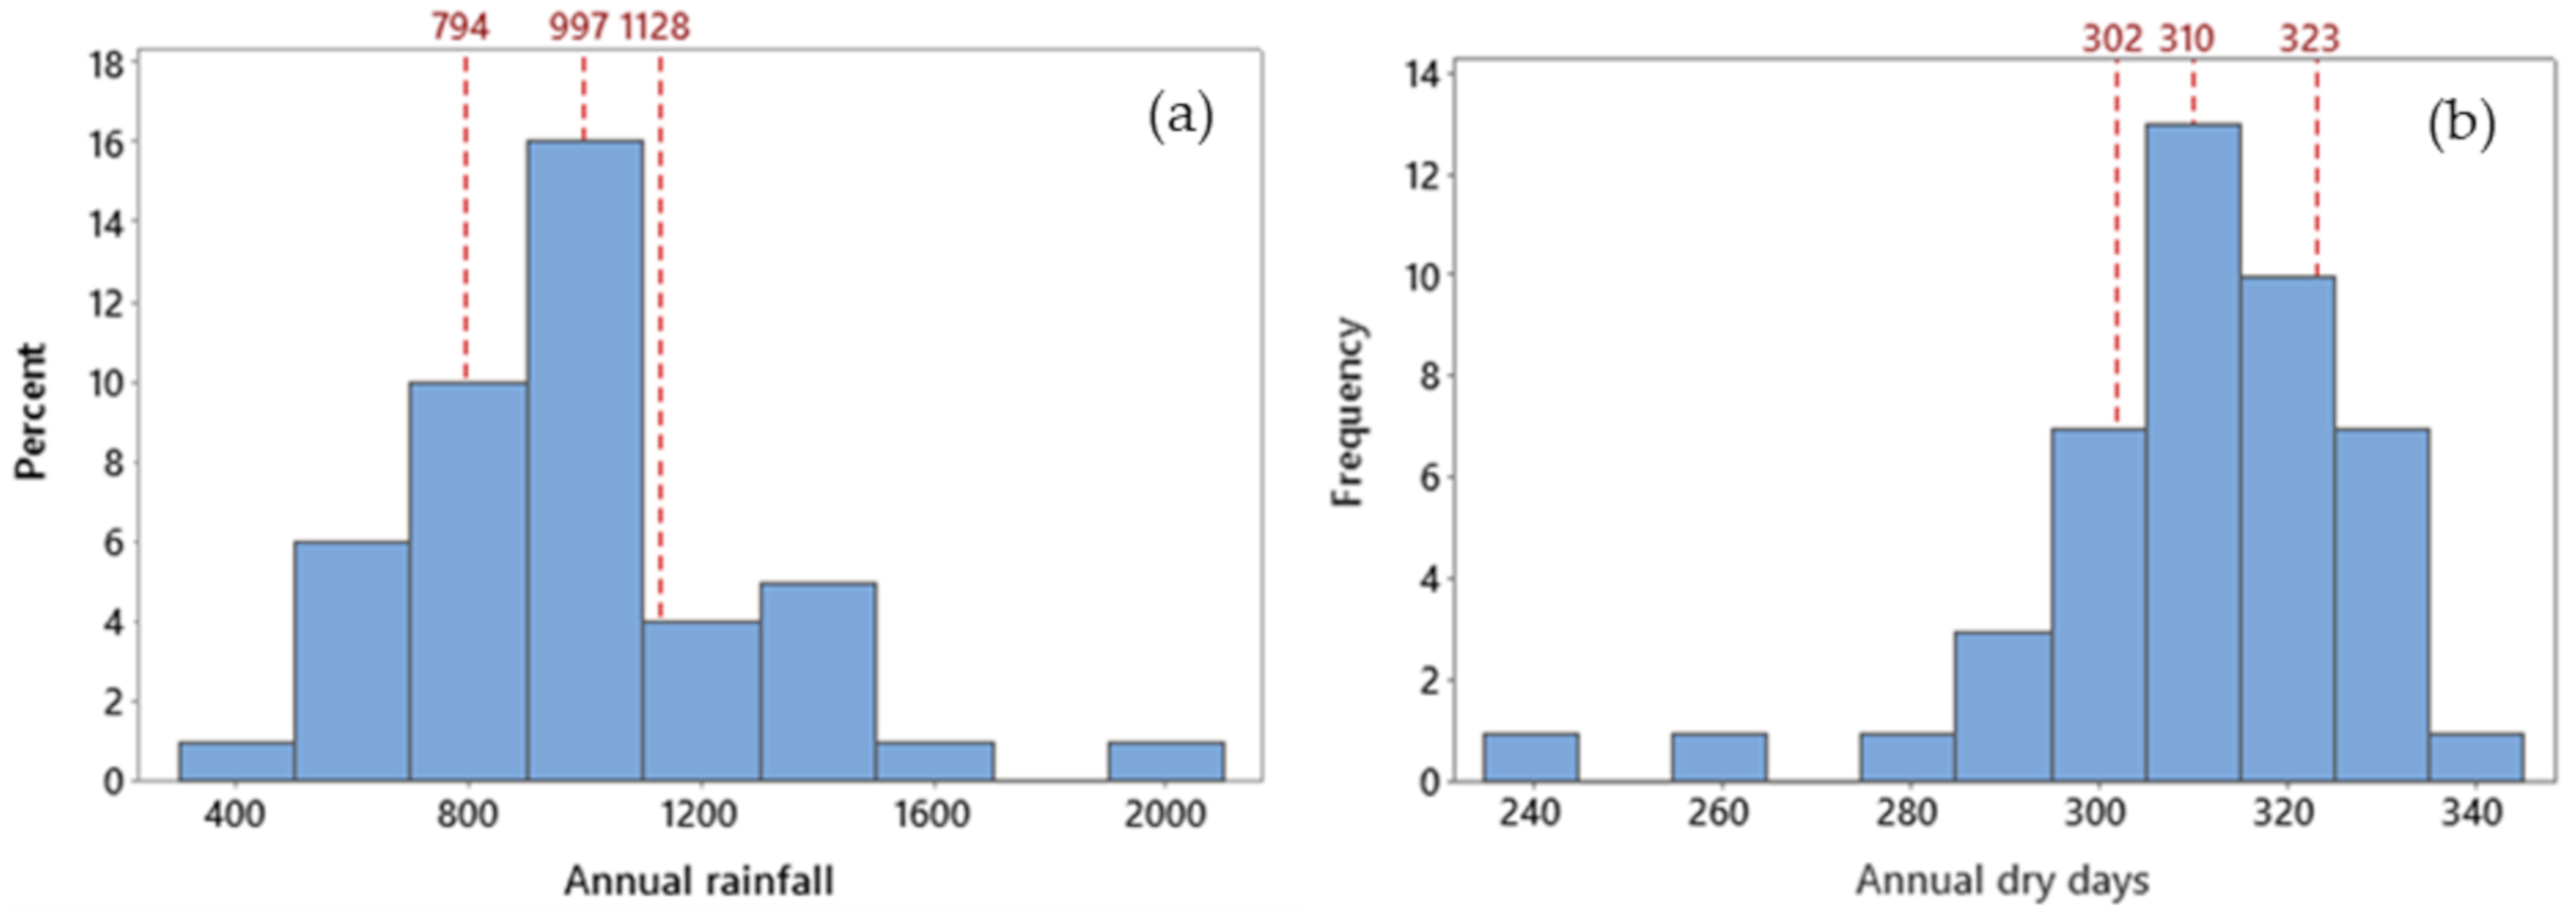
Based on the temporal variability of rainfall events in semi-arid regions [28], total annual rainfall and number of dry days were used to define a dry year (25th percentile) and a wet year (75th percentile), with a total annual rainfall below 790 mm and more than 323 dry days, and a rainfall above 1128 mm and less than 302 dry days, respectively (Figure 5b and Table 2).
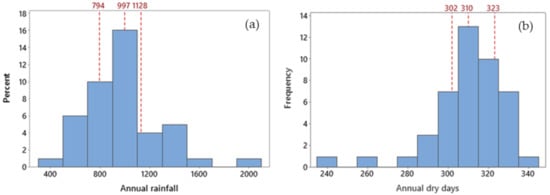
Figure 5.
Histogram of (a) annual rainfall and (b) number of dry days (DD) (1974–2017).
Even though total annual rainfall did not show a significant trend in the period (1974–2017), the number of dry days and average rainfall intensity increased significantly (p-value = 0.05 and 0.001, respectively). These results suggest that extreme events are more frequent (dry spells and intense rainfall events).
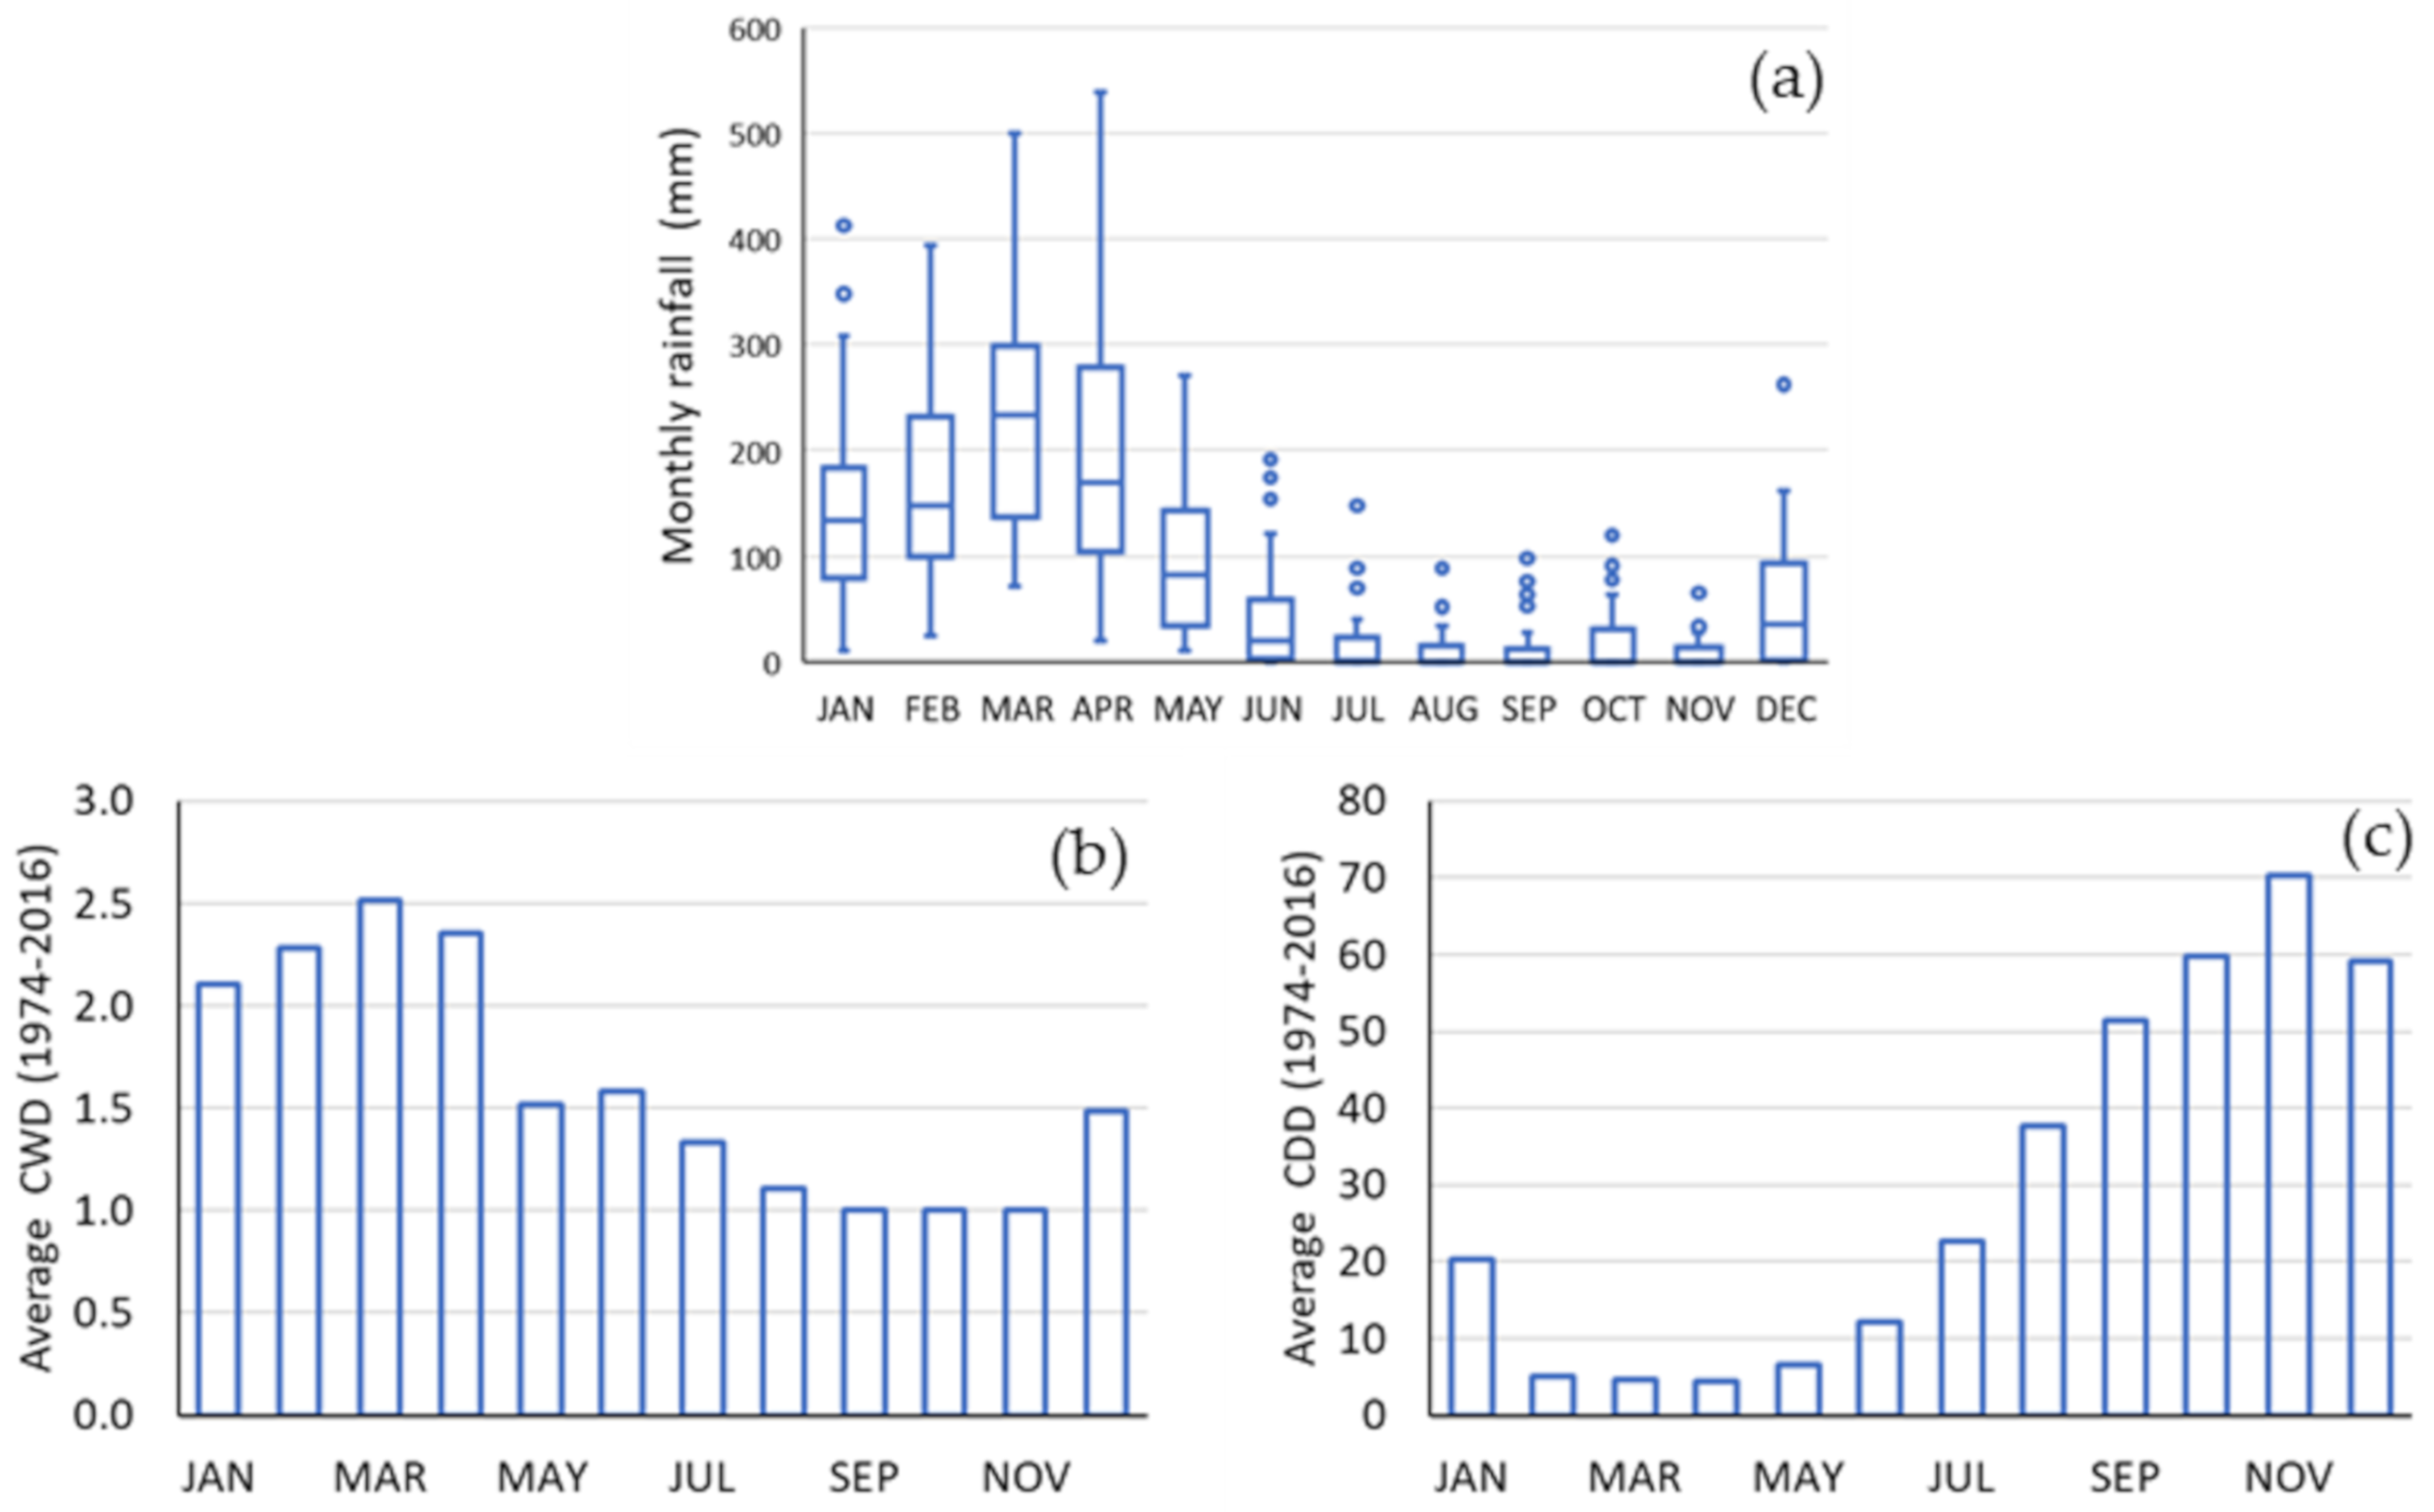
The rain falls mostly between December and May, and seasonal dry spells occur from June to December (Figure 6a), as continuous dry days (CDD) increase from an average of 21 in July to almost 70 in November (Figure 6c). Total monthly rainfall shows a higher skewness from June to November, the mean value being a poor parameter to represent this variable. The average number of CDD from January to May is less than a week, and continuous wet days (CWD) tend to occur in pairs (1.5 to 2.5 days) in the wet season (January to May) and one at a time in the dry season (June to December), in small amounts (Figure 6b).
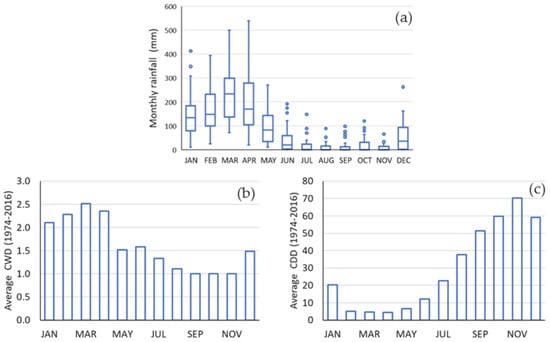
Figure 6.
Monthly (a) rainfall; (b) continuous wet days (CWD); (c) continuous dry days (CDD)—1974–2017.
The rainfall driving forces are cold fronts from October to January, which displace the subtropical cells in the Atlantic Ocean and lead to an increase in monthly precipitation. The intertropical convergence zone (ITCZ) from January to May, which reaches the highest southern latitude (6º S) in March, sets the rainfall season, after which it goes back to the northern hemisphere, allowing the easterly waves to attenuate rainfall occurrence from May to August [28]. Subtropical cells in the Atlantic Ocean are responsible for the driest season from August to October [29], closing the annual cycle.
3.2. Short Term Rainfall-Runoff Events
The catchment dataset (2009–2017) shows that the average annual rainfall in the wet season is 759 mm (507 mm to 1308 mm), over 37 (26 to 54) wet days. On a rainy day, the expected mean value is 20.4 mm, and the median is 14.3 mm, of which a minimum of 5.3 mm is generated runoff (Table 3).

Table 3.
Characteristics of rainfall and runoff at catchment scale (2009–2017).
The number of rainfall events during the wet season shows little relationship with total rainfall (Table 4), as discussed by Guerreiro et al. (2013) [28]—the second year with the most events (46) was the second driest year of the series, 2017. In the period for which there is runoff data (2009–2017), 2015 and 2017 were classified as dry years and 2009 and 2011 as wet years.

Table 4.
Rainfall characteristics: rainfall runoff data set (2009–2017).
The amount of rainfall prior to the first runoff event of the water year (Pcum to Q1) is not proportional to the number of events (Table 4) but has a positive relationship with the number of days from first rainfall to first runoff event, ΔT. The ratio between Pcum to Q1 and ΔT is a function of the soil type, the expansive Vertisol [30,31,32]. The seasonal dry spell from June to December promotes wide cracks due to the shrinkage of the Vertisol at the end of the dry season, which influences infiltration and the resulting runoff at the beginning of the wet season [15]. The dry spells during the wet season promote micro-cracks, and delay the runoff process, as will be explained in the following section.
A greater ΔT in dry years lead to a loss of soil moisture, the shrinkage of expansive clays [30], and the presence of micro-cracks [31], demanding more rainfall to start the runoff process [32]. Cracks in Vertisols increase hydraulic conductivity [33], promoting preferential flow paths for water infiltration in the soil. Even after the sealing of the cracks, there might still be preferential flow paths [34], explaining the cumulative rainfall requirement of up to 475 mm for runoff to occur.
Even though the two land uses under study, R-SDTF and T-SDTF, showed similar responses to cumulative rainfall and time to first runoff event, a t-test showed a different response to water yield (p-value ≤ 0.05). The similarities among the two catchments regarding the onset of the first runoff event suggest that the beginning of runoff depends on the characteristics of the Vertisol soil, and the differences suggest a dependency on groundcover (Figure 3), since the two catchments have similar geomorphological characteristics and soil type, but different land uses (Table 1).
The R-SDTF catchment had runoff events in all years of study (2009–2017), whereas the T-SDTF did not exhibit runoff during the dry years 2015 and 2017 (Figure 7b). The cracks generated in the soil prior to the beginning of the wet season increase initial abstractions, influence infiltration, and affect the onset of runoff generation, as suggested by [15]. The onset of runoff in both catchments needs a minimum cumulative rainfall of 62 mm within a 7-day period (PCUM 7) from the previous rainfall event (Figure 7a,b).

Figure 7.
Rainfall characteristics to first runoff event (2009-2017): (a) R-SDTF; (b) T-SDTF.
T-SDTF reacted to thinning by increasing the number of runoff events but decreasing total yield. The increase in number of events was expected, but not the decrease in water yield [23,35]. This result suggests that the processes were still not established in SDTFs after thinning. However, after 2011 (two years after forest thinning), the groundcover had already been improved and both the number of events and water yield showed a decrease (Figure 7b), as already verified by Ponette-González et al. (2013) [22]. These results suggest that groundcover development reduces surface flow due to an increase in surface roughness that reduces flow velocity and increases infiltration opportunity [8], and the development of a herbaceous root system [36] that creates preferential flow paths [30] for water to infiltrate the soil [22].
Total annual rainfall from the time series (1974–2017) classified 2009 and 2011 as wet years, and 2015 and 2017 as dry years. Dry years (annual rainfall < 608 mm) showed low to no runoff, due to the shrinking and swelling characteristics of the soils [15]. During the dry years 2015 and 2017, despite the cumulative rainfall being above 62 mm (Figure 7b), the low continuous dry days (CDD) (lower than seven) associated with rainfall events below 40 mm (Figure 8a,b) promoted and maintained groundcover in the thinned vegetation catchment, increasing roughness and infiltration opportunity, with no resulting runoff.

Figure 8.
Rainfall events leading to first runoff event in the dry years 2015 (a) and 2017 (b).
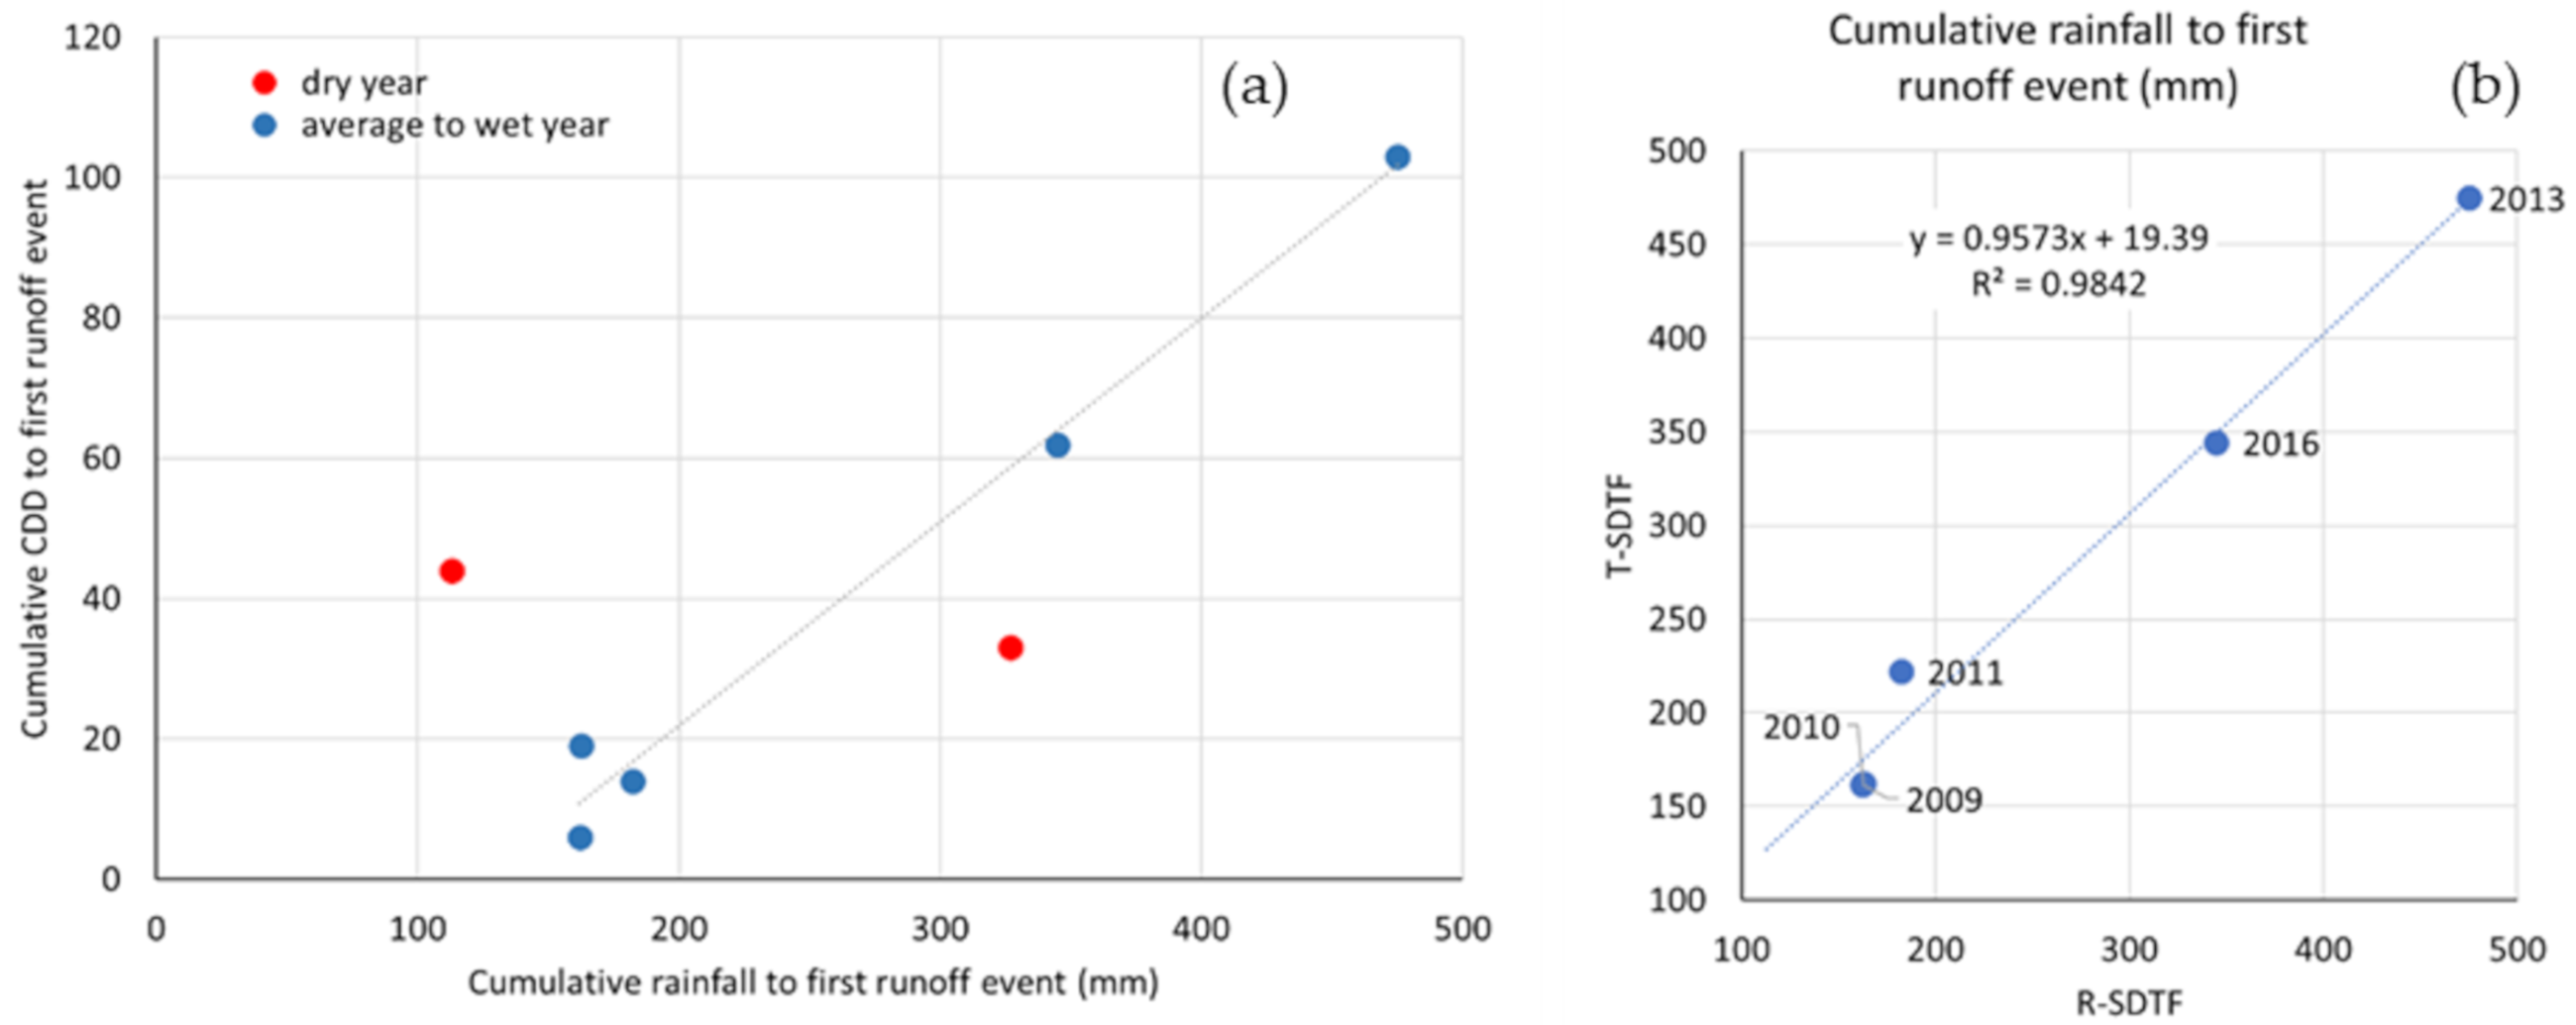
The catchments responded similarly to the onset of runoff when there was enough CDD to compromise the development of vegetation in the T-SDTF, mimicking the R-SDTF catchment, suggesting that the soil is the major driver of the process. When the CDD is above 30 days, micro-cracks are formed, and the soil returns to the initial dry, cracked condition. The median value of cumulative rainfall to the beginning of the runoff process is approximately 200 mm when the maximum CDD is below 30 days [37]. This was particularly evident in 2016, when a total cumulative rainfall of 345 mm was necessary to begin the runoff process, after a dry spell of 36 days in which a total rainfall of 298 mm occurred.
The behavior contributing to the onset of runoff events is evident for the wet years 2009 to 2011 and the average years 2013 and 2016, but none can be spotted for the dry years 2015 and 2017 (Figure 9a). In average and wet years, there is a linear relationship between cumulative rainfall for the onset of the first runoff event and CDD. More CDD in dry years results in more water loss via evapotranspiration and soil moisture reduction, and reinstates cracks in the soil [34], which redefine new preferential flow paths for water to infiltrate into the soil. Still, Figure 9b shows a similar behavior in both catchments, confirming that soil, rather than land use, is the major driver to start the runoff process in Vertisols in a semi-arid tropical region.
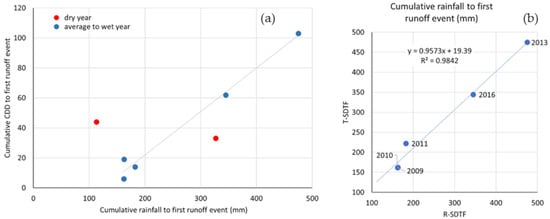
Figure 9.
(a) CDD vs. rainfall to first runoff event; (b) rainfall to first runoff event: regenerated vs. thinned vegetation
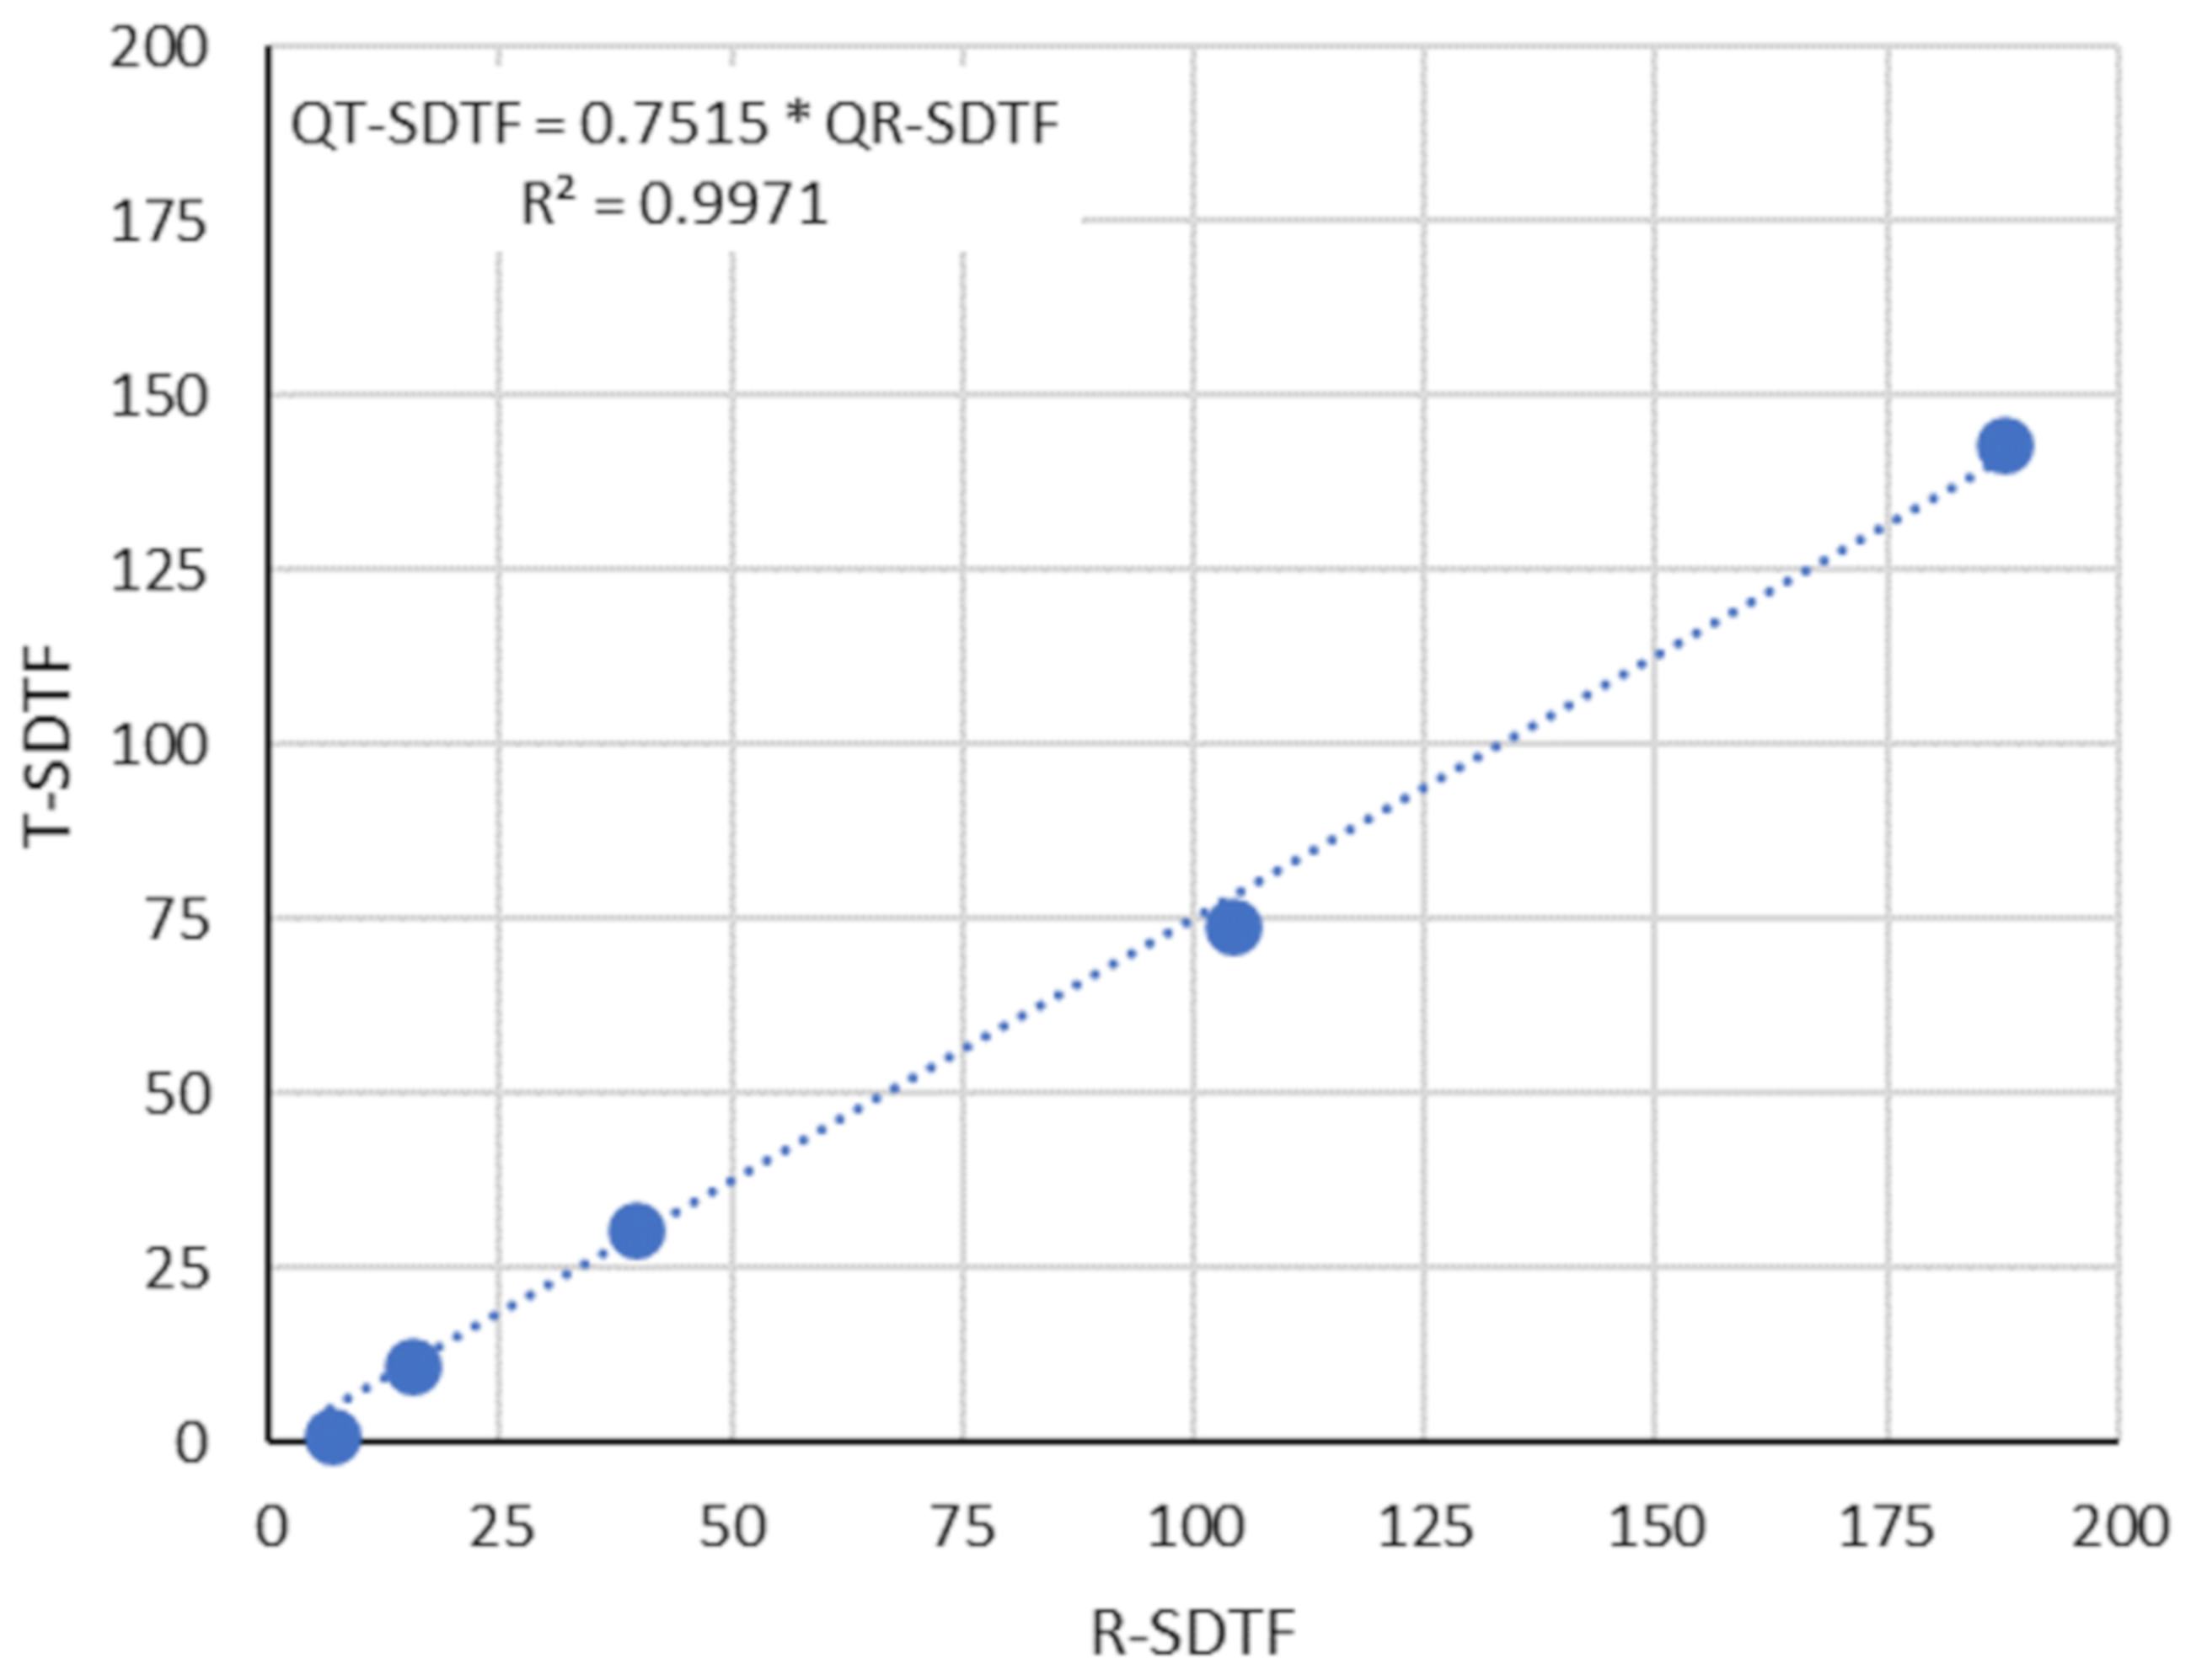
Once runoff has been established, groundcover explains the variation in water yield in both catchments, as the water yield from the T-SDTF catchment corresponds to approximately 75% of the R-SDTF (Figure 10). This suggests that 25% of total rainfall will be available to the other eco-hydrological processes. T-SDTF allows solar radiation to hit the soil and promotes the development of groundcover [36,38], which increases surface roughness and infiltration opportunity and reduces runoff. Regenerated vegetation promotes greater coverage of the soil, but canopy shading does not allow the further development of groundcover. Biomass production may be a profitable alternative to agriculture, as crop yield is expected to be more affected by climate variability than perennial biomass [39].
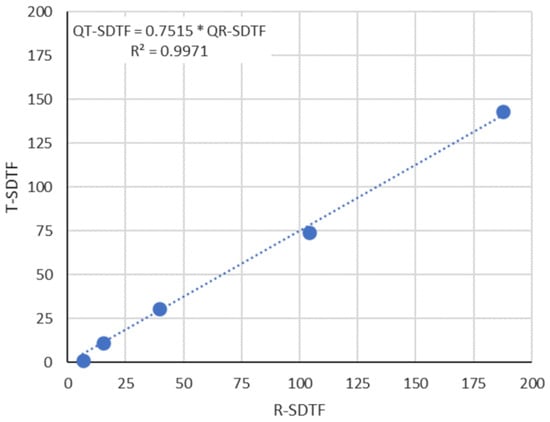
Figure 10.
T-SDTF vs. R-SDTF water yield relationship.
4. Conclusions
Forest thinning enhances groundcover development and is a better management practice for biomass production. This management practice shows a lower water yield when compared to a regenerated forest, supporting the decision of investing in forest regeneration to attend to an increasing water storage demand. The number of dry days and rainfall intensity increased in the 1974–2017 period, aggravating the already dry characteristics of the region, and contributing to more extreme runoff events. In the case of a dry spell over 30 days, micro-cracks are formed, and the soil returns to the initial dry, cracked condition. The onset of runoff events is defined by the soil characteristics rather than the land use. The onset of runoff in both catchments requires a minimum cumulative rainfall of 62 mm within a 7-day period from the previous rainfall event, although it is the land-use that defines water yield. The impact of water storage in the soil cracks upon the onset of runoff generation is evident, but needs further studies for quantification.
Author Contributions
All authors made a significant contribution to the final version of the manuscript. Conceptualization, M.S.G., E.M.d.A. and H.A.d.Q.P.; methodology, M.S.G., J.B.B. and J.C.R.F.; writing—original draft preparation, M.S.G., E.M.d.A. and H.A.d.Q.P.; writing—review and editing, all authors; supervision, M.S.G. and E.M.d.A.; project administration, E.M.d.A. All authors have read and agreed to the published version of the manuscript.
Funding
This work was supported by CNPq—Conselho Nacional de Desenvolvimento Científico e Tecnológico, Brazil [grant number 558135/2009-9].
Informed Consent Statement
Not applicable.
Data Availability Statement
The data presented in this study are available on request from the corresponding author.
Acknowledgments
This study was carried out with the support of the Coordenação de Aperfeiçoamento de Pessoal de Nível Superior - Brasil (CAPES), the Conselho Nacional de Desenvolvimento Científico e Tecnológico (CNPq) and the Fundação Cearense de Apoio ao Desenvolvimento Científico e Tecnológico.
Conflicts of Interest
The authors declare that they have no conflict of interest.
References
- UN. 2010–2020: UN Decade for Deserts and the Fight Against Desertification. [WWW Document]. 2019. Available online: https://www.un.org/en/events/desertification_decade/whynow.shtml (accessed on 13 May 2020).
- Huang, J.; Ji, M.; Xie, Y. Global semi-arid climate change over last 60 years. Clim. Dyn. 2016, 46, 1131–1150. [Google Scholar] [CrossRef]
- Huang, J.; Li, Y.; Fu, C.; Chen, F.; Fu, Q.; Dai, A.; Shinoda, M.; Ma, Z.; Guo, W.; Li, Z.; et al. Dryland climate change: Recent progress and challenge. Rev. Geophys. 2017, 719–778. [Google Scholar] [CrossRef]
- Marengo, J.A.; Torres, R.R.; Alves, L.M. Drought in Northeast Brazil—Past, present, and future. Theor. Appl. Clim. 2016, 129, 1189–1200. [Google Scholar] [CrossRef]
- Kihupi, N.I.; Tarimo, A.K.P.R.; Masika, R.J.; Boman, B.; Dick, W.A. Trend of Growing Season Characteristics of Semi-Arid Arusha District in Tanzania. J. Agric. Sci. 2015, 7, 45–55. [Google Scholar] [CrossRef]
- Gebru, T.A.; Brhane, G.K.; Gebremedhin, Y.G. Contributions of water harvesting technologies intervention in arid and semi-arid regions of Ethiopia, in ensuring households’ food security, Tigray in focus. J. Arid Environ. 2021, 185, 104373. [Google Scholar] [CrossRef]
- Lal, R. Sequestering carbon and increasing productivity by conservation agriculture. J. Soil Water Conserv. 2015, 70, 55–62. [Google Scholar] [CrossRef]
- Andrade, E.M.; Guerreiro, M.J.S.; Palácio, H.A.Q.; Campos, D.A. Ecohydrology in a Brazilian tropical dry forest: Thinned vegetation impact on hydrological functions and ecosystem services. J. Hydrol. Reg. Stud. 2020, 27, 100649. [Google Scholar] [CrossRef]
- Allen, K.; Dupuy, J.M.; Gei, M.G.; Hulshof, C.; Medvigy, D.; Pizano, C.; Salgado-Negret, B.; Smith, C.M.; Trierweiler, A.; Bloem, S.J.; et al. Will seasonally dry tropical forests be sensitive or resistant to future changes in rainfall regimes? Environ. Res. Lett. 2017, 12, 1–16. [Google Scholar] [CrossRef]
- FAO. Global Ecological Zoning for the Global Forest Resources Assessment 2000—Final Report. Rome. [WWW Document]. 2001. Available online: http://www.fao.org/3/ad652e/ad652e00.htm (accessed on 13 May 2020).
- Miles, L.; Newton, A.C.; DeFries, R.S.; Ravilious, C.; May, I.; Blyth, S.; Kapos, V.; Gordon, J.E. A global overview of the conservation status of tropical dry forests. J. Biogeogr. 2006, 33, 491–505. [Google Scholar] [CrossRef]
- Alenius, T.; Mökkönen, T.; Holmqvist, E.; Ojala, A. Neolithic land use in the northern Boreal zone: High-resolution multiproxy analyses from Lake Huhdasjärvi, south-eastern Finland. Veg. Hist. Archaeobotany 2017, 26, 469–486. [Google Scholar] [CrossRef]
- Stuhler, J.; Orrock, J. Historical land use and present-day canopy thinning differentially affect the distribution and abundance of invasive and native ant species. Biol. Invasions 2016, 18, 813–1825. [Google Scholar] [CrossRef]
- Blackie, R.; Baldauf, C.; Gautier, D.; Gumbo, D.; Kassa, H.; Parthasarathy, N.; Paumgarten, F.; Sola, P.; Pulla, S.; Waeber, P.; et al. Tropical Dry Forests the State of Global Knowledge and Recommendations for Future Research; Cifor: Bogor, Indonesia, 2014; Volume 2. [Google Scholar]
- Pathak, P.; Sudi, R.; Wani, S.P.; Sahrawat, K.L. Hydrological behavior of Alfisols and Vertisols in the semi-arid zone: Implications for soil and water management. Agric. Water Manag. 2013, 118, 12–21. [Google Scholar] [CrossRef]
- Driessen, P.; Deckers, J.; Spaargaren, O.; Nachtergaele, F. Lecture Notes on the Major Soils of the World; Food and Agriculture Organization (FAO): Rome, Italy, 2000. [Google Scholar]
- Latham and Peter Ahn. Management of Vertisols under Semi-Arid Conditions, IBSRAM PROCEEDINGS No. 6. 1986. Available online: https://horizon.documentation.ird.fr/exl-doc/pleins_textes/divers15-08/010065123.pdf (accessed on 13 May 2020).
- Zuo, D.; Xu, Z.; Yao, W.; Jin, S.; Xiao, P.; Ran, D. Assessing the effects of changes in land use and climate on runoff and sediment yields from a watershed in the Loess Plateau of China. Sci. Total Environ. 2016, 544, 238–250. [Google Scholar] [CrossRef]
- Yair, A. Contrasting hydrological regimes in two adjoining semi-arid areas, with low rain intensities. J. Arid Environ. 2021, 187, 104404. [Google Scholar] [CrossRef]
- Kurtzman, D.; Baram, S.; Dahan, O. Soil-aquifer phenomena affecting groundwater under vertisols: A review. Hydrol. Earth Syst. Sci. 2016, 20, 1–12. [Google Scholar] [CrossRef]
- Debele, T.; Deressa, H. Integrated Management of Vertisols for Crop Production in Ethiopia: A Integrated Management of Vertisols for Crop Production in Ethiopia: A Review. J. Biol. Agric. Healthc. 2016, 6, 26–36. [Google Scholar]
- Ponette-González, A.; Marín-Spiotta, E.; Brauman, K.; Farley, K.; KC, K.W.; Young, K. Hydrologic Connectivity in the High-Elevation Tropics: Heterogeneous Responses to Land Change. Bioscience 2013, 64, 92–104. [Google Scholar] [CrossRef]
- Wu, Y.; Zhang, X.; Li, C.; Xu, Y.; Hao, F.; Yin, G. Ecosystem service trade-offs and synergies under influence of climate and land cover change in an afforested semiarid basin, China. Ecol. Eng. 2021, 159, 106083. [Google Scholar] [CrossRef]
- Lal, R. Saving global land resources by enhancing eco-efficiency of agroecosystems. J. Soil Water Conserv. 2018, 73, 100A–106A. [Google Scholar] [CrossRef]
- Lal, R. Soil carbon sequestration to mitigate climate change. Geoderma 2004, 123, 1–22. [Google Scholar] [CrossRef]
- Holdridge, L.R. Life Zone Ecology. For. Sci. 1968, 14, 382. [Google Scholar] [CrossRef]
- FAO. Global Ecological Zones for Fao Forest Reporting: 2010 Update. Rome. 2012. Available online: http://www.fao.org/3/ap861e/ap861e00.pdf (accessed on 13 May 2020).
- Guerreiro, M.J.S.; Andrade, E.M.; Abreu, I.; Lajinha, T. Long-term variation of precipitation indices in Ceará State, Northeast Brazil. Int. J. Climatol. 2013, 33, 2929–2939. [Google Scholar] [CrossRef]
- Moron, V.; Ward, M.; Navarra, A. Observed and SST-Forced seasonal Rainfall Variability Across Tropical America. Int. J. Climatol. 2001. [Google Scholar] [CrossRef]
- Dinka, T.M.; Morgan, C.L.S.; Mcinnes, K.J.; Kishné, A.S.; Harmel, R.D. Shrink-swell behavior of soil across a Vertisol catena. J. Hydrol. 2013, 476, 352–359. [Google Scholar] [CrossRef]
- Li, J.H.; Li, L.; Chen, R.; Li, D.Q. Cracking and vertical preferential fl ow through land fi ll clay liners. Eng. Geol. 2016, 206, 33–41. [Google Scholar] [CrossRef]
- Santos, J.C.N.; Andrade, E.M.; Guerreiro, M.J.S.; Medeiros, P.H.A.; Queiroz Palácio, H.A.; Araújo Neto, J.R. Effect of dry spells and soil cracking on runoff generation in a semiarid micro watershed under land use change. J. Hydrol. 2016, 541. [Google Scholar] [CrossRef]
- Krisnanto, S.; Rahardjo, H.; Fredlund, D.G.; Leong, E.C. Water content of soil matrix during lateral water flow through cracked soil. Eng. Geol. 2016, 210, 168–179. [Google Scholar] [CrossRef]
- Greve, A.; Andersen, M.; Acworth, R. Investigations of soil cracking and preferential flow in a weighing lysimeter filled with cracking clay soil. J. Hydrol. 2010, 393, 105–113. [Google Scholar] [CrossRef]
- Ma, J.; Kang, F.; Cheng, X.; Han, H. Moderate thinning increases soil organic carbon in Larix principis-rupprechtii (Pinaceae) plantations. Geoderma 2018, 329, 118–128. [Google Scholar] [CrossRef]
- Hata, K.; Kawakami, K.; Kachi, N. Higher Soil Water Availability after Removal of a Dominant, Nonnative Tree (Casuarina equisetifolia Forst.) from a Subtropical Forest. Pac. Sci. 2015, 69, 445–460. [Google Scholar] [CrossRef]
- Greve, A.; Acworth, R.; Kelly, B. Detection of subsurface soil cracks by vertical anisotropy profiles of apparent electrical resistivity. Geophysics 2010, 75, 85–93. [Google Scholar] [CrossRef]
- Asaye, Z.; Zewdie, S. Fine root dynamics and soil carbon accretion under thinned and un-thinned Cupressus lusitanica stands in, Southern Ethiopia. Plant Soil 2013, 366, 261–271. [Google Scholar] [CrossRef]
- Regan, C.M.; Connor, J.D.; Segaran, R.R.; Meyer, W.S.; Bryan, B.A.; Ostendorf, B. Climate change and the economics of biomass energy feedstocks in semi-arid agricultural landscapes: A spatially explicit real options analysis. J. Environ. Manag. 2017, 192, 171–183. [Google Scholar] [CrossRef] [PubMed]
Publisher’s Note: MDPI stays neutral with regard to jurisdictional claims in published maps and institutional affiliations. |
© 2021 by the authors. Licensee MDPI, Basel, Switzerland. This article is an open access article distributed under the terms and conditions of the Creative Commons Attribution (CC BY) license (http://creativecommons.org/licenses/by/4.0/).

