Article

The Nitrogen Budget of Coastal Eastern Guangdong in the Last 15 Years

1
School of Geography and Remote Sensing, Guangzhou University, Guangzhou 510006, China
2
Southern Marine Science and Engineering Guangdong Laboratory (Guangzhou), Guangzhou 511458, China
3
School of Geography and Tourism, Guangdong University of Finance & Economics, Guangzhou 510320, China
4
Department of Hydrology and Water Resources Management, Institute for Natural Resource Conservation, Kiel University, D-24118 Kiel, Germany
*
Authors to whom correspondence should be addressed.
Hydrology 2021, 8(2), 81; https://doi.org/10.3390/hydrology8020081
Submission received: 15 March 2021 / Revised: 2 May 2021 / Accepted: 6 May 2021 / Published: 11 May 2021

Abstract

:
Nitrogen pollution has caused severe ecological and environmental crisis, especially in densely populated coastal regions. Using a mathematical model based on statistical data series from industry, agriculture, environmental protection, and population in 2000, 2005, 2010, and 2015, this paper aims to estimate the nitrogen income and expenditure of coastal Eastern Guangdong, to reveal the temporal variation of the nitrogen budget in the coastal region with high agriculture intensity, and to suggest a management strategy for the local nitrogen control. The results show that: coastal Eastern Guangdong is a nitrogen surplus region, with nitrogen load and nitrogen flux varying in the range 276.01–299.60 kg N ha−1 yr−1 and 221.26–239.06 kg N ha−1 yr−1, respectively, during the period 2000–2015; from 2000 to 2015, the overall nitrogen surplus and the nitrogen surplus unit area showed an obvious upward trend, indicating that nitrogen pollution in the area was deteriorating; agricultural used fertilizer serves as the main contributor to nitrogen input, while water nitrogen accounts for the highest portion of nitrogen output; despite the fluctuation of nitrogen input and output, water nitrogen output steadily increased, suggesting a stronger water environment management requirement. This research provides reference for researchers and decision-makers in the ecological and environmental domains.

Graphical Abstract

1. Introduction

Nitrogen participates in the biogeochemical cycle of the ecosystem and plays an important role in life maintenance [1,2,3]. With the intensification of the anthropogenic impact on the ecological environment, the nitrogen cycle has been interfered with severely. Nitrogen continuously enters the environment, either accumulates on land, or enters rivers, lakes, reservoirs, and other water bodies with flowing water, causing land degradation and water pollution to differing extents. Previous studies have shown that more than 66% of lakes and reservoirs in China are in a state of eutrophication, of which 22% are rich or super-rich in nutrients [4]. Eutrophication and its environmental influence has become one of the major water crises in China’s lakes in recent decades [4]. At the same time, nitrogen oxides directly released into the atmosphere strongly affect air quality and atmospheric environmental security, via global warming, rain acidification, ozone perturbation, etc., which in turn trigger a series of social and economic problems. The global biochemical circulation of nitrogen results in the deterioration of the terrestrial system, as well as the oceanic system, especially in coastal regions [5]. About 60% of the world’s population lives in coastal regions [6]. The increase in population and in industrial and agricultural development has placed unprecedented environmental pressure on coastal regions.
Assessing and quantifying regional nitrogen budgets is essential for clarifying the regional nitrogen cycle, to design the scientific management of nitrogen budgets and for the rational planning of social and economic life. Experts and scholars all over the world have done a lot of research related to the nitrogen budget and its environmental effects, in global, continental, national, regional, and watershed scales. The research results revealed the strong interference of human activities on the nitrogen cycle. Howarth et al. [7] considered nitrogen sources such as biological nitrogen fixation, net import of agricultural products, and chemical fertilizer, estimated the nitrogen input of 14 regions in Asia, America, and Europe into the North Atlantic Ocean, and systematically studied the nitrogen input of the main basins in the North Atlantic Ocean. A process-based nitrogen budget model of the Yangtze River found that the upper reaches of the Yangtze River is a nitrogen source, while the Yangtze River Delta Economic Zone is under high surplus nitrogen pressure and faces a series of environmental problems [8,9]. The nitrogen budget of the Pearl River Delta based on statistics and related parameters in three different periods of 2000, 2005, and 2010 focused on nitrogen load and budget in the economically developed region, but paid less attention to the nitrogen dynamics of coastal areas with a huge population and active agriculture [5]. Against a background of formulating strategies to reduce eutrophication, Schilling et al. [10] used different models to evaluate the NO3-N load in the Iowa watershed. The results showed that the overall consistency between the models was low, and the estimation results were variable.
In addition, more experts and scholars have paid attention to the impact on the region of the agricultural nitrogen input. Based on the nitrogen budget, Filoso et al. [11] pointed out that main source of nitrogen input is artificial expansion of legumes for biological nitrogen fixation, and suggested that human activities can greatly change the natural nitrogen cycle. Vries et al. [12] compared the nitrogen budget of European Union (EU) countries, and found that the difference in nitrogen flux was mainly determined by nitrogen input. Agricultural intensification and livestock density had a greater impact on the difference of nitrogen flux. Moreover, for EU countries, nitrogen loss through leaching and runoff was relatively larger. Boyer et al. [13] explored the impact of human activities on the nitrogen cycle in the northeastern United States and revealed that agriculture is the main source of nitrogen under the combined effect of fertilizer nitrogen, crop nitrogen fixation, and imported nitrogen from feed. Piske and Peterson pointed out that the output of NO3-N was positively correlated with corn and soybean planting areas in general, while for a single watershed, with the increase of corn-planting area, the NO3-N load per unit area decreased [14]. Based on the long-term NO3-N series in the river, McIsaac et al. [15] indicated that there was no significant trend of NO3-N load from 1976 to 2014, except for a downward trend found in the 1990s. Agriculture influences the nitrogen budget of a region significantly. Nitrogen concentration has surpassed the threshold by almost three-fold due to human interference, especially agriculture activiety. Recently, experts have focused on how to reduce agricultural nitrogen pollution from the perspective of agriculture. For example, agricultural best management practices (BMPs) put forward solutions to reduce the diffusion loss of agricultural nutrients and protect the local ecological environment through the trade-off between environment and economy [16]. BMPs have been successfully used in the control of diffuse pollution [17,18].
As a transitional zone between terrestrial and marine ecosystems, the near-coastal region is more sensitive and fragile, confronted with higher environmental risk caused by nitrogen enrichment. Consequently, there is an urgent need to carry out a dynamic analysis of the nitrogen balance under the disturbance of human activities in the coastal region with heavy agricultural intensity. Based on such a background, this study takes the coastal area of Eastern Guangdong as an example to analyze the regional nitrogen budget over the past 15 years. The main objective of this study is to clarify the main sources of nitrogen in the region, to evaluate the nitrogen budget, and to link the relationship between agriculture and the environment in coastal areas. Finally, provide guidance and support for agricultural management in the area to reduce nutrient dispersal.

2. Materials and Methods
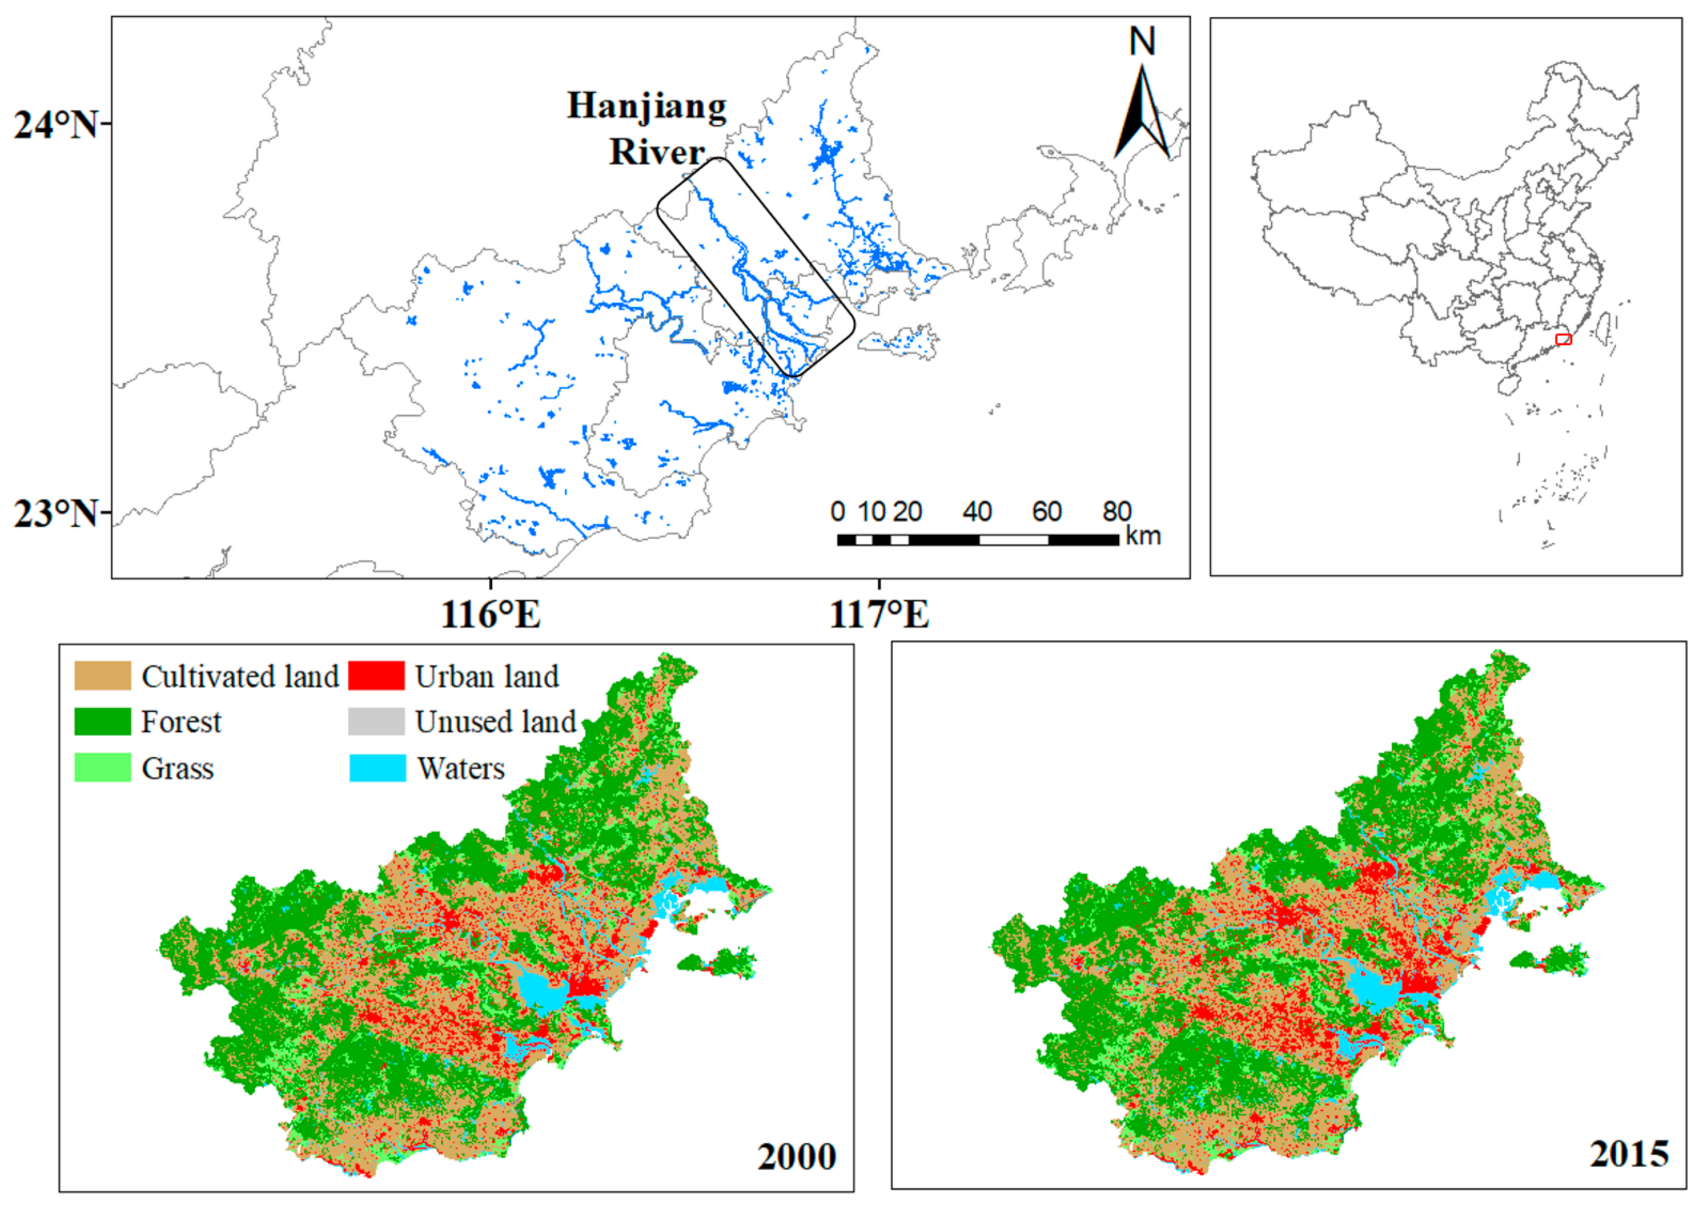
2.1. Study Area

The coastal area of Eastern Guangdong covers three cities. From north to south lies Shantou, Chaozhou, and Jieyang (Figure 1). In addition, Figure 1 also shows the water system map and land use map of the coastal area in Eastern Guangdong. During the period from 2000 to 2015, the area of cultivated land in the coastal areas of Eastern Guangdong decreased, while the area of urban land increased. The area is approximately rectangular in shape, connecting the urban agglomeration of the Haixi Economic Zone to the east and the Guangdong, Hong Kong, and Macao Great Bay Area in the west. The urban agglomeration is bordered by Meizhou in the north and the South China Sea in the south. Economic, trade, and agricultural activities are very active in this region. Conducting research based on administrative areas is favorable to the collection of statistical data and the adjustment and implementation of relevant ecological protection measures. The basic natural and social conditions are shown in Table 1.

2.2. Data Acquisition and Processing

All the statistical data used in the article are from the “Guangdong Rural Statistical Yearbook”, “Guangdong Statistical Yearbook”, and weather stations. A total of 20 statistical indicators are involved in this research, including relevant data on population, agriculture, industry, environmental protection, land area, etc. Some of the indicators are listed in Table 2. The additional parameters and its specific values are listed in the supplementary document (Table S1), including national land area, resident population, paddy area, dry land area, soybean planting area, peanut acreage, year-end inventory of cattle, year-end inventory of goat, year-end inventory of pigs, year-end inventory of poultry, rice yield, soybean yield, peanut yield, vegetable yield.

2.3. Methodology

2.3.1. Input of the Nitrogen

Regional nitrogen input is mainly divided into two categories. One is artificially activated nitrogen and the other is recycled nitrogen [19,20]. Among them, artificially activated nitrogen includes Fertilizer Nitrogen (NF), Farmland Symbiotic Nitrogen Fixation (NSy), Farmland Self-Nitrogen Fixation (NSe), and Wastewater Discharge nitrogen (NW). Recycled nitrogen contains Atmospheric Dry and Wet Deposition Nitrogen (ND), Human and Livestock Excreta Nitrogen (NE), and Crop Residue Nitrogen (NR). According to the treatment procedure of Xie et al. [5], Deng et al. [8]. and Xing et al. [20], the indicators and calculation methods involved in the input of nitrogen are shown in Table 3.
The levels of nitrogen contained in different crops vary from 0.5% to 5.11%, depending on the species and organs. The nitrogen content and its mass ratio of different parts of various crops are listed in Table 4.

2.3.2. Output of the Nitrogen

Regional nitrogen output can be divided into Denitrifying Nitrogen (NDe), Volatile Nitrogen (NV), Crop Harvest Taken Nitrogen (NH) and Water Output Nitrogen(NWo). The indicators and calculation methods involved in the nitrogen output estimation are given in Table 5.

2.3.3. Nitrogen Budget

Regional nitrogen budget refers to nitrogen input, output and nitrogen surplus. The estimation of total nitrogen input refers to the sum of the agricultural related nitrogen and waste water nitrogen, while the nitrogen output means the total amount of nitrogen crop harvest and water output. Correspondingly, the nitrogen surplus indicates the difference between input and output. The nitrogen budget used mainly refers to the research results of Xie et al. [5] and Meng et al. [21]. The nitrogen budget equations are mainly as follows:
NI = NF + NSy + NSe + NW + NE + ND + NR
NO = NDe + NV + NH + NWo
NN = NINO
Here, NI is the nitrogen input, NO represents the nitrogen output, and NN means the net nitrogen budget.
Considering the adaption of uniform indicators and calculation methods for the estimation of the nitrogen budget in different periods in coastal Eastern Guangdong (Table 3, Table 4 and Table 5), the systematic error will not influence the overall situation of the evolution of the nitrogen budget in coastal Eastern Guangdong in the past 15 years. The results are correspondingly credible.

3. Results

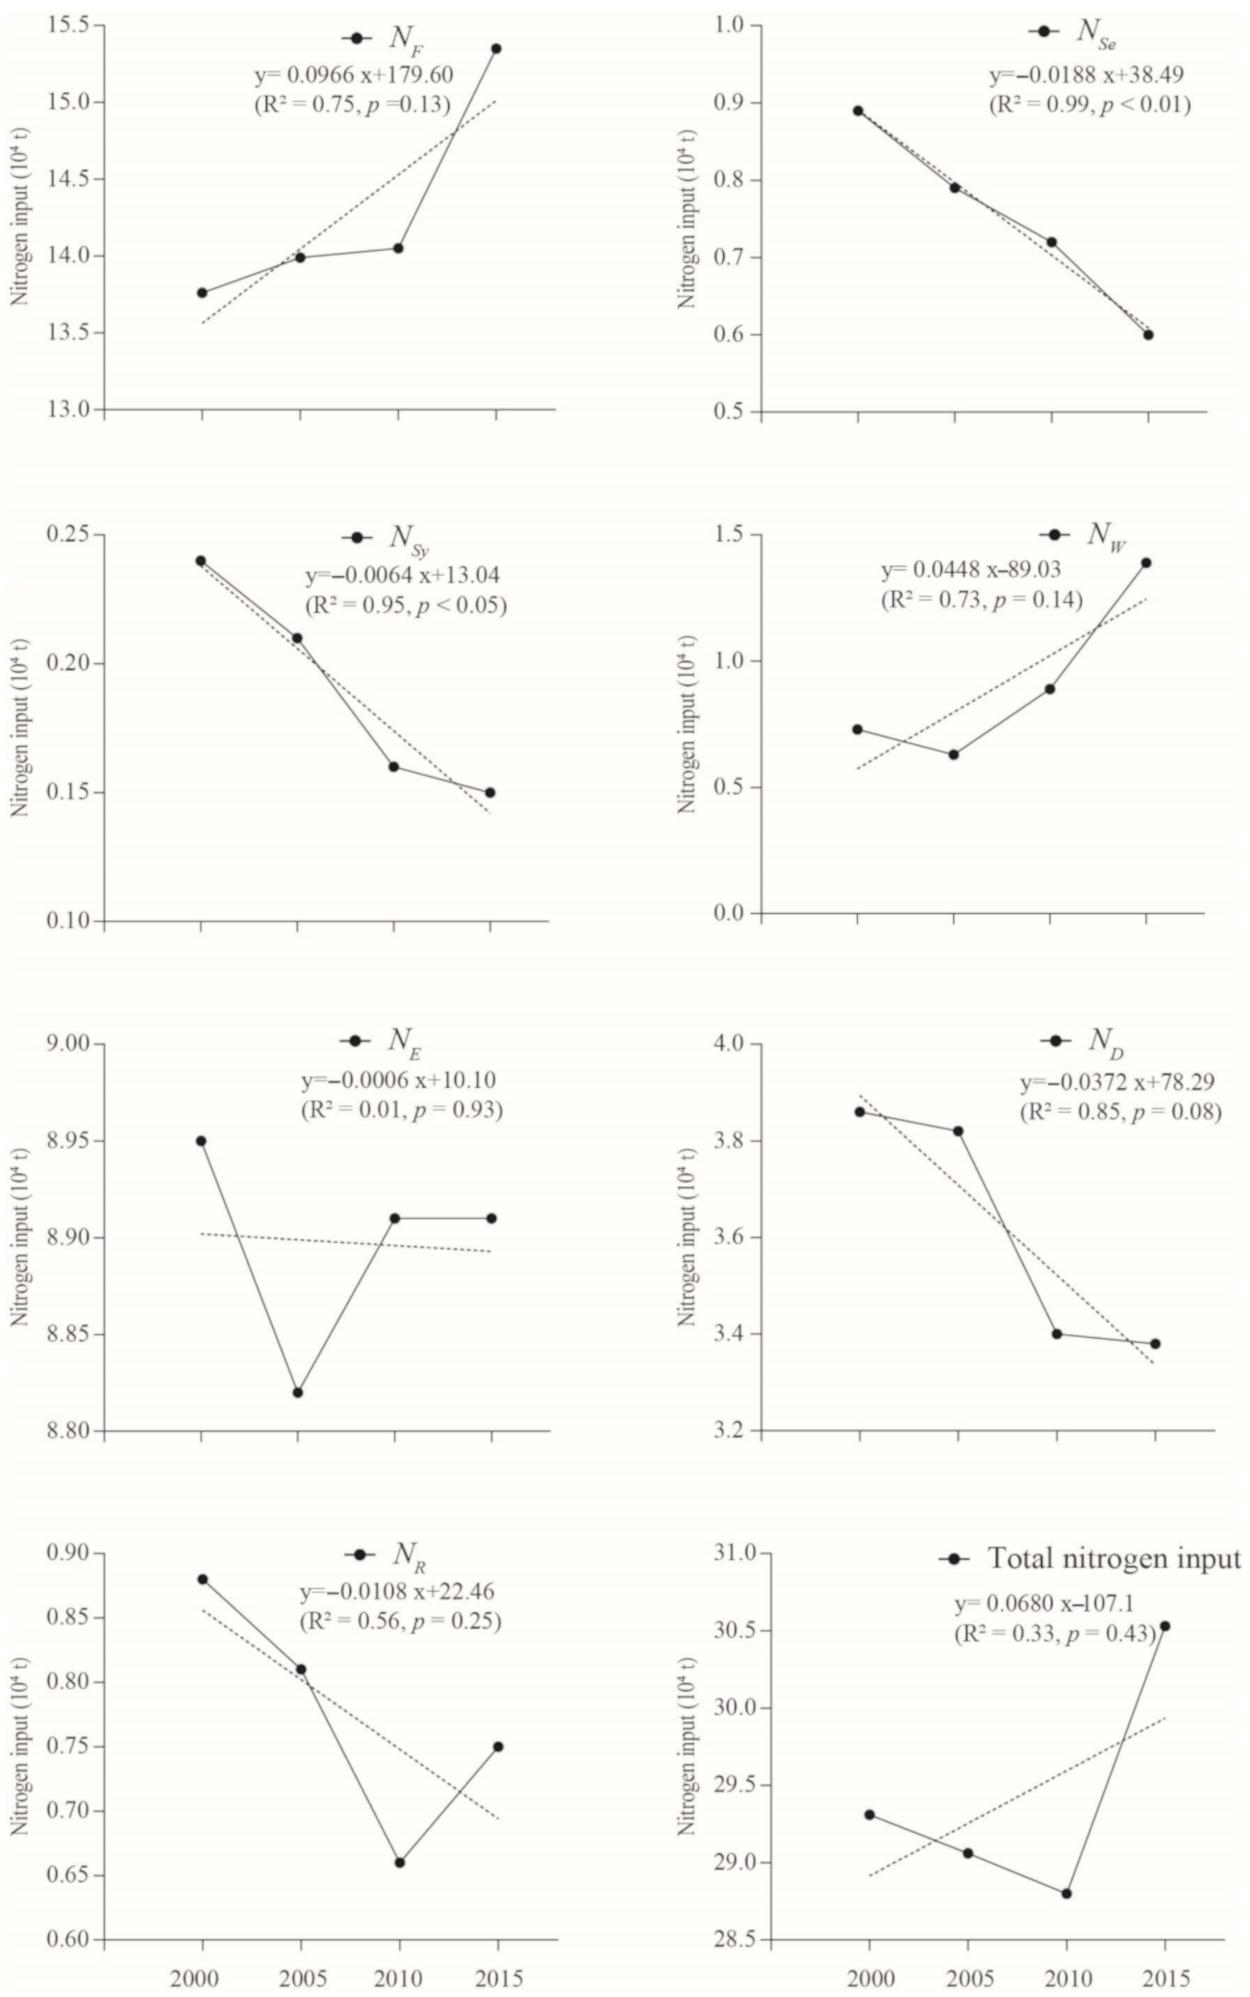
3.1. Input of Nitrogen and Its Temporal Dynamics

The nitrogen input in the past four different periods in the coastal Eastern Guangdong was calculated according to the above method. The results are as follows.
According to Figure 2, between 2000 and 2015, the total input nitrogen in coastal Eastern Guangdong showed a certain fluctuation. The total input nitrogen is between 28.80 × 10⁴ t and 30.53 × 10⁴ t. A downward trend from 2000 to 2010 was identified, which was caused by the decrease of NR and ND. The decrease of ND was due to the decrease of precipitation. The decrease of rice yield from 1.74 × 10⁶ t in 2000 to 0.99 × 10⁶ t in 2010 was the main reason for the decrease of NR. The total nitrogen input showed an upward trend in 2010–2015 due to the growing NF and NW. Despite the decrease of cultivated land area, more chemical fertilizer was adopted to ensure the yield of crops, resulting in the increase of NF. The promotion of industrialization led to a great increase of industrial sewage, and the NW increased correspondingly. From the perspective of contribution of different nitrogen input sources to the total input nitrogen, the rank from the largest to the lowest source is as follows, Fertilizer Nitrogen, Human and Livestock Excreta Nitrogen, Atmospheric Wet Deposition Nitrogen, Farmland Symbiotic Nitrogen Fixation, Wastewater Discharge Nitrogen, Crop Residue Nitrogen and Farmland Self-Nitrogen Fixation, Farmland Symbiotic Nitrogen Fixation, which is similar to other scholars’ research on the contribution of nitrogen input sources in different regions [5,7,8,21,26,27]. The Fertilizer Nitrogen, Human and Livestock Excreta Nitrogen, and Atmospheric Wet Deposition Nitrogen accounted for the top three sources of nitrogen input, which is inseparable from the socio-economic conditions such as the agricultural, population, and industrial development of the coastal Eastern Guangdong.
(1) Fertilizer Nitrogen is the first nitrogen source of nitrogen input in coastal Eastern Guangdong, showing a rising trend. From 2000 to 2015, the area of cultivated land in coastal Eastern Guangdong decreased year by year, but the amount of chemical fertilizer applied increased steadily. The total amount of nitrogen fertilizer application and the amount of compound fertilizer applied increased from 14.84 × 10⁴ t in 2000 to 17.58 × 10⁴ t in 2015, which reflected the high intensity of agriculture in the region and the long-term “high fertilization and high output” concept in rural areas of China.
(2) Human and Livestock Excreta Nitrogen is the second largest nitrogen source in the region. Coastal Eastern Guangdong is one of the most densely populated areas in China. The total resident population in the coastal areas of Eastern Guangdong is relatively large, reaching 14.25 million people in 2015. The increasing population stimulated the development of local dairy industry and animal husbandry, resulting in a large amount of nitrogen from this source.
(3) Atmospheric Wet Deposition is one of the most important sources of nitrogen input in coastal Eastern Guangdong. With the accelerated development of industrialization and urbanization, ammonia nitrogen volatilization, fossil fuel combustion, and denitrifying nitrogen in water were released into the atmosphere, re-sedimented into land and water in the form of precipitation, caused the increase of nitrogen input to the site.
The amount of nitrogen discharged from wastewater showed a clear upward trend, from 0.73 × 10⁴ t in 2000 to 1.39 × 10⁴ t in 2015. The growth rate is closely related to the rapid development of local industrialization and urbanization, as well as the non-point pollution of the fertilized agricultural land. The symbiotic nitrogen fixation in farmland showed a significant downward trend, which was connected to the change of peanut (oil crop) and soybean planting area. In the past 15 years, with the further development of urbanization, the area of cultivated land in the coastal Eastern Guangdong has gradually decreased, and the planting area of peanuts and soybeans has also decreased correspondingly, from 16,565 ha, 4753 ha in 2000 to 10,366 ha, 3678 ha in 2015, respectively, resulting in a reduction in symbiotic nitrogen fixation in the field.

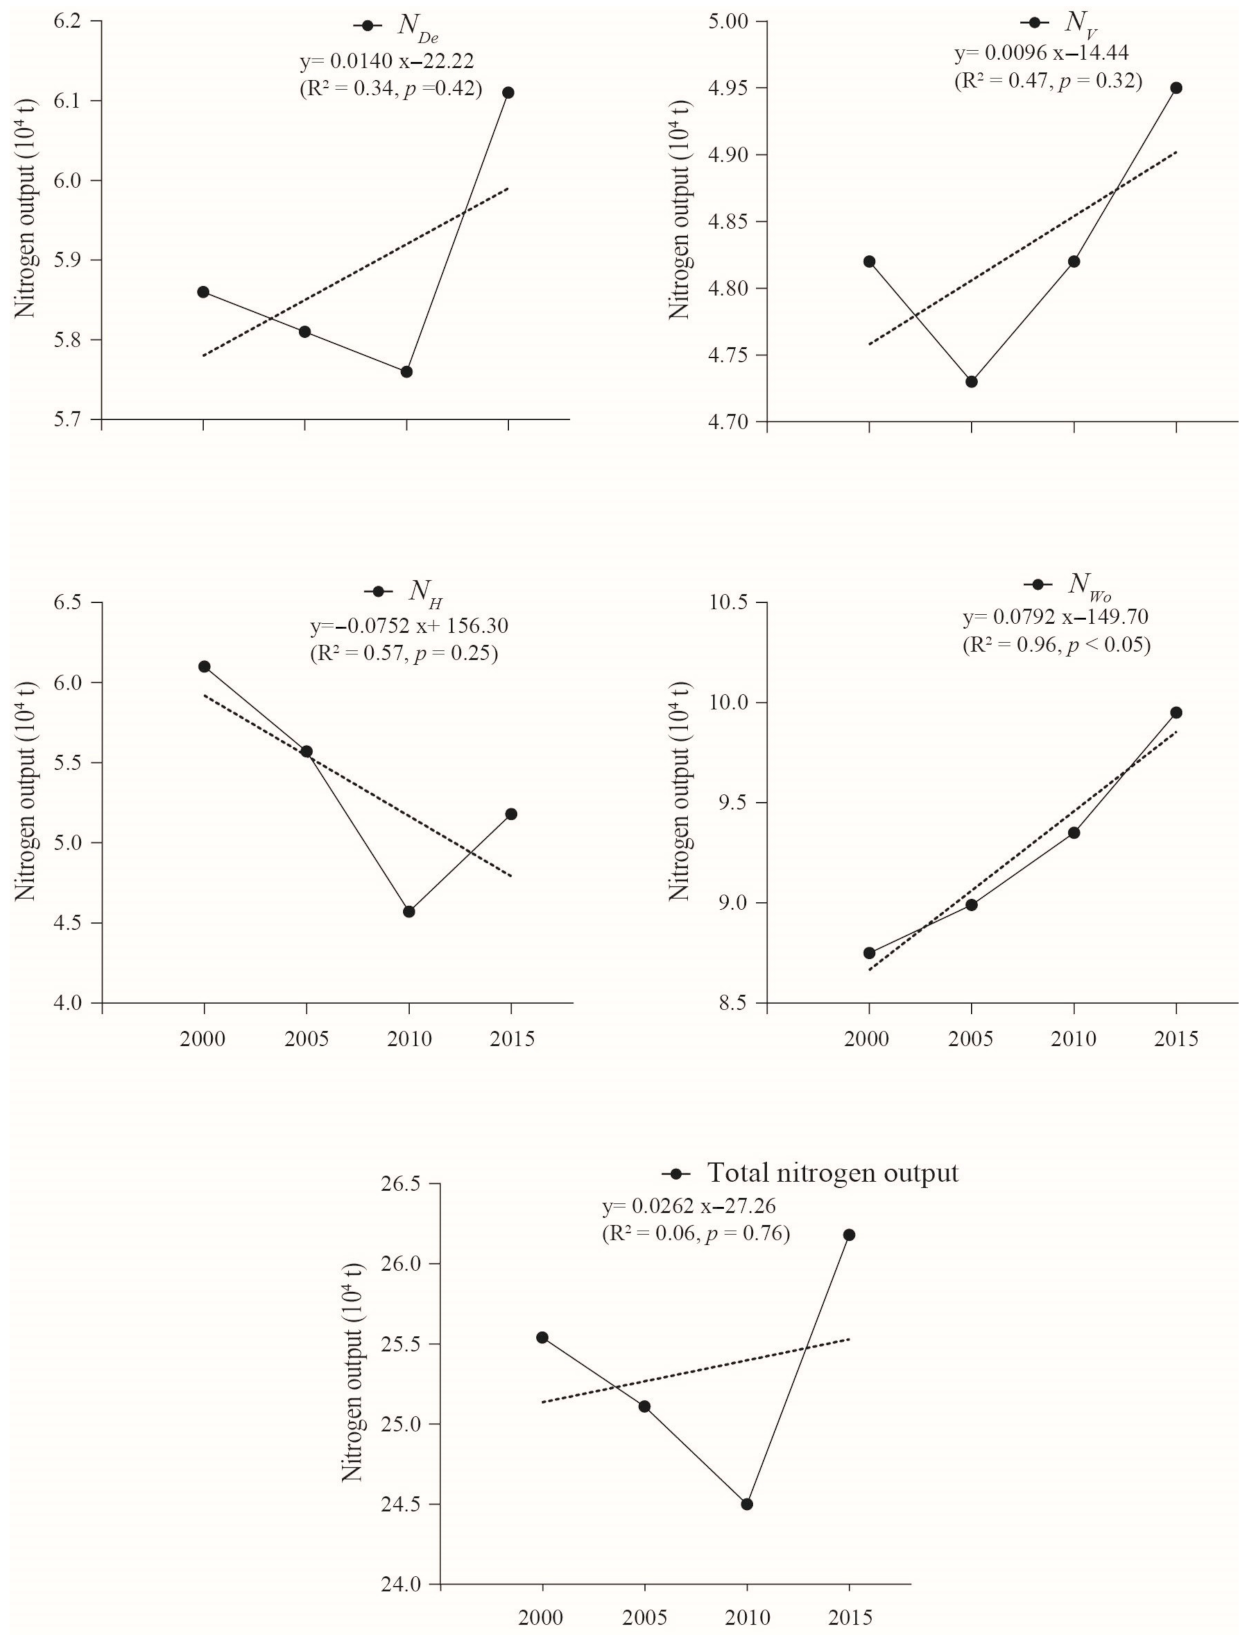
3.2. Nitrogen Output and Its Dynamics

According to the calculation based on 2000, 2005, 2010, and 2015 data in coastal Eastern Guangdong, the nitrogen output in the past four different periods in coastal Eastern Guangdong was calculated according to the above method. The results are as follows (Figure 3).
According to Figure 3, the total output nitrogen of the coastal Eastern Guangdong varied between 24.50 × 10⁴– 26.18 × 10⁴ t. The decrease of total nitrogen output from 2000 to 2010 was mainly caused by the decrease of NH, especially the decrease of rice yield. Rice yield decreased from 173.53 × 10⁴ t in 2000 to 99.30 × 10⁴ t in 2010. The total output of nitrogen showed an upward trend from 2010 to 2015, mainly caused by NH and NDe. During 2000–2015, the increase of nitrogen output led to a higher NDe. Meanwhile, due to the development of urbanization, the demand for vegetables increased, leading to the increase of vegetable output from 362.79 × 10⁴ t in 2010 to 446.25 × 10⁴ t in 2015, which cause the increase in NH. From the contribution rate of different nitrogen output sources, the Water Output Nitrogen was the main contributor, accounting for around 1/3 of the nitrogen output. The Denitrifying Nitrogen and Crop Harvest Taken Nitrogen made similar contribution to the nitrogen output, while the Volatile Nitrogen was the weakest contributor. The coastal Eastern Guangdong lies in the subtropical monsoon climate zone, with large annual precipitation, favorable of the nitrogen output via bleaching and eluviation of the cultivated land. As a result, a large amount of nitrogen lost through runoff (surface runoff and underground runoff) and injected into the ocean. The amount of Water Output Nitrogen shows an upward trend among various output nitrogen sources in coastal Eastern Guangdong, which may cause water pollution and even eutrophication.

3.3. Nitrogen Budget of the Coastal Eastern Guangdong

It is necessary to analyze the change of nitrogen surplus for the environmental effects caused by nitrogen in the region. According to the calculation of nitrogen surplus of coastal Eastern Guangdong (Table 6), the total nitrogen surplus in this area increased from 3.77 × 10⁴ t in 2000 to 4.35 × 10⁴ t in 2015. The total nitrogen surplus showed an upward trend, but the increase ratio of the total nitrogen surplus began to slow down after 2010. However, due to the continuous increase of the total nitrogen surplus, the potential nitrogen pollution in this region showed an up-ward trend.

4. Discussion

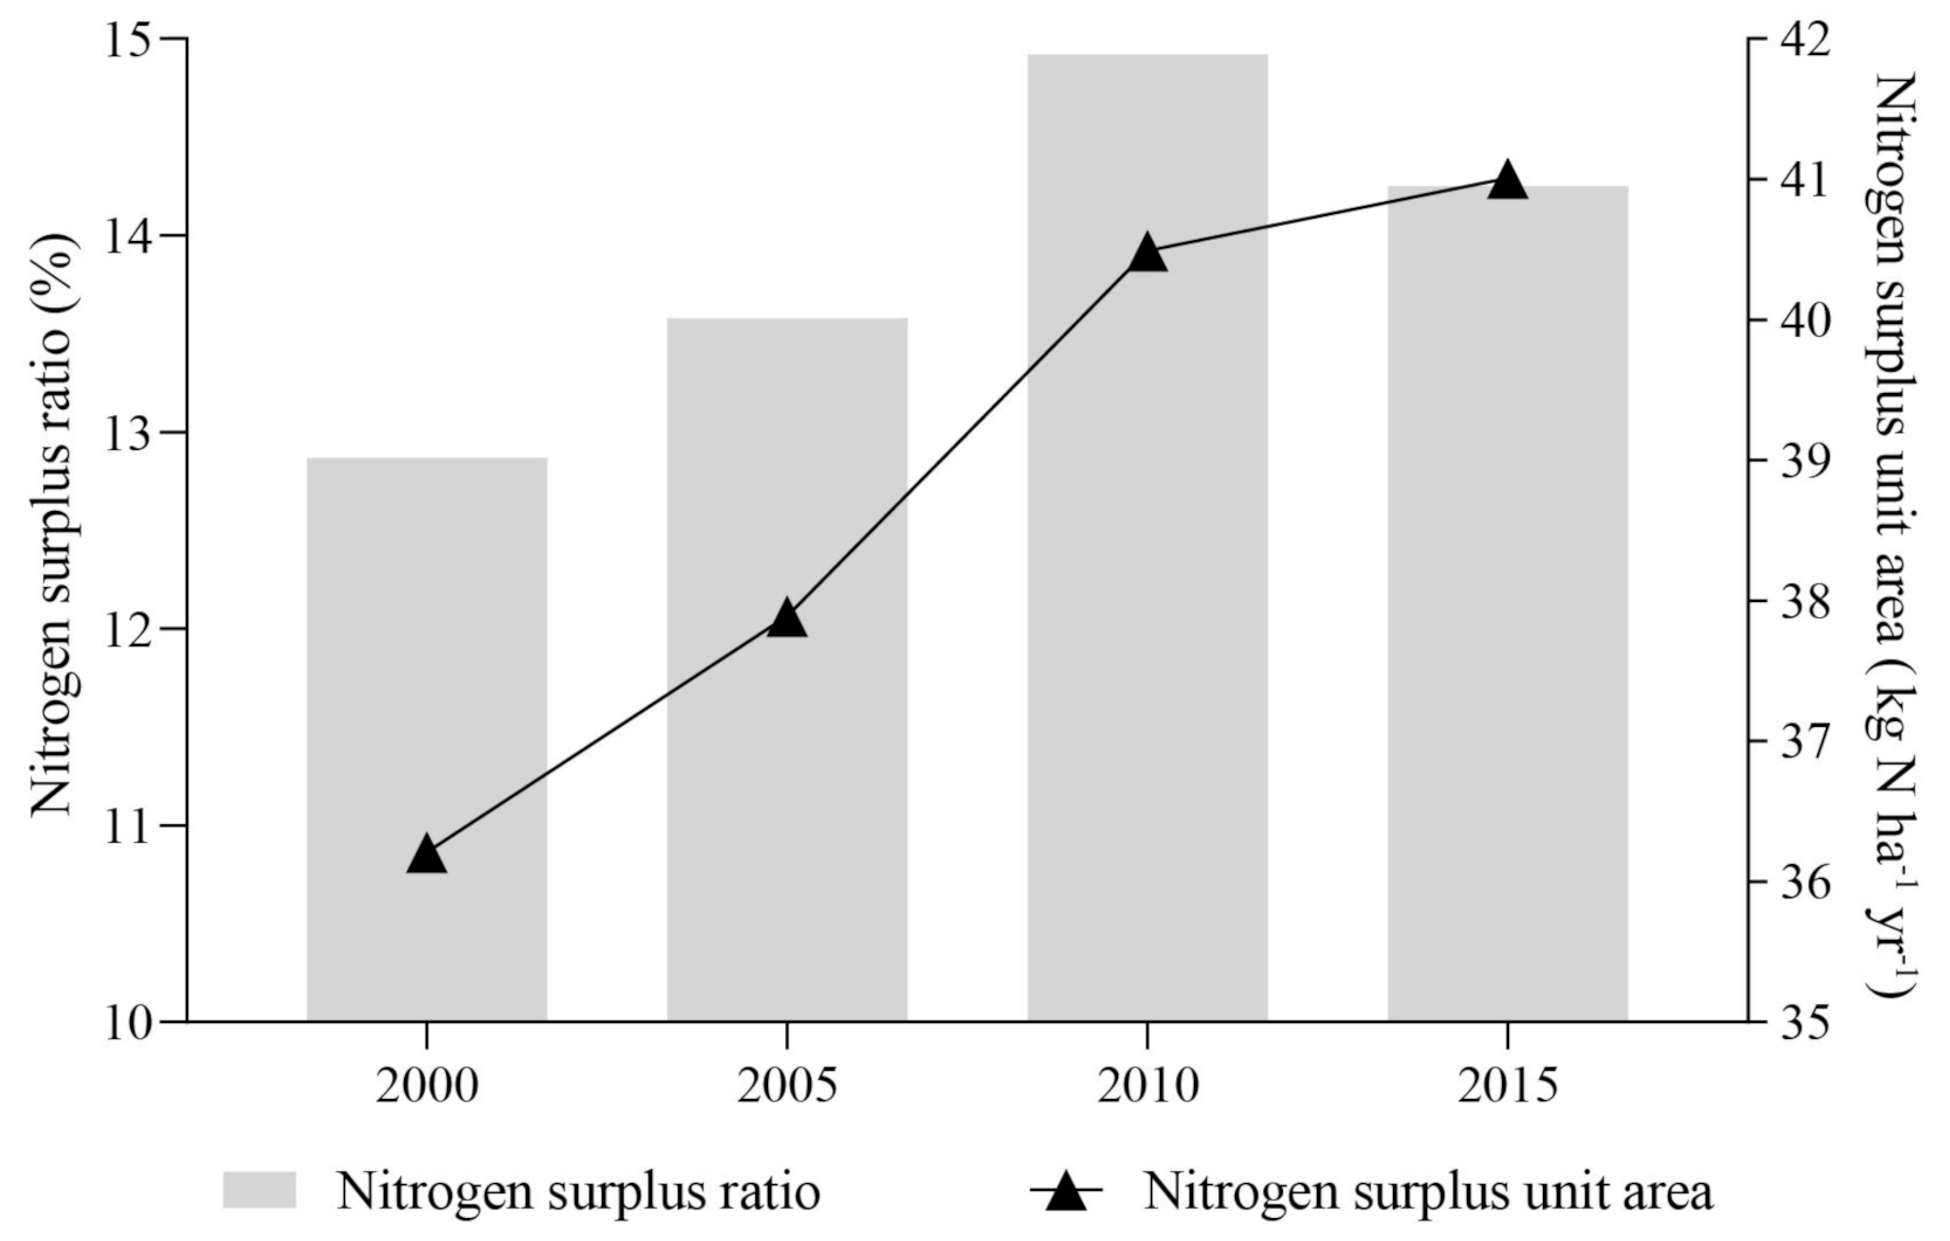
4.1. Nitrogen Surplus Ratio and Unit Area Surplus

Nitrogen surplus ratio is essential for evaluating the impact of nitrogen on the environment in a region. It refers to the ratio of nitrogen surplus to the total nitrogen input, and measures how much of the input nitrogen element remains on the surface. The nitrogen surplus per unit area is an important factor to measure the intensity and speed of nitrogen surplus in a region. The nitrogen surplus ratio and the nitrogen surplus per unit area in the coastal Eastern Guangdong is shown in Figure 4.
About 12.87%–14.92% of the nitrogen input through various forms will eventually remain in the region. The nitrogen surplus ratio showed a trend of first rising and then decreasing, while the nitrogen surplus unit area showed an obvious upward trend, increasing from 36.21 kg N ha−1 yr−1 in 2000 to 41.01 kg N ha−1 yr−1 in 2015. Considering that the input of nitrogen is mainly related to agricultural activities, the input of fertilizer nitrogen is increasing in the research period. The output of nitrogen is mainly through water body and was growing in the corresponding period. This shows that the interference of human activities continuously intensify the nitrogen flux of the study region.

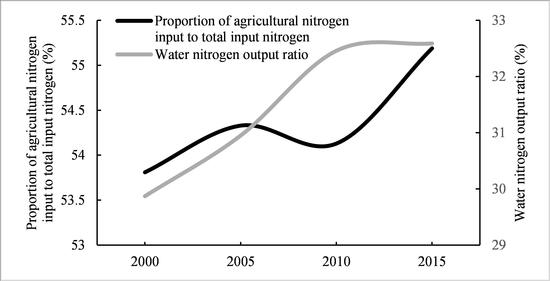
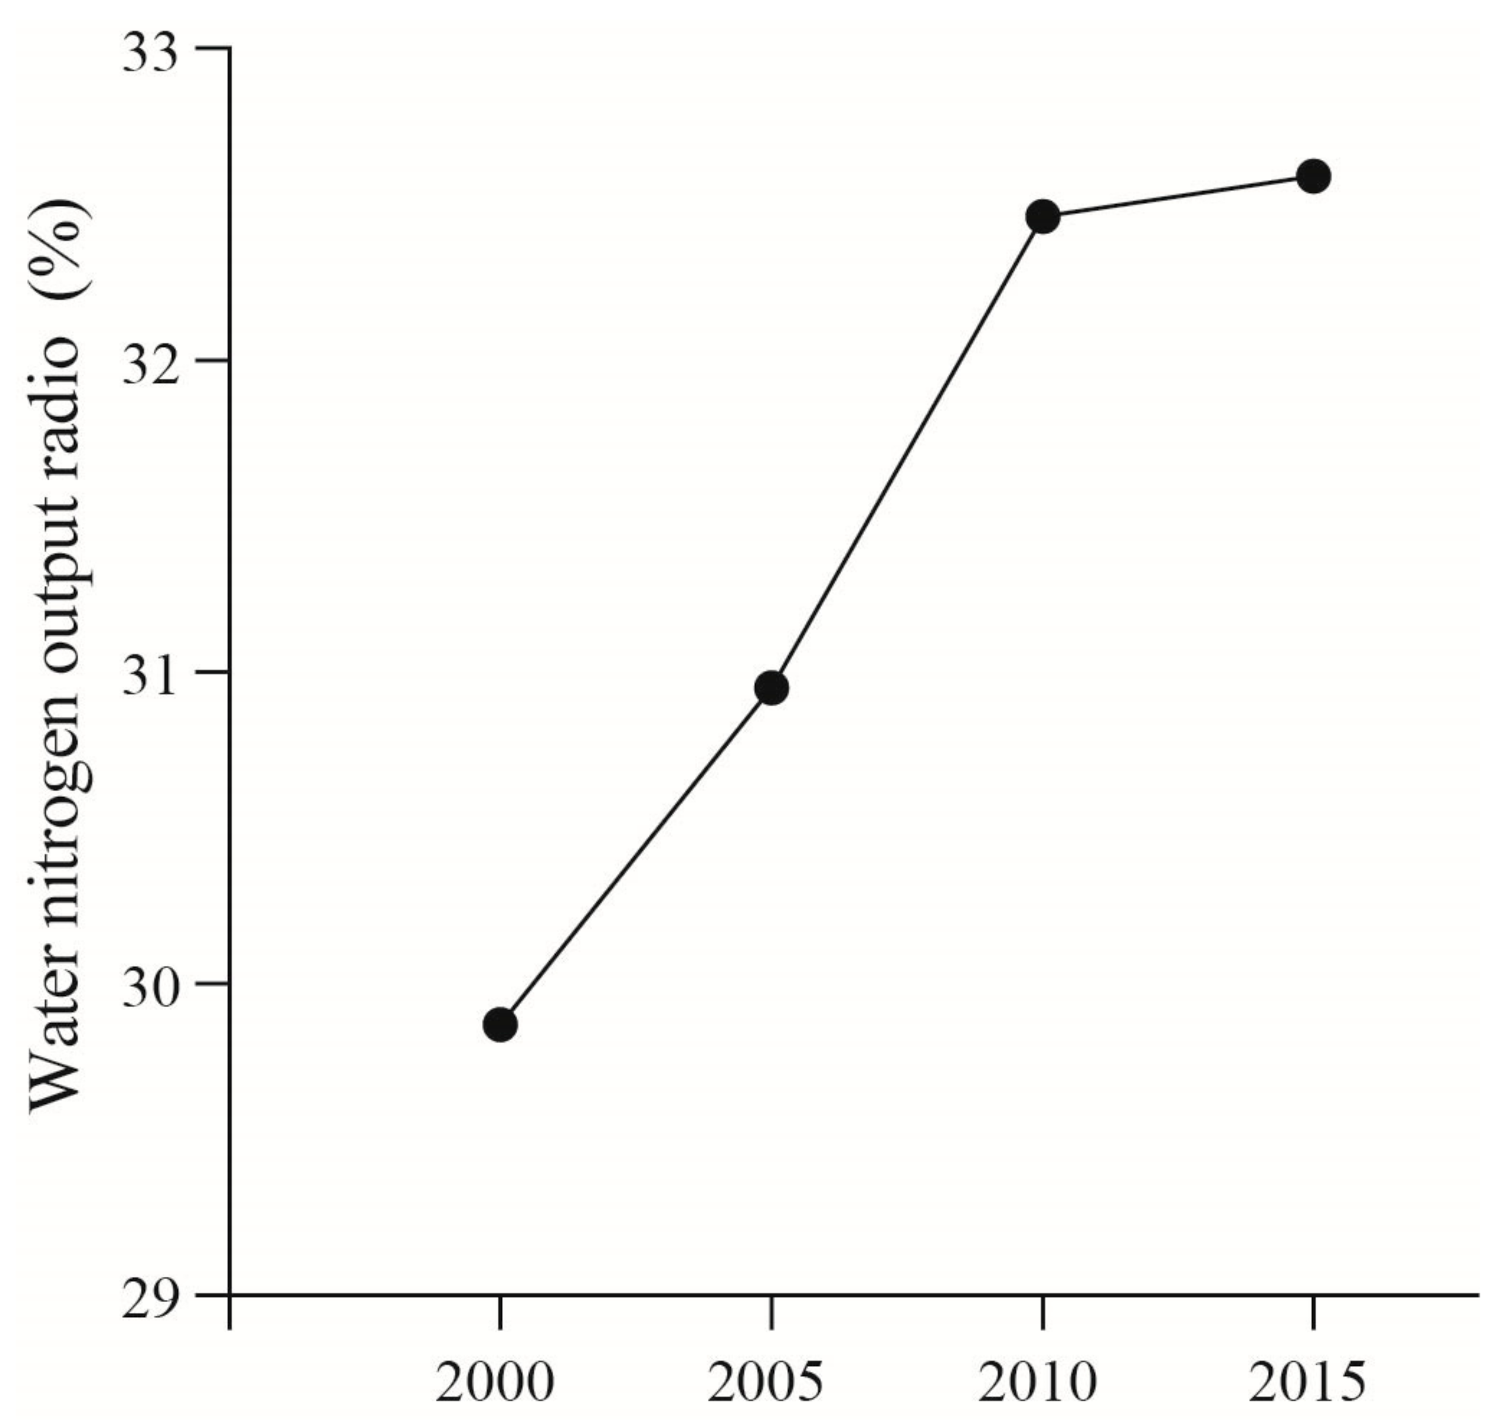
4.2. Water Output Nitrogen

The nitrogen output from the water body is the main method of nitrogen output. The nitrogen discharged from agriculture, industry, humans, and livestock is absorbed into the water body in the form of leaching and runoff, and then exported into the sea. From 2000 to 2015, around one third of the nitrogen was lost through the water body in coastal Eastern Guangdong. The water nitrogen output rate of coastal Eastern Guangdong increased from 29.87% in 2000 to 32.59% in 2015 (Figure 5), with an average value of 31.47%. The proportion obtained is similar to the adjacent regions, such as 28.28% in Zhanjiang Bay area [21], 38.61% in Beijiang River Basin [27], and 26.95% in Pearl River Delta [5], and the nitrogen output from water body is also the largest nitrogen output source in these regions.
Water output nitrogen ratio refers to the ratio between the amount of nitrogen lost through water and the total amount of nitrogen input. According to the existing reports, the nitrogen concentration in many catchments increased rapidly after the 1990s (nitrogen concentration was less than 1 mg/L before 1980s, but more than 15 mg/L after 1990s), and the nitrogen discharged into fresh water for man-made reasons has exceeded the safety threshold (5.2 ± 0.7 megatonnes of nitrogen per year) by 2.7 times [28]. The water nitrogen output ratio in coastal Eastern Guangdong continues to rise, due to the increase of population and the development of industry and agriculture in the region. The population density of the region increased from 1183.82 per/km2 in 2000 to 1343.17 per/km2 in 2015, the total output value of agriculture, forestry, animal husbandry, and fishery increased from 281.66 × 10⁸ Yuan in 2000 to 547.93 × 10⁸ Yuan in 2015, and the total industrial output value increased from 554.68 × 10⁸ Yuan in 2000 to 9097.72 × 108 Yuan in 2015.
Based on the data of “Guangdong water resources bulletin” [29], the unqualified ratio of river water quality, represented by the ratio of river length with unqualified water quality to the evaluated river length, serves as an important indicator to measure the river environmental quality in a region.
The unqualified ratio of river water quality in the coastal area of Eastern Guangdong is increasing (Figure 6), caused by the increase of nitrogen concentration of the water body. Recently, studies have reported that the total nitrogen load of the Hanjiang River showed an upward trend from 1990 to 2010, and the water quality was on a deterioration trend [30]. Coastal rivers connect the terrestrial system with the coastal system directly, and correspondingly deliver the land-based pollution to the offshore region. The increasing nitrogen output from water may cause algal blooms and eutrophication. According to existing reports [31], after 2000, the coastal areas of Eastern Guangdong were prone to Phaeocystis blooms. The outbreak of Phaeocystis blooms required an eutrophic environment, and dissolved inorganic nitrogen (DIN) was the key factor for its occurrence [32]. Therefore, the continuous increase of nitrogen output from water has brought great environmental pressure to the coastal areas of Eastern Guangdong since 2000.

4.3. Agricultural Nitrogen Input

Agricultural nitrogen input includes NF, NSe, NSy, and NR. Due to various conditions, China’s agricultural production strongly depends on nitrogen fertilizer [33]. The agricultural nitrogen input in coastal Eastern Guangdong accounts for more than half of the total nitrogen input, which is similar to the results of other regions using similar estimation methods, as shown in Table 7. Zhou et al. [34] pointed out that the main source of agricultural nitrogen footprint is the application of chemical fertilizer. Zhang et al. [35] revealed that China is the largest producer and consumer of nitrogen fertilizer in the world, and nitrogen input accounts for 72% of China’s terrestrial ecosystem nitrogen input. The above results are similar to those of this study. The NF in coastal Eastern Guangdong is the largest nitrogen source of agricultural input, and also the largest nitrogen input source in the region.
It can be seen from Table 7 that NF is the largest nitrogen input source in all regions, and its value has a great influence on the total nitrogen input. Gao et al. [36] pointed out that large-scale application of chemical fertilizer is the main means to make up for the lack of cultivated land resources. Coastal Eastern Guangdong compensates for the lack of arable land by intensive farming and large-scale application of nitrogen fertilizer, trying to excavate the highest productive efficiency of the insufficient land resource. On the other hand, in the Pearl River Delta, the expansive economy shift, from agriculture to industry resulted in the rapid decline of agricultural nitrogen. In comparison, the industrialization of coastal Eastern Guangdong is relatively slow, and agriculture still accounts for a large proportion of the Gross Domestic Product (GDP). Higher nitrogen pollution risk is confronted by the coastal Eastern Guangdong region, suggesting urgent need for agricultural control policies and industrial upgrading.

4.4. Regional Comparison of Nitrogen Load and Nitrogen Flux on Land

Nitrogen load is the total amount of input nitrogen per unit land area, reflecting the input intensity of nitrogen in different regions [5]. Nitrogen flux on land means the sum of NF and NE received per unit land area in a region [7].
Across the world, the nitrogen load and nitrogen flux on land in economically developed regions (such as North Sea, Baltic Sea, Mississippi River Basin, etc.) are higher than those in economically undeveloped regions (such as Amazon Basin, Caribbean Islands and Central America, etc.). In China, the nitrogen load and nitrogen flux on land are significantly higher than those of other countries; across China, the nitrogen load and nitrogen flux on land in the east of China are significantly higher than those in the west. The reasons for the above phenomena are related to the difference of population density and human activity intensity.
The nitrogen load of coastal Eastern Guangdong is higher than the average level of most foreign regions, and most of the domestic regions. The nitrogen flux on land of the coastal Eastern Guangdong are similar to those of the Yangtze River Delta and Zhanjiang Bay, higher than those of the United States, Canada, the northwest coast of Europe, the North Atlantic coast, and even most of the economically developed and densely populated areas in China. The higher nitrogen load and nitrogen flux on land in coastal Eastern Guangdong indicate the strong nitrogen enrichment impact caused by the combination of high-intensity agricultural activity and growing industry (Table 8).

5. Conclusions and Outlook

Based on the analysis of the overall situation and changes of nitrogen budget in the past 15 years in coastal Eastern Guangdong, the input and output of nitrogen showed fluctuation, while the nitrogen surplus showed steady upward trend. Among the different input and output sources, fertilizer nitrogen is the main input and water nitrogen is the main output. The nitrogen load and nitrogen flux on land of the three cities in coastal Eastern Guangdong are higher than those of most economically developed and densely populated areas in Eastern China.
The nitrogen surplus and its environmental risk has increased gradually over the past 15 years, due to the continual nitrogen surplus accumulation. Along with the development of environmental protection and other related policies, the increment of surplus has decreased since 2010. However, water nitrogen output steadily increased, leading to the deterioration of water quality during the study period. How to achieve the balance of nitrogen input and output, to improve the hydro-ecological environment via more effective management and environment friendly technology, has become an emergent threat to coastal Eastern Guangdong.

Supplementary Materials

The following are available online at https://www.mdpi.com/article/10.3390/hydrology8020081/s1, Table S1: Additional basic statistics data of the three cities in Eastern Guangdong.

Author Contributions

Conceptualization, Y.S. and S.S.; methodology, Y.S. and L.X.; software, Z.H.; formal analysis, Y.S., S.S. and L.X.; resources, Y.S.; data curation, Y.S. and L.X.; writing—original draft preparation, Y.S.; writing—review and editing, Y.S., S.S. and L.X.; visualization, Y.S. and S.S.; supervision, S.S. and L.X.; funding acquisition, S.S. All authors have read and agreed to the published version of the manuscript.

Funding

This research was funded by the Natural Science Foundation of Guangdong Province, China (2020A1515011065, 2016A030313831), the Guangdong Province Universities and Colleges Pearl River Scholar Funded Scheme (2019), the Key Special Project for Introduced Talents Team of Southern Marine Science and Engineering Guangdong Laboratory (Guangzhou) (GML2019ZD0301), the NSFC-Guangdong Joint Fund key project (U1901219), and the Science and Technology Program of Guangzhou, China (202102080320).

Conflicts of Interest

The authors declare no conflict of interest.

References

  1. Wu, G.H.; Wang, N.A.; Hu, S.X.; Tian, L.S.; Zhang, J.M. Physical Geography, 4th ed.; Higher Education Press: Beijing, China, 2008; pp. 421–423. [Google Scholar]
  2. Fang, H.; Mo, J.M. Reactive nitrogen increasing: A threat to our environment. Ecol. Environ. Sci. 2006, 15, 164–168. [Google Scholar] [CrossRef]
  3. Shen, Z.L.; Liu, Q.; Zhang, S.M.; Miao, H.; Zhang, P. A Nitrogen budget of the Changjiang River Catchment. Ambio 2003, 32, 65–69. [Google Scholar] [CrossRef] [PubMed]
  4. Wu, Y.L.; Xu, H.; Yang, G.J.; Zhu, G.W.; Qin, B.Q. Progress in nitrogen pollution research in Lake Taihu. J. Lake Sci. 2014, 26, 19–28. [Google Scholar] [CrossRef] [Green Version]
  5. Xie, L.C.; Chen, J.Y. Nitrogen Budgets of the Pearl River Delta and Its Regional Differences during the Past Decade. J. Nat. Resour. 2014, 29, 237–248. [Google Scholar] [CrossRef]
  6. Xu, X.G.; Peng, H.F.; Xu, Q.Z. Land Resource Conflicts and Coordination in Fast Urbanized Coastal Zone: A Case Study of the Shandong Peninsula. Beijing Da Xue Xue Bao Zi Ran Ke Xue Bao 2006, 42, 527–533. [Google Scholar] [CrossRef]
  7. Howarth, R.W.; Billen, G.; Swaney, D.; Townsend, A.; Jaworski, N.; Lajtha, K.; Downing, J.A.; Elmgren, R.; Caraco, N.; Jordan, T.; et al. Regional nitrogen budgets and riverine N & P fluxes for the drainages to the North Atlantic Ocean: Natural and human influences. Biogeochemistry 1996, 35, 75–139. [Google Scholar] [CrossRef]
  8. Deng, M.H.; Xie, Y.X.; Xiong, Z.Q.; Xing, G.X.; Yan, X.Y. Nitrogen budgets of the Yangtze delta region and their effect on the environment. Acta Sci. Circumst. 2007, 27, 1709–1716. [Google Scholar] [CrossRef]
  9. Xiao, T.; Qi, Y.X.; Wang, J.B. Nitrogen budget estimation based on precipitation and runoff in the source of Yangtze River. Acta Ecol. Sin. 2010, 30, 5404–5412. [Google Scholar]
  10. Schilling, K.E.; Jones, C.S.; Wolter, C.F.; Liang, X.; Zhang, Y.-K.; Seeman, A.; Isenhart, T.; Schnoebelen, D.; Skopec, M. Variability of nitrate-nitrogen load estimation results will make quantifying load reduction strategies difficult in Iowa. J. Soil Water Conserv. 2017, 72, 317–325. [Google Scholar] [CrossRef]
  11. Filoso, S.; Martinelli, L.A.; Howarth, R.W.; Boyer, E.W.; Dentener, F. Human activities changing the nitrogen cycle in Brazil. Biogeochemistry 2006, 79, 61–89. [Google Scholar] [CrossRef]
  12. Vries, W.; Leip, A.; Reinds, G.J.; Kros, J.; Lesschen, J.; Bouwman, A. Comparison of land nitrogen budgets for European agriculture by various modeling approaches. Environ. Pollut. 2011, 159, 3254–3268. [Google Scholar] [CrossRef]
  13. Boyer, E.W.; Goodale, C.L.; Jaworski, N.A.; Howarth, R.W. Anthropogenic nitrogen sources and relationships to riverine nitrogen export in the northeastern USA. Biogeochemistry 2002, 57-58, 137–169. [Google Scholar] [CrossRef]
  14. Piske, J.; Peterson, E.W. The role of corn and soybean cultivation on nitrate export from Midwestern US agricultural watershed. Environ. Earth Sci. 2020, 79, 208. [Google Scholar] [CrossRef]
  15. McIsaac, G.F.; David, M.B.; Gertner, G.Z. Illinois River Nitrate-Nitrogen Concentrations and Loads: Long-term Variation and Association with Watershed Nitrogen Inputs. J. Environ. Qual. 2016, 45, 1268–1275. [Google Scholar] [CrossRef] [Green Version]
  16. Cherry, K.A.; Shepherd, M.; Withers, P.J.A.; Mooney, S. Assessing the effectiveness of actions to mitigate nutrient loss from agriculture: A review of methods. Sci. Total Environ. 2008, 406, 1–23. [Google Scholar] [CrossRef]
  17. Panagopoulos, Y.; Makropoulos, C.; Mimikou, M. Decision support for diffuse pollution management. Environ. Model. Softw. 2012, 30, 57–70. [Google Scholar] [CrossRef]
  18. Panagopoulos, Y.; Makropoulos, C.; Mimikou, M. Multi-objective optimization for diffuse pollution control at zero cost. Soil Use Manag. 2013, 29, 83–93. [Google Scholar] [CrossRef]
  19. Galloway, J.N.; Howarth, R.W.; Michaels, A.E.; Nixon, S.W.; Prospero, J.M.; Dentener, F.J. Nitrogen and phosphorus budgets of the North Atlantic Ocean and its watershed. Biogeochemistry 1996, 35, 3–25. [Google Scholar] [CrossRef]
  20. Xing, G.X.; Zhu, Z.L. Regional nitrogen budgets for China and its major watersheds. Biogeochemistry 2002, 57-58, 405–427. [Google Scholar] [CrossRef]
  21. Meng, Y.F.; Chen, F.J.; Xiao, B.; Zeng, Z. Nitrogen Budgets of the Zhanjiang Bay Area. J. Guangdong Ocean. Univ. 2015, 35, 76–81. [Google Scholar]
  22. Zhu, Z.L. Nitrogen balance and cycling in agroecosystems of China. In Nitrogen in Soils of China, 1st ed.; Zhu, Z.L., Wen, Q.X., Freney, J.R., Eds.; Kluwer Academic Publishers: Dordrecht, The Netherlands, 1997; Volume 74, pp. 323–330. [Google Scholar] [CrossRef]
  23. Yan, W.J.; Yin, C.Q.; Zhang, S. Nutrient budgets and biogeochemistry in an experimental agricultural watershed in Southeastern China. Biogeochemistry 1999, 45, 1–19. [Google Scholar] [CrossRef] [Green Version]
  24. Xing, G.X.; Yan, X.Y. Direct nitrous oxide emissions from agricultural fields in China estimated by the revised 1996 IPPC guidelines for national greenhouse gases. Environ. Sci. Policy 1999, 2, 355–361. [Google Scholar] [CrossRef]
  25. Xing, G.X.; Zhu, Z.L. Analysis and estimation of nitrogen sources and sinks in China watershed. Acta Pedol. Sin. 2000, 37, 72–82. [Google Scholar]
  26. Galloway, J.N.; Cowling, E.B. Reactive Nitrogen and The World: 200 Years of Change. Ambio 2002, 31, 64–71. [Google Scholar] [CrossRef]
  27. Chen, F.J.; Jia, G.D. Nitrogen Budgets of the Beijiang River Basin. Trop. Geogr. 2009, 29, 11–15. [Google Scholar]
  28. Yu, C.; Huang, X.; Chen, H.; Godfray, H.C.J.; Wright, J.S.; Hall, J.W.; Gong, P.; Ni, S.; Qiao, S.; Huang, G.; et al. Managing nitrogen to restore water quality in China. Nature 2019, 567, 516–520. [Google Scholar] [CrossRef]
  29. Water Resources Department of Guangdong Province. Guangdong Water Resources Bulletin. Available online: http://slt.gd.gov.cn/szygb/index.html (accessed on 9 April 2021).
  30. Zheng, Y.; Cheng, X.J.; Wang, Z.L.; Lai, C.G. Non-point source pollution in Hanjiang River Basin and its relation with landscape pattern. Water Resour. Prot. 2019, 35, 78–85. [Google Scholar] [CrossRef]
  31. Tian, Y.; Li, T.; Hu, S.M.; Xie, X.D.; Liu, S. Temporal and spatial characteristics of harmful algal blooms in Guangdong coastal area. Mar. Environ. Sci. 2020, 39, 1–8. [Google Scholar] [CrossRef]
  32. Xu, N.; Qi, Y.Z.; Chen, J.F.; Huang, W.J.; Lu, S.H.; Wang, Y. Analysis on the cause of Phaeocystis globose Scherffel red tide. Acta Sci. Circumst. 2003, 23, 113–118. [Google Scholar] [CrossRef]
  33. Wang, J.G.; Lin, B.; Li, B.G. Nitrogen Cycling and Management Strategies in Chinese Agriculture coastal area. Sci. Agric. Sin. 2016, 49, 503–517. [Google Scholar] [CrossRef]
  34. Zhou, T.; Wang, Y.P.; Wang, F.; Feng, Y.F. Analysis of the nitrogen footprint of agriculture in Guangdong. China Environ. Sci. 2014, 34, 2430–2438. [Google Scholar]
  35. Zhang, W.F.; Ma, L.; Huang, G.Q.; Wu, L.; Chen, X.P.; Zhang, F.S. The Development and Contribution of Nitrogenous Fertilizer in China and Challenges Faced by the Country. Sci. Agric. Sin. 2013, 46, 3161–3171. [Google Scholar] [CrossRef]
  36. Gao, C.; Zhang, T.L.; Sun, B.; Wu, W.D.; Lu, R.K. Nitrogen Management in Chinese Agriculture since Early 1980s: Status and Problems. J. Nanjing Univ. 2002, 38, 716–721. [Google Scholar]
  37. Guo, J.S.; Liu, J.; Fang, F.; Sun, J.Y.; Sun, Z.W.; Du, L.G. Input-output budgets for nitrogen in typical purple soil sloping ploughland in Three Gorges areas. J. Chongqing Univ. 2011, 34, 141–147. [Google Scholar]
  38. Meng, Y.F.; Chen, F.J.; Zeng, Z. Nitrogen Budget Evolution in Zhanjiang Municipal District and Its Environmental Effect during 2002–2013. Trop. Geogr. 2015, 35, 777–784. [Google Scholar] [CrossRef]
  39. Yan, W.J.; Zhang, S.; Wang, J.H. Nitrogen Biogeochemical Cycling in the Changjiang Drainage Basin and its Effect on Changjiang River Dissolved Inorganic Nitrogen Temporal Trend for the Period 1968–1997. Acta Geogr. Sin. 2001, 56, 504–513. [Google Scholar] [CrossRef]
  40. Han, Z.; Wang, M.H.; Zhou, J.G.; Wang, Y.; Shen, J.L.; Li, X.; Li, Y.Y.; Wu, J.S. N balance analysis and adjusting countermeasures of small watershed in subtropical hilly area. J. Agro-Environ. Sci. 2017, 36, 743–752. [Google Scholar] [CrossRef]
  41. Xing, G.X.; Zhu, Z.L. The Environmental Consequences of Altered Nitrogen Cycling Resulting from Industrial Activity, Agricultural Production and Population Growth in China. Sci. World. J. 2001, 1, 70–80. [Google Scholar] [CrossRef] [Green Version]
Figure 1. Location of the coastal area of the Eastern Guangdong.
Hydrology 08 00081 g001
Figure 2. Nitrogen inputs of the coastal Eastern Guangdong in the past 15 years.
Hydrology 08 00081 g002
Figure 3. Nitrogen outputs of the coastal Eastern Guangdong in the past 15 years.
Hydrology 08 00081 g003
Figure 4. Nitrogen surplus ratio and nitrogen surplus unit area of the coastal Eastern Guangdong in the past 15 years.
Hydrology 08 00081 g004
Figure 5. Water nitrogen output ratio of the coastal Eastern Guangdong in the past 15 years.
Hydrology 08 00081 g005
Figure 6. Unqualified ratio of river water quality of the coastal Eastern Guangdong in 2006–2015.
Hydrology 08 00081 g006
Table 1. The natural condition of the three cities of Eastern Guangdong in 2015.
CityLongitude/LatitudeAreaAltitudeGDPResourcesPopulation
Shantou116°14′ E–117°19′ E
23°02′ N–23°38′ N
2199.04 km2Delta alluvial plain1.87 × 1011 Yuan Water, Marine, Wind, Mineral5.55 × 106 people
Chaozhou116°22′ E–117°11′ E
23°26′ N–24°14′ N
3145.93 km2Mountains, Hills0.91 × 1011 YuanWater, Marine,
Mineral
2.64 × 10⁶ people
Jieyang115°36′ E–116°37′ E
22°53′ N–23°46′ N
5265.38 km2Mountains, Hills, Plains1.89 × 1011 YuanBiological6.06 × 106 people
Note: Data in this table are from “Guangdong Statistical Yearbook”. GDP is gross domestic product, currency is RMB, currency unit is Yuan.
Table 2. Selected basic statistics data of the three cities in Eastern Guangdong.
CityYearP
(mm)
NF
(104 t)
CF
(104 t)
WWD
(108 t)
CA
(ha)
PD
(Per/km2)
Shantou20001426 2.95 0.33 2.06 56,977 2266.38
20051662 2.81 0.80 1.83 39,249 2395.59
20101369 2.66 1.38 2.61 35,283 2400.44
20151496 2.99 1.77 2.62 37,7902524.78
Chaozhou20001879 2.66 1.06 0.63 47,925 773.12
200517551.90 1.71 0.71 45,843 810.32
20101420 1.88 1.29 1.68 31,923 861.97
20151533 2.31 1.75 1.24 35,812839.33
Jieyang20002041 6.53 1.31 1.02 121,709 1001.16
20051988 6.86 1.53 1.45 121,665 1068.11
20101844 6.89 1.70 1.73 118,1171117.17
20151701 6.68 2.08 2.47 87,7181150.70
Coastal Eastern Guangdong20001871 12.142.703.71226,6111183.82
20051854 11.574.043.99206,7571254.23
20101620 11.434.376.02185,3231314.42
20151601 11.985.606.33161,3191343.17
Note: Data in this table are from “Guangdong Statistical Yearbook”, “Guangdong Rural Statistical Yearbook”, and weather station. The CA of 2010 is the data of 2008. Abbreviations: P, annual precipitation; NF, nitrogen fertilizer application; CF, compound fertilizer application; WWD, wastewater discharge; CA, agricultural acreage; PD, population density.
Table 3. Calculation method and index of nitrogen input.
ComponentData SourceFormulaReference
NFGuangdong Rural Statistical YearbookNitrogen fertilizer × 100% + Compound fertilizer × 60%[8,21]
NSeGuangdong Rural Statistical YearbookPaddy area × Paddy field nitrogen fixation parameters (45 kg N ha−1 yr−1) + Dry land area × Dryland nitrogen fixation parameters (15 kg N ha−1 yr−1)[22]
NSyGuangdong Rural Statistical YearbookPeanut acreage × Nitrogen fixation rate of peanut (112 kg N ha−1 yr−1) + Soybean planting area × Soybean nitrogen fixation rate (105 kg N ha−1 yr−1)[23]
NWGuangdong Statistical YearbookThe total amount of wastewater discharged by each city in the Coastal Eastern Guangdong as a percentage of the amount of wastewater discharged from Guangdong Province × Ammonia nitrogen emission from wastewater in Guangdong Province[5]
NEGuangdong Rural Statistical YearbookYear-end inventory of poultry × Poultry conversion parameters (0.6 kg N yr−1) + Resident population × Human conversion parameters (4 kg N yr−1) + Year-end inventory of goat × Goat conversion parameters (7 kg N yr−1) + Year-end inventory of pigs × Pig conversion parameters (8 kg N yr−1) + Year-end inventory of cattle × Cattle conversion parameters (42 kg N yr−1)[8,24,25]
NDGuangdong Statistical Yearbook
Weather station
Precipitation × National Land area × Average nitrogen concentration (About 1.98 mg/L)[5,20,21]
NRGuangdong Rural Statistical YearbookCrop yield × (Stem/seed quality ratio) × Nitrogen content of Crop stems and leaves (Straw) × 38%[8,20,24]
Note: For atmospheric dry and wet deposition nitrogen, only atmospheric wet deposition is estimated due to the lack of nitrogen-containing particulate matter concentration in the atmosphere.
Table 4. Nitrogen concentration in different crops and the ratios of stems/seeds.
Crop TypeNitrogen Content [8]Stem/Seed Quality Ratio [24]
Seed (Fruit)Stems and Leaves (Straw)
Rice1.53%0.64%1.2
Beans5.11%2.01%1.6
Peanut (oil crop)3.73%0.84%1.7
Vegetables0.50%0.50%0.5
Table 5. Calculation method and index of nitrogen output.
ComponentData SourceFormulaReference
NDeGuangdong Rural Statistical Yearbook
Guangdong Statistical Yearbook
Total input nitrogen × Denitrification parameter (20%)[5,20,24]
NVGuangdong Rural Statistical YearbookThe area of cultivated land in paddy fields (dry land) in that year/the area of cultivated land in the city in that year × Fertilizer Nitrogen × Ammonia nitrogen volatilization coefficient in paddy fields (dry land) + Human and Livestock Excreta Nitrogen × 0.20[20]
NHGuangdong Rural Statistical YearbookCrop yield × (Stem/seed quality ratio) × Nitrogen content of Crop stems and leaves (Straw) × 62% + Crop yield × Nitrogen content of Seed (fruit)[8,20,24]
NWoGuangdong Rural Statistical Yearbook
Guangdong Statistical Yearbook
Artificially activated nitrogen(Fertilizer Nitrogen + Farmland Self-Nitrogen Fixation + Farmland Symbiotic Nitrogen Fixation + Wastewater Discharge Nitrogen) × 30% + The number of permanent residents in the year × The amount of nitrogen lost per person to the waste discharged from the water body (3.3 kg N yr−1)[5,20]
Table 6. Nitrogen budgets of the coastal Eastern Guangdong in the past 15 years.
YearsNI (104 t)NO (104 t)NN (104 t)
200029.31 25.54 3.77
200529.06 25.11 3.95
201028.80 24.50 4.30
201530.53 26.18 4.35
Table 7. Regional comparison of agricultural nitrogen input (using similar estimation methods).
RegionYearsCultivated Land Area (ha)Agricultural Nitrogen Input (104 t)Total Nitrogen Input (104 t)Proportion (%)
Coastal Eastern Guangdong2000226,610.90 15.77 29.31 53.81
2005206,757.00 15.79 29.06 54.33
2010185,323.00 15.59 28.80 54.13
2015161,319.11 16.85 30.53 55.19
Pearl River Delta [5]20001,894,667.6739.6791.1643.52
20051,504,365.3333.9484.7140.07
20101,322,137.4731.4489.0635.30
Beijiang Basin [27]200618.5839.5247.01
Zhanjiang Bay Area [21]201060,353.32.995.3755.67
Note: Proportion is the ratio of agricultural nitrogen input to total nitrogen input.
Table 8. Regional comparison of nitrogen load and nitrogen flux on land.
RegionNitrogen Load
(kg N ha−1 yr−1)
RegionNitrogen Flux on Land (kg N ha−1 yr−1)
China [20]64Northeast coast of the United States [7]10.7
Pearl River Basin [20]104.44Northern rivers, Canada [7]7.6
Yangtze River delta [8]291Northwest coast of Europe [7]13
Pearl River Delta [5]175.03–196.98North Atlantic coast around the North Sea [7]14.5
Three Gorges Reservoir area [37]348.8Pearl River Delta [5]111.93–130.85
Zhanjiang Bay Area [21]249.99Yangtze River delta [8]224
Zhanjiang City [38]210.10–277.17Zhanjiang Bay Area [21]200.11
Yangtze River Basin [39]60.1Small watershed of subtropical hills in Hunan Province [40]115–216
Beijiang River Basin [27]84.91Yangtze River Basin [41]81.88
Small watershed of subtropical hills in Hunan Province [40]312Yellow River Basin [41]42.93
Amazon Basin [7]1.74Pearl River Basin [41]72.44
Mississippi River Basin [7]22.2Eastern China [41]142.62
Baltic Sea [7]22.6Taihu Lake, China [41]300
North Sea [7]70.4Central and Western China [41]18.16
Caribbean Islands and Central America [7]4.82Remote areas in Western China [41]6.22
St. Lawrence Basin [7]11.68Tibet, China [41]3.27
Coastal Eastern Guangdong276.01–299.60Coastal Eastern Guangdong221.26–239.06
Note: the above values are average values.
Publisher’s Note: MDPI stays neutral with regard to jurisdictional claims in published maps and institutional affiliations.

