Article

Hydroclimatological Patterns and Limnological Characteristics of Unique Wetland Systems on the Argentine High Andean Plateau

1
Instituto Nacional de Limnología (CONICET-UNL), Ciudad Universitaria S/N, Santa Fe 3000, Argentina
2
Department of Geosciences, University of Massachusetts-Amherst, 233 Morrill Science Center, 627 North Pleasant Street, Amherst, MA 01003-9297, USA
3
Center for Biodiversity and Conservation, American Museum of Natural History, 200 Central Park West, New York, NY 10024-5102, USA
4
Fundación YUCHAN, Mariano Moreno 1950, Villa San Lorenzo, Salta 4401, Argentina
5
Facultad de Ciencias y Tecnología, Universidad Autónoma de Entre Ríos, Ruta Provincial Nº 11. Km 10.5, Oro Verde 3100, Argentina
*
Authors to whom correspondence should be addressed.
Hydrology 2021, 8(4), 164; https://doi.org/10.3390/hydrology8040164
Submission received: 21 September 2021 / Revised: 21 October 2021 / Accepted: 30 October 2021 / Published: 3 November 2021
(This article belongs to the Special Issue Advances in the Ecohydrology of Arid Lands)

Abstract

:
High-elevation wetlands in South America are not well described despite their high sensitivity to human impact and unique biodiversity. We describe the hydroclimatological and limnological characteristics of 21 wetlands on the High Andean Plateau of Argentina, synthesizing information gathered over ten years (2010–2020). We collected physical-chemical, phytoplankton, and zooplankton data and counted flamingos in each wetland. We also conducted an extensive analysis of climatic patterns and hydrological responses since 1985. These wetlands are shallow, with a wide range of salinity (from fresh to brine), mostly alkaline, and are dominated by carbonate and gypsum deposits and sodium-chloride waters. They tend to have high nutrient concentrations. Plankton shows a low species richness and moderate to high dominance of taxa. Flamingos are highly dependent on the presence of Bacillariophyta, which appears to be positively linked to silica and soluble reactive phosphorus availability. Climatic conditions show a strong region-wide increase in average air temperature since the mid-1980s and a decrease in precipitation between 1985–1999 and 2000–2020. These high-elevation wetlands are fundamentally sensitive systems; therefore, having baseline information becomes imperative to understanding the impact of climatic changes and other human perturbations. This work attempts to advance the body of scientific knowledge of these unique wetland systems.

1. Introduction

The dry Andean plateau stretches 1800 km along the backbone of the mountain range from southern Peru to northern Argentina between the eastern and western mountains, varies from 350 to 400 km in width and averages 4000 m above sea level (m.a.s.l) [1,2]. Despite the aridity, the plateau is dotted with wetlands that provide essential resources for human activity and habitats for biodiversity highly adapted to extreme environmental conditions [3,4]. Nevertheless, these wetlands have received less attention than other types of water systems on the South American continent. This is likely linked to the difficulty of obtaining samples, the variety of morphological and hydrological characteristics, the complexity of the hydrogeology, and the abundance and variety of basins and water bodies in this environment [3,5].
The isolated wetlands of the Andean plateau are formed in arid and semiarid climates where annual evaporation exceeds precipitation, forming endorheic drainage basins with deep groundwater flow systems and little surface water [5,6]. This results in the development of unique wetlands at their terminal areas where salt concentrations may reach 250 g L−1, and evaporite deposits called salars often form [7,8]. Due to the extreme environmental conditions (high elevation, low oxygen availability, high irradiance, high desiccation potential, salinity gradients, and large daily air temperature fluctuations causing wetlands to freeze during winter), high-elevation wetlands tend to have simple food webs and react more rapidly and more sensitively partially or entirely to environmental changes than wetlands at lower elevations [9,10]. Vegetation patches (peatlands or high-elevation bogs), known locally as vegas and bofedales, are commonly found at the perimeter of lagoons and play a critical role in regulating the local water balance and sustaining a unique diversity of rare and endemic biota in the high Andes [11,12].
Regarding the geology and hydrology of these arid, endorheic landscapes, the difficulty of constraining fundamental hydrological processes such as response times, flow paths, and distribution and timing of groundwater recharge is magnified by long residence times (>100 years), deep water tables (>100 m), and often insufficient data [13,14]. Indeed, Liu et al. [15] showed that one in three of these catchments had an effective catchment area larger or smaller than the topographic catchment, leading to large discrepancies in water budgets. These hydrological imbalances within a catchment may be reconciled by the subsurface interbasin flow between topographic drainages and/or the draining of stored groundwater recharged during wetter periods hundreds to thousands of years before the present [16]. These processes are well documented globally [13,16,17,18]; and particularly in the Chilean pre-Andean depression, where relevant contributions have been made recently [19,20,21,22]. As in other arid regions of South America, these kinds of studies are relatively scarce in Argentina. Many questions remain to be answered, such as the overall response to hydroclimate changes at the higher elevation wetlands and slightly wetter climates on the plateau. Specifically, we still have insufficient knowledge about the reaction of vegetation extent in response to observed climate changes and how these responses vary by wetland elevation, basin area, and relative water age feeding surface water features.
In addition to the natural climatological variability, the wetland systems in the study area have been influenced by human activity to some extent since humans first settled here. However, these systems are the main providers of ecosystem services in a region where water is a scarce and limiting resource [23]. Many of the salt lake brines and flats of the Andean plateau are rich in sodium, lithium, boron, magnesium, and other elements that attract mining. Indeed, mining has been present here throughout history, from small-scale mines to major national and multinational investments [24]. Some of the largest lithium mineral deposits in the world lie within or near these wetland systems [25,26], and lithium mining activity has increased in size and scope since 2016 to supply the growing markets for rechargeable batteries. Changes in land use, such as agriculture expansion, nutrient enrichment, organic pollution, and an increased heavy metal load, also have a growing impact on these kinds of wetland ecosystems [27,28]. In addition to the local and regional pressures, global climate change is causing significant increases in temperature and changes in precipitation patterns which will likely affect the size and distribution of glaciers and wetlands, ecosystem integrity, surface water extent, and water availability for human activities [29,30,31,32].
The wetlands of the high Andes have also been identified as important ecoregions of diversity with high levels of endemism, unique traits, and evolutionary novelty [33]. Several rich, polyextremophilic microbial ecosystems flourish in these extreme environments. Biofilms, endoevaporitic mats, domes, and microbialites have been found to exist in association with salars, lagoons, and even volcanic fumaroles in central Andean environments, e.g., [34,35], for a complete review. Regarding planktonic microorganisms, several valuable contributions to the knowledge of the plankton diversity of high elevation wetlands have been published [3,36,37,38,39,40,41,42,43] with some other relevant contributions such as Servant-Vildary and Roux [44], Rejas et al. [45], and Frau et al. [46]. These authors also demonstrated the importance of nutrient limitation, especially silica and ionic composition for high-elevation diatom assemblages.
The high Andean wetlands support a diversity of endemic, resident, and migratory birds, and some of them completely dependent on water [47,48]. These wetlands are one of the main drivers of bird spatial distribution at high elevation and have a crucial role in preserving birdlife [49,50]. They also serve as steppingstones during the migration of long-distance migrants, particularly shorebirds [48,51,52]. Among birds, flamingos (Phoenicopteridae) are iconic species in the landscape, moving from one wetland to another, making alternative and complimentary use of these wetlands for feeding and breeding, effectively connecting these wetlands as a network of habitats [53,54,55]. Flamingos are an important component of the increasing nature tourism industry that has developed in the past decade and serve as flagship species for the conservation of high-elevation watersheds. Native mammals that depend on these wetlands to survive include puma (Puma concolor), Andean cat (Leopardus jacobitus), Andean fox (Lycalopex culpaeus), hairy armadillo (Chaetophractus nationi), and the commercially valuable vicuña (Vicugna vicugna) [56].
Despite all the singularities reported above regarding high-elevation wetlands from the Andean Plateau, human activities in combination with global climate change are driving variations in biological and hydrological attributes to a rate faster than we can measure. Baseline information regarding biological conditions at these wetlands, highly sensitive to anthropogenic disturbances [9] and, thus, ideal sentinels of global change [57,58] are becoming necessary to improve our capacity to properly manage the use of these environments [30,59,60]. Catamarca province, located in northwest Argentina, is an area where human activity, mainly mining has increased recently [61]. In Catamarca, we have gathered information over the last ten years to characterize hydroclimatological and limnological aspects, but we lack a holistic perspective of the characteristics and functioning of these systems. We argue that assessing geochemical and limnological characteristics at specific wetland systems in Catamarca can significantly improve the understanding of potential impacts from current and future human activities in these and similar systems across the High Andean Plateau. High-elevation wetlands are considered one of the most comparable ecosystems across continents [57] due to the many ecological features that they share. This makes the information synthesized in this manuscript potentially applicable to many other environments in South America and other arid regions that have not been adequately studied but share similar issues of human modifications and climatic change. In this study, we summarize the findings of a multidisciplinary approach synthesizing information gathered from publicly available data sources and field expeditions, describing the hydrogeological components and relevant biological patterns of wetlands on the High Andean Plateau in northwest Argentina.

2. Methods

2.1. Study Area

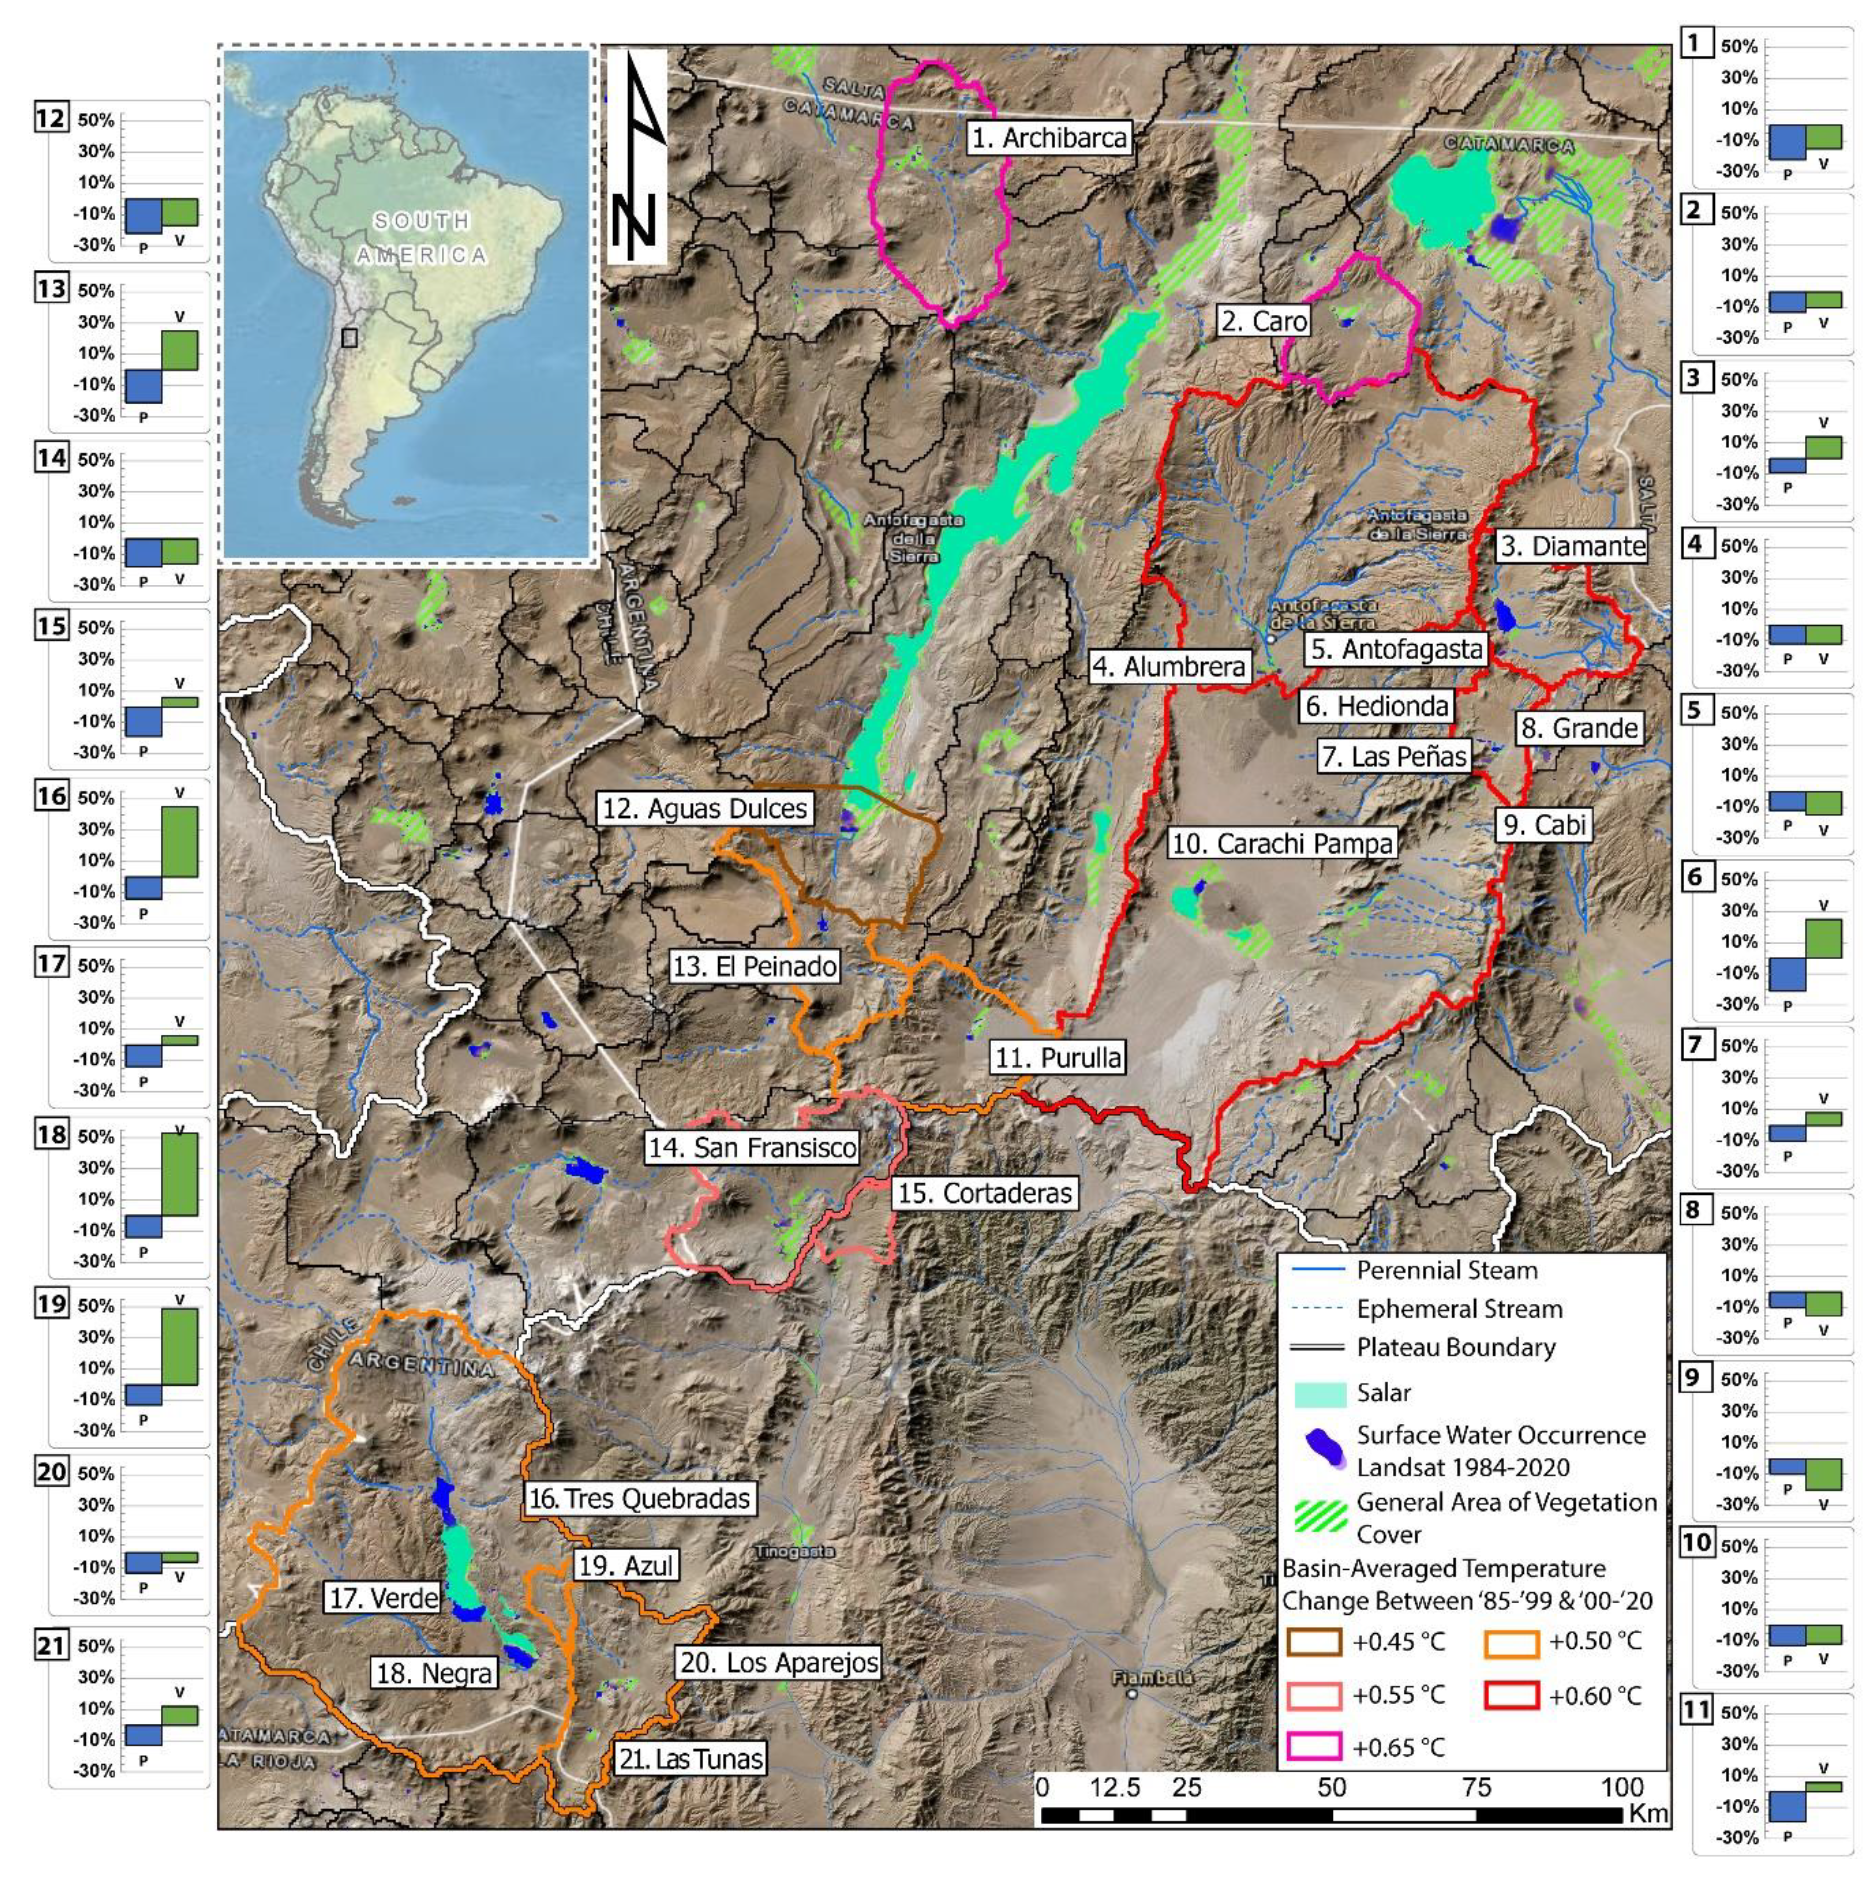
The study area encompassed 21 wetlands sampled in northwestern Argentina between 25°–28° S and 67°–69° W and situated between 3000 and 4500 m above sea level (m.a.s.l) (Figure 1). The area is characterized by predominantly volcanic geomorphology with numerous stratovolcanoes and vast basaltic and pyroclastic deposits. Eight of the wetlands sampled are within the Lagunas Altoandinas y Puneñas de Catamarca Ramsar site, which was designated in 2009. The climate is cold and dry, with temperatures below 0 °C most of the year and average annual rainfall between 50 and 200 mm year−1 [62]. Most of these wetlands are shallow, commonly less than 1 m in depth, and become partially or entirely frozen during winter [10]. They all sit within endorheic basins where water inflow comes mainly from groundwater recharge in the surrounding mountains and local alluvial infiltration and runoff, all of which leave the system through evapotranspiration.

2.2. Physical-Chemical Sampling and Laboratory Analyses

Sampling was conducted between 2010 and 2020 during the summer season (January–February) because some of these wetlands are dry or frozen during the rest of the year, over seven consecutive days in a total of 21 wetlands, including peatlands, lagoons, and salars (see Table S1 in the Supplementary Materials for specific sampling dates at each site). At each sampling site, between one and four replicates were taken for the several hydrogeochemical-limnological parameters explained below. It is important to note that our assessment included 21 wetlands in total; however, no biological or limnological data was collected at Laguna Diamante, meaning there are only 20 wetlands included in those results.
For limnological analyses, measurements made in situ were temperature (°C), pH, and conductivity (mS cm−1) using HANNA multiparametric meters; transparency with a Secchi disc (m); and elevation (m.a.s.l) using a GPS altimeter and verified with a digital elevation model in ArcGIS. Water-type categories were derived from the fresh-brackish-saline-brine categorization scheme described by Warren [64].
Water samples were taken for determination of the nutrients nitrate+nitrite (N-NO3+N-NO2), ammonium (N-NH4+), soluble reactive phosphorus (SRP), and dissolved silica (Si). Samples for determination of N forms and SRP were immediately filtered through membrane filters (0.45 µm pore size). Subsequently, samples for nitrate + nitrite and ammonium determination were acidified to a pH < 2 with concentrated sulfuric acid, whereas samples for SRP determination were preserved by adding 5 mg L−1 of HgCl2. All samples were stored in cold and darkness before transporting to the laboratory for analysis. Acidified water samples were neutralized in the laboratory. Samples used for determination of N-NO3+N-NO2 were estimated by reducing N-NO3 with hydrazine sulfate and subsequent colorimetric determination of N-NO2 [65]. N-NH4+ was determined using the indophenol blue method, SRP using the ascorbic acid method, and Si using the molibdosilicate method. Dissolved inorganic nitrogen (DIN) was calculated as the sum of N-NO3+N-NO2 and N-NH4+. The methodology proposed in APHA [66] was followed throughout, and nutrient concentrations were expressed as mg L−1 for silica and µg L−1 for DIN and SRP.
Physical and chemical data were explored by using principal component analysis (PCA). All data were log-transformed, except pH, and values obtained were standardized. Neighbor-joining clustering analysis was performed on the physical-chemical data obtained to find common patterns among wetlands sampled.
Water samples analyzed for major ion composition were collected at 10 of the 21 wetlands in February of 2019 and 2020 using a consistent, standardized procedure and repeated sampling from the same location when possible (Supplementary Materials, Table S2). Water samples were filtered through 0.45 μm filters using a plastic 60 mL syringe and were stored in clean HDPE bottles. The concentration of major elements was analyzed using inductively coupled plasma optical emission spectroscopy for major elements (Agilent 5110 ICP-OES) and high-pressure ion chromatography (Dionex Integrion HPIC) for Cl, SO4, PO4, and NO4 anions at the University of Massachusetts Amherst. Waters with relatively high TDS were diluted volumetrically before analysis. For ICP OES analysis, samples were acidified to 1% HNO3 v/v before analysis. Quantification was performed using seven external calibration standards ranging from 0.1 to 100 ppb. Calibration verification standards and blanks were run at every 10th analysis for anions and elements. Elemental analysis was verified with external NIST standard SRM 1643d, and anion analysis was verified with a secondary anion standard (Anion II Std Dionex). Samples that exceeded the calibration by 120% were diluted and reanalyzed. The concentration of HCO3 in water was determined by titration using an autotitrator. In all cases, the laboratory measurement error was 0.01 mg L−1. All other major ion data used in the study were obtained from Sureda [67]. A charge balance assessment of all these data was performed, and only samples with less than 10% error were included.

2.3. Hydroclimate Characterization

We utilized multiple remotely sensed datasets to assess hydrological and climatological conditions and changes over time across the basins of interest. These include Landsat satellite imagery (spatial resolution of 30 m × 30 m), the TerraClimate climatically aided precipitation interpolation, and the famine early warning systems network land data assimilation system (FLDAS). These data products are publicly available on Google Earth Engine (GEE) platform and were extracted and compiled using tools within the platform. For each wetland system, basin domains were extracted from the HydroSHEDS dataset (Hydrological data and maps based on shuttle elevation derivatives at multiple scales) [68] or a contributing watershed area determined using the Watershed tool in ArcGIS Pro. Values of total precipitation and mean air temperature were extracted for each satellite pass (~16-day intervals) as spatially aggregated values for each basin or watershed containing the wetland of interest; outlines of these areas are shown in Figure 1. Total living or “green” vegetation extent was also assessed at each wetland complex using the normalized difference vegetation index (NDVI). These data provide a robust assessment of the change in climatic and hydrological conditions from the mid-1980s to the present.
To assess changes in precipitation, we utilized the TerraClimate precipitation product which uses climatically aided interpolation, combining high-spatial-resolution climatological normals from the WorldClim dataset, with coarser spatial resolution but time-varying data from CRU Ts4.0 and the Japanese 55-year reanalysis (JRA55) [69]. The data are provided as monthly precipitation accumulation totals at a resolution of 1/24° (~4-km) from 1958 to 2021. A time series of annual total precipitation was then created for each basin/watershed. From this time series, we derived a general value of precipitation changes between 1985 and 2020 represented by the percent change from the 1985–1999 mean value to the mean value of the 2000–2020 period.
Mean annual air temperature was determined using the famine early warning systems network (FEWS NET) land data assimilation system (FLDAS) global land surface simulation that provides monthly values of near-surface air temperature at a 0.1° × 0.1° resolution [70]. The model is forced by combining the modern-era retrospective analysis for research and applications version 2 (MERRA-2) data and climate hazards group infrared precipitation with station (CHIRPS) 6 hourly rainfall data that have been downscaled using the NASA Land Data Toolkit. Although the precipitation product used in FLDAS is not as reliable for this region, the air temperature data are quite consistent with station data and other datasets and are, therefore, determined to be robust estimates. The value of temperate change from 1985 to 2020 was derived from the linear trend of mean annual air temperature over that period.
To assess changes in vegetation cover, we utilized the NDVI, which is calculated from spectral imagery using the formula: NDVI = (NIR − RED)/(NIR + RED) where NIR is the reflection in the near-infrared spectrum and RED is the reflection in the red range of the spectrum [71]. NDVI is designed to assess the density of vegetation at a given location at a given time. It provides a single band with a range from −1.0 to 1.0 where negative values are clouds, water, and snow; values close to 0 up to 0.1 are from rocks and bare soil. Different types of vegetation are classified in values greater than ~0.1. To be conservative and be sure we are capturing only vegetation, we extracted the pixels whose values fell between 0.2 and 0.9. The domains over which each wetland was analyzed were chosen to encompass all vegetation directly associated with the wetland system, at or near each basin floor. Using GEE, we extracted a full series of Landsat 5 and Landsat 7 Satellite images from 1985 to 2020 and determined the number of pixels covered by green vegetation (0.2–0.9 range) from which a total geographic area was then calculated. This provides a time series of the total area covered by living vegetation within each wetland region. From these time series, we derived a general value of change in the vegetated area between 1985 and 2020 represented by the percent change from the 1985–1999 mean value to the mean value of the 2000–2020 period.

2.4. Biological Sampling and Analyses

Samples of phytoplankton were collected at the same time as the physical-chemical samples from the subsuperficial area using 120 mL bottles and then were immediately fixed with 1% acidified Lugol solution for preservation. Quantitative sample analyses were carried out following the Utermöhl method [72], and the density obtained was expressed ind mL−1 by accepting a counting error <20% [73]. For estimating zooplankton abundance, between 10 and 30 L of water were filtered through a conventional conical plankton net (50 µm) with a collector and a 2 L bucket. The collected material was fixed in situ with 10% formalin and dyed with erythrosine. The microzooplankton counts (Rotifera and nauplii) were carried out with a conventional optical microscope using Sedgwick-Rafter type chambers with a capacity of 1 mL. Macrozooplankton (Cladocera and Copepoda) counts were performed in a 5 mL Borogov-type counting chamber. Density was expressed as ind L−1. Taxonomic identification was carried out to the lowest taxonomic possible level. Phytoplankton taxonomic classifications were based on Lee [74]. Taxonomic determinations were made following keys and specific bibliography of each algal group, such as Krammer and Lange-Bertalot [75] for Bacillariophyta, Tell and Conforti [76] for Euglenophyceae, Komárek and Fott [77] for Chlorophyceae, and Komárek and Anagnostidis [78,79] for Cyanobacteria, among other authors and recent revisions. Zooplankton taxonomic identifications were based on Ahlstrom [80], Koste [81], Kořínek [82,83], Korovchinski [84], and Alekseev [85], among others. Flamingos were identified to species level (Phoenicoparrus andinus, P. jamesi, and Phoenicopterus chilensis) using spotting scopes and binoculars and counted from established census points, consistent across years. For large flocks (>500) or groups dispersed throughout the wetland, numbers were estimated using methods described in Marconi [86]. For this study, we used total numbers per flamingo species for each wetland.
Flamingo and plankton abundances were compared among wetlands by using Kruskal–Wallis analyses and the Mann–Whitney post hoc test. Temporal tendencies for flamingo abundances were explored by using Mann–Kendall tests using flamingo counts carried out from 2010 to 2020. Diversity indices, such as Shannon–Wieber, dominance, and richness, were estimated for plankton. Finally, a redundancy analysis (RDA) was performed by using all the environmental variables as predictors and the biological communities (flamingos, phytoplankton, and zooplankton) as response variables to explore the main environmental variables which may influence natural communities’ abundance. The RDA analysis was performed after considering the longitude gradient in a detrended correspondence analysis (DCA), and highly correlated variables (VIF > 10) were omitted.

3. Results

3.1. Physical-Chemical and Hydroclimate Characterization

All the wetlands sampled (n = 21) were located above the 3000 m.a.s.l. and range in area from 24 to 1117 ha (determined by surface water extent from the HydroLAKES dataset described by Messager et al. [87] (Table 1). Diamante is not included in Table 1 since we did not collect biological or limnological data there; however, it is one of the largest wetlands in the region and therefore was included in the rest of our analysis. All of them were shallow (<1 m) with high transparency, allowing light to reach the bottom. Alkaline conditions were typical, except for Aguas Dulces showing to be circumneutral (pH = 7). Nutrient concentrations were variable across wetlands. DIN concentrations were above 100 µg L−1, with the highest concentrations registered in Las Peñas, Carachi Pampa, Grande, and Hedionda and the lowest in Cortaderas, San Francisco, and Archibarca. SRP concentrations followed a similar pattern of high variation among lakes, with the highest concentrations registered in Archibarca and Hedionda. Values registered were above 50 µg L−1, except in Antofagasta, Azul, and Negra (32.7, 44.1, and 46.1 µg L−1, respectively). The DIN:SRP ratio showed, in general, low values (<10), indicating DIN limitation in almost all wetlands where information was available. Si concentrations were about one thousand times higher than concentrations of the other inorganic nutrients sampled (>30 mg L−1 for all lakes sampled). Conductivity showed a wide range, with some wetlands having very low values (e.g., Alumbrera, Antofagasta, and Cortaderas had <2.5 mS cm−1). About 30% of the wetlands sampled were categorized as freshwater or brackish, all measuring below 10 mS cm−1. The remaining wetlands (70%) were considered saline, with mean conductivity values between 25 and 110 (mS cm−1) being the most saline; Diamante was a large lake composed of brine. (Table 1).
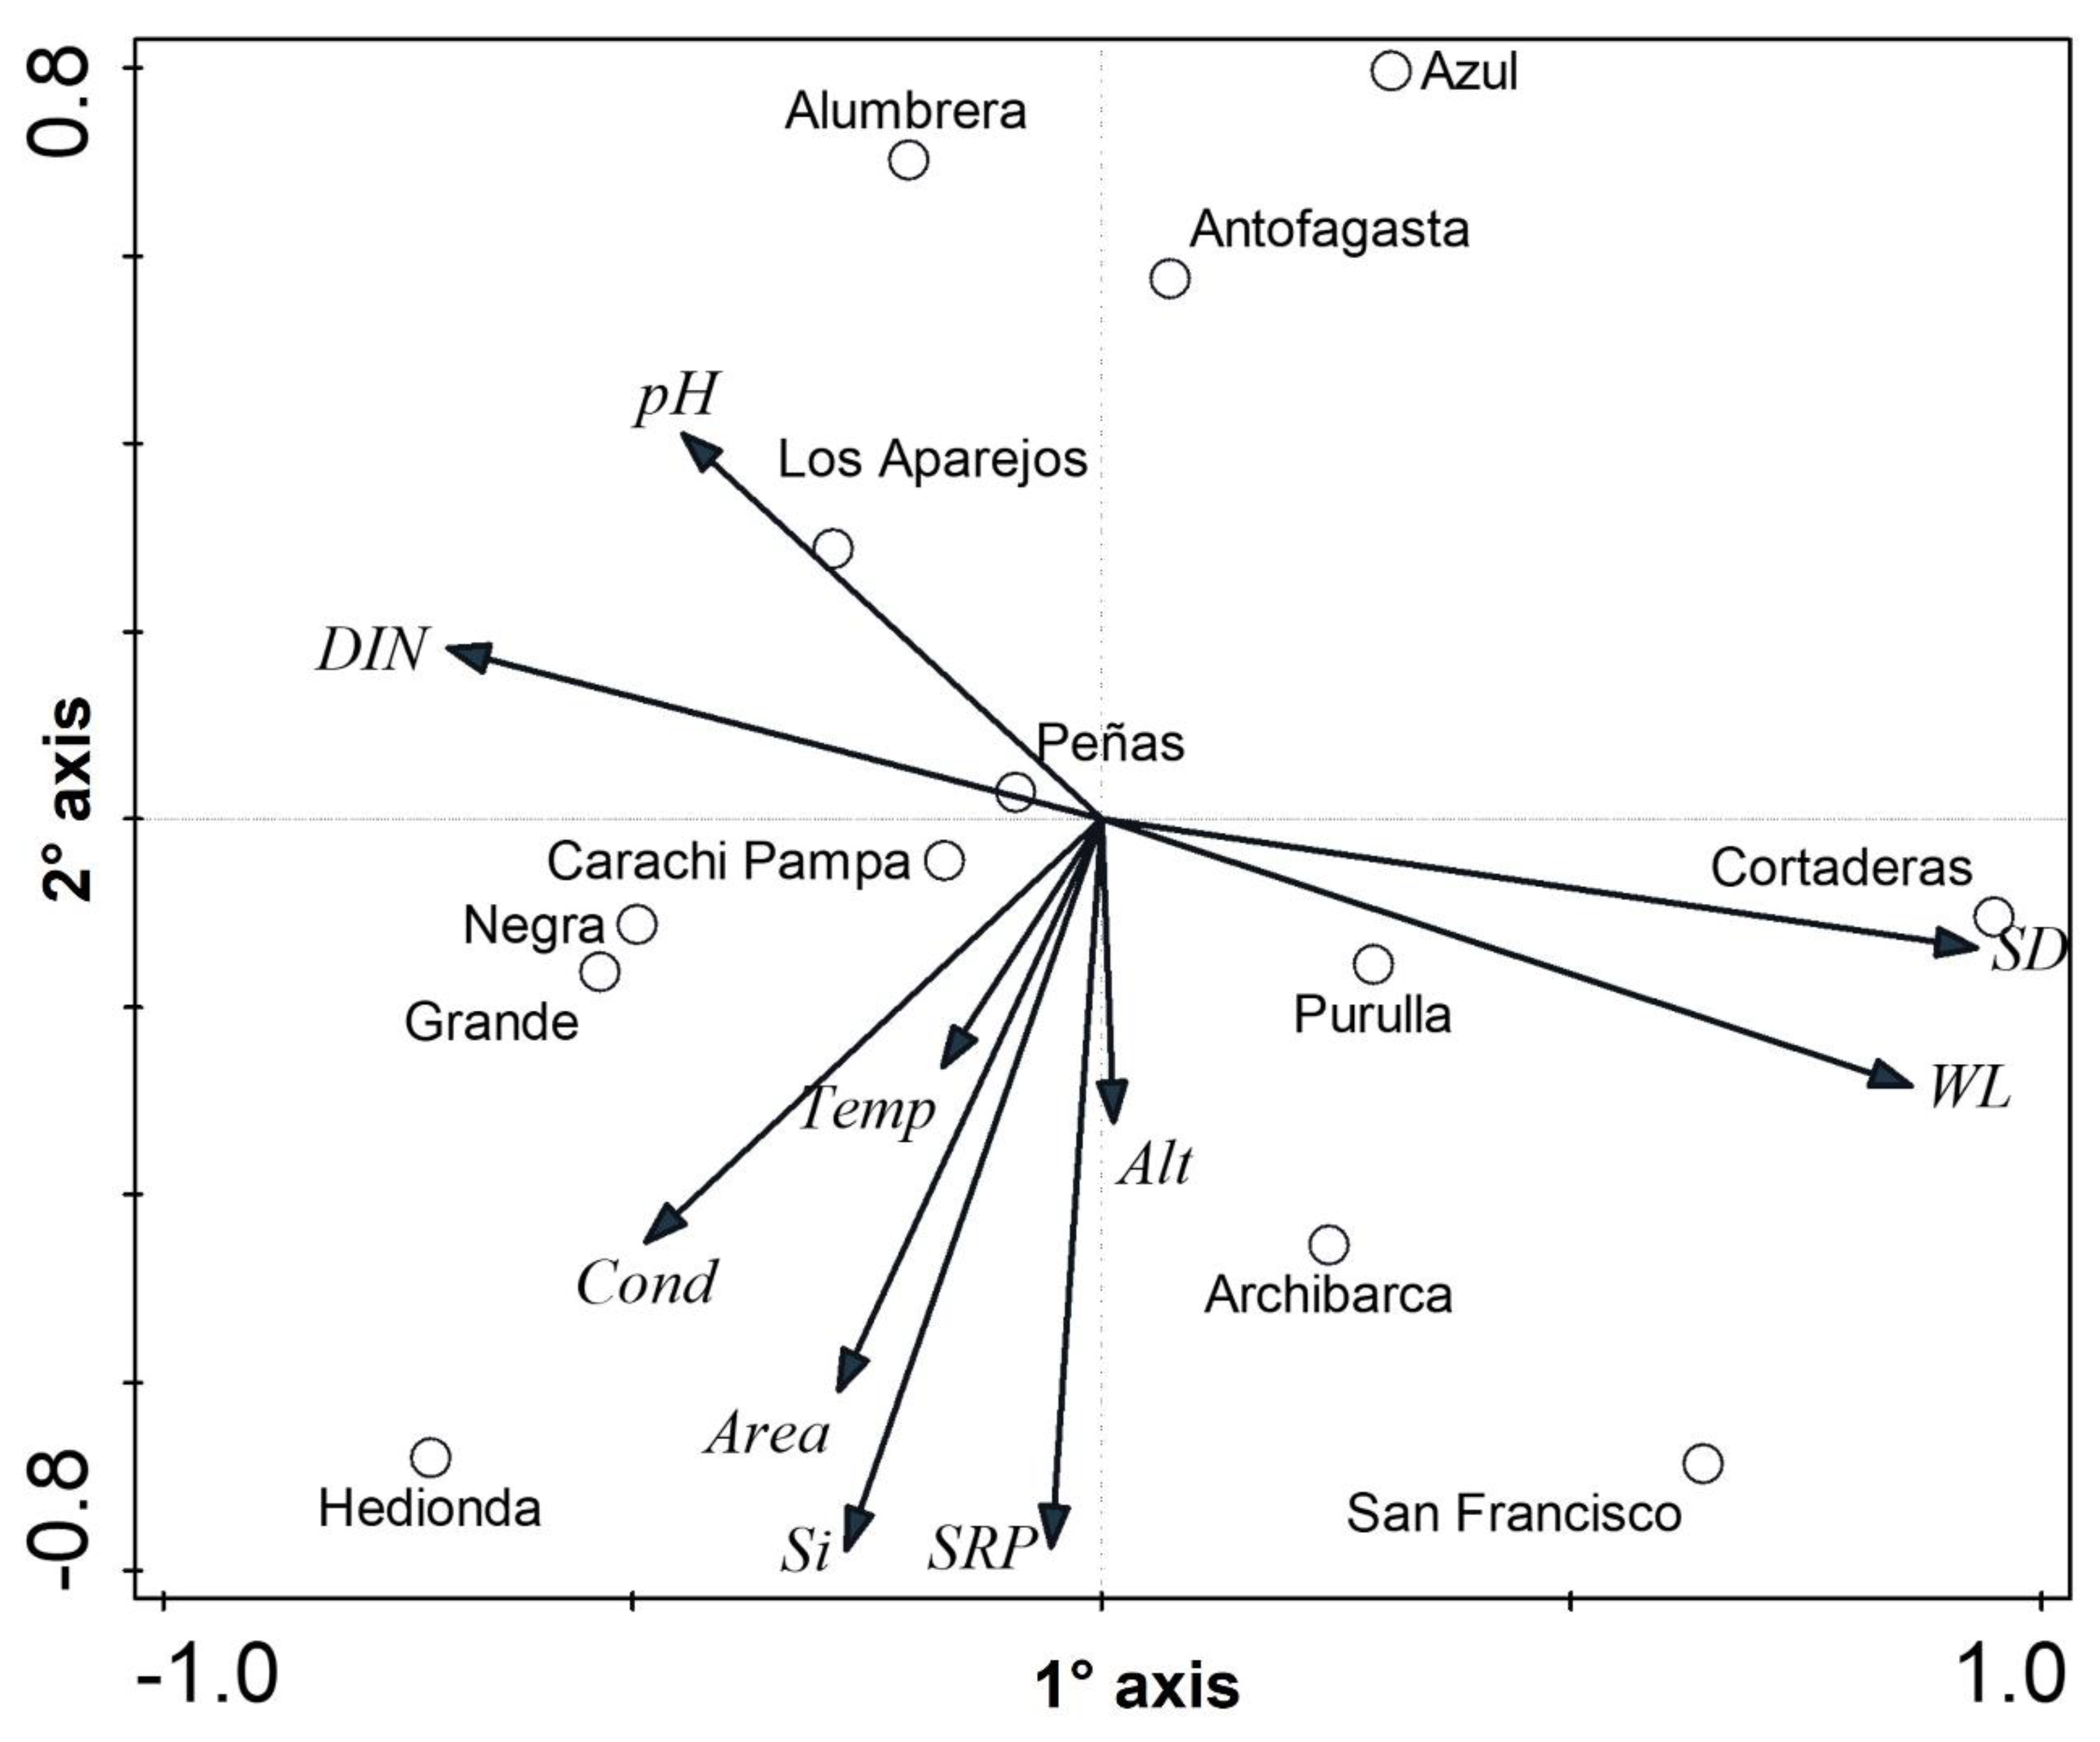
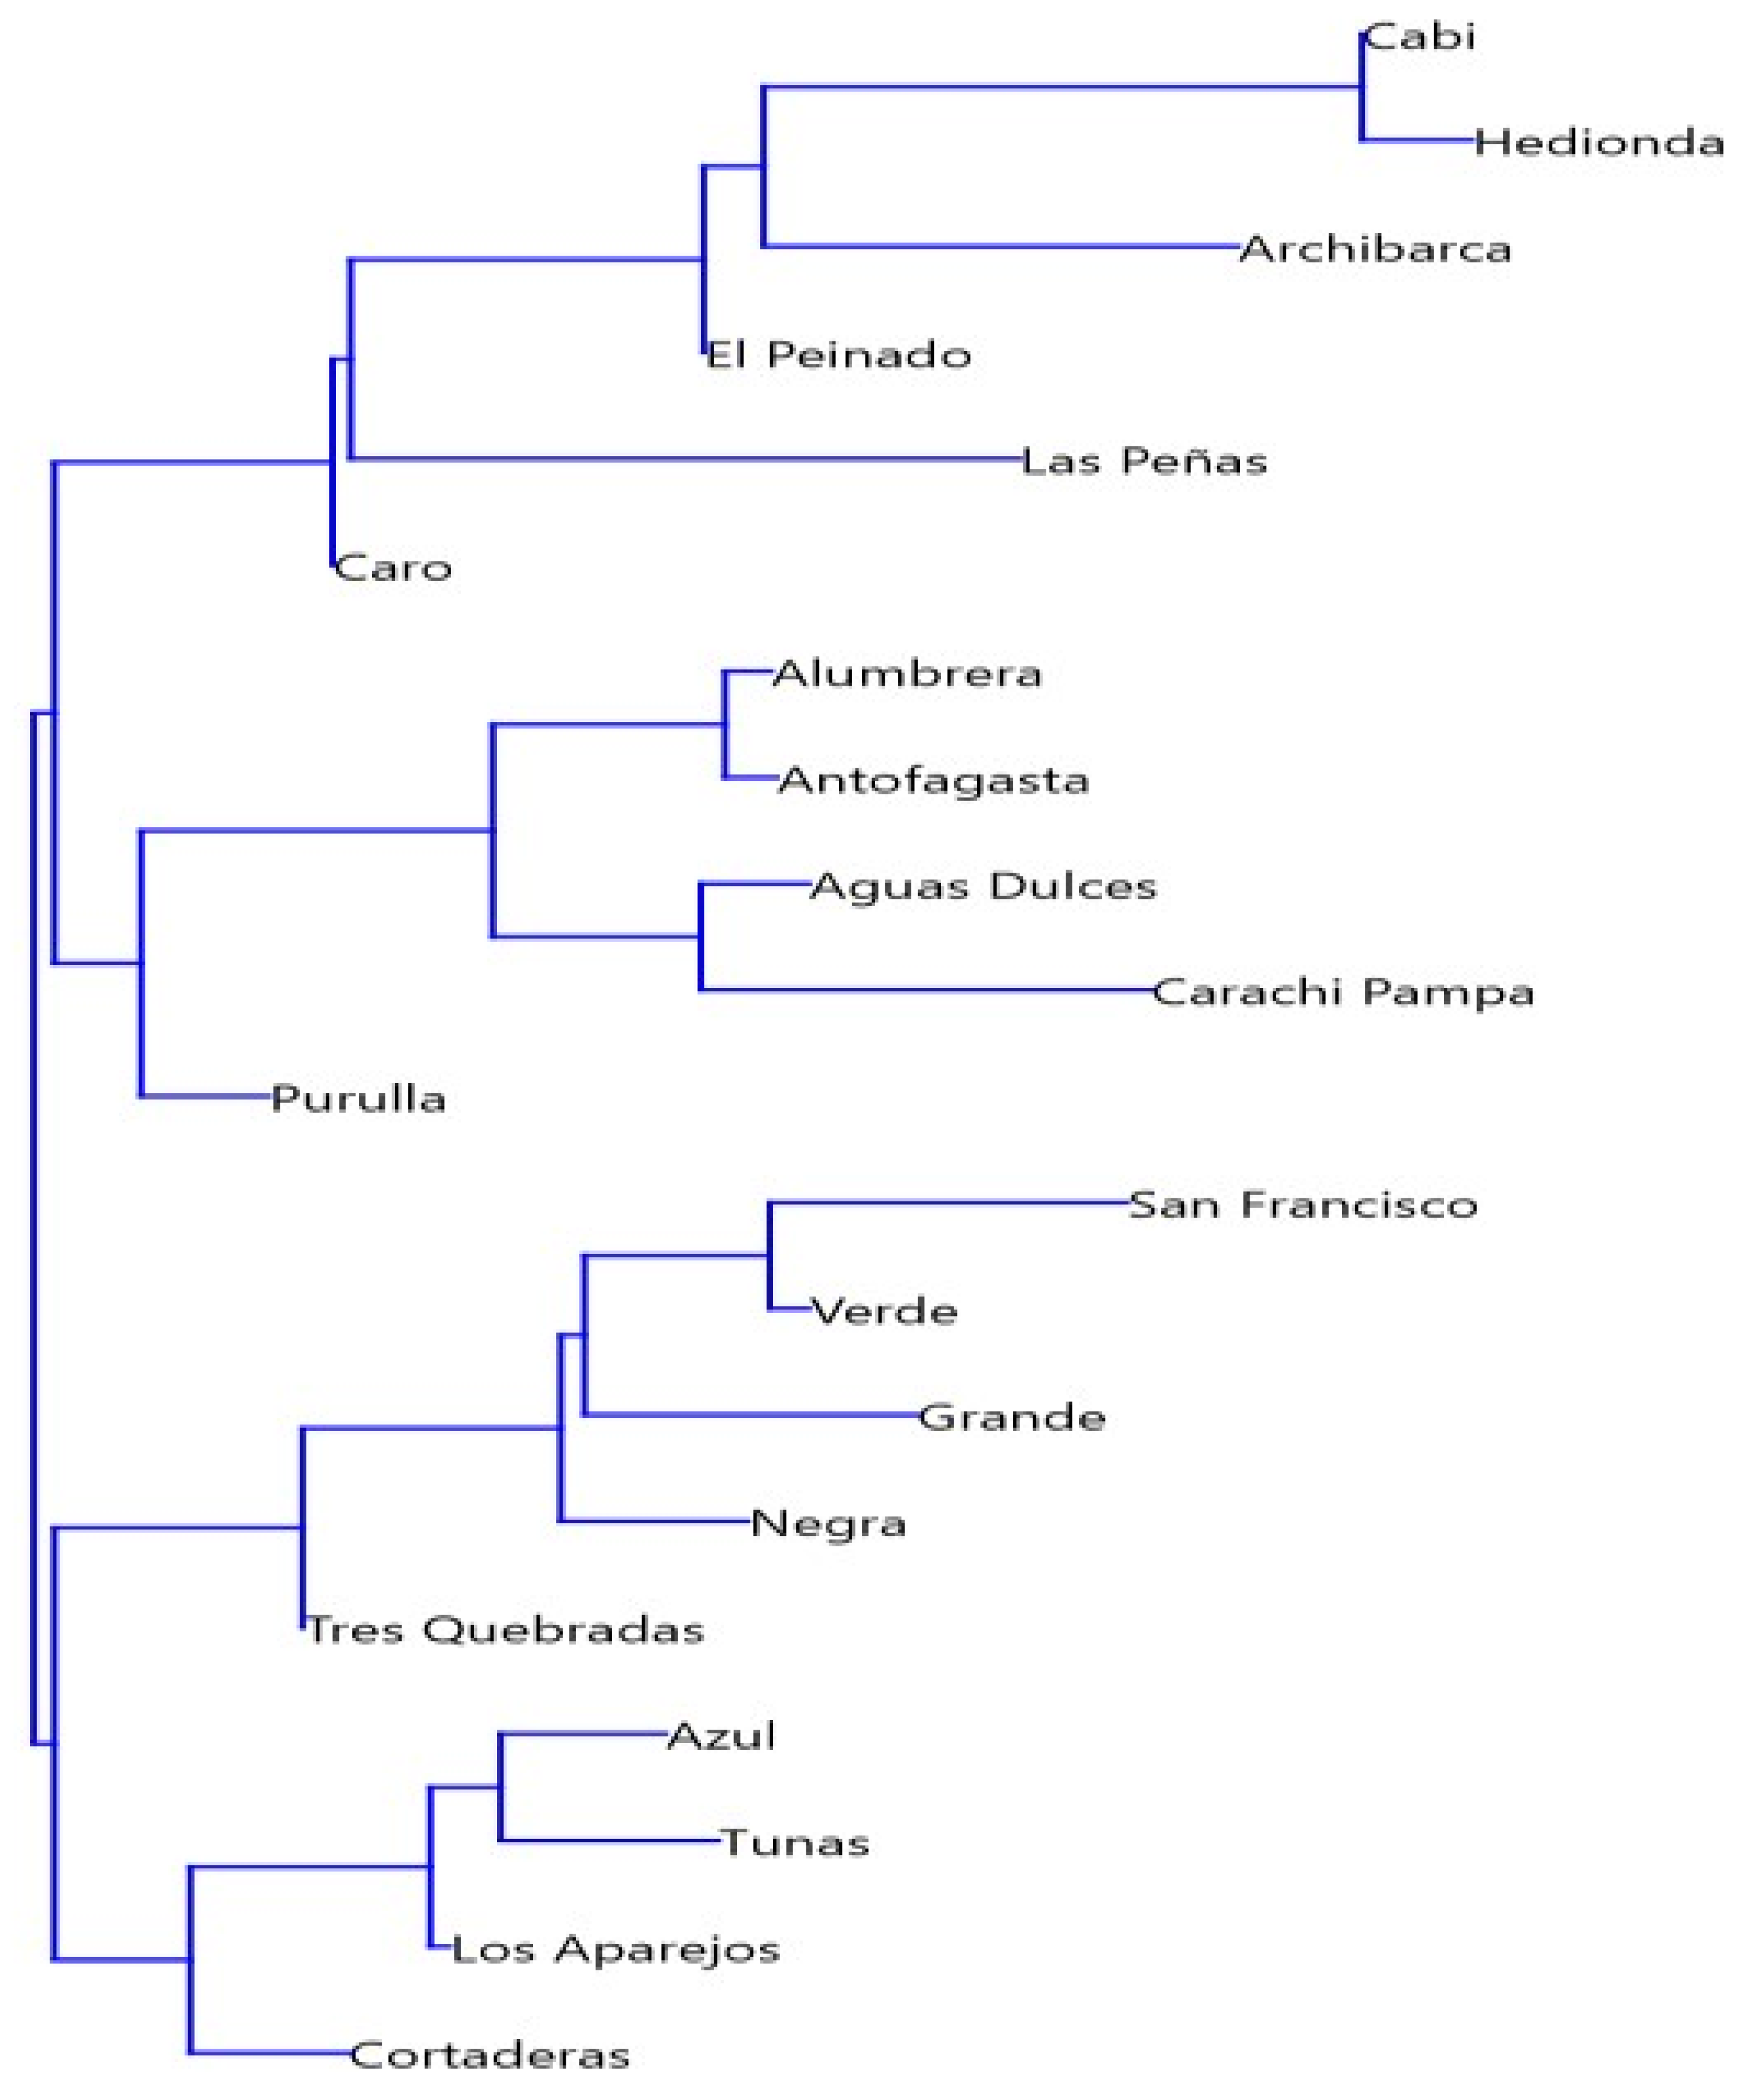
The PCA ordination analysis explained 49.66% of the total variance in the first two axes. The first axis indicated a gradient of DIN concentration, with maximum values recorded in Carachi Pampa, Grande, and Las Peñas and the lowest value in Cortaderas. The second axis suggested a gradient of SRP concentration and elevation from San Francisco and Archibarca to Alumbrera and Antofagasta. Carachi Pampa, Negra, and Grande stand out for their high conductivity values, Si concentration, and area (Figure 2). Complementarily, the neighbor-joining clustering analysis suggests four clusters of wetlands. Cluster one (Archibarca, Cabi, Caro, Hedionda, El Peinado, and Las Peñas) had the highest nutrient values, being mostly saline lagoons. Cluster two (Aguas Dulces, Antofagasta, Alumbrera, Carachi Pampa, and Purulla) were those located at the lowest elevation (above 3000 m.a.s.l), had mean temperature values higher than the other wetlands (above 22 °C), and were saline-freshwater lakes. Cluster three (Grande, Verde, Negra, Tres Quebradas, and San Francisco) had the highest elevation, area, and Si concentrations and were saline-brackish. Finally, cluster four (Los Aparejos, Azul, Cortaderas, and Las Tunas) was characterized by having the lowest mean DIN and Si concentration, as was mostly saline-brackish (Figure 3).
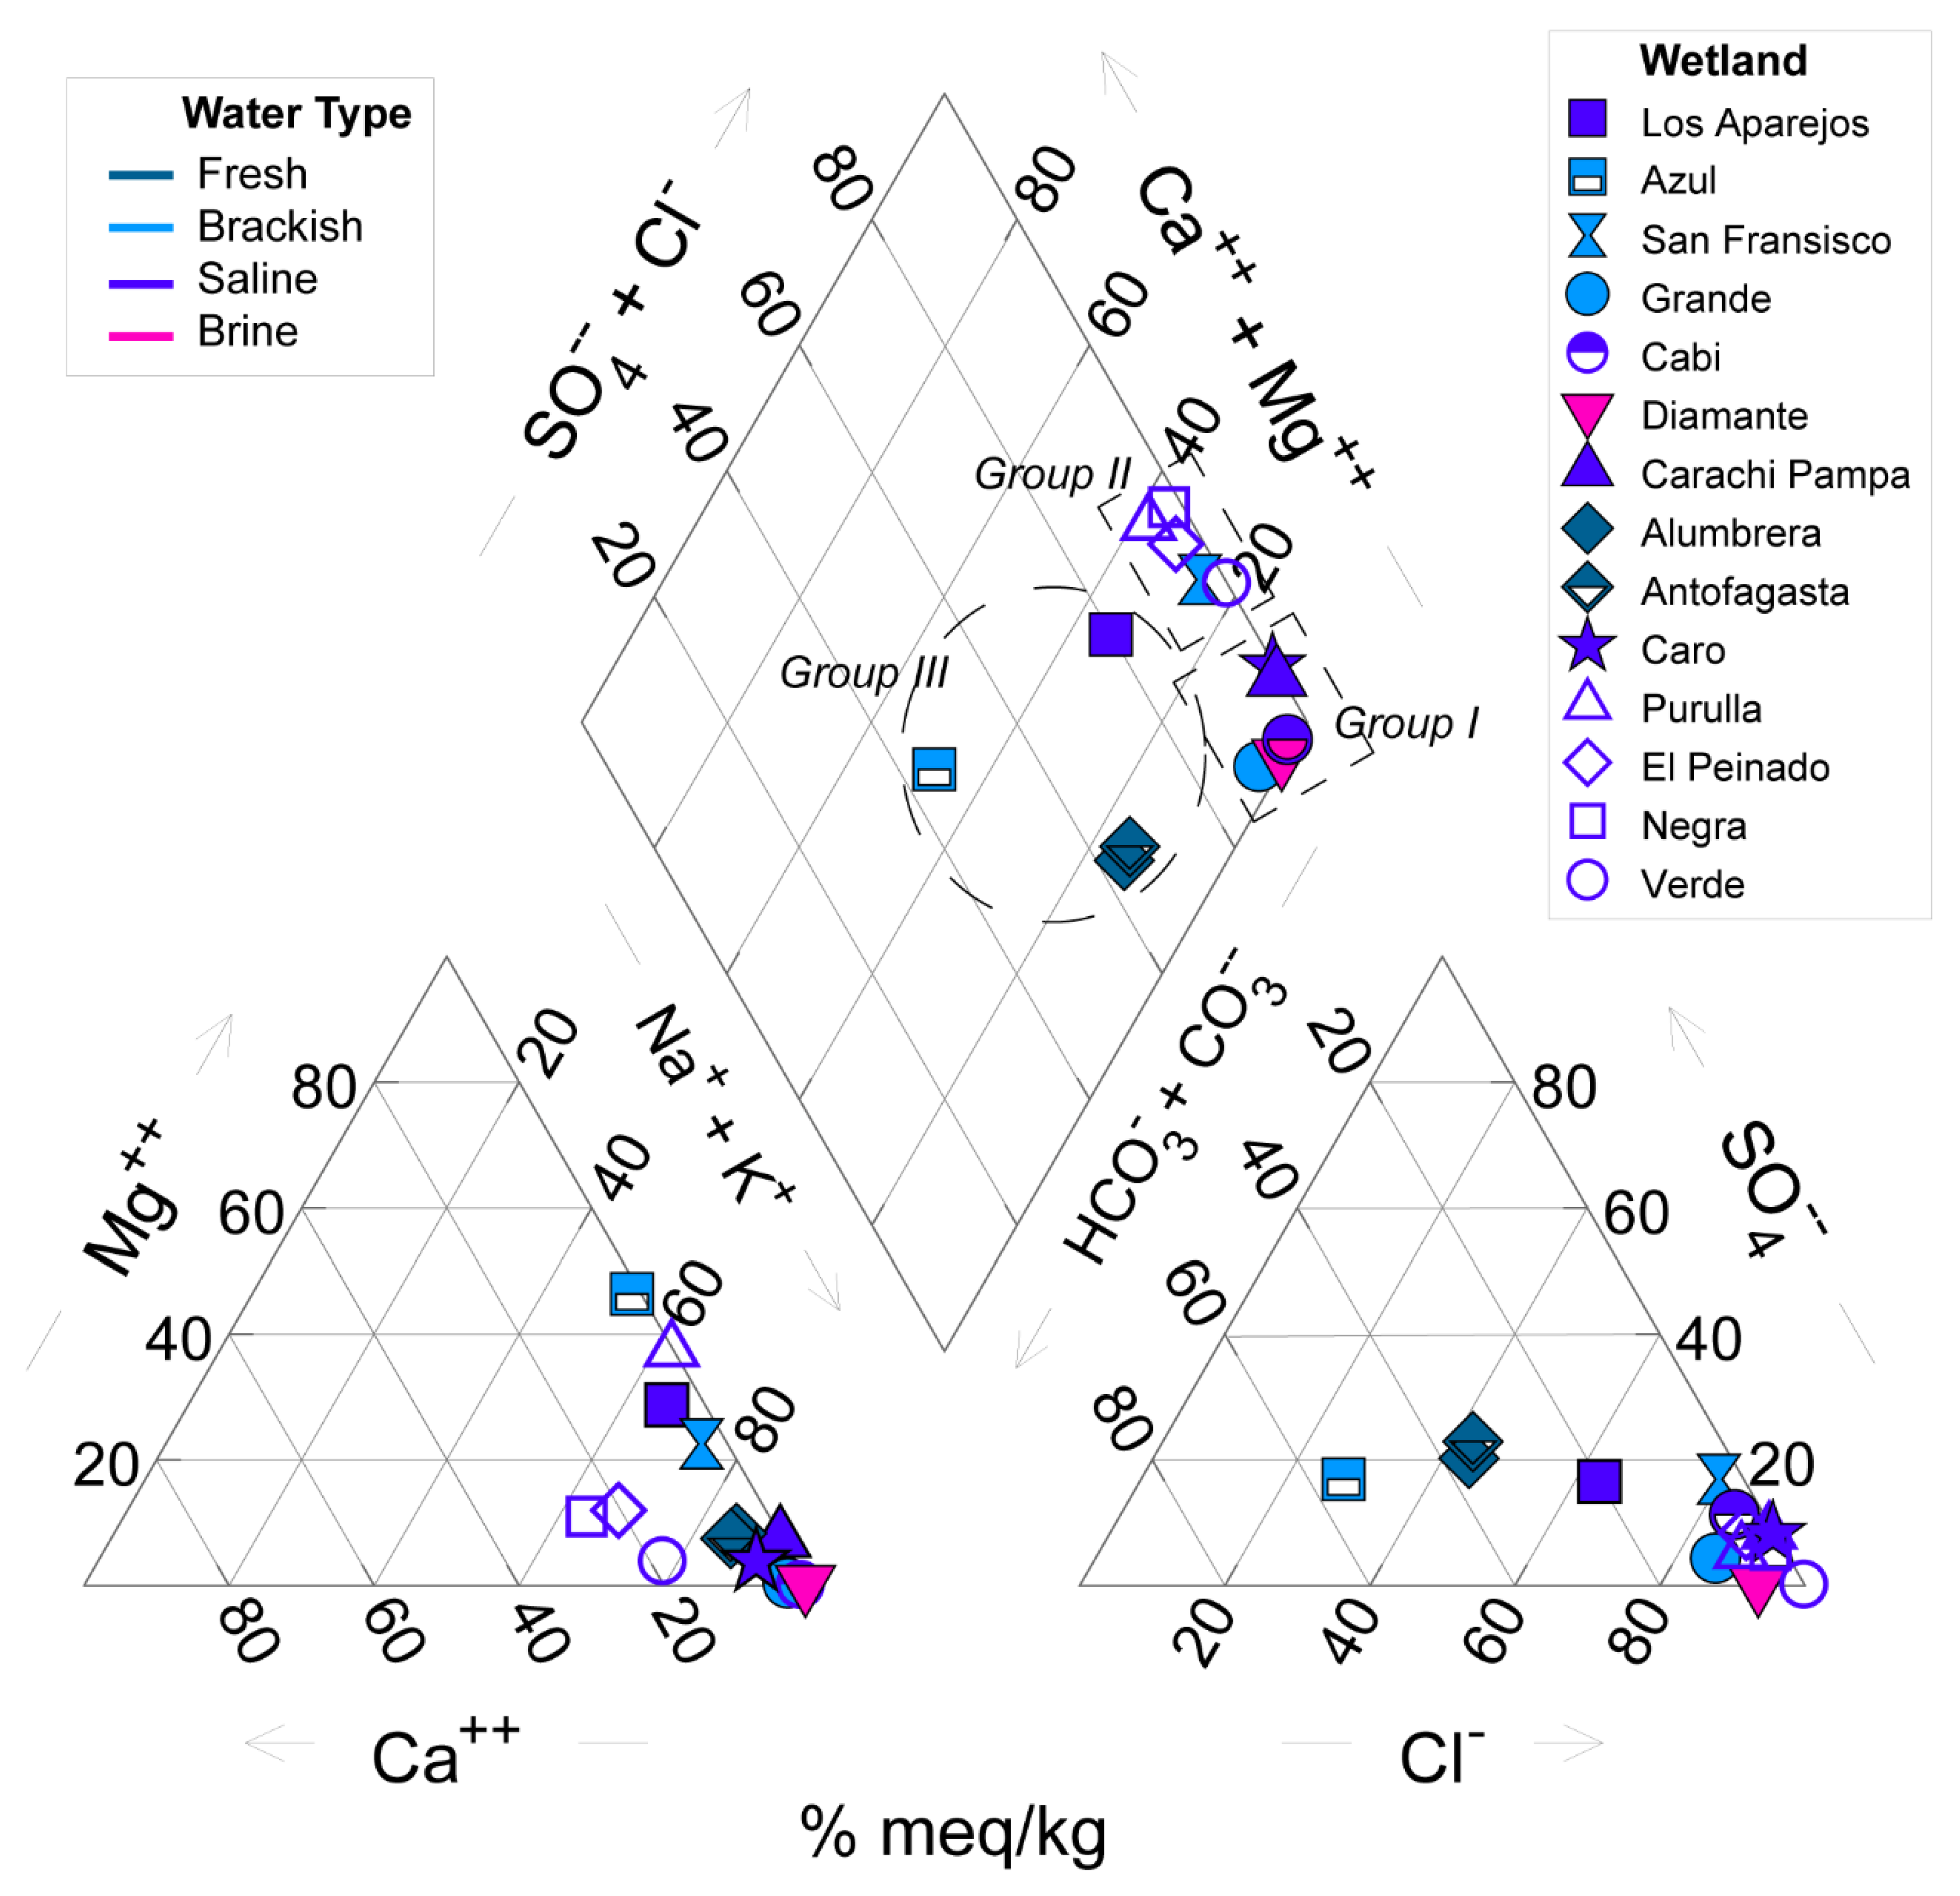
Based on the dissolved ion compositions of 14 wetland surface waters (10 analyzed for this work and 4 from data obtained from Sureda [65], we can describe three distinct groups of wetlands (Figure 4). Group one: Grande, Diamante, Carachi Pampa, Caro, and Cabi are dominated by Na+, K+, and Cl with very low concentrations of Ca++, Mg++, and SO4. Group two: Purulla, El Peinado, Negra, Verde, and San Francisco are also marked by high relative concentrations of Cl but have higher Ca++ and Mg++ concentrations than the first group. The third group of wetlands is marked by substantially higher relative concentrations of HCO3 and SO4, and include Alumbrera, Antofagasta, Azul, and Los Aparejos. Three of these are the freshest wetlands sampled (<5 mS cm−1), and the other is much saltier (~75 mS cm−1). Alumbrera and Antofagasta, which comprise the extensive wetland complex at the terminus of the large Punilla River, show very similar characteristics, being dominated by relatively high HCO3 and SO4 but lower relative Cl, Ca++, and Mg++ concentrations. Azul is like these lagoons but contains higher SO4 and much higher Mg++. Los Aparejos appears to be more like group two than the fresher lagoons mentioned above but substantially lower in SO4.
Our analysis of climatic and hydrological conditions in this region revealed 14 distinct basins or watersheds encompassing the 21 wetlands in this study (Figure 5). Decadal-scale changes in climatic and hydrological conditions within these large internally drained basins provide an effective estimate of the natural drivers of recent hydrological changes in these wetland systems. In the case of Azul, Cortaderas, and Aguas Dulces, the domains used are subwatersheds of larger basins, and in the case of Cabi, a small wetland on the edge of the Grande Basin, its watershed area is too small to assess independently; therefore, we use the Grande basin as a representative of the conditions there. Temperatures since 1985 have increased substantially across the entire region. Every basin has recorded a temperature increase of at least 0.45 °C. Basins in the eastern and northern parts of the study area have seen an increase of between 0.55 and 0.65 °C with the largest increase observed in Archibarca and Caro (Table 2). Precipitation has broadly decreased across all wetland areas, with the smallest decreases observed in the northeastern region of between 9% and 12%. The most significant decreases are in the southern and westernmost regions of between 14% and 22%. Since a major region-wide drought has been identified since the mid-2000s, these changes are likely in large part a reflection of the relative depth of this drought across the study area. In terms of hydrological changes, in this case, represented by the change in vegetation cover, there is a wide distribution of relative changes. The western and southern wetlands (El Peinado, Tres Quebradas, Negra, Azul, and Las Tunas) as well as the highest elevation wetland, Diamante show large increases in total vegetation cover since the 1980s and 1990s with a range of between 12% and 53%, with the highest values in the Tres Quebrada basin. In contrast to this, many of the wetlands show a substantial decrease in vegetation cover from −10% to −31%. Particularly notable decreases were observed in the northern and eastern wetlands, where Archibarca, Antofagasta, Hedionda, Grande, and Cabi as well as the central basins San Francisco and Aguas Dulces all registered decreases in the vegetated area of >15%.

3.2. Biological Communities’ Characterization

Three flamingo species, Phoenicoparrus andinus, P. jamesi, and Phoenicopterus chilensis, were recorded in the study area during the sampling periods; however, their abundances were variable among wetlands and across years (Table 3). Flamingo abundance for all species among years was variable in some wetlands (e.g., San Francisco, Las Peñas, Aguas Dulces, and Archibarca) while appearing more stable in others (Carachi Pampa, Grande). Phoenicoparrus jamesi was the most abundant in Grande, where numbers were >12,000 in all years. This species was the most abundant in Los Aparejos, Hedionda, and Las Peñas. For P. andinus, numbers fluctuate less across years in San Francisco, Purulla, Negra, and Archibarca. P. chilensis numbers were very low in the study area considering a global population of >500,000 individuals. Las Peñas wetland consistently had P. chilensis present.
The Kruskal–Wallis test showed statistically significant differences among wetlands for the three species (H = 34.66 p < 0.001). These differences were for P. jamesi vs. P. andinus and P. chilensis and between P. andinus vs. P. chilensis (Mann–Whitney test, p < 0.001). When the temporal tendencies of the abundances between 2010 and 2020 were explored with the Mann–Kendall test, a statistically decreasing trend was detected for P. chilensis (Z = 3.42 p < 0.0001), notable since the year 2015. No tendency was seen for the other two flamingo species (p > 0.05) (Supplementary Material, Figure S1. Spearman correlation among all measured environmental variables and P. jamesi (n = 13) in wetlands with high variability among years (Alumbrera, Azul, Los Aparejos, and San Francisco) revealed a positive statistically significant correlation with Bacillariophyta (Rho = 0.71 p = 0.006), which showed a negative correlation with water level (Rho = −0.72 p = 0.02). A statistically significant positive correlation was found between P. andinus abundance and conductivity (n = 11, Rho = 0.87 p = 0.01) which showed a marginally significant correlation with the area of the wetlands (Rho = 0.53 p = 0.06).
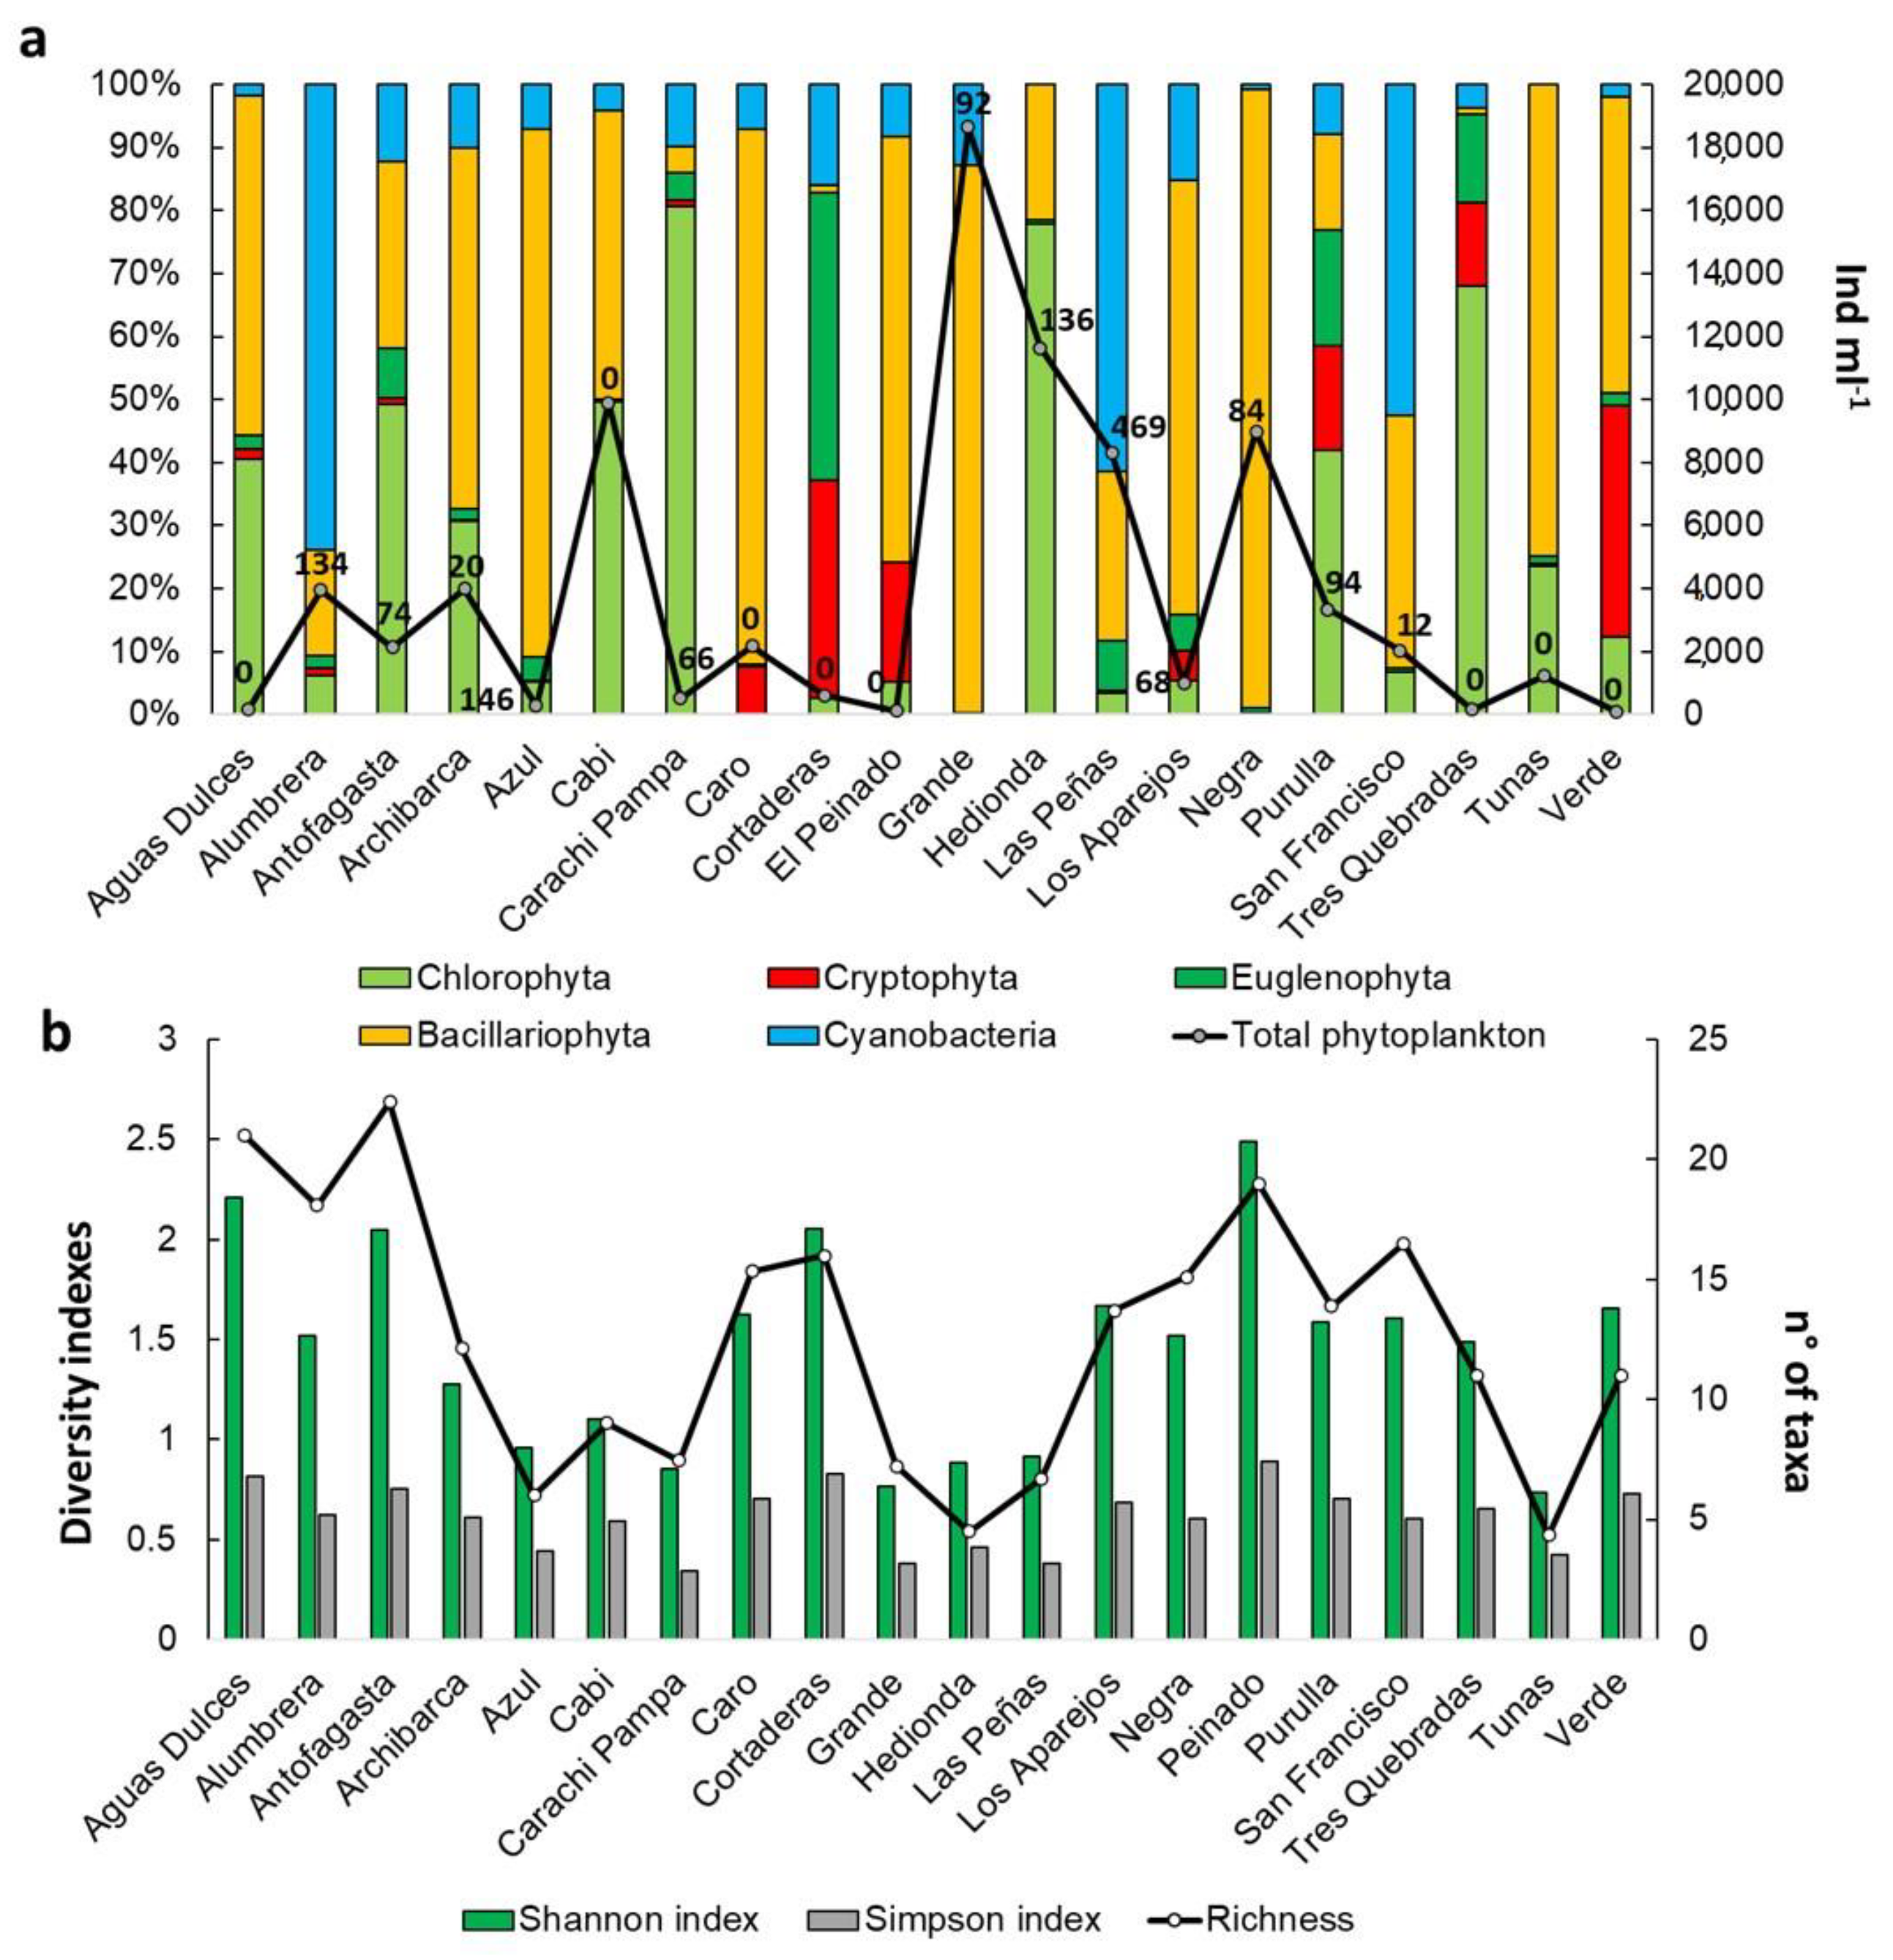
For phytoplankton species, richness ranged between 3 and 20 species recorded for each wetland. Bacillariophyta species, especially from the genera Navicula, and Nitzschia, were the most frequently recorded. For Chlorophyceae, Monoraphidium and Chlamydomonas were the best-represented genera. For the other groups of algae, Cryptomonas (Cryptophyceae), Lepocinclis, Euglena, Trachelomonas (Euglenophyceae), and Synechocystis, Oscillatoria, Phormidium (Cyanobacteria) were the most representative. The assemblage tends to be dominated by Bacillariophyta, followed by Chlorophyceae and occasionally by Cyanobacteria. Density registered for phytoplankton was highly variable across wetlands with the highest values recorded in Grande, Cabi, and Las Peñas (maximum median values recorded = 18,635 ind mL−1) and the lowest in Azul, El Peinado, and Tres Quebradas, with 107 ind mL−1 on average (Figure 6a). The high abundances found were attributed to Bacillariophyta which was the dominant group solely in Grande. The Shannon diversity index showed low values for these wetlands, always <3, and variable dominance values among wetlands (above 0.6 and 1). Alumbrera, Antofagasta, and Aguas Dulces reached the highest values and Hedionda and Las Tunas the lowest (Figure 6b). The Kruskal–Wallis analysis showed differences in total phytoplankton density among lakes (H = 30.49 p = 0.04), showing statistically significant differences between Grande and Antofagasta, Aparejos, and Azul (p < 0.05 in all cases).
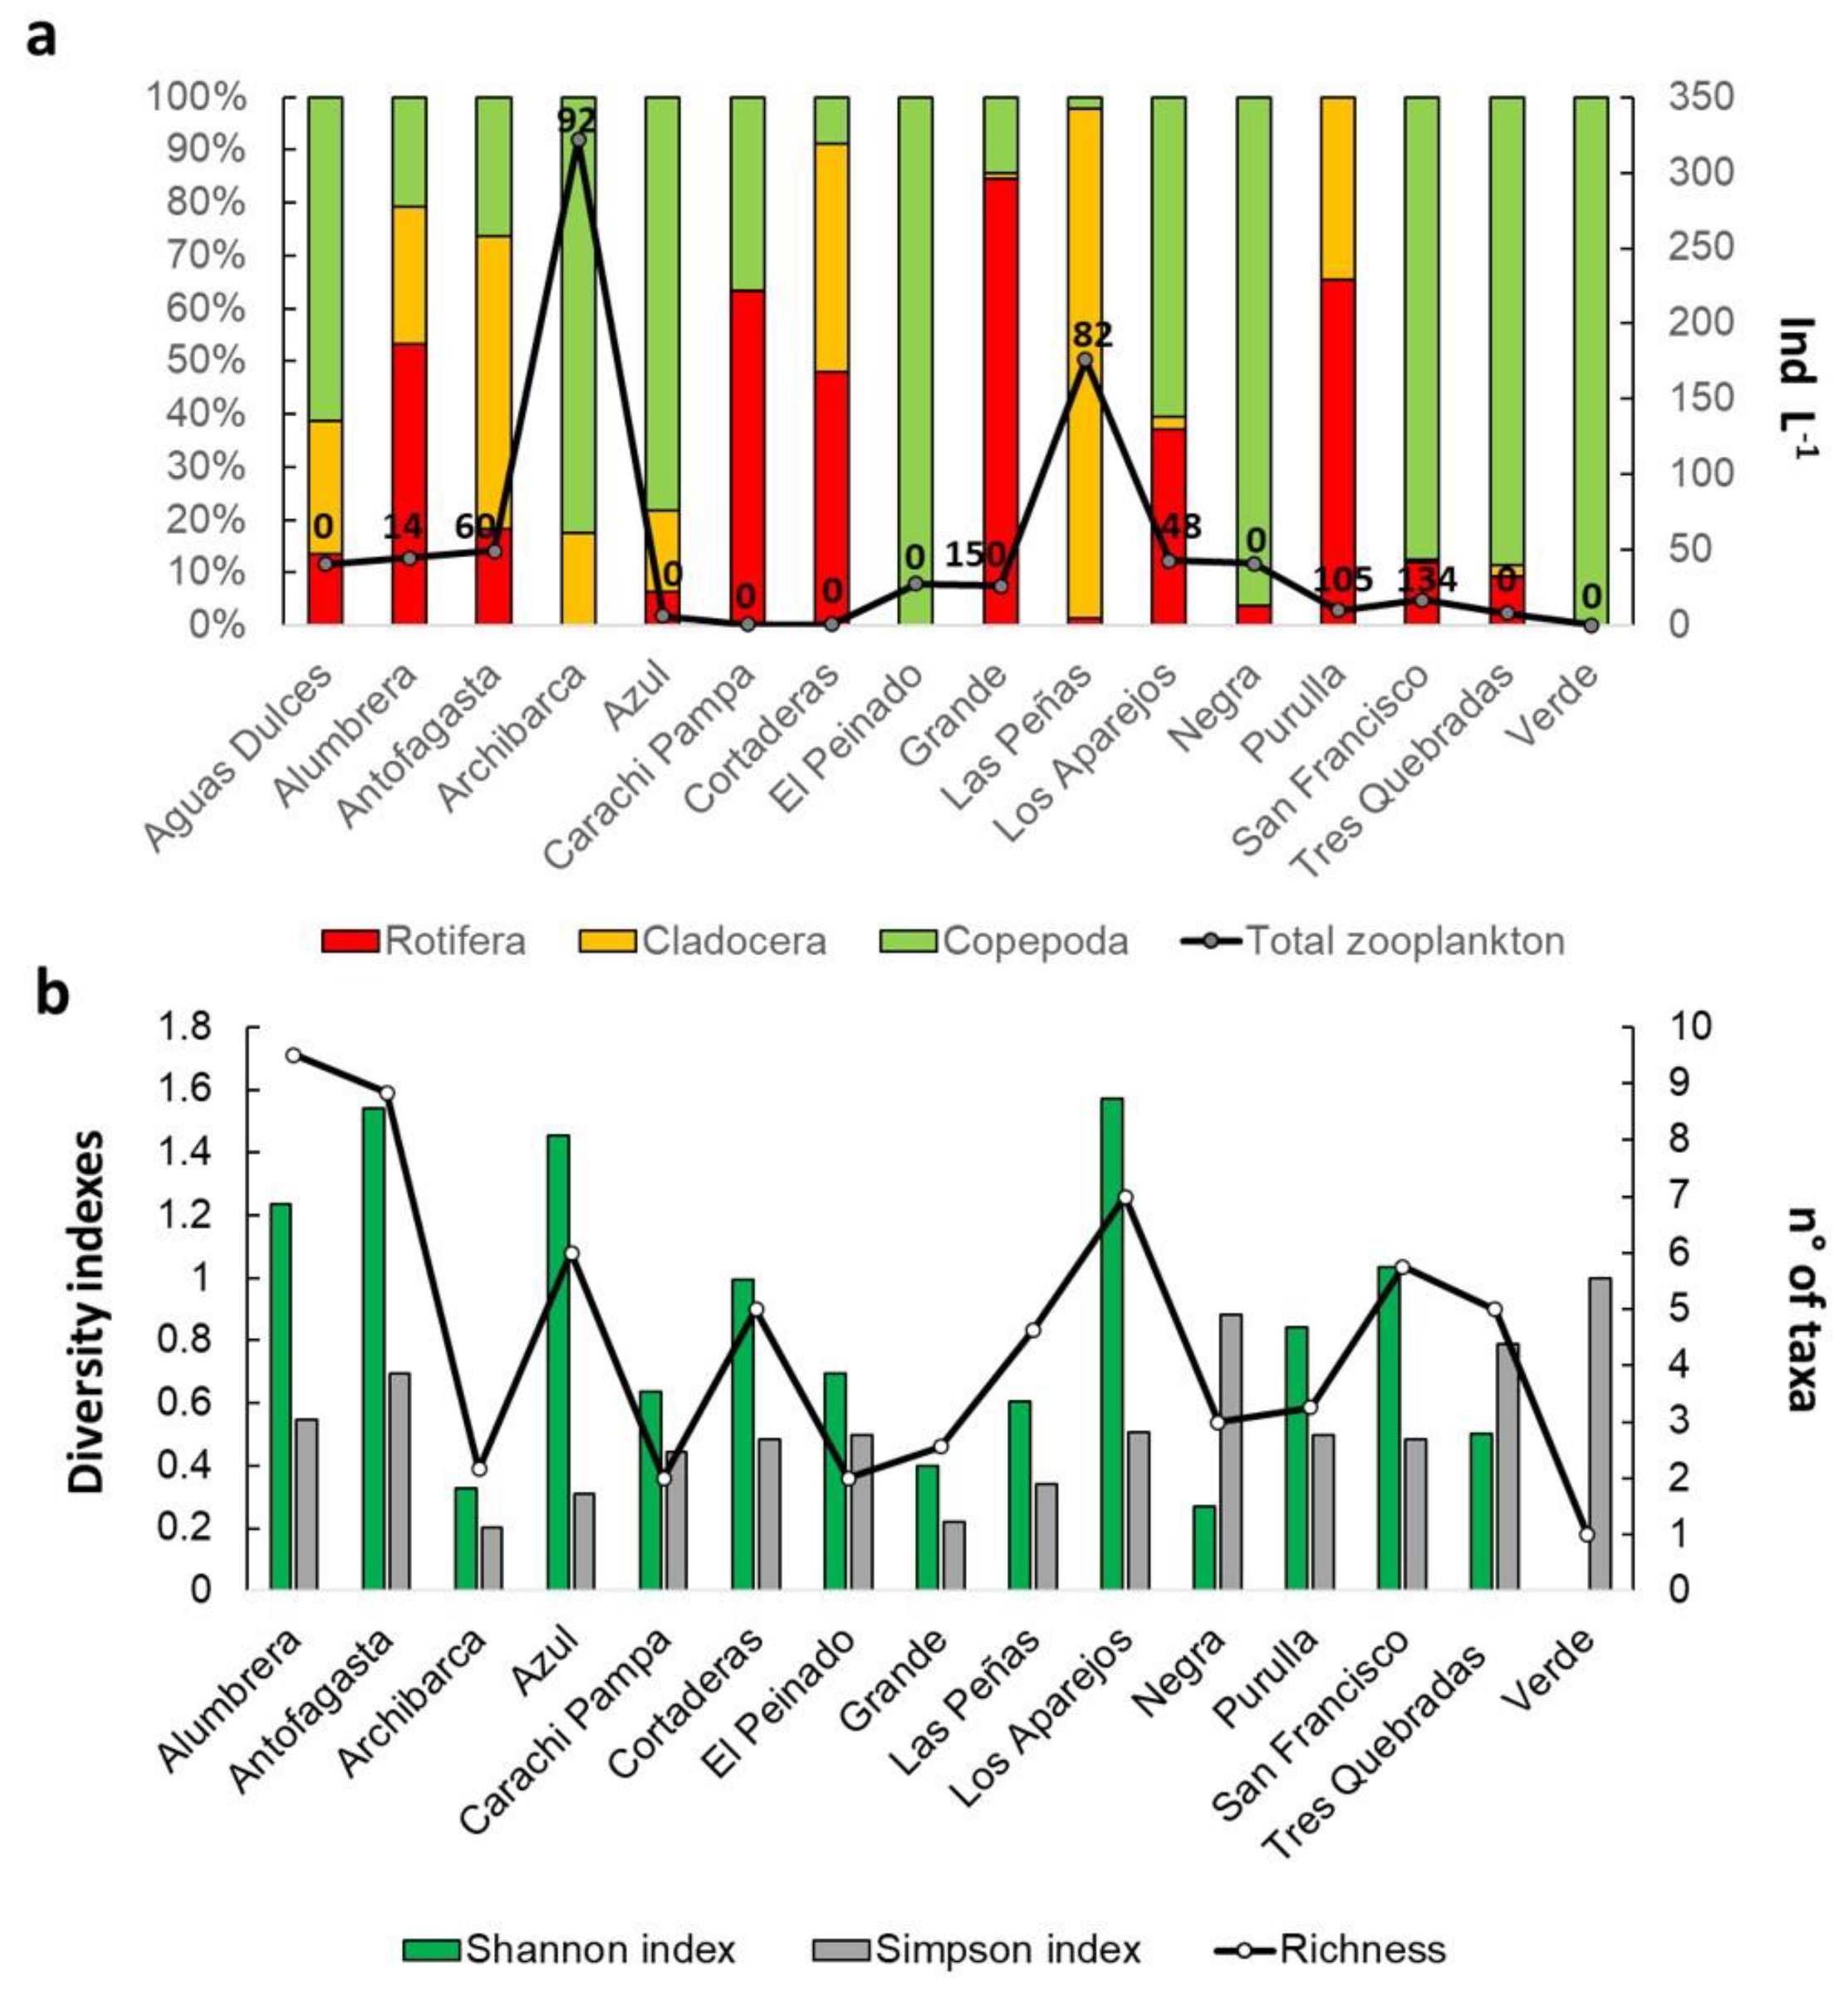
Zooplankton showed a similar pattern to phytoplankton, with between one and five species recorded for each lake and assemblages alternatively dominated by Copepoda, or Rotifera. Alona (Cladocera), Lecane, Keratella, Brachionus, and Boeckella (Copepoda) appeared as the most frequent genera. The density recorded for the different wetlands was, in general, low (median values of 10 ind L−1), with Archibarca and Las Peñas being the exceptions (321 and 176 ind L−1, respectively) (Figure 7a). The Shannon diversity index showed low values (<2) and highly variable values of dominance for the lakes sampled (between 0.2 and 1). Antofagasta, Alumbrera, and Azul had the highest richness values while Verde had the lowest (Figure 7b). The Kruskal–Wallis analysis showed no differences in density among wetlands (H = 20.37 p = 0.11).
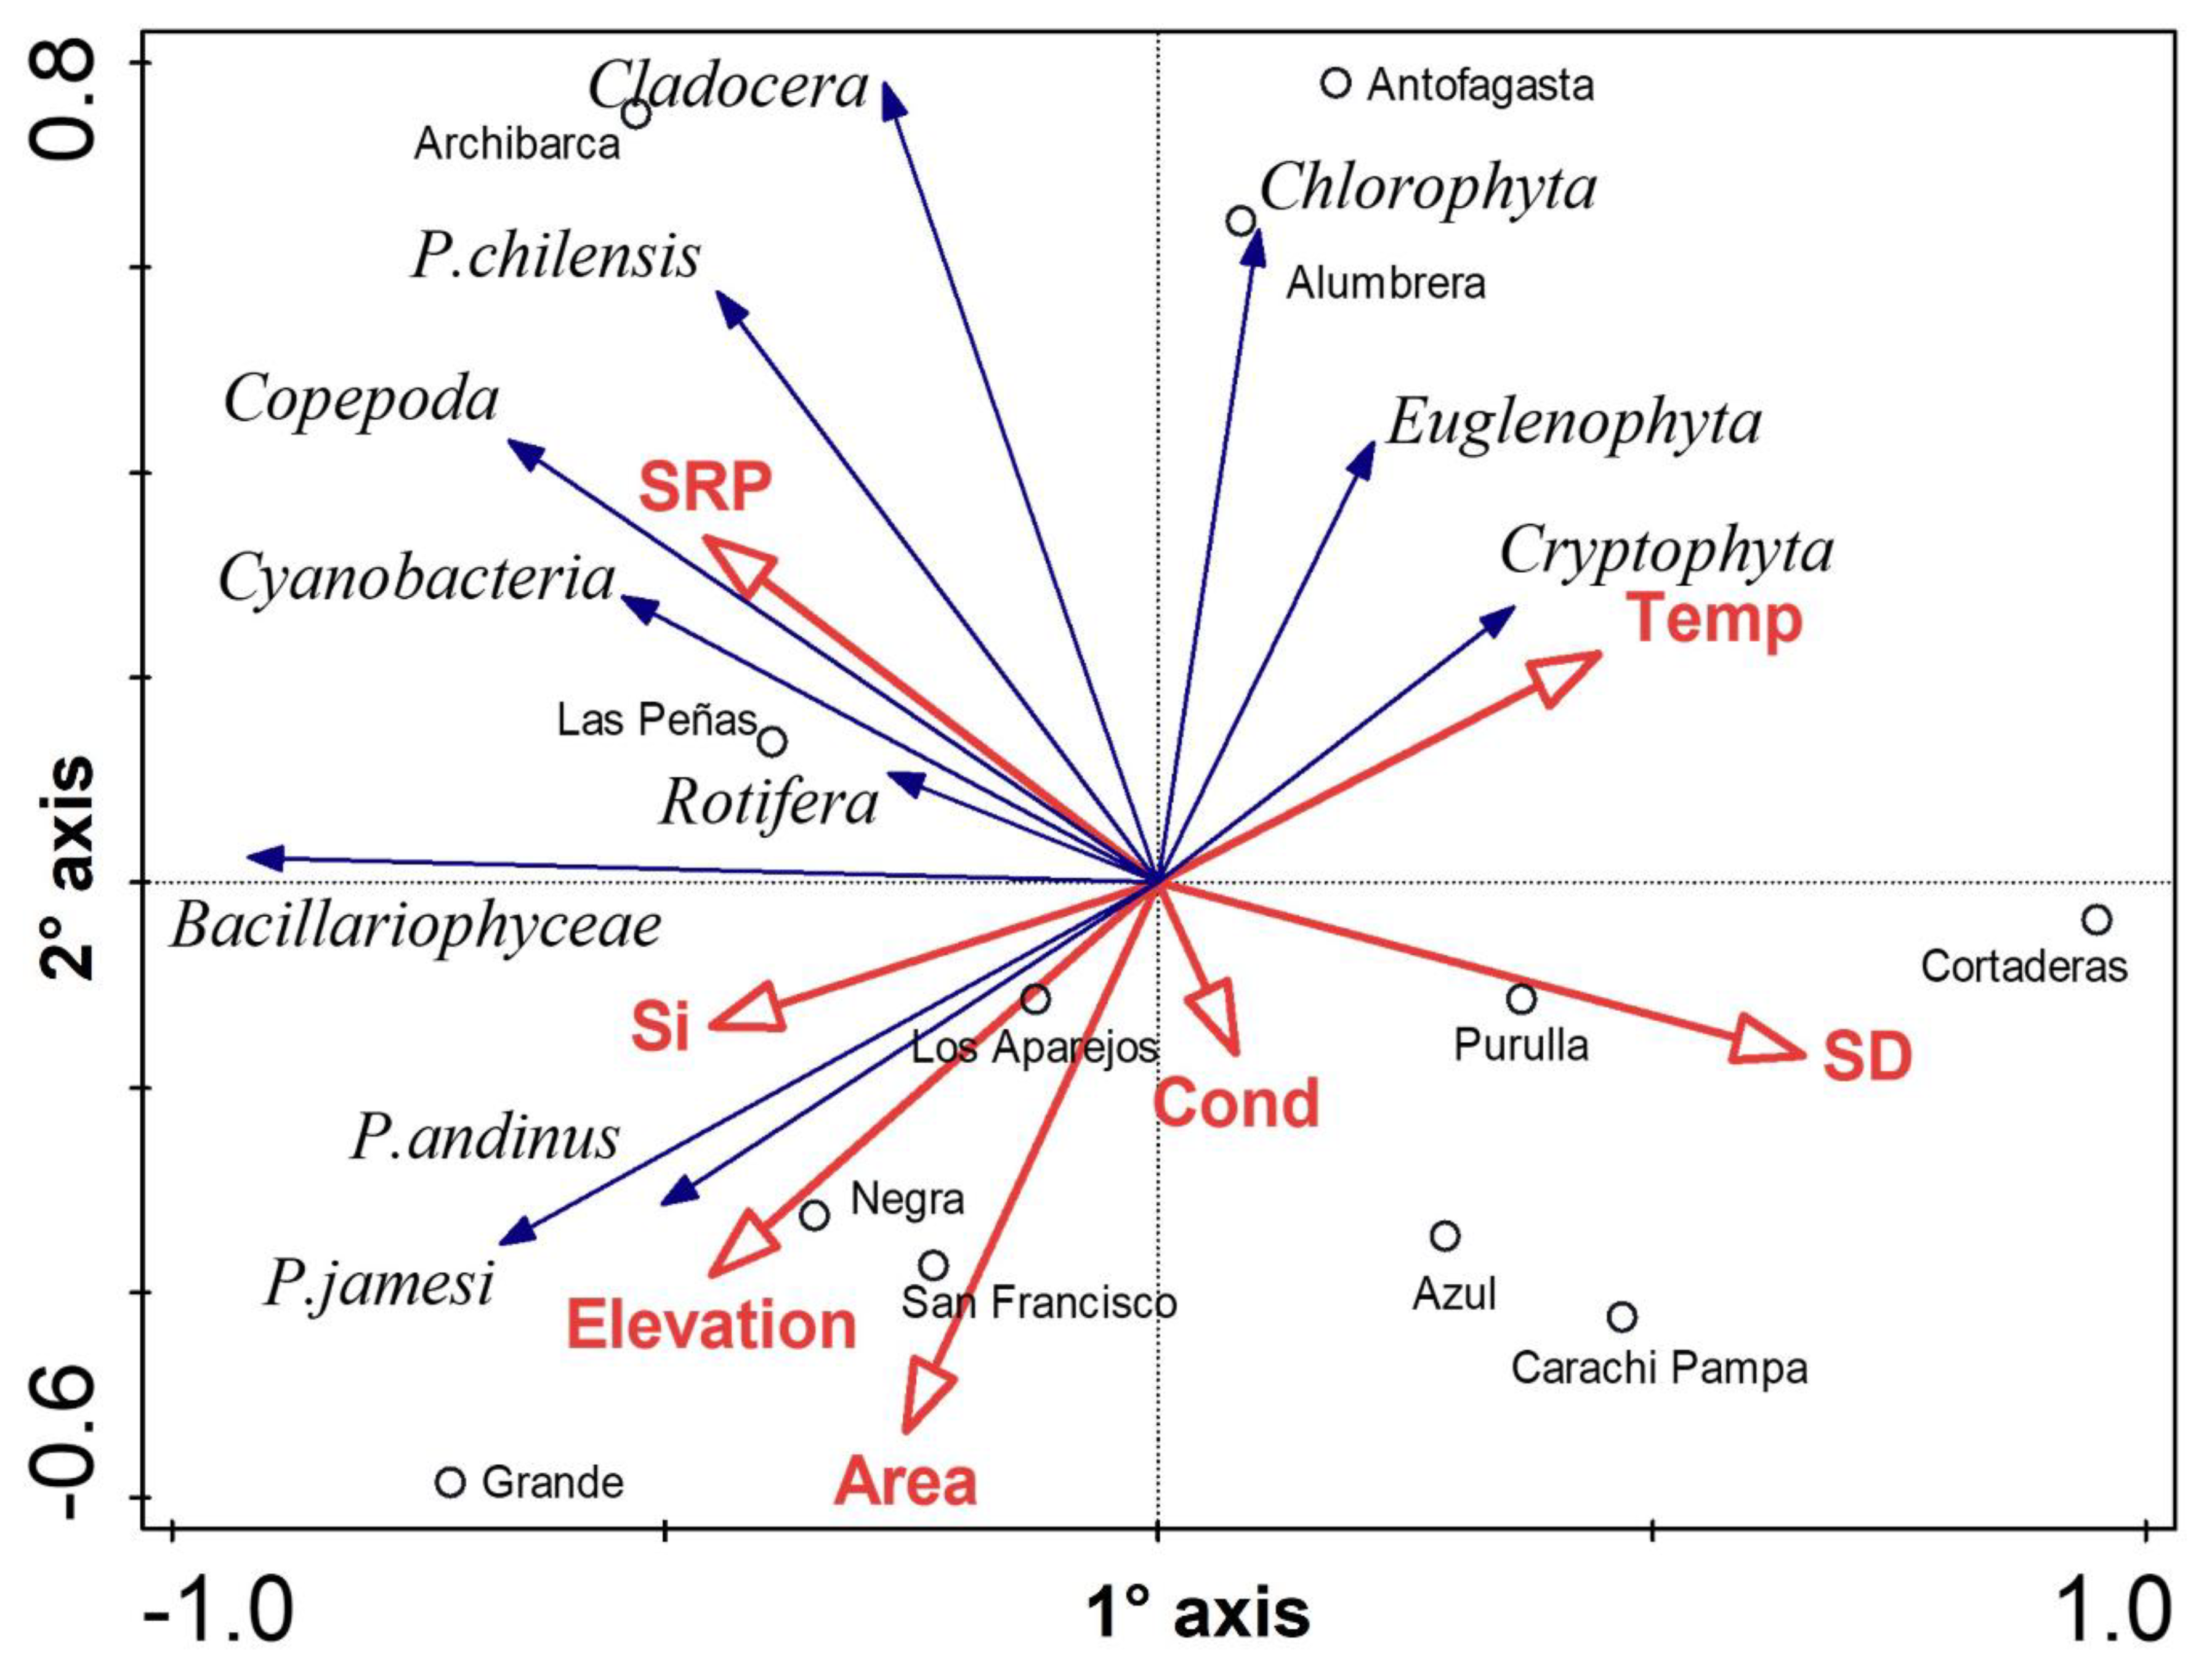
The RDA analysis explained 29.85% of the total variance (F = 1.8 p = 0.01), with the first two axes retaining 71.5% of the total variation. Both P. andinus and P. jamesi were associated with the highest elevation and area wetlands with higher abundances of Bacillariophyta, particularly in Grande, Los Aparejos, Las Peñas, and Negra. Bacillariophyta were positively correlated with higher concentrations of SRP and Si availability. Conversely, P. chilensis appeared associated with Copepoda and Cladocera (zooplankton groups), which were also more associated with other algae groups, such as Cyanobacteria and Chlorophyceae. Euglenophyceae and Cryptophyceae were correlated with higher water temperatures, higher conductivity values, and Secchi transparency while Chlorophyceae tend to be restricted to low-conductivity wetlands and low nutrient concentrations. Rotifera was a group poorly represented in the ordination (Figure 8).

4. Discussion

Across the Altiplano, most aquatic ecosystems remain poorly described in detail, limiting our ability to understand their ecological importance and sensitivity to human impact. Here, we describe several trophic levels (phytoplankton, zooplankton, and flamingos) along with several limnological and hydroclimatological features for a set of wetlands of a poorly studied region in the High Andean Plateau of Argentina undergoing rapid change from anthropogenic drivers such as climate change and industrial mining development.

4.1. Geological, Hydrological, and Climatological Features

The ecosystems sampled were highly variable in their surface area, the largest being often co-located with salars (evaporite deposits). Most of them (71%) were located at very high elevations, above 3900 m.a.s.l. Owing to the hyperarid climate conditions on many of the floors of these basins, most of the wetlands (67%) were composed of saline or even brine surface water bodies. These conditions are attributable to the rapid uplift of the plateau and progressive orographic-induced aridification, and its location along the Tropic of Capricorn subtropical high belt [88].
The registered nutrient concentrations also appear highly variable among wetlands sampled, with some lagoons such as Archibarca, Cabi, Caro, Hedionda, Peinado, and Las Peñas registering the highest mean values of DIN and SRP. In a similar system of wetlands in the Atacama Desert (Chile), higher nitrate concentrations were attributed to local windblown salts containing nitrate formed by sun UV ray oxidation of nitrogen in the atmosphere or to dust from other nitrate deposits [89]. In some wetlands, such as Archibarca, Cortaderas, and San Francisco, DIN was a limiting nutrient for phytoplankton with values below 100 ug L−1, while SRP always registered values above 10 ug L−1, suggesting it was not limiting [90]. In addition, the DIN/SRP ratio (always < 10) suggested that DIN was the limiting nutrient for those wetlands where data were available during samplings. These results are consistent with those reported for other saline systems around the world e.g., [91,92,93,94]. The high variability observed could also be related to fluctuation in hydrological conditions that induce changes in nutrient inputs; therefore, the variations in hydrological conditions are a critical control in semiarid to hyperarid areas, where surface water levels fluctuate seasonally and interannually [95,96]. The wetlands surveyed in our study tend to be very shallow (<1 m in depth), but they experience high variations in water surface area across seasons and years. Decreases in water volume through evaporation result in increases in salinity and nutrient concentrations due to the accumulation of ions [4]. The high values of Si found in most wetlands, and particularly in Grande, Cortaderas, Las Peñas, San Francisco, and Hedionda, are consistent with the tectonically active region and vast exposures of young volcanic rocks [97,98].
The variability in salinity across wetlands is quite dramatic, even between nearby wetlands. Alumbrera and Antofagasta, the freshest of the lagoons sampled, can be explained because both are fed by the Punilla River, a large river through which recent rainwater and snowmelt are efficiently transported toward the basin floor. However, the other wetlands tend to be mainly fed by groundwater recharge and are rich in bicarbonate, sodium, and potassium, which tend to concentrate and precipitate when they reach the surface through springs (here known as vegas and bofedales). This process is fundamental to the creation and maintenance of salars such as Carachi Pampa or Tres Quebradas, where the formation of thick evaporite sequences primarily of halite (NaCl) and dense brine groundwaters require the persistent concentration of salty water close to the surface e.g., [19,99]. For the other wetlands, such as Negra, Grande, or Purulla, variations in salinity of surface waters can be attributed to several processes, including dissolution of old salts, thermal water contributions, evaporative concentration, and mixing between old saline groundwater, and less saline recently recharged or direct meteoric water [89]. For almost all the wetlands sampled, we found high water transparency, with light reaching the bottom of the water body during sampling, especially in Cortaderas and San Francisco. This pattern emphasizes the shallow water column of these ecosystems (<1 m), which contrasts with lakes from areas of the world at similar high elevations, often of glacial origin [100,101].
Our analysis of major ion compositions in these waters provides valuable insight into the distinctions between these wetland systems based on the interactions of inflow waters (meteoric, streamflow, and groundwater), evapoconcentration, and mineral precipitation. The largest group is dominated by Na+, K+, and Cl reflecting highly geochemically evolved systems. The surface water in these wetlands is sourced from inflow waters that have undergone substantial evapoconcentration along their flow paths and in the water body itself. This group contains two of the saltiest surface waters measured in this work (100 and 230 mS cm−1). The second group is also quite evolved but contains higher proportions of Ca++ and Mg++, indicating a distinct geochemical pathway of inflow waters. The other wetlands display some unique geochemical characteristics but can be described primarily as less evolved versions of the other two groups. Alumbrera and Antofagasta, fresh wetlands upgradient of the massive Carchi Pampa basin floor appear to be diluted versions of the waters that feed Carachi Pampa. The primary difference between these systems is that these fresh, upgradient wetlands contain substantial HCO3 and SO4. In these hyperarid to arid evaporite-forming systems, as waters progressively evaporate under intense insolation, first carbonate, then gypsum precipitate leaving very little of these ions in the remaining water [64]. At least from a geochemical perspective, these systems represent two end-member wetland systems but appear to be of highly similar source waters and flow paths. A similar case can be made for Azul, Los Aparejos, and Negra, which reside in adjacent basins, where Los Aparejos represents an intermediate composition but appears to have similar hydrogeological characteristics. This is consistent with basins on the Chilean Altiplano and the Salar de Atacama where dense brines can be explained through the intense and progressive evapoconcentration of much fresher inflow waters near the basin floors either as groundwater exiting the ground from long flow paths or ephemeral flow from precipitation events [21,22,102].
Several important observations can be drawn from our hydroclimate analysis. First, there is a substantial temperature increase at every basin over the last several decades, which is consistent with the effects of global climate change predictions for this region [30]. Increasing temperatures have likely increased overall potential evaporation and transpiration in these wetland ecosystems, perhaps contributing to some of the changes seen in vegetation cover over the same period. Basins with the highest temperature increases also show the strongest declines in vegetation cover, and wetlands with the largest increases in vegetation cover generally show lower temperature increases. Previous studies examining carbon exchange in peatlands show that soil temperature and moisture conditions are well coupled to carbon losses (plant respiration and soil decomposition) and carbon uptake (plant productivity) at an ecosystem level [103,104]. It has also been recently suggested that these ecosystems play an important role in controlling microclimates [11,12]. Though quantifying this impact requires further study, this may be a critical tangible and rapid effect that climate change is having on these wetlands. Changing precipitation patterns have likely come along with increasing temperature. Recent research has shown that this may be currently manifesting in South America by shifting the seasonal monsoon southward, leading to an increase in frequency and magnitude of significant precipitation events on the plateau while also increasing interannual variability [105,106,107], resulting in increases in frequency and magnitude of large precipitation events but also more pronounced drought periods. Indeed, a major drought has been documented in the region since the mid-2000s and is likely ongoing [108,109]. It is important to incorporate these two climate-driven phenomena into any hydrological or ecological assessment of the region. The changes in basin-scale hydroclimate we describe here can provide a valuable insight into the characteristics of response to natural conditions in each unique system and by extension, current impacts from or potential vulnerability to non-natural disturbances.
The strong decrease in precipitation across all these wetlands is likely primarily due to the ongoing effects of the drought. However, a pronounced regional distinction exists in the magnitude of this decrease, with basins in the southwest showing about double the decrease as those in the northeast. This may be due to the relative proximity of these basins to the dominant moisture source (from the northeast) and/or differences in the magnitude of large events within these basins over the last 5–10 years. The distribution of these large events may also be an important factor in determining the changes in vegetation area in these wetlands. There is increasing evidence of the importance of wetlands as regulators of the local water balance [110,111]. However, we still have little evidence of the effects that these changes in vegetation, through their effects on infiltration and water retention, may have on flamingo distribution patterns and plankton structure (through water level changes, ion concentration, or even modifications in nutrients availability).
Recent research in the region has shown that large precipitation events, which generally occur over only a few days can have a major and lasting influence on wetland surface waters and vegetation extent [112]. In the Tres Quebradas basin, the largest increase in vegetation may also be partially explained by the contribution of increased meltwater from the only glaciers in the region at Monte Pissis and Ojos del Salado [113,114]. These changes in local precipitation and ephemeral flow paths (days to months’ time frame) are likely a dominant factor in whether a wetland has grown or shrunk over the last few decades, especially in higher elevation systems with smaller contributing areas.
Another pattern that can be garnered from the distribution of these hydroclimatic changes is the potential importance of the buffering effect that large-scale, old groundwater flow can have on these wetlands. An assessment of the isotope tritium in several of these lagoon waters made by Moran et al. [115] shows that most water flowing through these basins and sustaining these wetlands is old water (at least 70 years old). In this arid environment, fluxes of recent precipitation at the surface or shallow subsurface are spatially rare, but they become focused on specific locations where water tables remain near the surface such as near large rivers such as the Punilla or small perennial streams, bofadeles at high elevations, or vegas near the margins of wetlands. Although large vegetation changes are observed across the region, most of them can be attributed to the differences in precipitation change from southwest to northeast and the relative amount of the aforementioned old water making its way to these wetlands. Lagoon waters at the floor of the largest and deepest basin (Carachi Pampa) show zero tritium activity, indicating it is sustained nearly entirely by old groundwater. This wetland shows less vegetation cover loss than the wetlands upgradient of it. Since this wetland and others like it (such as Purulla) are likely fed by some of the longest and oldest flow paths in the region, its consistent inflow may buffer this system against the yearly to decadal term climate fluctuation experienced at other wetlands. This concept has important implications for assessing the relative response of individual wetlands in this region to natural change and, therefore, their resilience to potential human impacts such as mining and agricultural activity in the area.

4.2. Biological Communities’ Characterization

Flamingo abundance and distribution across wetlands were more highly variable than almost all the variables considered in this study. The three species of flamingos make itinerant use of these wetlands, changing their distribution according to food availability. Phoenicopterus chilensis occurs in a wide variety of wetlands, including freshwater and salt lakes, estuaries, and marine coasts from Peru to southern Argentina. It is also distributed from Chile to southern Brazil and Uruguay [55,116,117]. Phoenicoparrus andinus and P. jamesi are primarily restricted to wetlands in the high Andean plateau of Argentina, Bolivia, Chile, and Peru, although a portion of P. andinus population disperses to lowland wetlands in central Argentina during winter, especially when the Andean lakes freeze [53,118]. Phoenicoparrus jamesi have been recorded in lowland wetlands in central Argentina [119,120].
Grande is an important wetland for P. jamesi, where between 12,000 and 18,000 individuals representing >10% of the global population were recorded. Higher densities of Bacillariophyta (diatoms) were also found in Grande across samples. Grande, Hedionda, and Cortaderas had the highest concentration of Si, a primary element to produce the frustule (cell wall) of diatoms [121,122]. Diatoms also appeared to be controlled by SRP availability, a nutrient that can be rapidly mineralized by flamingos through their feces, constituting a perfect cycle [123]. Indeed, several studies indicate that flamingo distribution is influenced mainly by food abundance and quality e.g., [124,125], which would explain the high numbers of P. jamesi in Grande, where the highest density of diatoms has been recorded across years compared with the other wetlands sampled. P. jamesi numbers were highly variable in Los Aparejos, Purulla, Las Tunas, and Las Peñas across years, and positively correlated with diatom abundance, which in turn was negatively correlated with the water level of these wetlands. This suggests that increases in water levels in these wetlands negatively affect diatom abundance and therefore food availability.
P. andinus occurred in lower abundance, distributed in several wetlands including Archibarca, Purulla, and San Francisco. Phoenicopterus chilensis occurred mainly in Alumbrera, Antofagasta, El Peinado, and Las Peñas, all low to middle-high conductivity wetlands. Phoenicoparrus jamesi and P. andinus feed mainly on diatoms, while Phoenicopterus chilensis has a broader diet including cyanobacteria, insect larvae, and microcrustacean [126,127,128]. Our analysis shows that both species (P. andinus and P. jamesi) abundance is linked to diatoms, and P. chilensis numbers are linked to large zooplankton (Cladocera and Copepoda) and other algae groups. The evidence does not suggest that flamingos are a controlling factor of plankton abundance in these wetlands, as was concluded in Frau et al. [46]. However, an experiment performed by Hurlbert and Chang [126] suggested that P. andinus may influence benthic structure (invertebrates and diatoms), at least locally; therefore, new in situ experiments are necessary to elucidate the grazing impact that flamingos may have on the plankton structure in these kinds of wetlands. While the global population of the Chilean Flamingo appears to be stable or increasing [55], P. chilensis numbers in the wetlands censused during this study decreased. Therefore, further studies to determine if P. chilensis abundance is responding to habitat degradation based on increased human impacts or a consequence of natural cycles in the ecological conditions of these wetlands.
The plankton composition and distribution among the wetlands studies was highly variable. A pattern frequently attributed to salinity and to chemical and temperature gradients that occur within and between these kinds of wetlands [43]. Despite these highly variable patterns registered, the phytoplankton assemblage tended to be dominated mainly by Bacillariophyta (diatoms) as several other studies have reported in similar areas [129,130,131]. The dominance of genera, such as Navicula and Nitzschia, both tychoplanktonic algae (adapted to live in stirred waters), is also consistent with several floristics reports [20,36,132,133] in similar environments from the northern part of Argentina. Diatoms were primarily related to silica and SRP availability and middle to high conductivity values. However, some other studies have reported that diatom abundance may be also related to ionic composition [44,134]. Taxonomic affiliations to the species level are difficult. In the Andes region, numerous endemisms comprising a characteristic flora with frequently new species described in several of these reports e.g., [135,136]. For this reason, making this kind of association between ions composition and diatom species could be difficult to reach.
Chlorophyceae was the second most dominant group of algae, frequently represented by just one or two volvaceans species, linked to low nutrient availability and a broad conductivity spectrum, ranging from very low conductance lakes (Antofagasta) to highly saline ones (Tres Quebradas). Less represented groups, such as Euglenophyceae and Cryptophyceae, were generally restricted to high conductivity wetlands and were not in high densities. Their low representation is consistent with what is reported previously in similar environments [137]. It has been speculated that the relative absence of euplanktonic species might be due to the strong UV pressure on these very high lakes [43], with, however, few reports that corroborate this hypothesis e.g., [138]. Remarkably, the presence of euglenoids in saline lagoons has been reported by other authors [40,139,140], indicating that many Euglenophyceae species could be euryhaline or have a broad salinity tolerance.
Cyanobacteria appeared only occasionally and with middle-low densities in Alumbrera, Las Peñas, and San Francisco. In 2013, we recorded a cyanobacteria bloom in Alumbrera dominated by Chroococcales species, which was consistent with potential wastewater infiltration from a nearby plant. No other cyanobacteria blooms were detected since then. Alumbrera has also been increasingly intensively used for livestock (mainly domestic South American camelids), which congregate near the shore of the lake. In recent decades, an increase in urban and agricultural uses of high-elevation wetlands has become more common in the inter-Andean valleys, although the effects of nutrient enrichment on biological communities have not been deeply studied in arid or semiarid zones [95]. Special attention should be given to Alumbrera, a wetland providing services to the town of Antofagasta de la Sierra, to develop sustainable restoration measures and not repeat the eutrophication problems reported by other authors in similar high-elevation ecosystems [141,142,143].
Our results show that zooplankton was not well represented in species richness or abundance in the Andean plateau wetlands, a pattern that is consistent with the findings of other authors in similar extreme ecosystems, who also conclude that conductivity gradients mainly control zooplankton in these systems [144,145,146,147]. Occasionally, one copepod species, Boechella popoensis appeared dominant in Archibarca and Las Peñas—a pattern already described by other authors in high elevation saline wetlands from South America [4,143,148]. However, the general tendency was for low-density values of all groups, especially for Rotifers, which were well represented in species but not in abundance. The genera found to be dominant, such as Boeckella, Cephalodella, or Brachionus, have been reported as saline tolerant in previous studies [145,149,150], which is consistent with the information reported here.

5. Conclusions

This study presents a dataset gathered over ten years and a much broader climatological analysis from 1985 that provides a baseline of the physical-chemical, hydroclimatological, and ecological components and their interactions among a group of high-elevation Andean wetlands. We found that these wetlands are highly variable in salinity (from freshwater to brine), reach high nutrient concentrations, and are very shallow. Our analysis of the geochemical composition of surface waters in these wetlands showed strong distinctions between several groups of wetlands and strong connections across large distances, indicating important regional groundwater connections exist. We also found that these long regional flow paths containing very old water may buffer some wetlands against decadal-term climate variations. Regarding flamingos, P. jamesi appears as the dominant species in the study area, primarily because of the high numbers in Grande, and phytoplankton tends to be dominated, in general, by diatoms, while zooplankton is poorly represented. Both plankton groups tend to have low species richness and highly variable abundances among wetlands. The climate is arid, and the general tendency observed in the last decades is increasing air temperatures and decreasing rainfall, with two different trends being observed regarding hydrological responses in the wetlands. One set of wetlands has seen an increase and the other a decrease in the aerial extent of living vegetation. Our data suggest that much of the changes in vegetation patterns are in direct response to the observed climate changes; however, we have no evidence yet of how these changes may affect flamingo and plankton communities. In further studies, we should investigate the effects of these tendencies on the main trophic structure of these wetlands (plankton and flamingos), considering the crucial role that vegetation has in the microclimates of these endorheic basins and, therefore, in the water cycles of these wetlands. In sum, our results suggest that all these wetlands sampled are highly variable and can change rapidly; therefore, further efforts to understand how they function are critical to prevent their degradation and secure the valuable environmental services they provide.

Supplementary Materials

The following are available online at https://www.mdpi.com/article/10.3390/hydrology8040164/s1, Figure S1: Total number of flamingos from the three species recorded reported on each wetland censured from years 2010 to 2020, Table S1: Wetlands sampled and limnological sampling dates, Table S2: Summary of dissolved major ions in surface waters.

Author Contributions

Conceptualization, D.F. and B.J.M.; Methodology, D.F., B.J.M. and P.M.; Formal Analysis, D.F. and B.J.M.; Investigation, D.F., B.J.M., F.A. and P.M.; Resources, P.M., F.A., B.J.M., Y.B., C.M., R.M. and G.M.; Writing—Original Draft Preparation, D.F., B.J.M. and F.A.; Writing—Review & Editing, D.F., B.J.M., P.M., F.A., Y.B., C.M., R.M., G.M. and D.F.B.; Funding Acquisition, P.M., F.A. and B.J.M. All authors have read and agreed to the published version of the manuscript.

Funding

This research received funding from the Disney Wildlife Conservation Fund, BirdLife International, and the US Fish and Wildlife Service.

Acknowledgments

We especially want to thank M. Mosqueira, G. Nuñez, and R. Clark for their valuable help with the fieldwork. As well as Lee Ann Munk and Jordan Jencks for their invaluable assistance in collecting the hydrogeochemical data and Sarah Mcknight and Jordan Jencks for their advice and assistance in refining data extraction from Google Earth Engine.

Conflicts of Interest

The authors declare no conflict of interest.

References

  1. Allmendinger, R.W.; Jordan, T.E.; Kay, S.M.; Isacks, B.L. The evolution of the Altiplano-Puna plateau of the Central Andes. Annu. Rev. Earth Planet. Sci. 1997, 25, 139–174. [Google Scholar] [CrossRef]
  2. Jordan, T.E.; Nester, P.L.; Blanco, N.; Hoke, G.D.; Dávila, F.; TomLinson, A.J. Uplift of the Altiplano-Puna plateau: A view from the west. Tectonics 2010, 29, TC5007. [Google Scholar] [CrossRef]
  3. Álvarez Blanco, I.; Cejudo-Figueiras, C.; de Godos, I.; Muñoz, R.; Blanco, S. Las diatomeas de los salares del Altiplano boliviano: Singularidades florísticas. Boletín Real Soc. Española Hist. Nat. Sección Biológica 2011, 105, 67–82. [Google Scholar]
  4. Scott, S.; Dorador, C.; Yanedel, J.P.; Tobar, I.; Hengst, M.; Maya, G.; Harrod, C.; Vila, I. Microbial diversity and trophic components of two high elevation wetlands of the Chilean Altiplano. Gayana 2015, 79, 45–56. [Google Scholar] [CrossRef] [Green Version]
  5. Williams, W.D.; Boulton, A.J.; Taaffe, R.G. Salinity as a determinant of salt lake fauna: A question of scale. Hydrobiologia 1990, 197, 257–266. [Google Scholar] [CrossRef]
  6. De la Fuente, A.; Meruane, C.; Suárez, F. Long-term spatiotemporal variability in high Andean wetlands in northern Chile. Sci. Total Environ. 2021, 756, 143830. [Google Scholar] [CrossRef]
  7. Eugster, H.P. Geochemistry of evaporitic lacustrine deposits. Annu. Rev. Earth Planet. Sci. 1980, 8, 35–63. [Google Scholar] [CrossRef]
  8. Risacher, F.; Alonso, H.; Salazar, C. The origin of brines and salts in Chilean salars: A hydrochemical review. Earth-Sci. Rev. 2003, 63, 249–293. [Google Scholar] [CrossRef]
  9. Psenner, R. Alpine waters in the interplay of global change: Complex links-simple effects? In Global Environmental Change in the Alpine Region. New Horizons in Environmental Economics; Steininger, K.W., Weck-Hannemann, H., Eds.; Edward Eldgar: Gloucestershire, UK, 2002. [Google Scholar]
  10. Boyle, T.P.; Caziani, S.M.; Waltermire, R.G. Landsat TM inventory and assessment of waterbird habitat in the southern altiplano of South America. Wetl. Ecol. Manag. 2004, 12, 563–573. [Google Scholar] [CrossRef]
  11. Squeo, F.A.; Warner, B.G.; Aravena, R.; Espinoza, D. Bofedales: High elevatione peatlands of the central Andes. Rev. Chil. Hist. Nat. 2006, 79, 245–255. [Google Scholar] [CrossRef] [Green Version]
  12. Valois, R.; Schaer, N.; Figueroa, R.; Maldonado, A.; Yáñez, E.; Hevia, A.; Yánez Carrizo, G.; MacDonell, S. Characterizing the Water Storage Capacity and Hydrological Role of Mountain Peatlands in the Arid Andes of North-Central Chile. Water 2020, 12, 1071. [Google Scholar] [CrossRef] [Green Version]
  13. Gleeson, T.; Marklund, L.; Smith, L.; Manning, A.H. Classifying the water table at regional to continental scales. Geophys. Res. Lett. 2011, 38, L05401. [Google Scholar] [CrossRef]
  14. Walvoord, M.A.; Plummer, M.A.; Phillips, F.M.; Wolfsberg, A.V. Deep arid system hydrodynamics: 1. Equilibrium states and response times in thick desert vadose zones. Water Resour. Res. 2002, 38, 1308. [Google Scholar] [CrossRef] [Green Version]
  15. Liu, Y.; Wagener, T.; Beck, H.E.; Hartmann, A. What is the hydrologically effective area of a catchment? Environ. Res. Lett. 2020, 15, 104024. [Google Scholar] [CrossRef]
  16. Boutt, D.F.; Corenthal, L.G.; Moran, B.J.; Munk, L.A.; Hynek, S.A. Imbalance in the modern hydrologic budget of topographic catchments along the western slope of the Andes (21–25°S): Implications for groundwater recharge assessment. Hydrogeol. J. 2021, 29, 985–1007. [Google Scholar] [CrossRef]
  17. Alley, W.M.; Healy, R.W.; LaBaugh, J.W.; Reilly, T.E. Flow and storage in groundwater systems. Science 2002, 296, 1985–1990. [Google Scholar] [CrossRef] [Green Version]
  18. Maxwell, R.M.; Condon, L.E.; Kollet, S.J.; Maher, K.; Haggerty, R.; Forrester, M.M. The imprint of climate and geology on the residence times of groundwater. Geophys. Res. Lett. 2016, 43, 701–708. [Google Scholar] [CrossRef] [Green Version]
  19. Corenthal, L.G.; Boutt, D.F.; Hynek, S.A.; Munk, L.A. Regional groundwater flow and accumulation of a massive evaporite deposit at the margin of the Chilean Altiplano. Geophys. Res. Lett. 2016, 43, 8017–8025. [Google Scholar] [CrossRef]
  20. Munk, L.A.; Boutt, D.F.; Hynek, S.A.; Moran, B.J. Hydrogeochemical fluxes and processes contributing to the formation of lithium-enriched brines in a hyper-arid continental basin. Chem. Geol. 2018, 493, 37–57. [Google Scholar] [CrossRef]
  21. Moran, B.J.; Boutt, D.F.; Munk, L.A. Stable and Radioisotope Systematics Reveal Fossil Water as Fundamental Characteristic of Arid Orogenic-Scale Groundwater Systems. Water Resour. Res. 2019, 55, 11295–11315. [Google Scholar] [CrossRef] [Green Version]
  22. Munk, L.A.; Boutt, D.F.; Moran, B.J.; McKnight, S.V.; Jenckes, J. Hydrogeologic and Geochemical Distinctions in Freshwater-Brine Systems of an Andean Salar. Geochem. Geophys. 2021, 22, e2020GC009345. [Google Scholar]
  23. Izquierdo, A.E.; Aragón, R.; Navarro, C.J.; Casagranda, E. Humedales de la Puna: Principales proveedores de servicios ecosistémicos de la región. In Serie de Conservación de la Naturaleza 24: La Puna Argentina: Naturaleza y Cultura; Grau, H.R., Babot, M.J., Izquierdo, A., Grau, A., Eds.; Fundación Miguel Lillo: Tucumán, Argentina, 2018; pp. 96–111. [Google Scholar]
  24. Gluzman, G. Minería y metalurgia en la antigua gobernación del Tucumán (siglos XVI–XVII): Colonial Tucumán 16th and 17th Centuries. Mem. Am. 2007, 15, 157–184. [Google Scholar]
  25. Kesler, S.E.; Gruber, P.W.; Medina, P.A.; Keoleian, G.A.; Everson, M.P.; Wallington, T.J. Global lithium resources: Relative importance of pegmatite, brine and other deposits. Ore Geol. Rev. 2012, 48, 55–69. [Google Scholar] [CrossRef]
  26. Munk, L.A.; Hynek, S.A.; Bradley, D.; Boutt, D.F.; Labay, K.; Jochens, H. Lithium brines: A global perspective. Rev. Econ. Geol. 2016, 18, 339–365. [Google Scholar]
  27. Williams, W.D. Environmental threats to salt lakes and the likely status of inland saline ecosystems in 2025. Environ. Conserv. 2002, 29, 154–167. [Google Scholar] [CrossRef] [Green Version]
  28. Tolotti, M.; Thies, M.; Cantonati, M.; Hansen, C.; Thaler, B. Flagellate algae (Chrysophyceae, Dinophyceae, Cryptophyceae) in 48 high mountain lakes of the Northern and Southern slope of the Eastern Alps: Biodiversity, taxa distribution and their driving variables. Hydrobiologia 2006, 502, 331–348. [Google Scholar] [CrossRef]
  29. Meehl, G.A.; Arblaster, J.M.; Tebaldi, C. Understanding future patterns of increased precipitation intensity in climate model simulations. Geophys. Res. Lett. 2005, 32, L18719. [Google Scholar] [CrossRef] [Green Version]
  30. Urrutia, R.; Vuille, M. Climate change projections for the tropical Andes using a regional climate model: Temperature and precipitation simulations for the end of the 21st century. J. Geophys. Res. 2009, 114, D02108. [Google Scholar] [CrossRef]
  31. Barros, V.R.; Boninsegna, J.A.; Camilloni, I.A.; Chidiak, M.; Magrín, G.O.; Rusticucci, M. Climate change in Argentina: Trends, projections, impacts and adaptation. Wiley Interdiscip. Rev. Clim. Chang. 2015, 6, 151–169. [Google Scholar] [CrossRef]
  32. Pabón-Caicedo, J.D.; Arias, P.A.; Carril, A.F.; Espinoza, J.C.; Borrel, L.F.; Goubanova, K.; Lavado-Casimiro, W.; Masiokas, M.; Solman, S.; Villalba, R. Observed and Projected Hydroclimate Changes in the Andes. Front. Earth Sci. 2020, 8, 61. [Google Scholar] [CrossRef]
  33. Ibarguchi, G. From Southern Cone arid lands, across Atacama, to the Altiplano: Biodiversity and conservation at the ends of the world. Biodiversity 2014, 15, 255–264. [Google Scholar] [CrossRef]
  34. Aguilar, P.; Dorador, C.; Vila, I.; Sommaruga, R. Bacterioplankton composition in tropical high-elevation lakes of the Andean plateau. FEMS Microbiol. Ecol. 2018, 94, fiy004. [Google Scholar] [CrossRef] [Green Version]
  35. Farías, E. Microbial Ecosystems in Central Andes Extreme Environments; Springer International Publishing: Cham, Switzerland, 2020. [Google Scholar]
  36. Locascio de Mitrovic, C.A.; Villagra de Gamundi, A.; Juárez, J.; Ceraolo, M. Características limnológicas y zooplancton de cinco lagunas de la Puna-Argentina. Ecol. Boliv. 2005, 40, 12–26. [Google Scholar]
  37. Aguilera, X.; Declercka, S.; De Meester, L.; Maldonado, M.; Ollevier, F. Tropical high Andes lakes: A limnological survey and an assessment of exotic rainbow trout (Oncorhynchus mykiss). Limnologica 2006, 36, 258–268. [Google Scholar] [CrossRef] [Green Version]
  38. Seeligmann, C.; Maidana, N.I.; Morales, M. Diatomeas (Bacillariophyceae) de humedales de altura de la provincia de Jujuy-Argentina. Boletín Soc. Argent. Botánica 2008, 43, 1–17. [Google Scholar]
  39. Maidana, N.I.; Seeligmann, C.T.; Morales, M.R. Bacillariophyceae del Complejo Lagunar Vilama (Jujuy, Argentina). Boletín Soc. Argent. Botánica 2009, 44, 257–271. [Google Scholar]
  40. Mirande, V.; Tracanna, B. Estructura y controles abióticos del fitoplancton en humedales de altura. Ecol. Austral 2009, 19, 119–128. [Google Scholar]
  41. Declerck, S.A.J.; Coronel, J.S.; Legendre, P.; Brendonck, L. Scale dependency of processes structuring metacommunities of cladocerans in temporary pools of High-Andes wetlands. Ecography 2011, 34, 296–305. [Google Scholar] [CrossRef] [Green Version]
  42. Caputo, L.; Giuseppe, A.; Givovich, A. Limnological features of Laguna Teno (35° S, Chile): A high-elevation lake impacted by volcanic activity. Fundam. Appl. Limnol. 2013, 183, 323–335. [Google Scholar] [CrossRef]
  43. Albarracín, V.H.; Kurth, D.; Ordoñez, O.F.; Belfiore, C.; Luccini, E.; Salum, G.M.; Piacentini, R.D.; Farías, M.E. High-Up: A Remote Reservoir of Microbial Extremophiles in Central Andean Wetlands. Front. Microbiol. 2015, 6, 1404. [Google Scholar] [CrossRef] [Green Version]
  44. Servant-Vildary, S.; Roux, M. Multivariate analysis of diatoms and water chemistry in Bolivian saline lakes. In Saline Lakes Developments in Hydrobiology; Comínand, F., Northcote, T., Eds.; Springer: Leiden, The Netherlands, 1990; pp. 267–290. [Google Scholar]
  45. Rejas, D.; Valverde, C.; Fernández, C.E. Limitación por nutrientes y pastoreo como factores de control de las densidades de bacterias y algas planctónicas en una laguna altoandina (Cochabamba, Bolivia). Rev. Boliv. Ecol. Conserv. Ambient. 2012, 30, 1–12. [Google Scholar]
  46. Frau, D.; Battauz, Y.; Mayora, G.; Marconi, P. Controlling factors in planktonic communities over a salinity gradient in high-elevation lakes. Ann. Limnol.-Int. J. Limnol. 2015, 51, 261–272. [Google Scholar]
  47. Fjeldså, J.; Krabbe, N.K. Birds of the High Andes; Museum Tusculanum Press: Copenhagen, Denmark, 1990; 881p. [Google Scholar]
  48. Caziani, S.M.; Derlindati, E.J.; Tálamo, A.; Sureda, A.L.; Trucco, C.E.; Nicolossi, G. Waterbird richness in altiplano wetlands of northwestern Argentina. Waterbirds 2001, 24, 103–117. [Google Scholar] [CrossRef]
  49. Vuilleumier, F.; Simberloff, D. Ecology versus history as determinants of patchy and insular distribution in high Andean birds. In Evolutionary Biology; Hecht, M., Steere, W., Wallace, B., Eds.; Plenum Publishing Corporation: New York, NY, USA, 1980; pp. 235–379. [Google Scholar]
  50. Tellería, J.L.; Venero, J.L.; Santos, T. Conserving birdlife of Peruvian highland bogs: Effects of patch-size and habitat quality on species richness and bird numbers. Ardeola 2006, 53, 271–283. [Google Scholar]
  51. Jacobsen, D.; Dangles, O. Ecology of High. Elevation Waters; Oxford University Press: Oxford, MS, USA, 2017. [Google Scholar]
  52. Castellino, M.; Lesterhuis, A. Censo Simultáneo de Falaropos 2020-Resumen y Resultados; Manomet-WHSRN: Plymouth, MA, USA, 2020. [Google Scholar]
  53. Caziani, S.M.; Rocha, O.; Rodríguez Ramírez, E.; Romano, M.C.; Derlindati, E.J.; Tálamo, A.; Ricalde, D.; Quiroga, C.; Contreras, J.P.; Valqui, M.; et al. Seasonal distribution, abundance, and nesting of Puna, Andean, and Chilean flamingos. Condor 2007, 109, 276–287. [Google Scholar] [CrossRef]
  54. Marconi, P.; Sureda, A.L.; Arengo, F.; Aguilar, M.S.; Amado, N.; Alza, L.; Rocha, O.; Torres, R.; Moschione, F.; Romano, M.; et al. Fourth simultaneous flamingo census in South America: Preliminary results. Flamingo 2011, 18, 48–53. [Google Scholar]
  55. Marconi, P.; Arengo, F.; Castro, A.; Rocha, O.; Valqui, M.; Aguilar, S.; Barberis, I.; Castellino, M.; Castro, L.; Derlindati, E.; et al. Sixth International Simultaneous Census of three flamingo species in the Southern Cone of South America: Preliminary Analysis. Flamingo 2020, 12, 67–75. [Google Scholar]
  56. Villagrán, C.; Castro, V. Ciencia Indígena de Los Andes del Norte de Chile; Editorial Universitaria: Santiago, Chile, 1997; p. 362. [Google Scholar]
  57. Catalan, J.; Rondón, J.C.D. Perspectives for an integrated understanding of tropical and temperate high-mountain lakes. J. Limnol. 2016, 75, 215–234. [Google Scholar] [CrossRef] [Green Version]
  58. Adrian, R.; O’Reilly, C.M.; Zagarese, H.; Baines, S.B.; Hessen, D.O.; Keller, W.; Livingstone, D.M.; Sommaruga, R.; Straile, D.; Van Donk, E.; et al. Lakes as sentinels of climate change. Limnol. Oceanogr. 2009, 54, 2283–2297. [Google Scholar] [CrossRef]
  59. Coronel, J.S.; Declerck, S.; Maldonado, M.; Ollevier, F.; Brendonck, L. Temporary shallow pools in the high-Andes ‘bofedal’ peat lands: A limnological characterization at different spatial scales. Arch. Sci. 2004, 57, 85–96. [Google Scholar]
  60. Wanger, T.C. The Lithium future—Resources, recycling, and the environment. Conserv. Lett. 2011, 4, 202–206. [Google Scholar] [CrossRef]
  61. Marconi, P.; Arengo, F.; Clark, A. The arid Andean plateau waterscapes and the lithium triangle: Flamingos as flagships for conservation of wetlands under pressure from mining development. Wetl. Ecol. Manag. 2021. under review. [Google Scholar]
  62. Morlans, M.C. Regiones Naturales de Catamarca. Provincias Geológicas y Provincias Fitogeográficas. Rev. Cienc. Técnica 1995, 2, 1–42. [Google Scholar]
  63. Pekel, J.F.; Cottam, A.; Gorelick, N.; Belward, A.S. High-resolution mapping of global surface water and its long-term changes. Nature 2016, 540, 418–422. [Google Scholar] [CrossRef]
  64. Warren, J.K. Evaporites: A Geological Compendium; Springer International Publishing: Cham, Switzerland, 2016; p. 1813. [Google Scholar]
  65. Hilton, J.; Rigg, E. Determination of nitrate in lake water by the adaptation of the hydrazine-copper reduction method for use on a discrete analyser: Performance statistics and an instrument-induced difference from segmented flow conditions. Analyst 1993, 108, 1026–1028. [Google Scholar] [CrossRef]
  66. APHA. Standard Methods for the Examination of Water and Wastewater; American Public Health Association: Washington, DC, USA, 2005. [Google Scholar]
  67. Sureda, A.L. Patrones de Diversidad en Aves de Lagunas Altoandinas de Catamarca, Noroeste de Argentina. Licentiate Thesis, Universidad Nacional de Salta, Salta, Argentina, 2003; p. 63. [Google Scholar]
  68. Lehner, B.; Grill, G. Global River hydrography and network routing: Baseline data and new approaches to study the world’s large river systems. Hydrol. Process. 2013, 27, 2171–2186. [Google Scholar] [CrossRef]
  69. Abatzoglou, J.T.; Dobrowski, S.Z.; Parks, S.A.; Hegewisch, K.C. TerraClimate, a high-resolution global dataset of monthly climate and climatic water balance from 1958–2015. Sci. Data 2018, 5, 170191. [Google Scholar] [CrossRef] [Green Version]
  70. McNally, A.; Arsenault, K.; Kumar, S.; Shukla, S.; Peterson, P.; Wang, S.; Funk, C.; Peters-Lidard, C.D.; Verdin, J.P. A land data assimilation system for sub-Saharan Africa food and water security applications. Sci. Data 2017, 4, 170012. [Google Scholar] [CrossRef] [Green Version]
  71. Tucker, C.J. Red and photographic infrared linear combinations for monitoring vegetation. Remote Sens. Environ. 1979, 8, 127–150. [Google Scholar] [CrossRef] [Green Version]
  72. Utermöhl, H. Zur Vervollkommnung der quantitativen Phytoplankton. Methodik. Mitt. Int. Verein. Limnol. 1958, 9, 1–38. [Google Scholar]
  73. Venrick, E.L. How many cells to count? In Phytoplankton Manual; Von Sournia, A., Ed.; UNSECO: Paris, France, 1978; pp. 167–180. [Google Scholar]
  74. Lee, R.D. Phycology; Cambridge University Press: Cambridge, UK, 2008. [Google Scholar]
  75. Krammer, K.; Lange-Bertalot, H. Bacillariophyceae. 3. Teil Centrales, Fragilariaceae, Eunotiaceae. In Süsswasserflora von Mitteleuropa; Ettl, H., Gerloff, J., Heynig, H., Mollenhauer, D., Eds.; Gustav Fischer Verlag: Stuttgar, Germany, 1991. [Google Scholar]
  76. Tell, G.; Conforti, V. Euglenophyta pigmentadas da Argentina. Bibl. Phycol. 1986, 75, 1–301. [Google Scholar]
  77. Komárek, J.; Fott, B. Chlorophyceae, chlorococcales. In Das Phytoplankton des Sdwasswes. Die Binnenggewasser; Huber-Pestalozzi, G., Ed.; Schweizerbart’sche Verlagsbuchhandlung: Stuttgart, Germany, 1983. [Google Scholar]
  78. Komárek, J.; Anagnostidis, K. Cyanoprokariota. 1. Chroococcales. In Subwasserflora von Mitteleuropa; Ett, H., Gärdner, G., Heynig, H., Mollenhauer, D., Eds.; Gustav Fischer Verlag: Stuttgar, Germany, 1999. [Google Scholar]
  79. Komárek, J.; Anagnostidis, K. Cyanoprokaryota. Teil 2: Oscillatoriales. In Süsswasserflora von Mitteleuropa 19/2; Büdel, B., Gärtner, G., Krienitz, L., Schagerl, M., Eds.; Elsevier: München, Germany, 2005. [Google Scholar]
  80. Ahlstrom, E.H. A revision of the Rotatorian genera Brachionus and Platyias with descriptions of one new species and two new varieties. Bull. Am. Mus. Nat. Hist. 1940, 77, 143–148. [Google Scholar]
  81. Koste, W. Rotatoria. Die Radertiere Mitteleuropas; Gebruder Borntraeger: Berlin, Germany, 1978. [Google Scholar]
  82. Kořínek, V. Diaphanosoma birgei n.sp. (Crustacea, Cladocera). A new species from America and its widely distributed subspecies Diaphanosoma birgei ssp. lacustris n.ssp. Can. J. Zool. 1981, 59, 1115–1121. [Google Scholar] [CrossRef]
  83. Kořínek, V. Cladocera. In A Guide to Tropical Freshwater Zooplankton; Fernando, C.H., Ed.; Backhuys Publishers: Leiden, The Netherlands, 2002; pp. 69–122. [Google Scholar]
  84. Korovchinski, N.M. Sididae and Holopedidae (Crustacea: Daphniiformes). In Guides to Identification of the Microinvertebrates of the Continental Waters of the World; SPB Academic Publishers: The Hague, The Netherlands, 1992. [Google Scholar]
  85. Alekseev, V.R. Copepoda. In A Guide to Tropical. Freshwater Zooplankton; Fernando, C.H., Ed.; Backhugs Publishers: Leiden, The Netherlands, 2002; pp. 123–188. [Google Scholar]
  86. Marconi, P. Técnicas de monitoreo de condiciones ecológicas en la Red de Humedales de Importancia para la Conservación de Flamencos Altoandinos. In Manual de Técnicas de Monitoreo de Condiciones Ecológicas para el Manejo Integrado de la red de Humedales de Importancia para la Conservación de Flamencos Altoandinos; Marconi, P., Ed.; Fundación YUCHAN: Salta, Argentina, 2010; pp. 8–14. [Google Scholar]
  87. Messager, M.L.; Lehner, B.; Grill, G.; Nedeva, I.; Schmitt, O. Estimating the volume and age of water stored in global lakes using a geo-statistical approach. Nat. Commun. 2016, 7, 13603. [Google Scholar] [CrossRef] [PubMed]
  88. Pingel, H.; Alonso, R.N.; Altenberger, U.; Cottle, J.; Strecker, M.R. Miocene to Quaternary basin evolution at the southeastern Andean Plateau (Puna) margin (ca. 24°S lat, Northwestern Argentina). Basin Res. 2019, 31, 808–826. [Google Scholar] [CrossRef]
  89. Gamboa, C.; Godfrey, L.; Herrera, C.; Custodio, E.; Soler, A. The origin of solutes in groundwater in a hyper-arid environment: A chemical and multi-isotope approach in the Atacama Desert, Chile. Sci. Total Environ. 2019, 690, 329–351. [Google Scholar] [CrossRef]
  90. Reynolds, C.S. The Ecology of Phytoplankton; Cambridge University Press: Cambridge, UK, 2006; p. 552. [Google Scholar]
  91. Cloern, J.E.; Alpine, A.E.; Cole, B.E.; Wong, R.L.J.; Arthur, J.F.; Ball, M.D. River discharge controls phytoplankton dynamics in the northern San Francisco Bay estuary. Estuar. Coast. Shelf Sci. 1983, 16, 415–429. [Google Scholar] [CrossRef]
  92. Herbst, D.B.; Bradley, T.J. A Malpighian tubule lime gland in an insect inhabiting alkaline salt lakes. J. Exp. Biol. 1989, 145, 63–78. [Google Scholar] [CrossRef]
  93. Salm, C.R.; Saros, J.E.; Martin, C.S.; Erickson, J.M. Patterns of seasonal phytoplankton distribution in prairie saline lakes of the northern Great Plains (U.S.A.). Saline Syst. 2009, 5, 1. [Google Scholar] [CrossRef] [PubMed] [Green Version]
  94. Salm, C.R.; Saros, J.E.; Fritz, S.C.; Osburn, C.L.; Reineke, D.M. Phytoplankton productivity across prairie saline lakes of the Great Plains (USA): A step toward deciphering patterns through lake classification models. Can. J. Fish. Aquat. Sci. 2009, 66, 1435–1448. [Google Scholar] [CrossRef] [Green Version]
  95. Sánchez Carrillo, S.; Álvarez-Cobelas, M. Nutrient Dynamics and Eutrophication Patterns in A Semi-Arid Wetland: The Effects of Fluctuating Hydrology. Water Air Soil Pollut. 2001, 131, 97–118. [Google Scholar] [CrossRef]
  96. Sánchez Carrillo, S.; Angeler, D.G.; Alvarez-Cabelas, M.; Sanchez-Andres, R. Freshwater wetland eutrophication. In Eutrophication: Causes, Consequences and Control; Ansari, A.A., Singh Gill, S., Lanza, G.R., Rast, W., Eds.; Springer: Heidelberg, Germany, 2011; pp. 195–210. [Google Scholar]
  97. Jordan, T.E.; Mpodozis, C.; Muñoz, N.; Blanco, N.; Pananont, P.; Gardeweg, M. Cenozoic subsurface stratigraphy and structure of the Salar de Atacama Basin, northern Chile. J. S. Am. Earth Sci. 2007, 23, 122–146. [Google Scholar] [CrossRef]
  98. Salisbury, M.J.; Jicha, B.R.; de Silva, S.L.; Singer, B.S.; Jiménez, N.C.; Ort, M.H. 40Ar/39Ar chronostratigraphy of Altiplano-Puna volcanic complex ignimbrites reveals the development of a major magmatic province. Geol. Soc. Am. Bull. 2011, 123, 821–840. [Google Scholar] [CrossRef]
  99. Finstad, K.; Pfeiffer, M.; McNicol, G.; Barnes, J.; Demergasso, C.; Chong, G.; Amundson, R. Rates and geochemical processes of soil and salt crust formation in Salars of the Atacama Desert, Chile. Geoderma 2016, 284, 57–72. [Google Scholar] [CrossRef]
  100. Leopold, L.B. Temperature profiles and bathymetry of some high mountain lakes. Proc. Natl. Acad. Sci. USA 2000, 97, 6267–6270. [Google Scholar] [CrossRef] [PubMed] [Green Version]
  101. Muñoz, R.; Huggel, C.; Frey, H.; Cochachin, A.; Haeberli, W. Glacial Lake depth and volume estimation based on a large bathymetric dataset from the Cordillera Blanca, Peru. Earth Surf. Process. Landf. 2020, 45, 1510–1527. [Google Scholar] [CrossRef]
  102. Boutt, D.F.; Hynek, S.A.; Munk, L.A.; Corenthal, L.G. Rapid recharge of fresh water to the halite-hosted brine aquifer of Salar de Atacama, Chile. Hydrol. Process. 2016, 30, 4720–4740. [Google Scholar] [CrossRef]
  103. Price, J.S. Hydrology and microclimate of a partly restored cutover bog, Quebec. Hydrol. Process. 1996, 10, 1263–1272. [Google Scholar] [CrossRef]
  104. Plach, J.M.; Petrone, R.M.; Waddington, J.M.; Kettridge, N.; Devito, K.J. Hydroclimatic influences on peatland CO2 exchange following upland forest harvesting on the Boreal Plains. Ecohydrology 2016, 9, 1590–1603. [Google Scholar] [CrossRef] [Green Version]
  105. Jordan, T.E.; Herrera, L.C.; Godfrey, L.V.; Colucci, S.J.; Gamboa, P.C.; Urrutia, M.J.; González, G.L.; Paul, J.F. Isotopic characteristics and paleoclimate implications of the extreme precipitation event of March 2015 in Northern Chile. Andean Geol. 2019, 46, 1–31. [Google Scholar] [CrossRef]
  106. Langenbrunner, B.; Pritchard, M.S.; Kooperman, G.J.; Randerson, J.T. Why does Amazon precipitation decrease when tropical forests respond to increasing CO2? Earth’s Future 2019, 7, 450–468. [Google Scholar] [CrossRef] [Green Version]
  107. Pascale, S.; Carvalho, L.M.V.; Adams, D.K.; Castro, C.L.; Cavalcanti, I.F.A. Current and future variations of the monsoons of the Americas in a warming climate. Curr. Clim. Chang. Rep. 2019, 5, 125–144. [Google Scholar] [CrossRef]
  108. Garreaud, R.D.; Boisier, J.P.; Rondanelli, R.; Montecinos, A.; Sepúlveda, H.H.; Veloso-Aguila, D. The Central Chile Mega Drought (2010–2018): A climate dynamics perspective. Int. J. Climatol. 2020, 40, 421–439. [Google Scholar] [CrossRef]
  109. Ferrero, M.E.; Villalba, R. Interannual and long-term precipitation variability along the subtropical mountains and adjacent Chaco (22–29° S) in Argentina. Front. Earth Sci. 2019, 7, 148. [Google Scholar] [CrossRef] [Green Version]
  110. Petrone, R.M.; Devito, K.J.; Silins, U.; Mendoza, C.; Brown, S.C.; Kaufman, S.C.; Price, J.S. Transient peat properties in two pond-peatland complexes in the sub-humid Western Boreal Plain, Canada. Mires Peat 2008, 3, 1–13. [Google Scholar]
  111. Rolando, J.L.; Turina, C.; Ramírez, D.A.; Maresa, V.; Monerris, J.; Quiroz, R. Key ecosystem services and ecological intensification of agriculture in the tropical high-Andean Puna as affected by land-use and climate changes. Agric. Ecosyst. Environ. 2017, 236, 221–233. [Google Scholar] [CrossRef]
  112. Moran, B.J.; Boutt, D.F.; McKnight, S.V.; Jenckes, J.; Munk, L.A.; Corkran, D.; Kirshen, A. Water Sustainability, Drought, Relic Groundwater and Lithium Resource Extraction in an Arid Landscape; University of Massachusetts: Amherst, MA, USA, 2021; Manuscript to be submitted. [Google Scholar]
  113. García, A.; Ulloa, C.; Amigo, G.; Milana, J.P.; Medina, C. An inventory of cryospheric landforms in the arid diagonal of South America (high Central Andes, Atacama region, Chile). Quat. Int. 2017, 438, 4–19. [Google Scholar] [CrossRef]
  114. Schaffer, N.; MacDonell, S.; Réveillet, M.; Yáñez, E.; Valois, R. Rock glaciers as a water resource in a changing climate in the semiarid Chilean Andes. Reg. Environ. Chang. 2019, 19, 1263–1279. [Google Scholar] [CrossRef]
  115. Moran, B.J.; Boutt, D.F.; Munk, L.A.; Fisher, J.D. Pronounced Water Age Partitioning Between Arid Andean Aquifers and Fresh-Saline Lagoon Systems. In Proceedings of the EGU General Assembly 2021a, online/virtual, 19–30 April 2021. EGU21-13753. [Google Scholar] [CrossRef]
  116. Canevari, P. El Flamenco Común; Centro Editor de América Latina: Buenos Aires, Argentina, 1983. [Google Scholar]
  117. Bucher, E.H. Flamencos. In Bañados del río Dulce y Laguna Mar Chiquita; Bucher, E.H., Ed.; Academia Nacional de Ciencias: Córdoba, Argentina, 2006; pp. 251–261. [Google Scholar]
  118. Romano, M.; Pagano, F.; Luppi, M. Registros de Parina grande (Phoenicopterus andinus) en la laguna Melincué, Santa Fe, Argentina. Nuestras Aves 2002, 43, 15–17. [Google Scholar]
  119. Cruz, N.; Barisón, C.; Romano, M.; Arengo, F.; Derlindati, E.; Barberis, I. A new record of James’s flamingo (Phoenicoparrus jamesi) from Laguna Melincué, a lowland wetland in East-Central Argentina. Wilson J. Ornithol. 2013, 125, 217–221. [Google Scholar] [CrossRef]
  120. Torres, R.M.; Michelutti, P. Aves Acuáticas. In Bañados del río Dulce y Laguna Mar Chiquita (Córdoba, Argentina); Bucher, E.H., Ed.; Academia Nacional de Ciencias: Córdoba: Argentina, 2006; pp. 237–249. [Google Scholar]
  121. Garnier, J.; Beusen, A.; Thieu, V.; Billen, G.; Bouwman, L. N:P:Si nutrient export ratios and ecological consequences in coastal seas evaluated by the ICEP approach. Glob. Biogeochem. Cycles 2010, 24, GB0A05. [Google Scholar] [CrossRef]
  122. Tavernini, S.; Pierobon, E.; Viaroli, P. Physical factors and dissolved reactive silica affect phytoplankton community structure and dynamics in a lowland eutrophic river (Po River, Italy). Hydrobiologia 2011, 669, 213–225. [Google Scholar] [CrossRef]
  123. Laguna, C.; López-Perea, J.J.; Feliu, J.; Jiménez-Moreno, M.; Rodríguez Martín-Doimeadios, R.C.; Florín, M.; Mateo, R. Nutrient enrichment and trace element accumulation in sediments caused by waterbird colonies at a Mediterranean semiarid floodplain. Sci. Total Environ. 2021, 777, 145748. [Google Scholar] [CrossRef]
  124. Henriksen, M.V.; Hangstrup, S.; Work, F.; Krogsgaard, M.K.; Groom, G.B.; Fox, A.D. Flock distributions of Lesser Flamingos Phoeniconaias minor as potential responses to food abundance-predation risk trade-offs at Kamfers Dam, South Africa. Wildfowl 2015, 65, 3–18. [Google Scholar]
  125. Krienitz, L.; Krienitz, D.; Dadheech, P.K.; Hübener, T.; Kotut, K.; Luo, W.; Teubner, R.; Versfeld, W.D. Food algae for Lesser Flamingos: A stocktaking. Hydrobiologia 2016, 775, 2–50. [Google Scholar] [CrossRef]
  126. Hurlbert, S.H.; Chang, C. Ornitholimnology: Effects of grazing by the Andean Flamingo (Phoenicoparrus andinus). Proc. Natl. Acad. Sci. USA 1983, 80, 4766–4769. [Google Scholar] [CrossRef] [PubMed] [Green Version]
  127. Mascitti, V.; Kravetz, F.O. Bill morphology of South American flamingos. Condor 2002, 104, 73–83. [Google Scholar] [CrossRef]
  128. Tobar, C.N.; Rau, J.R.; Fuentes, N.; Gantz, A.; Suazo, C.G.; Cursach, J.A.; Santibañez, A.; Pérez Schultheiss, J. Diet of the Chilean flamingo Phoenicopterus chilensis (Phoenicopteriformes: Phoenicopteridae) in a coastal wetland in Chiloé, southern Chile. Rev. Chil. Hist. Nat. 2014, 87, 1–7. [Google Scholar] [CrossRef] [Green Version]
  129. Sylvestre, F.; Servant-Vildary, S.; Roux, M. Diatom-based ionic concentration and salinity models from the south Bolivian Altiplano (15-23°S). J. Paleolimnol. 2001, 25, 279–295. [Google Scholar] [CrossRef]
  130. Tapia, P.M.; Fritz, S.C.; Baker, P.A.; Seltzer, G.O.; Dunbar, R.B. A Late Quaternary diatom record of tropical climatic history from Lake Titicaca (Peru and Bolivia). Palaeogeogr. Palaeoclimatol. Palaeoecol. 2003, 194, 139–164. [Google Scholar] [CrossRef] [Green Version]
  131. Tapia, P.M.; Fritz, S.C.; Seltzer, G.O.; Rodbell, D.T.; Metivier, S.P. Contemporary distribution and late-quaternary stratigraphy of diatoms in the Junin plain, central Andes, Peru. Boletín Soc. Geológica Peru 2006, 101, 19–42. [Google Scholar]
  132. Maidana, N.; Seeligmann, C. Diatomeas (Bacillariophyceae) de ambientes acuáticos de altura de la Provincia de Catamarca, Argentina, II. Boletín Soc. Argent. Botánica 2006, 41, 1–13. [Google Scholar]
  133. Maidana, N.I.; Seeligmann, C.; Morales, M.R. El género Navicula sensu stricto (Bacillariophyceae) en humedales de altura de Jujuy, Argentina. Boletín Soc. Argent. Botánica 2011, 46, 13–29. [Google Scholar]
  134. Saros, J.E.; Fritz, S.E. Changes in the growth rates of saline-lake diatoms in response to variation in salinity, brine type, and nitrogen form. J. Plankton Res. 2000, 22, 1071–1083. [Google Scholar] [CrossRef] [Green Version]
  135. Díaz, C.A.; Maidana, N.I. A new monoraphid diatom genus: Haloroundia Diaz and Maidana. Nova Hedwig. Beih. 2006, 130, 177–183. [Google Scholar]
  136. Blanco, S.; Álvarez-Blanco, I.; Cejudo-Figueiras, C.; DeGodos, I.; Bécares, E.; Muñoz, R.; Guzmán Suarez, H.; Vargas, V.; Soto, R. New diatom taxa from high-altitude Andean saline lakes. Diatom Res. 2013, 28, 13–27. [Google Scholar] [CrossRef]
  137. Cabrol, N.A.; Grin, E.A.; Chong, G.; Minkley, E.; Hock, A.N.; Yu, Y.; Bebout, L.; Fleming, E.; Häder, D.P.; Demergasso, C.; et al. The high-lakes project. J. Geophys. Res. 2007, 114, G00D06. [Google Scholar] [CrossRef] [Green Version]
  138. Bastidas Navarro, M.; Balseiro, E.; Modenutti, B. UV radiation simultaneously affects phototrophy and phagotrophy in nanoflagellate-dominated phytoplankton from an Andean shallow lake. Photochem. Photobiol. Sci. 2011, 10, 1318. [Google Scholar] [CrossRef]
  139. Hammer, U.T.; Shamess, J.; Haynes, R.C. The distribution and abundance of algae in saline lakes of Saskatchewan, Canada. Hydrobiologia 1983, 105, 1–26. [Google Scholar] [CrossRef]
  140. Padisák, J.; Dokulil, M. Meroplankton dynamic in a saline, turbulent, turbid shallow lake (Neusiedlersee, Austria and Hungary). Hydrobiologia 1994, 289, 23–42. [Google Scholar] [CrossRef]
  141. Zúñiga, L.R.; Campos, V.; Pinochet, H.; Prado, B. A limnological reconnaissance of Lake Tebenquiche, Salar de Atacama, Chile. Hydrobiologia 1991, 210, 19–24. [Google Scholar] [CrossRef]
  142. Gunkel, G. Limnology of an Equatorial High Mountain Lake in Ecuador, Lago San Pablo. Limnologica 2000, 30, 113–120. [Google Scholar] [CrossRef] [Green Version]
  143. Van Colen, W.; Portilla, K.; Oñab, T.; Wyseurec, G.; Goethalsd, P.; Velarde, E.; Muylaerta, K. Limnology of the neotropical high elevation shallow lake Yahuarcocha (Ecuador) and challenges for managing eutrophication using biomanipulation. Limnologica 2017, 67, 37–44. [Google Scholar] [CrossRef]
  144. Soto, D.; Zúñiga, L. Zooplankton assemblages of Chilean temperate lakes: A comparison with North American counterparts. Rev. Chil. Hist. Nat. 1991, 64, 569–581. [Google Scholar]
  145. De los Ríos, P.; Crespo, J. Salinity effects on the abundance of Boeckella popoensis (Copepoda, Calanoidea) in saline ponds of the Atacama Desert, northern Chile. Crustaceana 2004, 77, 417–423. [Google Scholar]
  146. Soto, D.; De los Rios, P. Trophic status and conductivity as regulators of daphnids dominance and zooplankton assemblages in lakes and ponds of Torres del Paine National Park. Biol. Bratisl. 2006, 61, 541–546. [Google Scholar] [CrossRef] [Green Version]
  147. De los Ríos, P.; Soto, D. Crustacean (Copepoda and Cladocera) zooplankton richness in Chilean Patagonian lakes. Crustaceana 2007, 80, 285–296. [Google Scholar] [CrossRef] [Green Version]
  148. Mühlhauser, H.; Hrepic, N.; Mladinic, P.; Montecino, V.; Cabrera, S. Water quality and limnological features of a high-elevation Andean Lake, Chungará in northern Chile. Rev. Chil. Hist. Nat. 1995, 68, 341–349. [Google Scholar]
  149. Derry, A.; Prepas, E.; Hebert, P. A comparison of zooplankton communities in saline lake water with variable anion composition. Hydrobiologia 2003, 505, 199–215. [Google Scholar] [CrossRef]
  150. Battauz, Y.; José de Paggi, S.; Romano, M.; Barbaeris, I. Zooplankton characterization of the Pampean saline shallow lakes, habitat of the Andean Flamingoes. J. Limnol. 2013, 72, 531–542. [Google Scholar] [CrossRef] [Green Version]
Figure 1. Map of the High Andean Plateau of Argentina and major hydrological features. The wetlands in this study are labeled, and the watersheds/basins for each wetland complex are outlined. The surface water occurrence layer depicts the average occurrence of water over the Landsat record on a scale from pale purple meaning very little occurrence (<10%) to dark blue meaning permanent water (100%). This dataset is publicly available through the European Commission’s Joint Research Centre [63].
Hydrology 08 00164 g001
Figure 2. Principal components analysis (PCA) considering only those wetlands where full environmental data were available. Abbreviations of variable names as in Table 1.
Hydrology 08 00164 g002
Figure 3. Neighbor-joining clustering analysis by using all the environmental variables (including nutrients) available.
Hydrology 08 00164 g003
Figure 4. Piper diagram showing major ion compositions of wetland surface waters. Purulla, El Peinado, Negra, and Verde were data extracted from data presented by Sureda (2003).
Hydrology 08 00164 g004
Figure 5. Map of recent hydroclimatological changes across the region relative to the 1985–99 period. Vegetation coverage (green hatch) is derived from the Landsat imagery record that outlines the regions of each wetland complex included in our analysis. Temperature changes observed in each basin of interest are outlined on a color scale by magnitude of change. Each wetland of interest (numbered) is labeled, and its corresponding subplot shows the observed changes in the relative vegetation extent and precipitation amount.
Hydrology 08 00164 g005
Figure 6. Phytoplankton relative percentage density registered for each group and total abundance (ind mL−1) with percentage variation coefficient indicated (%VC) on each mean value (a) and diversity indexes (b) on each wetland where samples were obtained.
Hydrology 08 00164 g006
Figure 7. Zooplankton relative percentage density registered for each group and total abundance (ind L−1) with percentage variation coefficient indicated (%VC) on each mean value (a) and diversity indexes (b) on each wetland where samples were obtained.
Hydrology 08 00164 g007
Figure 8. Redundancy analysis (RDA) plot with all the environmental and biological variables included. Abbreviations of variable names as in Table 1.
Hydrology 08 00164 g008
Table 1. Median environmental values for each wetland sampled between 2010 and 2020. Elevation (Alt), area (Area), temperature (Temp), pH (pH), water level (WL), Secchi disc (SD), conductivity (Cond), dissolved inorganic nitrogen (DIN), silica (Silica), soluble reactive phosphorus (SRP). ND = no data.
WetlandsTypeElev (m.a.s.l)Area (ha)Temp (°C)pHWL (cm)SD (cm)Cond (mS cm−1)DIN (µg L−1)Silica (mg L−1)SRP (µg L−1)
Aguas DulcesSaline332554326.27.05.05.025.6NDNDND
AlumbreraFresh33202419.89.73.13.52.2227.540.777.0
AntofagastaFresh332037.522.99.54.03.51.6159.937.732.7
Los AparejosSaline42209510.79.03.03.074.0146.829.570.1
ArchibarcaSaline403049.816.18.616.05.350.083.562.51962.8
AzulBrackish4450667.89.57.07.03.9156.410.244.1
CabiSaline42206723.59.52.02.051.5NDNDND
Carachi PampaSaline300033424.08.66.56.5100.0675.631.7216.5
CaroSaline399051119.88.11.01.073.8NDNDND
CortaderasFresh390051.0122.58.718.818.81.353.670.3142.0
GrandeSaline424035715.39.85.23.017.5578.596.5187.1
HediondaSaline42802025.19.83.03.038.6370.3206.73580.7
NegraSaline4090110621.48.32.02.030.5216.653.346.1
El PeinadoSaline375024117.09.028.25.067.3NDNDND
Las PeñasBrackish42555312.49.06.94.86.01135.961.5697.1
PurullaSaline3805487.422.89.07.87.832.5144.739.397.7
San FranciscoBrackish4000106612.08.212.911.56.857.973.7966.8
Tres QuebradasSaline4090ND15.4ND6.06.0108.6NDNDND
Las TunasSaline42504219.09.5NDND52.9327.7ND51.9
VerdeSaline4090107717.2ND1515101.2NDNDND
Table 2. Summary of hydroclimate results for each basin/watershed and associated wetland system. The largest observed decreases in precipitation, vegetation, and air temperature are highlighted in red, and the largest increases in vegetation extent are highlighted in green. Notes: *1 Whole topographic basin minus the Antofasta/Alumbrera Watershed area. *2 Based on linear trend.
WetlandBasin/WatershedElevation (m.a.s.l)Catchment-Wide Hydroclimate for 1985–1999 and 2000–2020 Periods
Precipitation ChangeNDVIAir Temp. Change (°C) *2
ArchibarcaArchibarca Basin4030−22%−15%+0.65
CaroCaro Basin3990−13%−10%+0.65
DiamanteDiamante Basin4570−9%+14%+0.60
AlumbreraAntofasta/Alumbrera Watershed3320−12%−12%+0.60
AntofagastaAntofasta/Alumbrera Watershed3320−12%−15%+0.60
HediondaGrande Basin4280−10%−31%+0.60
Las PeñasGrande Basin4255−10%+8%+0.60
GrandeGrande Basin4240−10%−15%+0.60
CabiGrande Basin4220−10%−20%+0.60
Carachi PampaCarachi Pampa Basin *13000−13%−12%+0.55
PurullaPurulla Basin3805−19%+6%+0.50
Aguas DulcesAguas Dulces Watershed3325−22%−17%+0.45
El PeinadoEl Peinado Basin3750−21%+25%+0.50
San FranciscoSan Fransisco Basin4000−18%−16%+0.55
CortaderasCortaderas Vega Watershed3900−19%+6%+0.55
Tres QuebradasTres Quebradas Basin4090−14%+45%+0.50
VerdeTres Quebradas Basin4090−14%+6%+0.50
NegraTres Quebradas Basin4090−14%+53%+0.50
AzulAzul Watershed4450−13%+49%+0.50
Los AparejosLos Aparejos Basin4220−13%−6%+0.50
Las TunasLos Aparejos Basin4250−13%+12%+0.50
Table 3. Mean and percentage variation coefficient (%VC) of flamingos counted (individuals’ numbers) per species in each wetland from 2010–2020.
WetlandP. andinusP. jamesiP. chilensis
Mean%VCMean%VCMean%VC
Aguas Dulces526311001450
Alumbrera16100120050126
Antofagasta9144120077222
Archibarca24837831285292
Azul616721505100
Cabi13146581242150
Carachi Pampa9125317110120
Caro6284421381747
Cortaderas1385006150
Diamante158471631426563
Grande1618814,9881819126
Hedionda37652774812167
Las Peñas1048226011521585
Las Tunas6911313110912108
Los Aparejos96773766923148
Negra1824912834100
El Peinado1792642008463
Purulla5558697119989
San Francisco365764914727104
Tres Quebradas8880000
Verde00110000
Publisher’s Note: MDPI stays neutral with regard to jurisdictional claims in published maps and institutional affiliations.