Article

Determining the Hydrological Behaviour of Catchment Based on Quantitative Morphometric Analysis in the Hard Rock Area of Nand Samand Catchment, Rajasthan, India

by
Dimple Dimple
1,
Jitendra Rajput
2,
Nadhir Al-Ansari
3,*,
Ahmed Elbeltagi
4,5,
Bilel Zerouali
6 and
Celso Augusto Guimarães Santos
7
1
SWE Department, CTAE, Maharana Pratap University of Agriculture and Technology, Udaipur 313001, India
2
Division of Agricultural Engineering, Indian Agricultural Research Institute (IARI), New Delhi 110012, India
3
Department of Civil, Environmental and Natural Resources Engineering, Lulea University of Technology, 97187 Lulea, Sweden
4
Agricultural Engineering Department, Faculty of Agriculture, Mansoura University, Mansoura 35516, Egypt
5
College of Environmental and Resource Sciences, Zhejiang University, Hangzhou 310058, China
6
Vegetable Chemistry-Water-Energy Research Laboratory, Faculty of Civil Engineering and Architecture, Hassiba Benbouali, University of Chlef, B.P. 78C, Ouled Fares, Chlef 02180, Algeria
7
Department of Civil and Environmental Engineering, Federal University of Paraíba, João Pessoa 58051-900, Brazil
*
Author to whom correspondence should be addressed.
Hydrology 2022, 9(2), 31; https://doi.org/10.3390/hydrology9020031
Submission received: 14 December 2021 / Revised: 30 January 2022 / Accepted: 1 February 2022 / Published: 10 February 2022

Abstract

:
India’s water resources are under tremendous pressure due to elevated demand for various purposes. The over-exploitation of these valuable resources has resulted in an imbalance in the watershed ecology. The application of spatial analysis tools in studying the morphological behaviour of watersheds has increased in recent decades worldwide due to the accessibility of the geospatial database. A morphometric analysis of a river basin is vital to determine the hydrological behaviour to develop effective management. Under the current study, morphological behaviour of Nand Samand catchment in the hard rock region was evaluated employing remote sensing (RS) and geographical information system (GIS) tools. The Nand Samand catchment (Rajasthan State, India) has an area of 865.18 km2 with the highest and lowest elevations of 1318 m and 570 m above mean sea level, respectively. This study utilises a 30 m high-spatial-resolution ASTER imagery digital elevation model for delineating the catchment. The drainage network is assessed using a GIS method, and morphometric parameters like linear, areal, and relief aspects were calculated. Results were obtained for parameters viz., basin length of 82.66 km, constant channel maintenance equal to 0.68 km, stream frequency of 2.11 km−2, drainage density of 1.48 km−1, and length overflow of 0.34 km. Form factor of 0.13, and the circulatory ratio of 0.28 showed that an elongated shape characterises the study area. The results would help understand the relationship between hydrological variables and geomorphological parameters for better decision-making. The techniques used could effectively help to perform better drainage basin and channel network morphometric analyses. The found morphometric characteristics will be helpful in understanding the Nand Samand catchment and similar areas in India in order to better guide the decision-makers in providing adequate policy to the development of the region.

1. Introduction

In the last few decades, natural resources like land and water have been depleting and deteriorating due to various natural and artificial processes. The water resources are under extreme press due to urbanization and population explosion. The interest in freshwater availability of acceptable quality for drinking and other uses is expanding rapidly. The predicament of ground and below ground surface water is expanding [1,2,3]. About a third of the Earth’s total land area is covered by arid and semi-arid areas [4]. Still, it is worth noting that the consumption is higher than the replenishment in such regions, leading to complicated environmental issues. Watershed management is a supported method for natural resource management in different Indian climates and ecosystems. Therefore, there is an immediate necessity to consider assessment of water and natural resources for living and economic stability [5].
In analysing morphometric characteristics, remote sensing (RS) and geographical information systems (GIS) play an essential role. GIS techniques are now being used to measure different terrain and morphometric parameters (MP) of catchments since these techniques provide a versatile environment and a popular method for manipulating and analysing spatial data [6]. The drainage network obtained from the digital elevation model (DEM) is a more practical approach to drainage morphometric analyses (MA) [7]. Many scientists have utilized traditional methods to study the basin MP of different catchments [8,9,10,11] based on RS and GIS approaches [11,12,13,14,15,16,17,18,19,20,21,22], as such techniques are effective methods [15]. Several studies have assessed the form and processes of river basins using morphometric analysis; for example, Arulbalaji and Padmalal [23] used geospatial techniques for obtaining the drainage network of the Cauvery River basin (India), considering linear, relief, and aerial aspects. The results provided valuable information for water resource development on the basin, revealing that 88% of the sub-watershed networks were localised on high and moderate priority areas for water exploitation. Kasi et al. [24] used various DEMs such as CARTOSAT, SRTM, and topographic maps to perform a drainage morphometric analysis in southern India. The results revealed that the basin is elongated and that the SRTM DEMs have a more significant root mean square error than the CARTOSAT DEMs. The morphometric parameters of Lake Tana and upper Blue Nile basins (Ethiopia) were also assessed using the RS approach and GIS [25]. The results revealed that the study basin, especially Gilgel Abay, is slightly vulnerable to soil erosion and flooding, with a significant contribution of surface runoff on aquifer recharge and groundwater. Authors Giri et al. [26] used the morphometric parameters combined with RS and GIS at Tapi Basin. The analysis indicates that a small part of the area exhibits a gentle slope. However, for the most part, the basin is dominated by moderate to steep slopes with drainage patterns ranging between sub-dendritic and dendritic.
Climate change and the significant increase in human activities and interventions within the watersheds due to the exploitation of natural resources have contributed to increasing arid areas globally. For example, rivers, rocks, and stones from the Sebaou River basin (northern Algeria) have been illegally exploited using bulldozers with direct riverbed interventions. Such materials are usually applied in construction due to their excellent quality [27]. According to Akanwa [28], due to their ability to bond to concrete, the sands and rocks extracted and exploited from the riverbeds and riverbanks are the most coveted materials for building purposes. Researchers Ikhsan et al. [29] documented that sand mining provides employment opportunities and good financial returns to the population of the Progo River (Indonesia). On the other hand, sand mining impacts riverbed stability, reaching alarming levels of deterioration, which led to a change in the hydrological behaviour of the streamflow, interfering with the rainfall and runoff relationship. It is worth highlighting that these interventions adversely affect the proper water resources management and planning decisions.
Catchments, stream basins, and sub-watersheds are the primary administrative units for natural resource conservation. With increasing population and limited land and water resources, the widespread use of these natural resources becomes mandatory. Due to the number of interventions and developments in the Nand Samand catchment, assessing and analysing its morphological characteristics appears to be essential. In this research, an RS database based on DEM of ASTER-30 m high-spatial-resolution imaging and GIS was used for morphometric and drainage network analyses, facilitating the identification of artificial recharge points for water harvesting. As a result, catchment morphometry analysis would support understanding the effect of the landform on the watershed. Additionally, it would assist in implementing a better development strategy for sustainable freshwater management plans and identifying checkpoints to avoid erosion. Drainage basin analysis using morphometric parameters is significant for catchment planning since it provides information about the watershed slope, topography, soil condition, runoff characteristics, and surface water potential, among other factors. The morphometric assessment of a drainage basin and its stream system is facilitated by the determination of the drainage basin’s linear, area, and relief characteristics [30]. A thorough morphometric study of a basin is extremely beneficial in determining the effect of drainage morphometry on landforms and their characteristics. An advantage of quantitative analysis is that many of the basin parameters generated are dimensionless ratio values, which allow an effective comparison regardless of scale [30,31]. The present work describes the evaluation of many morphometric parameters for Nand Samand catchment, Rajasthan State in India, using the ArcGIS10.1 software. The linear, aerial, and relief characteristics of the Nand Samand catchment were mathematically calculated in order to comprehend the many geomorphometric parameters necessary for the planning and development of the basin’s water resources.
The catchment is the vital hydrological entity for growth, development, and sustainable utilization of its resources, viz., water, soil, vegetation, etc. Any imbalance of its components can result in negative effects on all the associated components. Morphological characteristics of catchment influence the rainfall-runoff relationship, soil erosion, water conservation, vegetation, human settlings, among others. Therefore, understanding the hydrological properties of the catchments is vital to plan effective strategies to manage soil and water resources and for ecological balance. The present study aimed to study the hydrological behaviour of the Nand Samand catchment in the hard rock region, Rajasthan, in India, by analysing the morphological aspects employing RS and GIS.

2. Materials and Methods

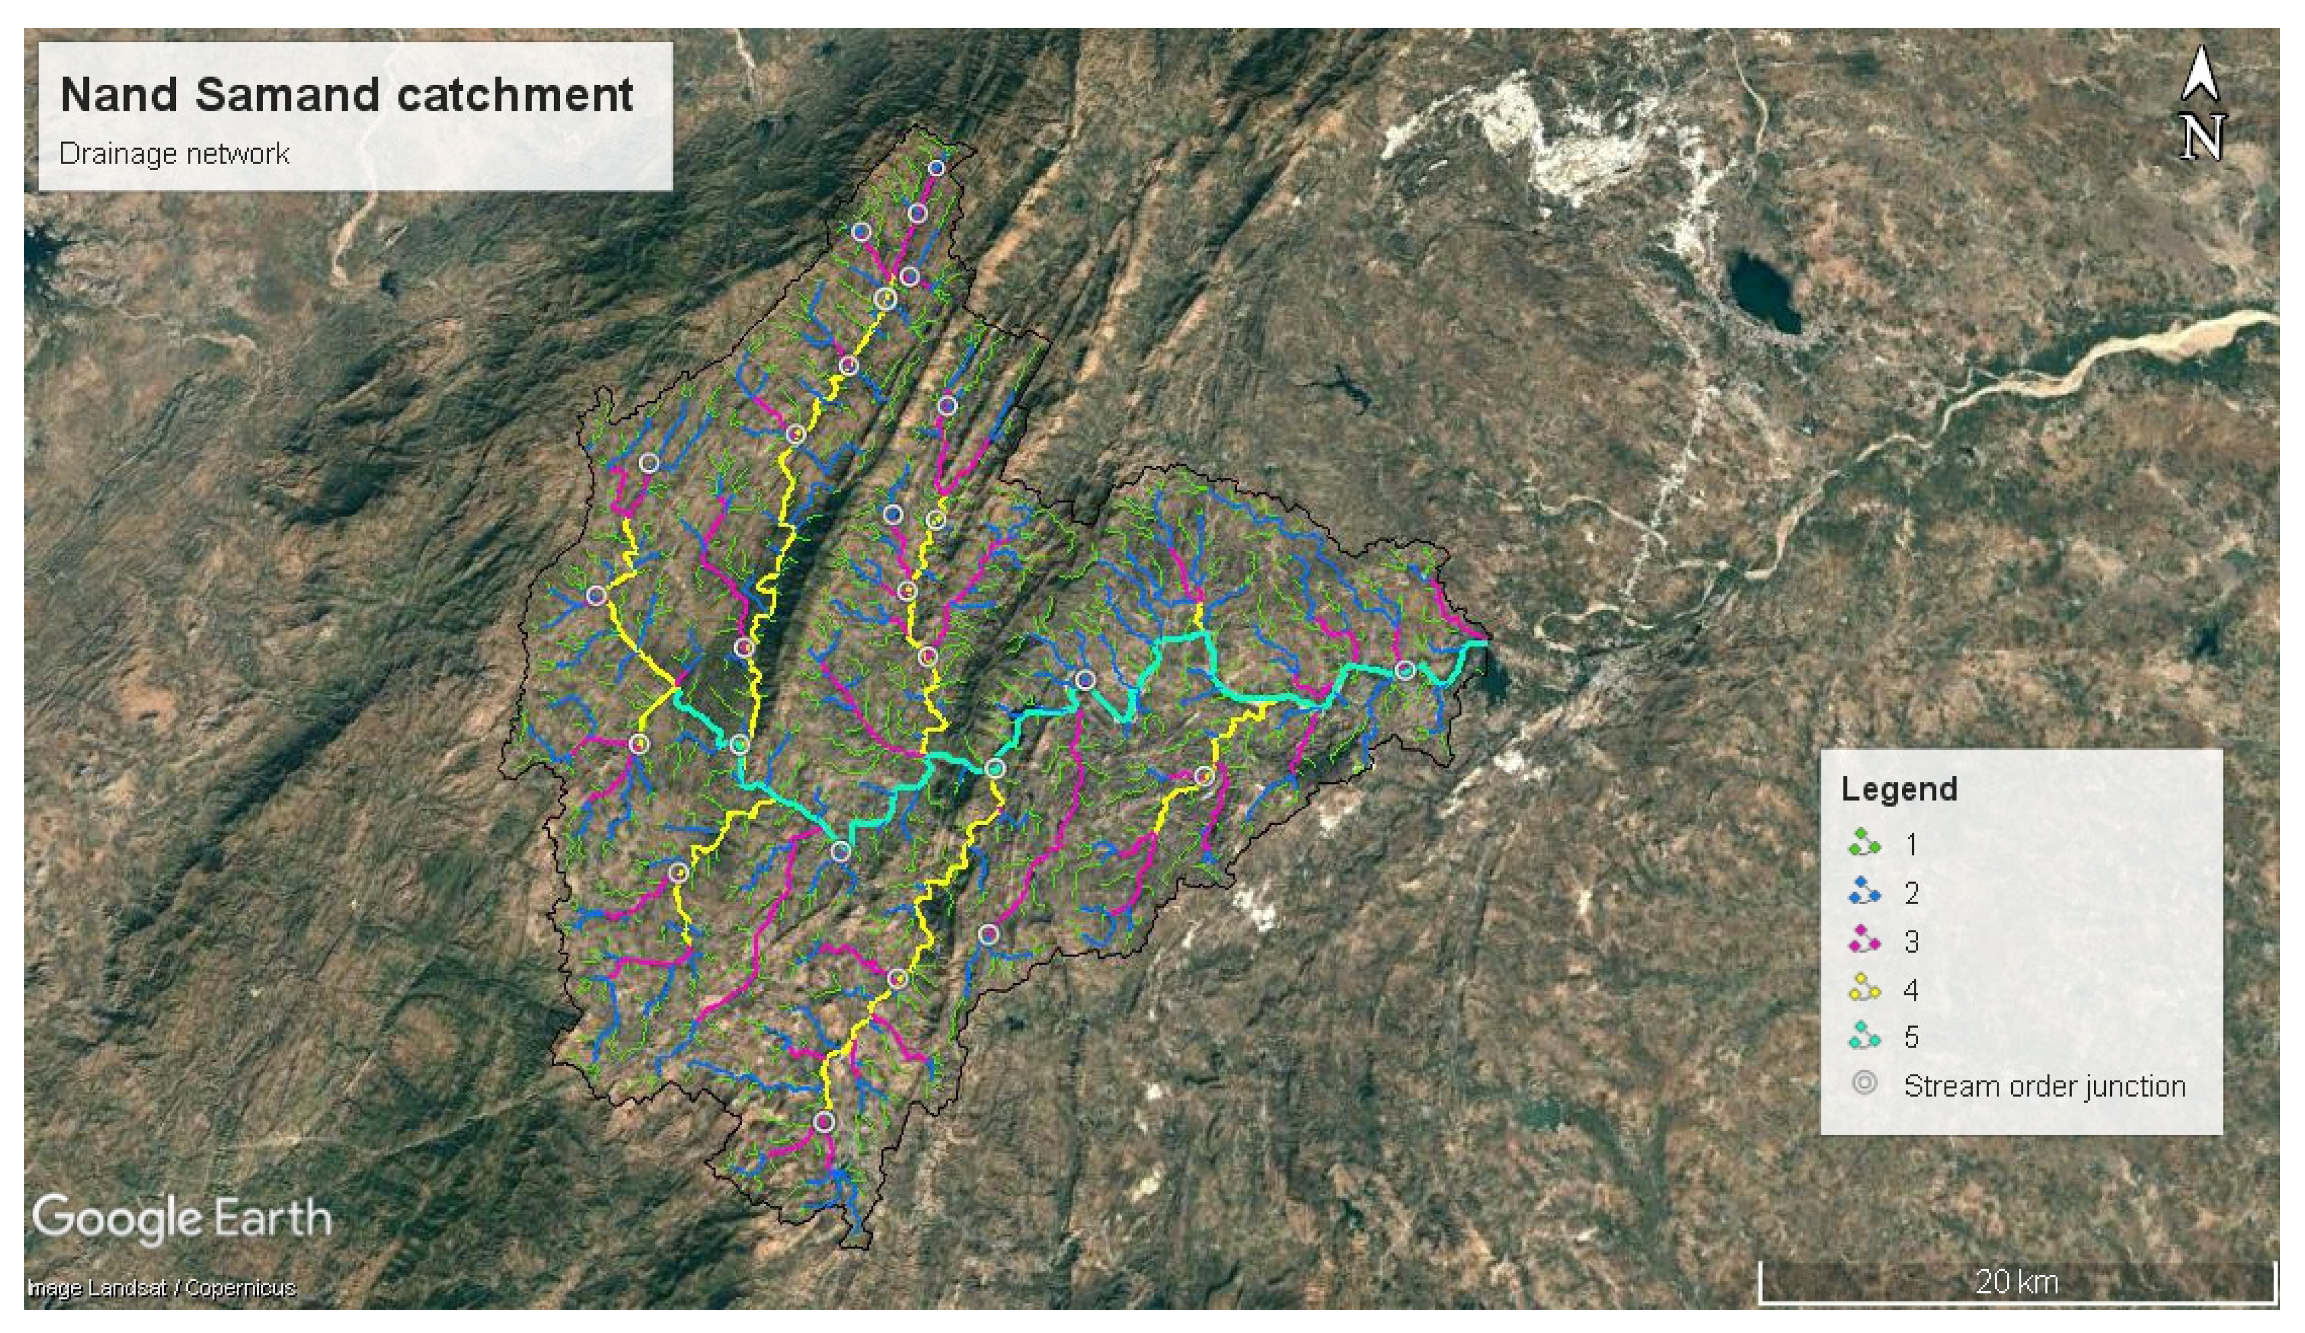
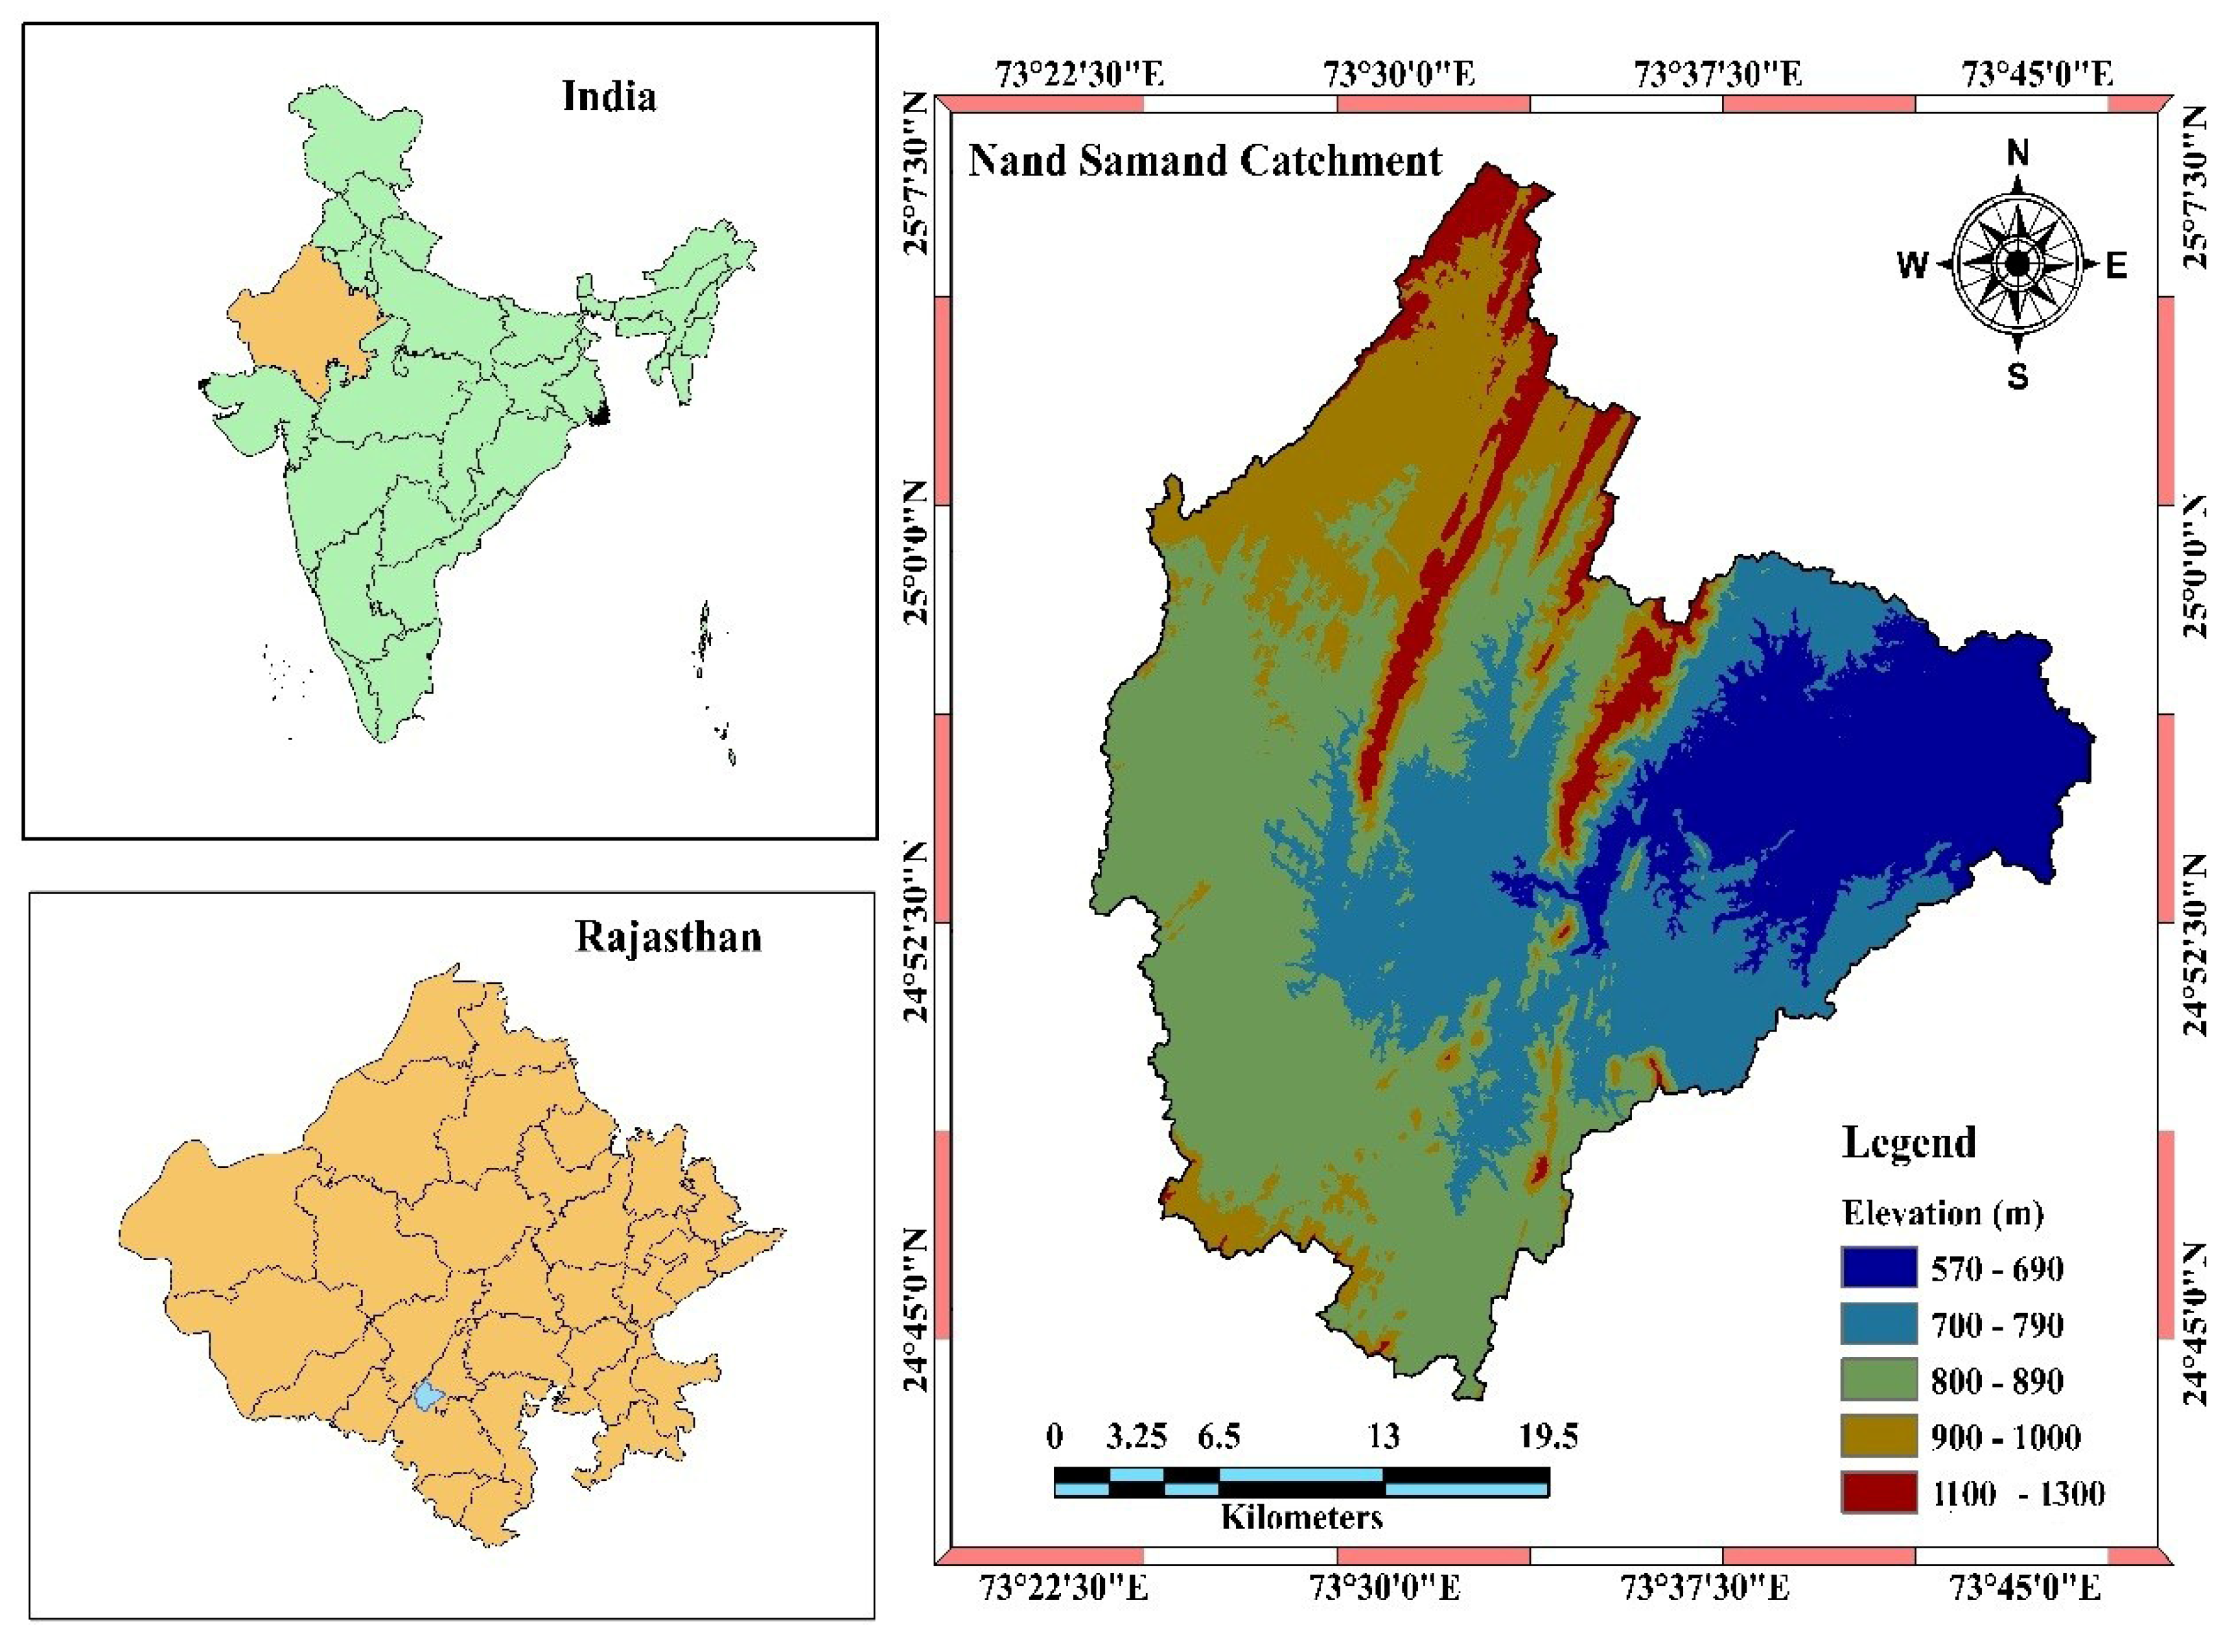
2.1. Study area Description

The Nand Samand catchment is located in the Rajsamand district of Rajasthan State, India, between the coordinates of 24°0′0.5″ and 26°0′0.5″ N latitudes and 72°59′59.50″ and 73°59′59.50″ E longitudes (Figure 1). The study area falls under an arid to semi-arid climate with an annual average rainfall (2001–2011) of 640.45 mm [32]. In Rajasamand, the winter season starts in November. The mean daily minimum and maximum temperatures are 7.8 °C and 38.6 °C, respectively, and January is the coldest month, whereas May is the warmest month. The southwest monsoon receives nearly 93% of the total annual rainfall in the state. The district’s central and eastern areas are mainly flat, forming the foothill of the Aravalli ranges. The major river of the district is Banas, with its tributaries, i.e., Khari and Chandrabhaga, creating an excellent drainage system in the area [33]. The total study area is 865.18 km2, with the highest elevation of 1318 m and the lowest elevation of 570 m.

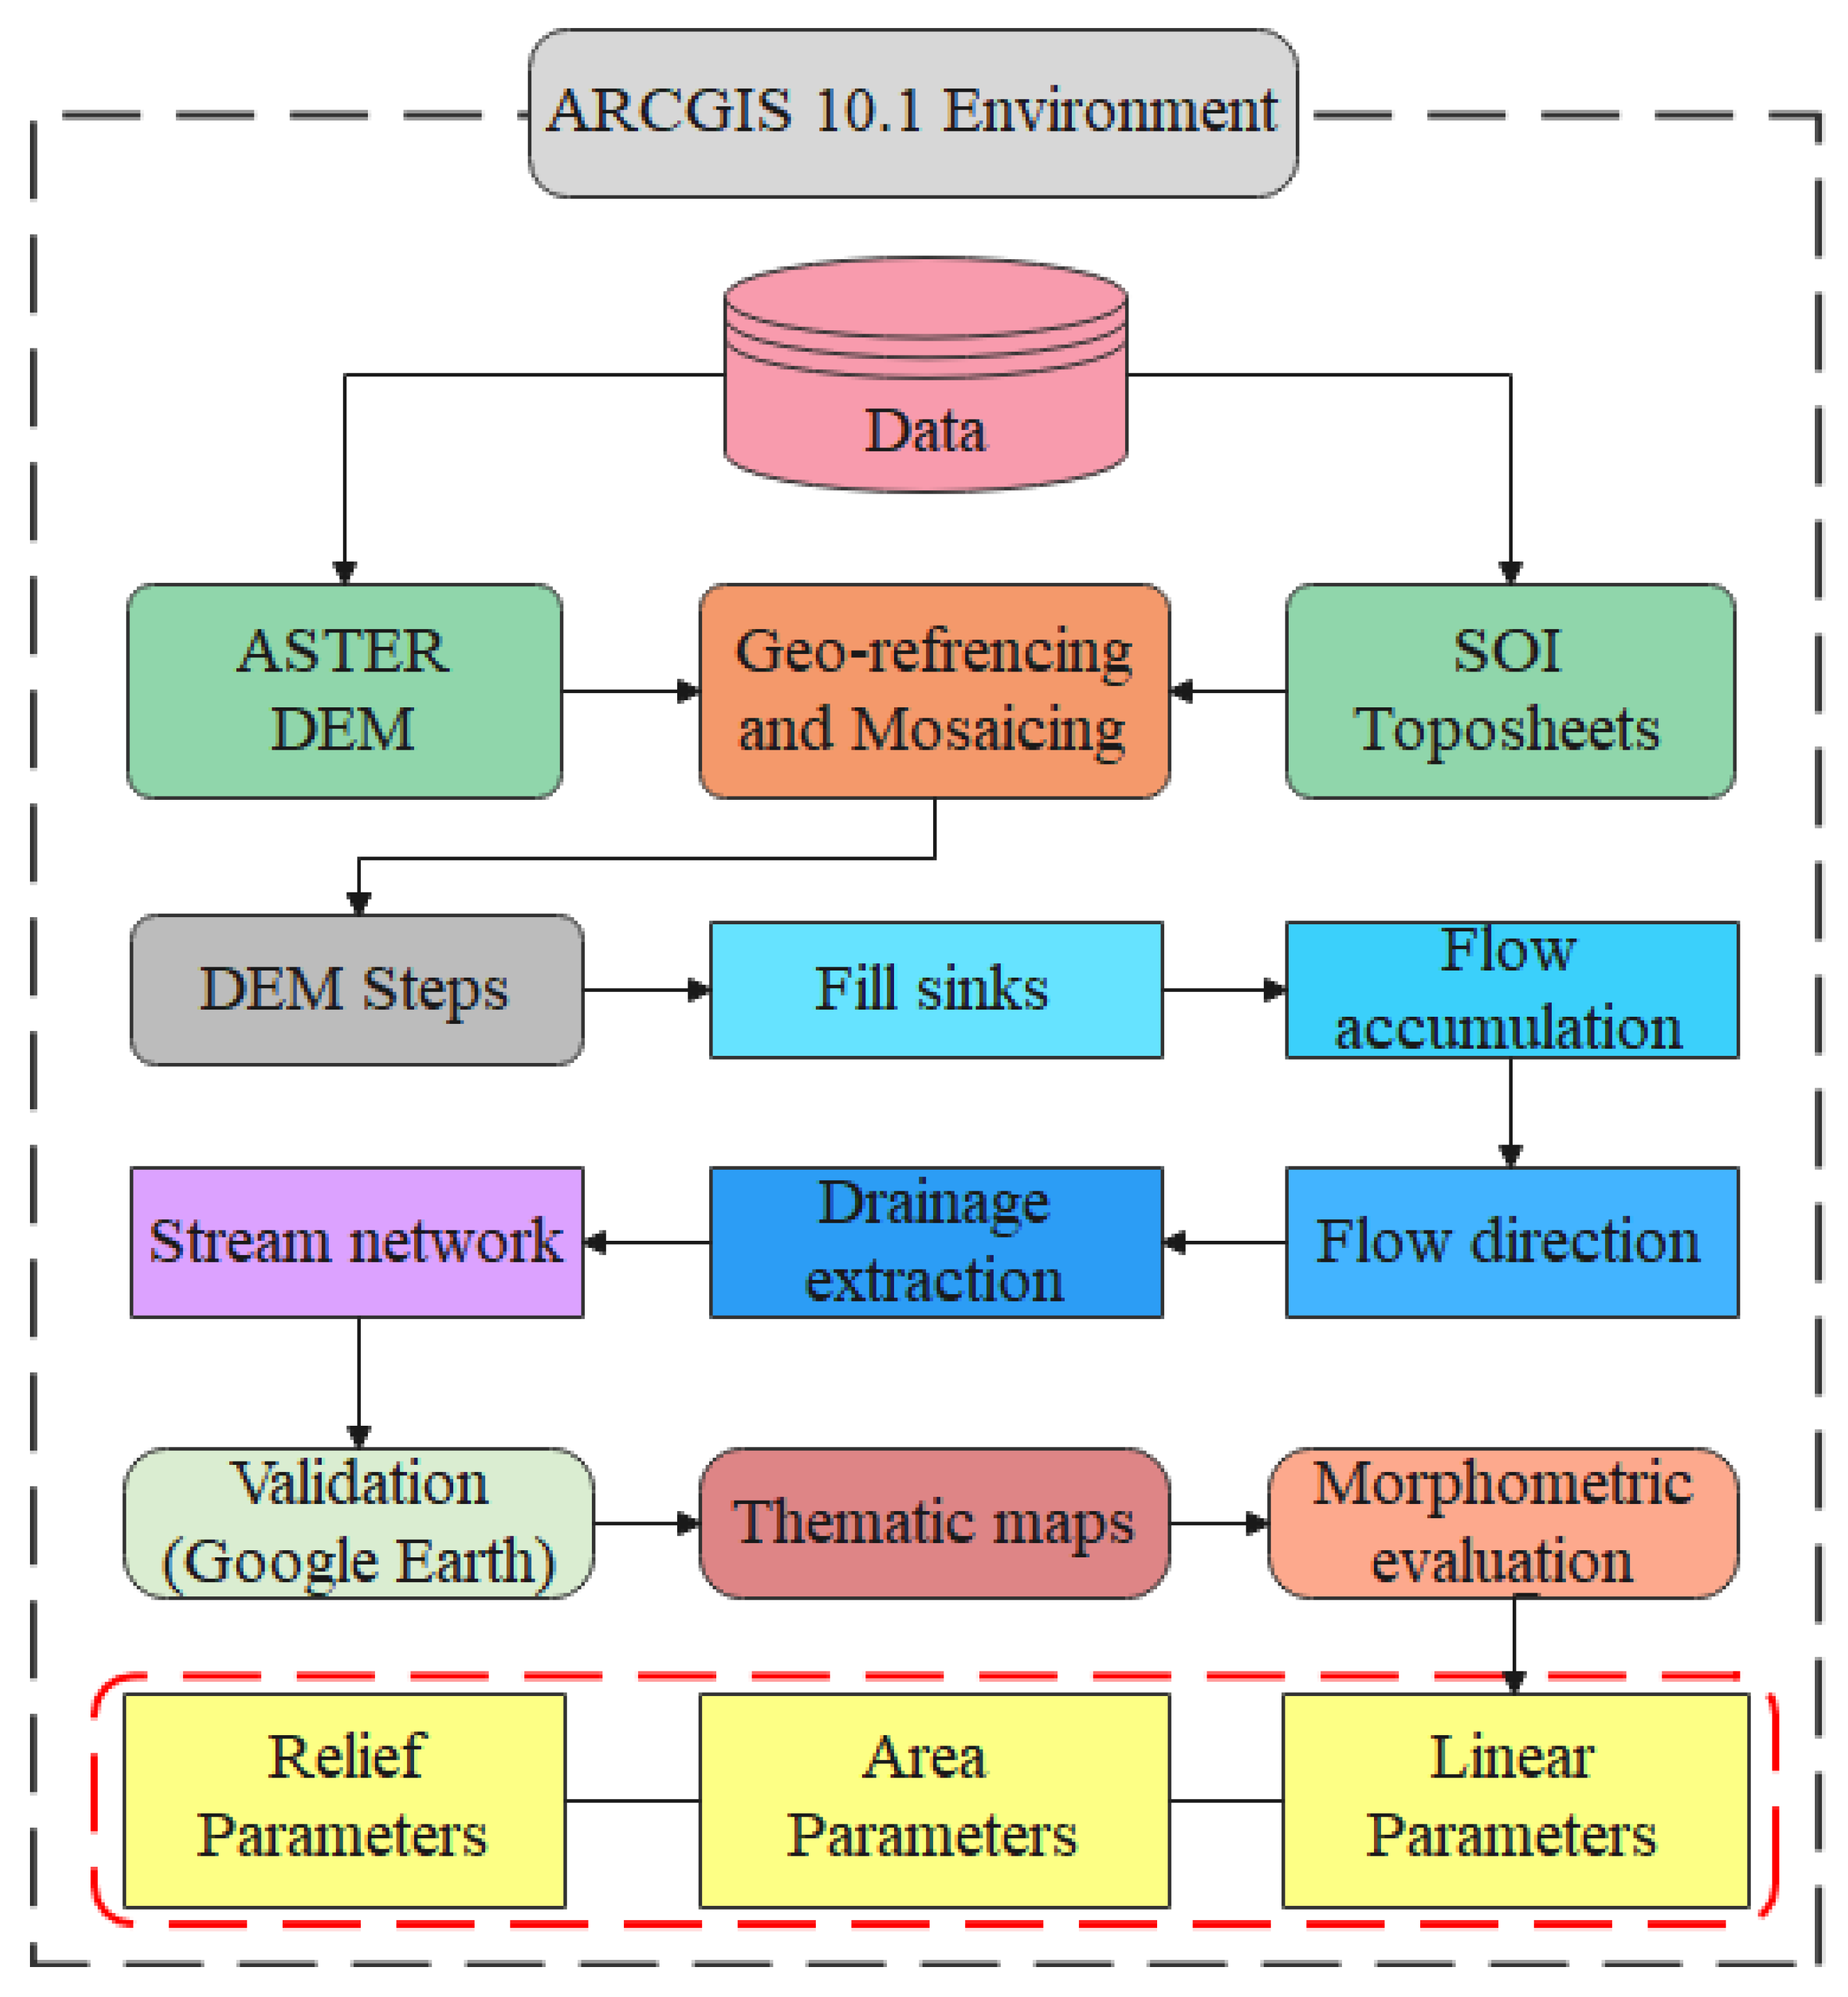
2.2. Data Sources and Analysis

The ASTER-DEM was used to create the drainage map of the research area, a satellite image from which DEM information was extracted on 10 August 2019 (source: https://earthexplorer.usgs.gov), and reference Survey of India toposheet map at a scale of 1:50K with projection “WGS UTM 1984, Zone 43N.” ERDAS-Imagine 2014 and ArcGIS 10.4 software were used for basic image processing and delineation of the catchment and stream network extraction [21,34]. ASTER-30 m DEM was used because it gives efficient results which can be utilized for meso- and micro-level watershed characterization [34]. There are many steps involved in creating a drainage network for a catchment in the ArcGIS tool. The methodology flow diagram for morphological evaluation of the Nand Samand catchment is displayed in Figure 2.
In the ArcToolbox, the hydrology spatial analyst tool has successive steps to generate a drainage network. The filling process in the flow diagram means removing any error from raw DEM. Then, if there is an error in DEM due to missing pixels, it would be fixed, whereas if some pixels are extra, they would be removed to create a hierological corrected surface for a better analysis. The next step is the flow direction, which counts the elevation from higher to lower and assigns a number representing a direction, meaning a direction coding [21,35,36]. The flow accumulation counts how the pixels are accumulated, defining a higher number of pixels with a higher possibility of accumulation [37]. The drainage network was extracted by considering the pixels greater than a threshold of 300, based on a trial-and-error method [38,39].
Further, different parameters of individual aspects were calculated, and the details are given in the Results and Discussion section. Geomorphic properties are considered essential indices for the surface processes, which help identify the geomorphologic and surface-water hydrologic aspects [40,41,42].

2.3. Quantitative Analysis

Stream Order (u): A drainage/stream network collects naturally structured stream segments in a watershed. The stream hierarchy is represented as a sequence number based on the drainage position, which provides vital information about the watershed’s hydrogeomorphic character. This study determined the stream hierarchy based on Strahler (1964) [43] to calculate the catchment stream order. The Nand Samand catchment is a dendritic drainage type, indicating homogenous soil and rock types [44,45,46].
Mean stream length (Lsm): The Lsm is a specific property of the drainage network and its related surfaces, according to the characteristic size given by Strahler (1964) [43]. The Lsm equation is given as:
L sm = L u N u
where, Lu is the total stream length of order u, and Nu is the number of streams of order u. Its value is a function of the basin’s slope, scale, and topography for distinct orders.
Stream length ratio (RLr): The stream length ratio is calculated using Equation (2) as proposed by Horton (1945) [8], in which RLr is dimensionless.
R Lr = L ¯ u L ¯ u 1
where, L ¯ u   and   L ¯ u 1 are the mean length of stream segment of order u and the next lower order, respectively.
Bifurcation ratio (Rb): The Rb is defined as the ratio of the number of stream segments of a given order u by the number of stream segments of the next higher order. Schumm (1956) gives the bifurcation ratio [47] as:
R b = N u N u + 1
where, Nu+1 is the number of stream segments of the next higher order.
Stream Frequency (Fs): The stream frequency was first introduced by Horton (1932) [48] for basin morphology characterisation based on the number of stream segments (Nu) per unit basin area. Equation (4) expresses it.
F s = N u A
where, A is the catchment area (km2).
Many different factors affect soil thickness; those include lithology, texture, and rainfall [44,49]. Rho coefficient (ρ) is also calculated in the present study and is defined as the ratio between RLr and Rb.
Drainage density (Dd): The Dd is a total length of a stream per unit area provided by Horton (1932) [48]. Dd map of the studied basin was elaborated in the ArcGIS environment. It is the ratio between the total length of all the thalwegs over the watershed, allowing us to know the permeability and porosity of the watershed.
Texture (T): T is the ratio between the total number of streams of total orders and the perimeter of the catchment (T = Nu/P) [8,9]. It varies according to the basin’s geology at various growth phases [9]. Unprotected vegetation and soft or weak-rock locations have a very fine texture, resulting in significant erosion rates and fewer opportunities for groundwater recharge [50]. The texture (T) can be divided into five categories: extremely coarse (<2), coarse (2–4), intermediate (4–6), fine (6–8), and very fine (>8) [9].
Different indices can be used to evaluate the shape of the drainage basin. The most common factors are outlined as follows:
Form factor (Rf): The form factor is defined as the ratio of the basin area by the square of the basin length. The circulatory ratio is defined as the ratio of the basin area by the area of a circle whose perimeter is the same as the perimeter of the drainage basin. The elongation ratio is defined as the ratio of the circle’s diameter, which has the same area as the basin, by the maximum basin length. Horton (1932) [48] described the basin shape using the form factor (Rf), calculated by Equation (5) [51].
R f = A L 2
where,
A = catchment area, km2
L = catchment length, km
Circulatory ratio (Rc): Miller (1935) [52] used the term ‘circulatory ratio’ to indicate the basin shape. Rc was calculated by Equation (6) [51] for the present study.
R c = 12.57   A P 2
where, P = catchment perimeter, km.
Elongation ratio (Rl): The elongation ratio measures the drainage basin’s form [47], and the Rl was calculated by Equation (7) [51]:
R l = 1.128 A L
Generally, Rl varies between 0.6 and 1.0, depending on geographic and geological conditions [34,53].
Length of overland flow (Lg): The Lg [8] represents the length of the flow path projected on the horizontal plane from a point in the drainage divisions to the neighbouring stream channel. It is a fundamental watershed characteristic that affects both the hydrologic and physiographic development of a watershed. Lg was calculated by Equation (8) as follows:
L g = 1 2 D d
where, Dd = drainage density in km−1.
Relief ratio (Rh): The relief ratio (Rh) was introduced by Schumm (1963) [54] as the ratio of basin relief and basin length (i.e., Rh = H⁄L). The catchment area with a high Rh corresponds to mountainous areas, while the basin area with minimum Rh values corresponds to pediplains and valleys. As it is a height-length ratio, it is a dimensionless property.
Relative relief (Rhp): Melton (1957) [55] used the term relative relief to represent the relief of the watershed. It is given by the Equation (9):
R hp = H P 100
where,
Rhp = relative relief (%)
H = catchment relief (m)
Ruggedness number (Rn): The Rn is a product of H and Dd, i.e., ruggedness number = H × Dd. It is a dimensionless term. Generally, the geomorphology resulting from complex geomorphic processes is characterised based on the roughness index data [56].
Dissection Index (DI): The DI indicates the degree of vertical erosion (dissection), a ratio of basin relief and absolute relief. The value of DI lies between 0 and 1, showing the complete absence of vertical erosion, the prevalence of flat surface, and vertical cliffs/escarpment on land [44]. The obtained DI value was 0.68, which shows the catchment has moderately dissected topography; hence, it is concluded that vertical erosion affects the catchment’s topography.
Hypsometric Analysis (HA): The HA of a river basin is used to estimate the link between the drainage basin’s horizontal area and its elevation. A curve is created by plotting the relative heights (h/H) and areas (a/A) [52], which is called the hypsometric curve. The HA was proposed by Langbein (1947) [57]. The hypsometric curve for the study area is seen in the next section. Currently, hypsometric curves are generated through GIS, and have been widely used throughout [51]. For example, many researchers have studied hypsometric analysis using GIS techniques (e.g., [18,19,21,22,39,58,59,60]). HI was calculated based on Equation (10) in this study [47,61].
HI = ( H mean H min ) / ( H max H min )
where,
Hmean = the weighted mean elevation
Hmax = maximum elevation
Hmin = minimum elevation

3. Results

The quantitative analysis of the Nand Samand catchment was carried out by calculating various MP of the catchment, presented in Table 1, Table 2 and Table 3. It entails examining the catchment’s geometry and stream/channel system in order to determine the drainage network’s linear characteristics, including stream order (u), bifurcation ratio (Rb), stream length (Lu), stream number (Nu), stream length ratio (RLr), mean stream length (Lsm), mean bifurcation ratio (Rbsm), and Rho coefficient (ρ). Areal parameters included catchment area (A), catchment perimeter (P), basin length (L), drainage density (Dd), stream frequency (Fs), shape parameters, drainage texture, infiltration number, length of overland flow (Lg), and constant of channel maintenance (C). Formulae based on Refs [9,48,62,63] were used to calculate the catchment’s morphometric parameters. Also, relief aspects of catchment have been determined, including basin relief (H), relief ratio (Rh), relative relief (Rhp), ruggedness number (Rn), dissection index (DI), and slope (S).
Stream Order (u): The morphometric analysis was conducted by quantifying the catchment’s linear, areal, and relief characteristics. Strahler (1964) [43] terminology is used to determine the stream orders. The catchment area of the Nand Samand is of the fifth order. The study area’s stream order map was created in the ArcGIS environment (Figure 3). Horton’s second law states that the overall length of stream segments was greatest in first-order streams and decreased with increasing stream order. The present catchment satisfies Horton’s general statement that stream order has an inverse relationship with the length of stream segment, as shown in Table 1. Variations in stream orders are likely restricted by the catchment’s physiographical, geomorphological, and geological situations [64,65].
Bifurcation ratio (Rb): The Rb values ranged between 1.39 and 2.18; as seen from Table 1, the Rbsm is 1.82. The basin areas with fewer structural disturbances have minimum Rb values, whereas a maximum value implies a substantial disparity between sequential orders due to developed topography [66,67].
Drainage density (Dd): The calculated Dd value of the catchment is 1.48 km 1 as seen from Table 2 and shown in Figure 4. Therefore, the Nand Samand catchment has low Dd, indicating that the area has an intensive vegetative cover and extremely permeable subsoil [34,66,67]. If the Dd is less than 2 km/km2, water may reach a channel quickly, which would increase the discharge [30].
Slope: The present study catchment revealed a slope degree ranging from 0 to 58°, as illustrated in Figure 5. The upper catchment area has a high slope compared to middle and lower catchment areas, which results in rapid sedimentation in the lower areas [16,21,67]. Slope data may thus be used in planning and designing engineering structures, construction of water harvesting structures, agricultural mechanisation, and many other resource conservation strategies [68].
The aspect of the catchment: The face of the mountain slope is referred to as its aspect. It directly affects the local atmospheric condition because the sun stays in the west throughout the hottest part of the day, the afternoon. Therefore, the region with the west-facing slope feels warmer as compared shaded east (E)-facing slope in most cases. The catchment aspect affects biodiversity and agricultural productivity in the area [21,49], where 0° is the true North (N), 90° is the E, 180° is in the south (S) dimension (Figure 6). Aspect values considerably impact the vegetation distribution and biodiversity within the basin region, which is highly beneficial for agricultural production growth [69].
Stream number (Nu): The stream number is the total stream sum-up of individual stream orders [8]. The Nu is negatively related to u, as plotted in Figure 7, which shows a correlation between the stream order and stream number, with the stream number decreasing as the stream order increases. Various geospatial platforms can be used to measure the stream numbers of various orders. The Nand Samand catchment has 1824 streams, from which 922 are of the first order, whereas 422 are of the second, 228 of the third, 164 of the fourth, and 88 of the fifth, as seen in Table 1. The stream number declines with growing order, resulting in more infiltrations in less-order streams as compared to subsequent orders in the catchment [18,21,70].
Stream length (Lu): The total length of streams is 666.89 km, 316.56 km, 145.91 km, 95.42 km, and 52.21 km, respectively, for the 1st, 2nd, 3rd, 4th, and 5th order streams, it is seen from Table 1. The graphical representation in Figure 8 shows that overall stream length usually decreases as stream order increases. In general, smaller streams are found in higher and steeper slopes, while longer streams can be found in lower and flatter areas [21,32,71]. As a result of the varied lithologies and elevations around the catchment, there is a greater risk of ground flow in the irregular upper catchment parts than in lower catchment parts.
Mean stream length (Lsm): The results obtained about Lsm indicate values ranging from 0.58 to 0.75 km (Table 1), mainly linked to changing topographic slope and elevation [21].
Stream length ratio ( R Lr ): The R Lr value varies from 0.46 to 0.72 in the current work, as seen in Table 1. An upward trend in value from low to high-order stream suggests that the catchment has developed maturely as late youth show a decrease. This study reveals that the topography is tectonically active, which influences the Nand Samand catchment’s fluvial pattern, affecting discharge and sediment deposition [21]. It is observed that the R Lr changes between consecutive stream orders due to differences in topographic conditions and slope [68,72].
Stream frequency (Fs): The research has 2.1 km−2 of Fs Table 2; thus, recharging in more permeable sub-surface regions is possible. Fs and Dd are inextricably related, and their values rise as the number of streams grows [18,21,64].
Rho coefficient ( ρ ) : For the present study, the ρ coefficient is 0.31. The value of the ρ coefficient has signified a more advanced hydrologic storage during peak discharge, suggesting higher hydrologic storage as erosion impacts decrease [34,63,67,73,74,75]. The lower value of the ρ coefficient explained the less water-storing during the flood time interval and the high erosion effect [30].
Drainage texture (T): As it is seen from Table 2, the T of the catchment is 6.47 per unit area, suggesting that the catchment has a fine texture and a higher risk of erosion, which can be minimised with effective long-term watershed management [16].
Form factor (Rf): The Rf obtained about the study basin is 0.13 (Table 2). The low value of the form factor shows a long and narrow basin [30,67,76].
Circulatory ratio (Rc): From Table 2 Rc of the research, the area is 0.28, which is <1 and shows almost an elongated shape [15] and the dendritic stage of a basin [67,68,76].
Elongation ratio (Rl): As seen from Table 2, the Rl of the studied basin is 0.40. Rl values of less than 0.50, between 0.50–0.75, and greater than 0.75 are observed in drainage basins in arid and semi-arid climates, respectively, for tectonically active, mildly active, and inactive settings [15,77]. Values between 0.6 and 0.8 are commonly seen in high relief and moderate to the steep land slope [45]. Elongated catchments have considerable relief followed by steep slopes sensitive to headward erosion and have an elongation ratio of less than 0.7 [30,76].
Length of overland flow ( L g ): The calculated Lg value is 0.34 km, as seen from Table 2. The Lg of the current study is >0.3 km2/km, which shows that catchments have longer flow paths [30,44].
Constant channel maintenance (C) of catchment: It is used to define the morphological property of drainage basins, proposed by Schumm (1956) [47], who explained the C as the reciprocal of drainage density. Its value for the present research area is 0.68 km, as in Table 2. A higher value of C suggests reasonable lithological control with a porous surface, implying substantially greater infiltration level, mild surface discharge or runoff, and a watershed that is unaffected by structural features [17,18,19,78]
Relief aspect of the drainage basin
Catchment relief (H): The relief of the basin is critical in granting denudation landforms and affecting stream patterns [56,79]. H values of the present study lie between 570 (minimum height of the catchment (z)) and 1318 m AMSL (maximum height of the catchment (Z)), and the catchment relief value is 748 m, as in Table 3. It affects the flood pattern and sediment load in river flow [62].
Relief ratio ( R h ): As demonstrated in Table 3, the Rh is 0.01. It indicates the basin’s steepness, affecting high discharge and runoff intensity [44].
Relative relief ( R hp ): The Rhp value of this basin is 0.38 (Table 3). Rhp can be used for exhibition the dimensions of the relief basin without regard for the sea level [80].
Dissection Index (DI): The dissection index of the basin was mapped in Figure 9. DI value between (0.1 to 0.4 and 0.4 to 0.7) shows rolling and moderately dissected [17,64].
Ruggedness number (Rn): The relief ratio’s value is 1.10, which reflects being more susceptible to erosion Table 3 [15,17,22]. Rn four categories based on its morphology: subdued (<0.1), slight (0.1 to 0.4), moderate (0.4 to 0.7), and sharp (0.7 to 1.0) [81].
Hypsometric analysis: The hypsometric integral (HI) value of the present study is 0.50 (Figure 10). It indicates the mature or equilibrium stage of dissection. A mature watershed’s hypsometric curve is an S-shaped graph that concaves rising at higher elevations and descending at lower elevations [59].
Research outcomes validation with Google earth pro: The current study used a method to extract drainage networks by calculating the Li, Ar, and RA. The outcomes were verified with Google Earth Pro (GEP) software [21]. The obtained stream network was transformed to a keyhole mark-up language file and then imported into GEP. The stream network was extracted and overlaid on corresponding catchment areas with different order streams. Furthermore, using the ArcCatalog GIS tool, stream order junction points were extracted as point shapefiles. The points received are converted to keyhole mark-up language file format for another overlay on stream networks. In Google Earth, a corresponding map was created, presenting many stream orders and points to show stream validation. The study area map created in Google Earth presenting all stream orders with junction points is seen from Figure 11.

4. Discussions

Managing water resources sustainably requires holistic planning, design, and execution. The present study evaluated the morphological characteristics of the Nand Samand Catchment to determine the hydrological behaviour. The catchment has a moderate slope, as shown by the dendritic drainage pattern, which generally implies the presence of massive crystalline hard rock in the terrain [45,82]. The stream orders are designed by using [43] nomenclature system. The highest stream order of the Nand Samand catchment is fifth-order, similar to that of the Pimpalgaon Ujjaini watershed [15]. The variance in the stream order is primarily due to the watershed region’s topographic/physiographic factors. According to Ritter et al. [83], lower-order streams are a stronger flood predictor and a fast accumulator of rainwater. Thus, in the current catchment, the first-order stream-distributed area that can be used to assign recharge points is at its limit, and there is a high risk of water overflow in higher-order streams. Likewise, Bandihole, a fifth-order basin, is a hilly terrain with a moderate to a steep slope that is clearly depicted by ASTER and SRTM. Therefore, the satellite data show a very high variation in the I, II, and III order streams [34]. The Rbsm value obtained suggests the requirement of biological (vegetation) and structural (check dams) control measures in the catchment amid higher permeability values and more geological complexity [62]. Generally, when values of Rb (bifurcation ratio) are greater than 10, it means that the geologic formations have little influence on the drainage pattern of the river basin [63]. The higher value of the bifurcation ratio (Rb) shows control of geological structure over the area. A study by Singh et al. [17] found that the bifurcation ratio of the area of the Mandakini watershed understudy was 4.2, which indicated that the watershed is tectonically active. In the present study, the values of Rb also range from 1.39 to 2.18 (<5); hence the area has probably suffered any structural disturbances; a similar result was reported by Shivaswamy et al. [18]. The mean bifurcation ratio of 1.82 for the research area implies that geologic formations did not deform or alter the drainage network [45]. The mentioned studies had also evaluated the drainage density of the basin and reported similar results as the present study for the drainage density. The drainage density (Dd) of SWD-8 watershed has highly permeable sub-surface soil material and low relief [15]. The drainage density of the area varies from 1.49 to 2.65 km/km2, indicating that the catchment has moderate to coarse texture [18]. The slope is proportional to the runoff speed, determining the amount of time required for rainwater to enter the riverbeds that comprise the river basin’s network [60]. The slope analysis is a key factor in morphometric analyses and geomorphological studies of the Nand Samand catchment. The most noticeable aspect of topography is its direction [64], which affects the vegetation type, precipitation system, snowmelt, and wind contact. First-order streams and associated headward erosion facilitated the formation of badlands. As a result of the significant association between stream order and Log Lu, it can be observed that such a critical piece of information, or more precisely a straight-line relationship, obscures a conclusion when a log variable is used in the plot (Figure 8) [17]. Due to the permeability of the rock developments in a catchment, stream length and their ratio are critical parameters for scanning the hydrological properties of the watershed. Additionally, it indicates whether there is a significant change in the hydrological features of the underlying rock surfaces during the course of the watershed [5,45]. The lower is the stream frequency (Fs) and the Dd and the minimum is the surface discharge or runoff [71]. Minimum values of Fs (1.0–3.5) show that the stream is restricted by the fractures [22]. The Bagain River basin’s stream frequency was determined to be 2.18. Thus, the stream frequency in the research area is moderate [45].
The circulatory ratio (Rc) is primarily concerned with the length and frequency of streams, the geological structure of the basin, the land use and cover of the basin, the climate, relief, and slope of the basin. It is an important ratio that reflects a watershed’s dendritic stage. Low, medium, and high levels of Rc correspond to the juvenile, mature, and old phases of the tributary watershed’s life cycle [45,84]. The Nand Samand catchment has an elongation ratio (Rl) equal to 0.40 (Table 2). The watershed’s elongation ratio is between 0.34 and 0.42, indicating that the catchment is more elongated [18]. The length of overland flow computed in this study is 0.28 km, meaning that the study area has little surface runoff, as demonstrated by the study results [45]. The total relief of the catchment is 0.748 km, which indicates that the watershed has enough slope for the runoff to occur from the remote point of the watershed to the outlet. A high relative relief ratio indicates that the area is composed of resistant rock patches, whereas the low relief ratio indicates a less resistant patch of rocks [18]. Nand Samand catchment presented a moderately dissected index; a similar result for dissection index was found by Rawat et al. [45]. The presence of a high roughness number (Rn) indicates that the region is prone to erosion as a result of the structural complexity of the terrain [83,85]. The present study also studied the hypsometric characteristics of the catchment. Hypsometric curves and hypsometric integrals (HI) are essential indicators of the catchment conditions [66]. The HI is given as a percentage and serves as an indicator of the amount of current volume that remains when compared to the total volume of the basin at the time of measurement [86]. The hypsometric integral is useful in explaining the erosion that has occurred in the watershed throughout the course of the geological time scale as a result of hydrologic processes and variables contributing to land degradation [64]. The hypsometric curve for Gaj sub-watershed [87] presents almost S-shaped with concave upward shaped for higher elevation points. The HI values range between 50 and 55 percent for the designated sub-watersheds, indicating that erosional activities are massive in all the sub-watersheds, aggressively degrading the landforms and preventing them from establishing equilibrium with the surrounding environment. When an erosional cycle reaches the mature stage, landforms experience active denudation and are on the verge of degrading, i.e., the erosion of elevated landmasses, in each sub-watershed with an HI value of 50 percent, that sub-watershed is considered to be in the mature stage of its erosional cycle [18,87]. The findings of the study indicate that digital elevation models (DEMs) may be beneficial in examining topography in a geographic information system (GIS). In its purest form, geomorphological research is the systematic study of existing landforms, which can be related to their origins and natures, as well as to their development and geologic alterations aspects, as well as their relationships with other underlying structures. Regarding basin area development and management, the technology has proven to be both successful and cost-effective in the study and inventory processes [88,89,90]. Systematic examination of morphometric parameters within the drainage network utilising RS and GIS can significantly benefit understanding the basin characteristics.
The results can help plan, design, and manage the land and water resources effectively for sustainable development. This study has utilized ASTER DEM with 30 m resolution for morphological evaluation, which may be considered as coarser resolution for micro catchment level studies and may affect the design and planning processes of structures that necessitate high accuracy. Therefore, high resolution DEM can facilitate better information to achieve better morphological assessment. Other parameters that influence the morphological aspects should be considered for better results. Effects of various spatial DEM resolutions on the morphological parameters need to be ascertained for better results. However, the findings of the present investigation could facilitate the overall understanding of the hydrological behaviour of the Nand Samand catchment.

5. Conclusions

Qualitative and quantitative analysis of the geomorphological parameters of Nand Samand catchment has been carried out using GIS to depict much important information essential for planning and implementing land and water management strategies in the Nand Samand catchment. Linear aspects showed that the catchment had formed a dendritic type drainage pattern with the highest order fifth and elongated catchment, giving a more extended runoff period, generating more chances of recharge. Specific in-situ and ex-situ soil water conservation structures for site suitability could be planned based on catchment type. The elevation of the study area varied from 1318 to 570. The Nand Samand catchment has a maximum number of lower-order streams and maximum total stream duration in the first order, which enhances the possibilities of water potential recharge due to increased ponding time. The Dd of the catchment is <2 km−1, which falls within the very coarse texture category. The calculated value of Re is 0.40, and it represents the area is slightly tectonic active. The Lg of the present study is more than 0.3 km. Hence, the study area has a longer flow path related to more infiltration and minimum runoff. The ρ coefficient is 0.31. The maximum value of ρ has indicated developed hydrologic storage during the high discharge. It is found that the bifurcation ratio is less than 5, which shows a slight structural disturbance. The stream network & structural information would aid planners and decision-makers in constructing sustainable watersheds and allocating AR systems for resource management in various catchment areas. The current research is also beneficial to the long-term development of natural resource management in the Nand Samand catchment’s micro watershed. However, it is necessary to monitor additional components such as land use, climate, and soil type that have been recognised as influencing hydrologic processes in order to unravel the multidimensional character of the problem and arrive at a holistic explanation.

Author Contributions

D.D., J.R. and N.A.-A. Conceived the research framework, processed data, designed the experiments, plots and maps preparation, validated the processing results and wrote the manuscript for this study. A.E., B.Z. and C.A.G.S. gave feedback on the written manuscript, helping to analyse and edit the manuscript for proper English language, grammar, punctuation, and spelling, and providing technical improvements in all manuscript sections. All authors have read and agreed to the published version of the manuscript.

Funding

This research received no external funding.

Data Availability Statement

The data that support the findings of this study are available from the corresponding author, [DD], upon reasonable request.

Acknowledgments

The first author greatly acknowledges the Department of Science and Technology, INSPIRE, and the Government of India for their support.

Conflicts of Interest

The authors declare no conflict of interest.

References

  1. Thakur, J.K.; Thakur, R.K.; Ramanathan, A.; Kumar, M.; Singh, S.K. Arsenic Contamination of Groundwater in Nepal—An Overview. Water 2011, 3, 1. [Google Scholar] [CrossRef]
  2. Singh, P.; Thakur, J.K.; Kumar, S.; Singh, U.C. Assessment of land use/land cover using Geospatial Techniques in a semi arid region of Madhya Pradesh, India. In Geospatial Techniques for Managing Environmental Resources; Thakur, J.K., Singh, S.K., Ramanathan, A.L., Prasad, M.B.K., Gossel, W., Eds.; Springer and Capital Publication: Heidelberg, Germany, 2011; pp. 152–163. [Google Scholar]
  3. Diwakar, J.; Thakur, J.K. Environmental system analysis for river pollution control. Water Air Soil Pollut. 2012, 223, 3207–3218. [Google Scholar] [CrossRef]
  4. F.A.O. Trees, Forests and Land Use in Drylands: The First Global Assessment; FAO: Rome, Italy,, 2019. [Google Scholar]
  5. Singh, P.; Thakur, J.K.; Singh, U.C. Morphometric analysis of Morar River Basin, Madhya Pradesh, India, using remote sensing and G.I.S. techniques. Environ. Earth Sci. 2013, 68, 1967–1977. [Google Scholar] [CrossRef]
  6. Tignath, S.; Kapoor, M.; Jha, M.; Sharma, S.K. Morphometric analysis of part of the Hiran River, District Jabalpur, M.P., India using Remote sensing and G.I.S. Int. J. Environ. Sci. 2014, 5, 181–196. [Google Scholar] [CrossRef]
  7. Bhat, S.A.; Romshoo, S.A. Digital elevation model based watershed characteristics of upper watersheds of Jhelum basin. J. Appl. Hydrol. 2009, 21, 23–34. [Google Scholar]
  8. Horton, R.E. Erosion development in stream and their drainage basins. Geol. Soc. Am. Bull. 1945, 56, 275–370. [Google Scholar] [CrossRef] [Green Version]
  9. Smith, K.G. Standards for grading texture of erosional topography. Am. J. Sci. 1950, 248, 655–668. [Google Scholar] [CrossRef]
  10. Strahler, A.N. Mtm quantitative analysis of watershed Geomorphology. Trans. Am. Geophys. Union 1957, 38, 913–920. [Google Scholar] [CrossRef] [Green Version]
  11. Thakkar, A.K.; Dhiman, S.D. Morphometric analysis and prioritisation of miniwatersheds in a Mohr watershed, Gujarat using remote sensing and G.I.S. techniques. J. Indian Soc. Remote Sens. 2007, 35, 313–321. [Google Scholar] [CrossRef]
  12. Hlaing, K.; Haruyama, S.; Maung, A. Using GIS-based distributed soil loss modeling and morphometric analysis to prioritise watershed for soil conservation in Bago river basin of Lower Myanmar. Front. Earth Sci. China 2008, 2, 465–478. [Google Scholar] [CrossRef]
  13. Sreedevi, P.D.; Owais, S.; Khan, H.H.; Ahmed, S. Morphometric analysis of a watershed of south India using SRTM data and G.I.S. J. Geol. Soc. India 2009, 73, 543–552. [Google Scholar] [CrossRef]
  14. Patel, D.P.; Dholakia, M.B. Water harvesting structure positioning by using geo-visualisation concept and prioritisation of mini-watersheds through morphometric analysis in the Lower Tapi Basin. J. Indian Soc. Remote Sens. 2011, 40, 299–312. [Google Scholar] [CrossRef]
  15. Aher, P.D.; Adinarayana, J.; Gorantiwar, S.D. Quantification of morphometric characterisation and prioritisation for management planning in semi-arid tropics of India: A remote sensing and G.I.S. approach. J. Hydrol. 2014, 511, 850–860. [Google Scholar] [CrossRef]
  16. Albaroot, M.; Al-Areeq, N.M.; Aldharab, H.S.; Alshayef, M.; Ghareb, S.A. Quantification of Morphometric Analysis using Remote Sensing and G.I.S. Techniques in the Qa’ Jahran Basin, Thamar Province, Yemen. Int. J. New Technol. Res. 2018, 4, 12–22. [Google Scholar]
  17. Singh, N.; Jha, M.; Tignath, S.; Singh, B.N. Morphometric analysis of a badland affected portion of the Mandakini River sub-watershed, central India. Arab. J. Geosci. 2020, 13, 423. [Google Scholar] [CrossRef]
  18. Shivaswamy, M.; Ravikumar, A.S.; Shivakumar, B.L. Quantitative Morphometric and Hypsometric Analysis Using Remote Sensing and G.I.S. Techniques. Int. J. Adv. Res. Eng. Technol. 2019, 10, 1–14. [Google Scholar] [CrossRef]
  19. Said, S.; Siddique, R.; Shakeel, M. Morphometric analysis and sub-watersheds prioritisation of Nagmati River watershed, Kutch District, Gujarat using G.I.S. based approach. J. Water Land Dev. 2018, 39, 131–139. [Google Scholar] [CrossRef] [Green Version]
  20. Mangan, P.; Haq, M.A.; Baral, P. Morphometric analysis of watershed using remote sensing and G.I.S.—A case study of Nanganji River Basin in Tamil Nadu, India. Arab. J. Geosci. 2019, 12, 202. [Google Scholar] [CrossRef]
  21. Kumari, P.; Kumari, R.; Kumar, D. Geospatial approach to evaluate the morphometry of Sabarmati River Basin, India. Arab. J. Geosci. 2021, 14, 206. [Google Scholar] [CrossRef]
  22. Obeidat, M.; Awawdeh, M.; Al-Hantouli, F. Morphometric analysis and prioritisation of watersheds for flood risk management in Wadi Easal Basin (W.E.B.), Jordan, using geospatial technologies. J. Flood Risk Manag. 2021, 14, e12711. [Google Scholar] [CrossRef]
  23. Arulbalaji, P.; Padmalal, D. Sub-watershed Prioritization Based on Drainage Morphometric Analysis: A Case Study of Cauvery River Basin in South India. J. Geol. Soc. India 2020, 95, 25–35. [Google Scholar] [CrossRef]
  24. Kasi, V.; Pinninti, R.; Landa, S.R.; Rathinasamy, M.; Sangamreddi, C.; Kuppili, R.R.; Radha, P.R.D. Comparison of different digital elevation models for drainage morphometric parameters: A case study from South India. Arab. J. Geosci. 2020, 13, 1050. [Google Scholar] [CrossRef]
  25. Bogale, A. Morphometric analysis of a drainage basin using geographical information system in Gilgel Abay watershed, Lake Tana Basin, upper Blue Nile Basin, Ethiopia. Appl. Water Sci. 2021, 11, 122. [Google Scholar] [CrossRef]
  26. Giri, P.; Diwate, P.; Mawale, Y.K. Chapter 4. Morphometric Analysis of Tapi Drainage Basin Using Remote Sensing and GIS Techniques. Sustain. Dev. Pract. Using Geoinform. 2020, 57–72. [Google Scholar] [CrossRef]
  27. Zerouali, B.; Chettih, M.; Alwetaishi, M.; Abda, Z.; Elbeltagi, A.; Augusto Guimarães Santos, C.; Hussein, E.E. Evaluation of Karst Spring Discharge Response Using Time-Scale-Based Methods for a Mediterranean Basin of Northern Algeria. Water 2021, 13, 2946. [Google Scholar] [CrossRef]
  28. Akanwa, A.O. River Sand Mining and Its Ecological Footprint at Odor River, Nigeria. In Agroecological Footprints Management for Sustainable Food System; Banerjee, A., Meena, R.S., Jhariya, M.K., Yadav, D.K., Eds.; Springer: Singapore, 2021. [Google Scholar]
  29. Ikhsan, J.; Rezanaldy, A.; Rozainy, M.Z.M.R. Analysis of Sand Mining Impacts on Riverbed in the Downstream of the Progo River, Indonesia. In IOP Conference Series: Materials Science and Engineering; IOP Publishing: Bristol, UK; London, UK, 2021; p. 012065. [Google Scholar]
  30. Chandrashekar, H.; Lokesh, K.V.; Sameena, M.; Roopa, J.; Ranganna, G. GIS—Based Morphometric Analysis of Two Reservoir Catchments of Arkavati River, Ramanagaram District, Karnataka. In Proceedings of the International Conference on Water Resources, Coastal and Ocean Engineering (ICWRCOE), Mangalore, India, 12–14 March 2015. [Google Scholar]
  31. Krishnamurthy, J.; Srinivas, G.; Jayaraman, V.; Chandrashekar, M.G. Influence of rock types and structures in the development of drainage networks in typical hard rock terrain. ITC J. 1996, 3–4, 252–259. [Google Scholar]
  32. CGWB Central Ground Water Board. Ground Water Information Rajsamand District Rajasthan; Government of India Ministry of Water Resources: Jaipur, India, 2013.
  33. GWDR Ground Water Department Rajasthan. Hydrogeological Atlas of Rajasthan Rasamand District; Rolta India Limited: Mumbai, India, 2013. [Google Scholar]
  34. Ahmed, S.A.; Chandrashekarappa, K.N.; Raj, S.K.; Nischitha, V.; Kavitha, G. Evaluation of morphometric parameters derived from ASTER and SRTM DEM—A study on Bandihole sub-watershed basin in Karnataka. J. Indian Soc. Remote Sens. 2010, 38, 227–238. [Google Scholar] [CrossRef]
  35. Günal, A.Y.; Güven, A. Determination of Geomorphological Parameters of Damlica Basin Using GIS. In Proceedings of the International Conference on Computational and Experimental Science and Engineering (ICCESEN 2014), Kemer, Turkey, 25–29 October 2014. [Google Scholar] [CrossRef]
  36. Ozulu, İ.M.; Gökgöz, T. Examining the Stream Threshold Approaches Used in Hydrologic Analysis. ISPRS Int. J. Geo-Inf. 2018, 7, 201. [Google Scholar] [CrossRef] [Green Version]
  37. Thomas, J.; Joseph, S.; Thrivikramji, K.P.; Arunkumar, K.S. Sensitivity of digital elevation models: The scenario from two tropical mountain river basins of the Western Ghats, India. Geosci. Front. 2014, 5, 893–909. [Google Scholar] [CrossRef] [Green Version]
  38. Mark, D.M. Relation between field-surveyed channel network and map-based geomorphometric measures, Inez Kentucky. Ann. Assoc. Am. Geogr. 1983, 73, 358–372. [Google Scholar] [CrossRef]
  39. Odiji, C.A.; Aderoju, O.M.; Eta, J.B.; Shehu, I.; Mai-Bukar, A.; Onuoha, H. Morphometric analysis and prioritisation of upper Benue River watershed, Northern Nigeria. Appl. Water Sci. 2021, 11, 41. [Google Scholar] [CrossRef]
  40. Jolly, J.P. A Proposed Method for Accurately Calculating Sediment Yields from Reservoir Deposition Volumes; International Association of Hydrological Sciences: Wallingford, UK, 1982. [Google Scholar]
  41. Ogunkoya, O.O.; Adejuwon, J.O.; Jeje, L.K. Runoff response to basin parameters in southwestern Nigeria. J. Hydrol. 1984, 72, 67–84. [Google Scholar] [CrossRef]
  42. Breinlinger, R.; Dister, H.; Weingartner, R. Methods of Catchment Characterisation by Means of Basin Parameters (Assisted by G.I.S.)—Empirical Report from Switzerland; Report No. 120 Methods of hydrological basin comparison; Institute of Hydrology: Wallingford, UK, 1992; pp. 171–181. [Google Scholar]
  43. Strahler, A.N. Quantitative geomorphology of drainage basins and channel networks. In Handbook of Applied Hydrology; McGraw-Hill: New York, NY, USA, 1964; pp. 4–39. [Google Scholar]
  44. Kar, G.; Kumar, A.; Singh, R. Spatial distribution of soil hydro-physical properties and morphometric analysis of a rainfed watershed as a tool for sustainable land use planning. Agric. Water Manag. 2009, 96, 1449–1459. [Google Scholar] [CrossRef]
  45. Rawat, U.; Awasthi, A.; Gupta, D.S.; Paul, R.S.; Tripathi, S. Morphometric Analysis using Remote Sensing and G.I.S. Techniques in the Bagain River Basin, Bundelkhand Region, India. Indian J. Sci. Technol. 2017, 10. [Google Scholar] [CrossRef]
  46. Pandey, P.K.; Das, S.S. Morphometric analysis of Usri River basin, Chhotanagpur Plateau, India, using remote sensing and GIS. Arab. J. Geosci. 2016, 9, 240. [Google Scholar] [CrossRef]
  47. Schumm, S.A. Evolution of drainage systems and slopes in badlands at Perth Amboy, New Jersey. Geol. Soc. Am. Bull. 1956, 67, 597–646. [Google Scholar] [CrossRef]
  48. Horton, R.E. Drainage-basin characteristics. Trans. Am. Geophys. Union 1932, 13, 350–361. [Google Scholar] [CrossRef]
  49. Veeranna, J.; Gouthami, K.; Yadav, P.B.; Mallikarjuna, V.R. Calculating linear and areal and relief aspect parameters using geospatial techniques (ArcGIS 10. 2 and SWAT model) for for Akkeru River Basin Warangal, Telangana, India. Int. J. Curr. Microbiol. Appl. Sci. 2017, 6, 1803–1809. [Google Scholar] [CrossRef]
  50. Reddy, G.P.O.; Maji, A.K.; Gajbhiye, K.S. Drainage morphometry and its influence on landform characteristics in a basaltic terrain, Central India—A remote sensing and G.I.S. approach. Int. J. Appl. Earth Obs. Geoinf. 2004, 6, 1–16. [Google Scholar] [CrossRef]
  51. Subramanya, K. A Book-Engineering Hydrology, 4th ed.; 8th reprint; McGraw Hill Education: Noida, India, 2015; p. 172. [Google Scholar]
  52. Miller, V.C. Quantitative Geomorphic Study of Drainage Basin Characteristic in the Clinch Mountain Area; Technical Report 3; Department of Geology, Columbia University: New York, NY, USA, 1953. [Google Scholar]
  53. Suresh, R. A Book-Soil and Water Conservation Engineering, 5th ed.; 2nd reprint; Jain, A.K., Ed.; Standard Publisher Distributors: New Delhi, India, 2014; p. 918. [Google Scholar]
  54. Schumm, S.A. Sinuosity of alluvial rivers on the Great Plains. Geol. Soc. Am. Bull. 1963, 74, 93–114. [Google Scholar] [CrossRef]
  55. Melton, M.A. An Analysis of the Relations among Elements of Climate, Surface Properties and Geomorphology; Technical report (United States. Office of Naval Research), no. ONR-11; Columbia University: New York, NY, USA, 1957. [Google Scholar]
  56. Bera, A.; Mukhopadhyay, B.P.; Das, D. Morphometric analysis of Adula River Basin in Maharashtra, India using G.I.S. and remote sensing techniques. Geogr. Nat. Resour. 2018, 13–35. [Google Scholar] [CrossRef]
  57. Langbein, W.B. Topographic characteristics of drainage basins. U.S. Geol. Soc. Water-Supply Pap. 1947, 968, 125–158. [Google Scholar]
  58. Prasannakumar, V.; Vijith, H.; Geetha, N. Terrain evaluation through the assessment of geomorphometric parameters using D.E.M. and G.I.S.: Case study of two major sub-watersheds in Attapady, South India. Arab. J. Geosci. 2013, 6, 1141–1151. [Google Scholar] [CrossRef]
  59. Gajbhiye, S.; Mishra, S.K.; Pandey, A. Hypsometric analysis of Shakkar River catchment through geographical information system. J. Geol. Soc. India 2014, 84, 192–196. [Google Scholar] [CrossRef]
  60. Sharma, S.; Mahajan, A.K. GIS-based sub-watershed prioritisation through morphometric analysis in the outer Himalayan region of India. Appl. Water Sci. 2020, 10, 1–11. [Google Scholar] [CrossRef]
  61. Pike, R.J.; Wilson, S.E. Elevation-relief ratio, hypsometric integral, and geomorphic area-altitude analysis. Geol. Soc. Am. Bull. 1971, 82, 1079–1084. [Google Scholar] [CrossRef]
  62. Hadley, R.F.; Schumm, S.A. Sediment sources and drainage basin characteristics in upper Cheyenne River basin. U.S. Geol. Surv. Water-Supply Pap. 1961, 1531, 198. [Google Scholar] [CrossRef]
  63. Mesa, L.M. Morphometric analysis of a subtropical Andean basin (Tucumán, Argentina). Environ. Geol. 2006, 50, 1235–1242. [Google Scholar] [CrossRef]
  64. Rai, P.K.; Narayan, V.; Mohan, K. Remote sensing applications: Society and environment. A study of morphometric evaluation of the Son basin, India using geospatial approach. Remote Sens. Appl. Soc. Environ. 2017, 7, 9–20. [Google Scholar] [CrossRef]
  65. Mahala, A. The significance of morphometric analysis to understand the hydrological and morphological characteristics in two different morpho-climatic settings. Appl. Water Sci. 2019, 10, 1–16. [Google Scholar] [CrossRef] [Green Version]
  66. Chandrasekar, N.; Magesh, N.S. Morphometric analysis of the River Thamirabarani sub-basin in Kanyakumari District, South west coast of Tamil Nadu, India, using remote sensing and G.I.S. Environ. Earth Sci. 2014, 73, 7375–7401. [Google Scholar] [CrossRef]
  67. Dubey, S.K.; Sharma, D.; Mundetia, N. Morphometric Analysis of the Banas River Basin Using the Geographical Information System, Rajasthan, India. Hydrology 2015, 3, 47–54. [Google Scholar] [CrossRef] [Green Version]
  68. Sreedevi, P.D.; Subrahmanyam, K.; Ahmed, S. The significance of morphometric analysis for obtaining groundwater potential zones in a structurally controlled terrain. Environ. Geol. 2005, 47, 412–420. [Google Scholar] [CrossRef]
  69. Kanhaiya, S.; Singh, S.; Singh, C.K.; Srivastava, V.K.; Patra, A. Geomorphic evolution of the Dongar River Basin, Son Valley, Central India. Geol. Ecol. Landsc. 2019, 3, 269–281. [Google Scholar] [CrossRef] [Green Version]
  70. Pareta, K.; Pareta, U. Quantitative Morphometric Analysis of a Watershed of Yamuna Basin, India using ASTER (D.E.M.) Data and G.I.S. Int. J. Geomat. Geosci. 2011, 2, 248–269. [Google Scholar]
  71. Ali, S.A.; Alhamed, M.; Ali, U. Morphometric analysis of Abdan Basin, Almahfid basement rock, Yemen: Using remote sensing and GIS. Int. J. Adv. Remote Sens. GIS 2016, 5, 1605–1617. [Google Scholar] [CrossRef] [Green Version]
  72. Anderson, M.G.; Burt, T.P. The role of topography in controlling throughflow generation. Earth Surf. Process. 1978, 3, 331–344. [Google Scholar] [CrossRef]
  73. Taha, M.M.N.; Elbarbary, S.M.; Naguib, D.M.; El-Shamy, I.Z. Flash flood hazard zonation based on basin morphometry using remote sensing and G.I.S. techniques: A case study of Wadi Qena basin, Eastern Desert, Egypt. Remote Sens. Appl. Soc. Environ. 2017, 8, 157–167. [Google Scholar] [CrossRef]
  74. Pande, C.B.; Moharir, K. G.I.S. based quantitative morphometric analysis and its consequences: A case study from Shanur River Basin, Maharashtra India. Appl. Water Sci. 2017, 7, 861–871. [Google Scholar] [CrossRef] [Green Version]
  75. Prakash, K.; Rawat, D.; Singh, S.; Chaubey, K.; Kanhaiya, S.; Mohanty, T. Morphometric analysis using SRTM and G.I.S. in synergy with depiction: A case study of the Karmanasa River basin, North central India. Appl. Water Sci. 2019, 9, 13. [Google Scholar] [CrossRef] [Green Version]
  76. Dahiphale, P.; Singh, P.K.; Yadav, K.K. Morphometric Analysis of Sub-Basins in Jaisamand Catchment Using Geographical Information System. Int. J. Eng. Res. Technol. 2014, 2, 189–202. [Google Scholar]
  77. Sarma, J.N.; Shukla, A.; Murgante, B. Morphotectonic study of the Brahmaputra basin using geoinformatics. J. Geol. Soc. India 2015, 86, 324–330. [Google Scholar] [CrossRef]
  78. Soni, S. Assessment of morphometric characteristics of Chakrar watershed in Madhya Pradesh India using geospatial technique. Appl. Water Sci. 2016, 7, 2089–2102. [Google Scholar] [CrossRef] [Green Version]
  79. Samal, D.R.; Gedam, S.S.; Nagarajan, R. G.I.S. based drainage morphometry and its influence on hydrology in parts of Western Ghats region. Geocarto Int. 2015, 30, 755–778. [Google Scholar] [CrossRef]
  80. Bisht, S.; Chaudhry, S.; Sharma, S.; Soni, S. Assessment of flash flood vulnerability zonation through geospatial technique in high altitude Himalayan watershed, Himachal Pradesh India. Remote Sens. Appl. Soc. Environ. 2018, 12, 35–47. [Google Scholar] [CrossRef]
  81. Farhan, Y.; Anbar, A.; Enaba, O.; Al-Shaikh, N. Quantitative Analysis of Geomorphometric Parameters of Wadi Kerak, Jordan, Using Remote Sensing and GIS. J. Water Resour. Prot. 2015, 7, 456–475. [Google Scholar] [CrossRef] [Green Version]
  82. Chottopadhyay, N.; Hasmi, S. The Sung Valley Alkaline Ultramafic Carbonalite Complex, East Khasi Hills and Jaintia Hills district, Meghalaya. GSI Rec. 1984, 113, 24–33. [Google Scholar]
  83. Ritter, J.; Berenguer, M.; Corral, C.; Park, S.; Sempere-Torres, D. ReAFFIRM: Real-time assessment of flash flood impacts–a regional high-resolution method. Environ. Int. 2020, 136, 105375. [Google Scholar] [CrossRef]
  84. John Wilson, J.S.; Chandrasekar, N.; Magesh, N.S. Morphometric analysis of major sub-watersheds in Aiyar and Karai Pottanar Basin, central Tamil Nadu, India usingremote sensing and GIS techniques. Bonfring Int. J. Ind. Eng. Manag. Sci. 2012, 2, 8–15. [Google Scholar]
  85. Awasthi, K.D.; Situla, B.K.; Singh, B.R.; Bajacharaya, R.M. Land-use changes in two Nepalese watersheds: GIS and geomorphometric analysis. Land Degrad. Dev. 2002, 13, 495–513. [Google Scholar] [CrossRef]
  86. Bishop, M.P.; Shroder, J.F.; Bonk, R.; Olsenholler, J. Geomorphic change in high mountains: A western Himalayan perspective. Glob. Planet. Change 2002, 32, 311–329. [Google Scholar]
  87. Agarwal, C.S. Study of drainage pattern through aerial data in Naugarh area of Varanasi district, U.P. J. Indian Soc. Remote Sens. 1998, 26, 169–175. [Google Scholar] [CrossRef]
  88. Rudraiah, M.; Govindaiah, S.; Srinivas Vittala, S. Morphometry using Remote Sensing and GIS Techniques in the Sub-Basins of Kagna River Basin, Gulburga District, Karnataka, India. J. Indian Soc. Remote Sens. 2008, 36, 351–360. [Google Scholar] [CrossRef]
  89. Mayilvaganan, M.K.; Mohana, P.; Naidu, K.B. Delineating groundwater potential zones in Thurinjapuram watershed using geospatial techniques. Indian J. Sci. Technol. 2011, 4, 1470–1476. [Google Scholar] [CrossRef]
  90. Sen Gupta, D.; Dwivedi, L.; Tripathi, S.K.; Ghosh, P.; Awasthi, A. Groundwater potential mapping of Sihu river watershed area of Mahoba district, U.P. using remote sensing and GIS. Int. J. Appl. Res. 2015, 1, 241–248. [Google Scholar]
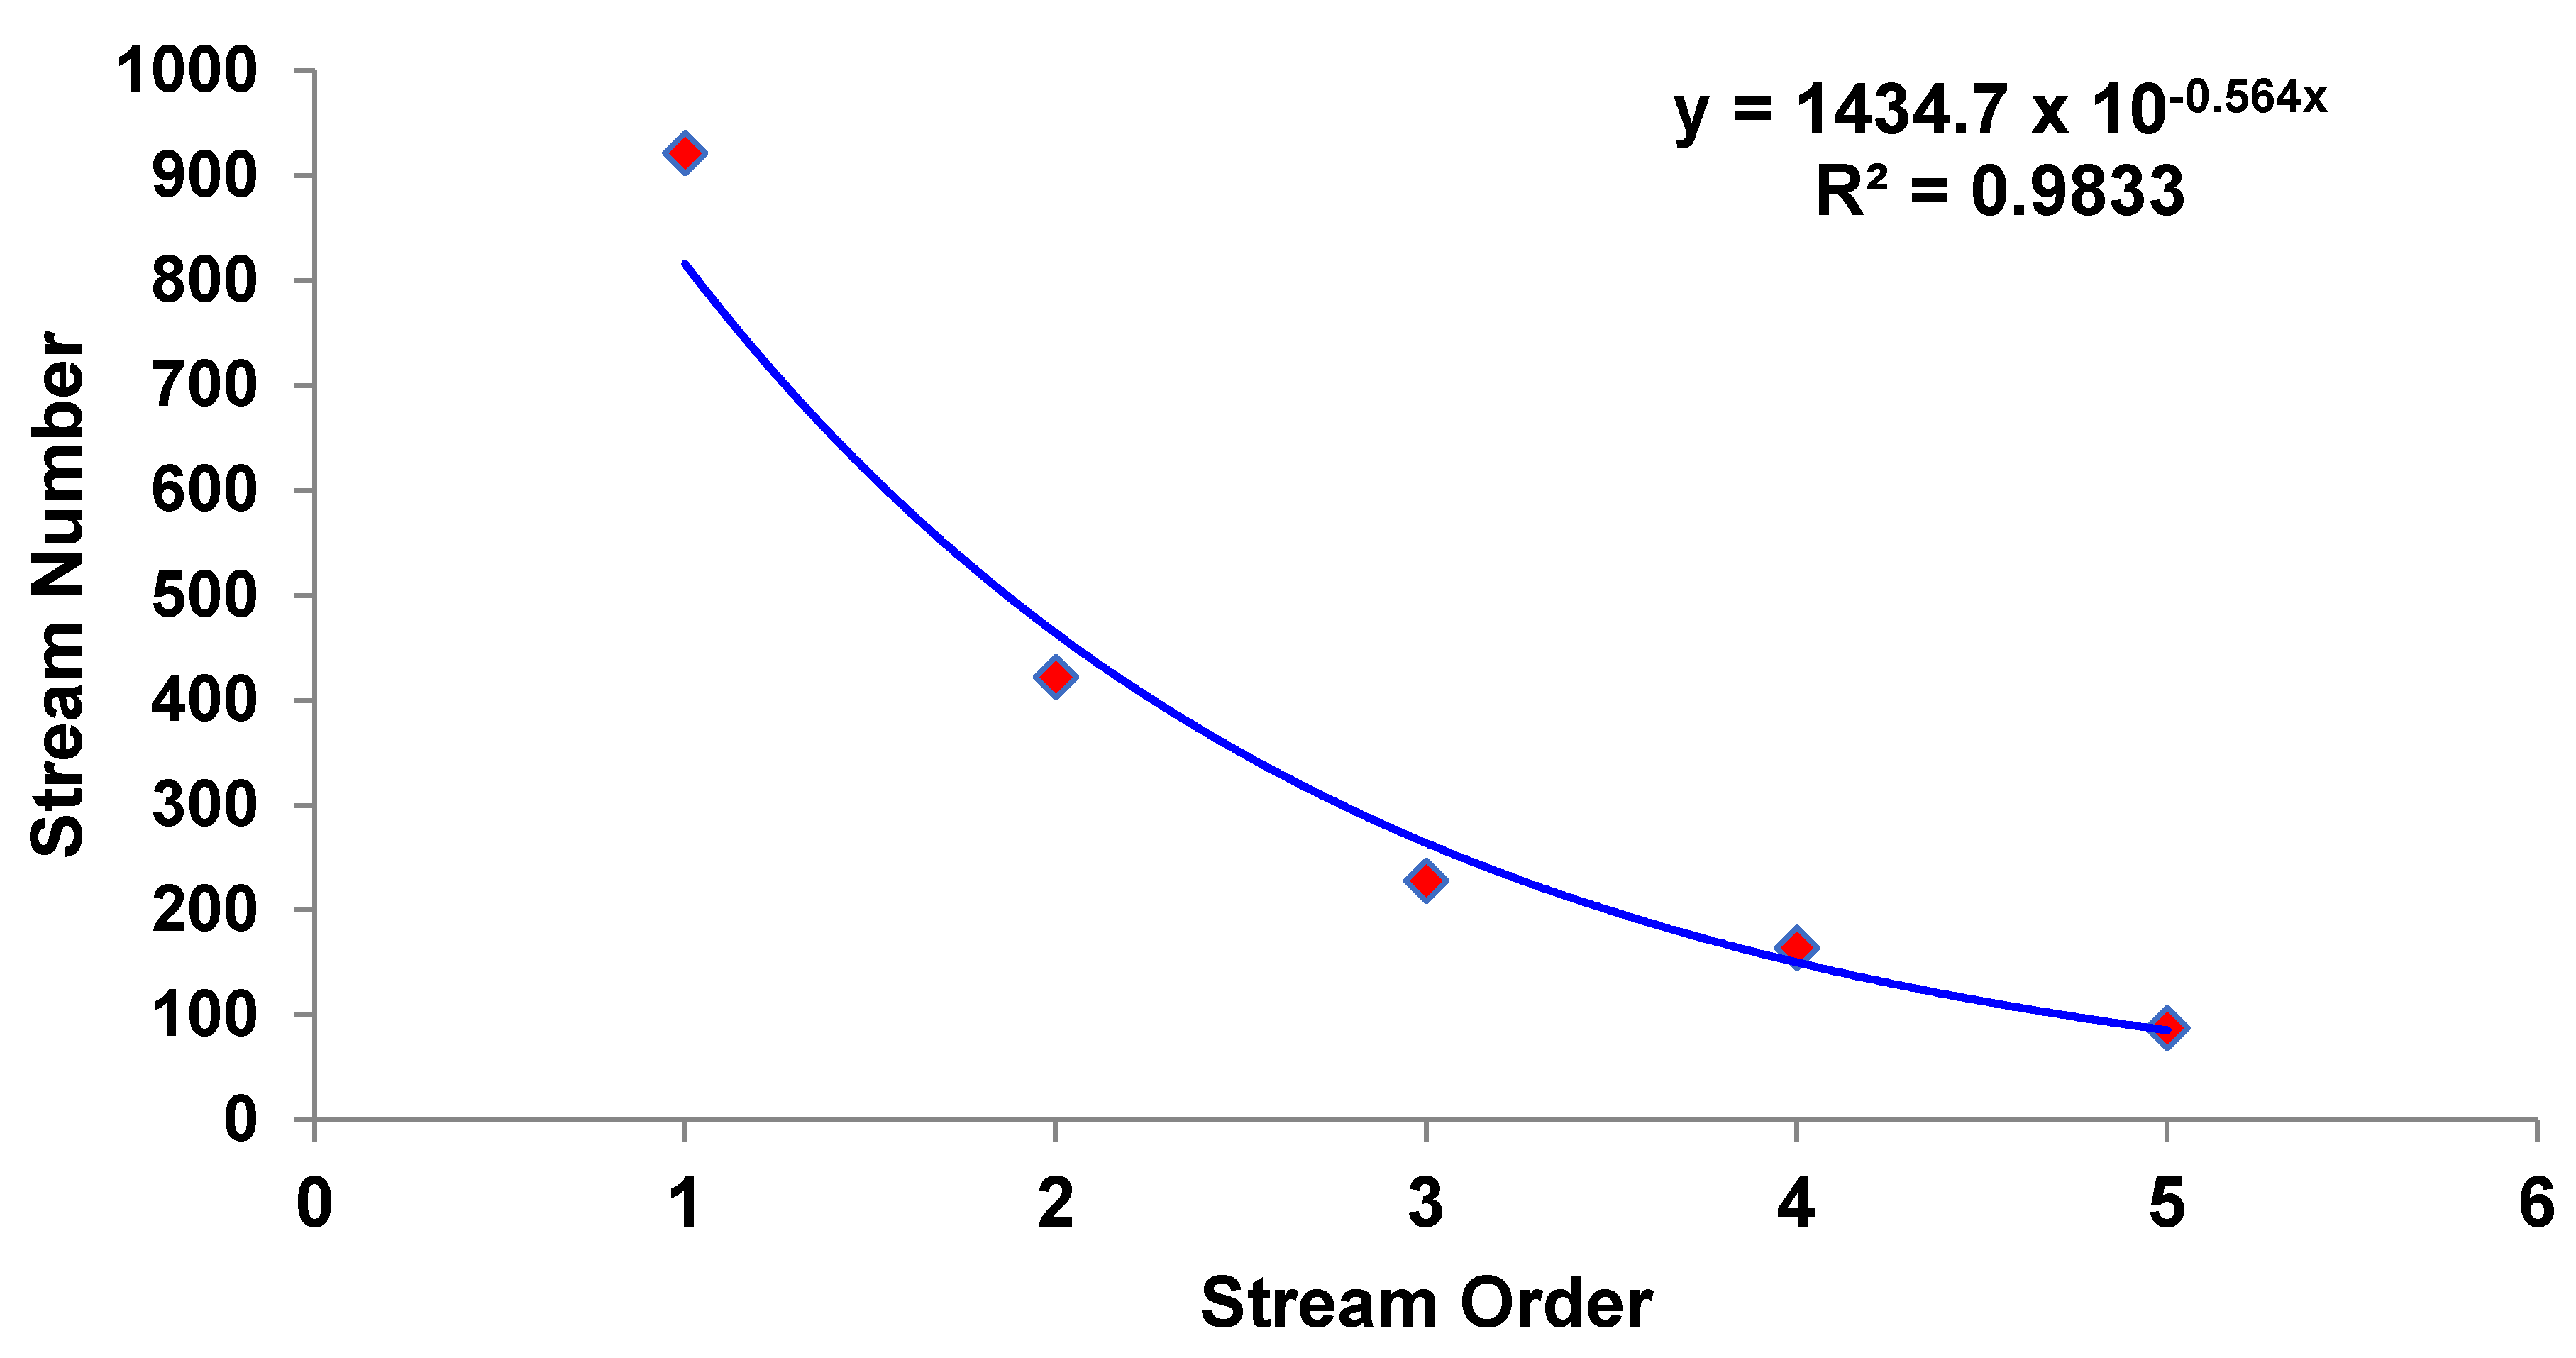
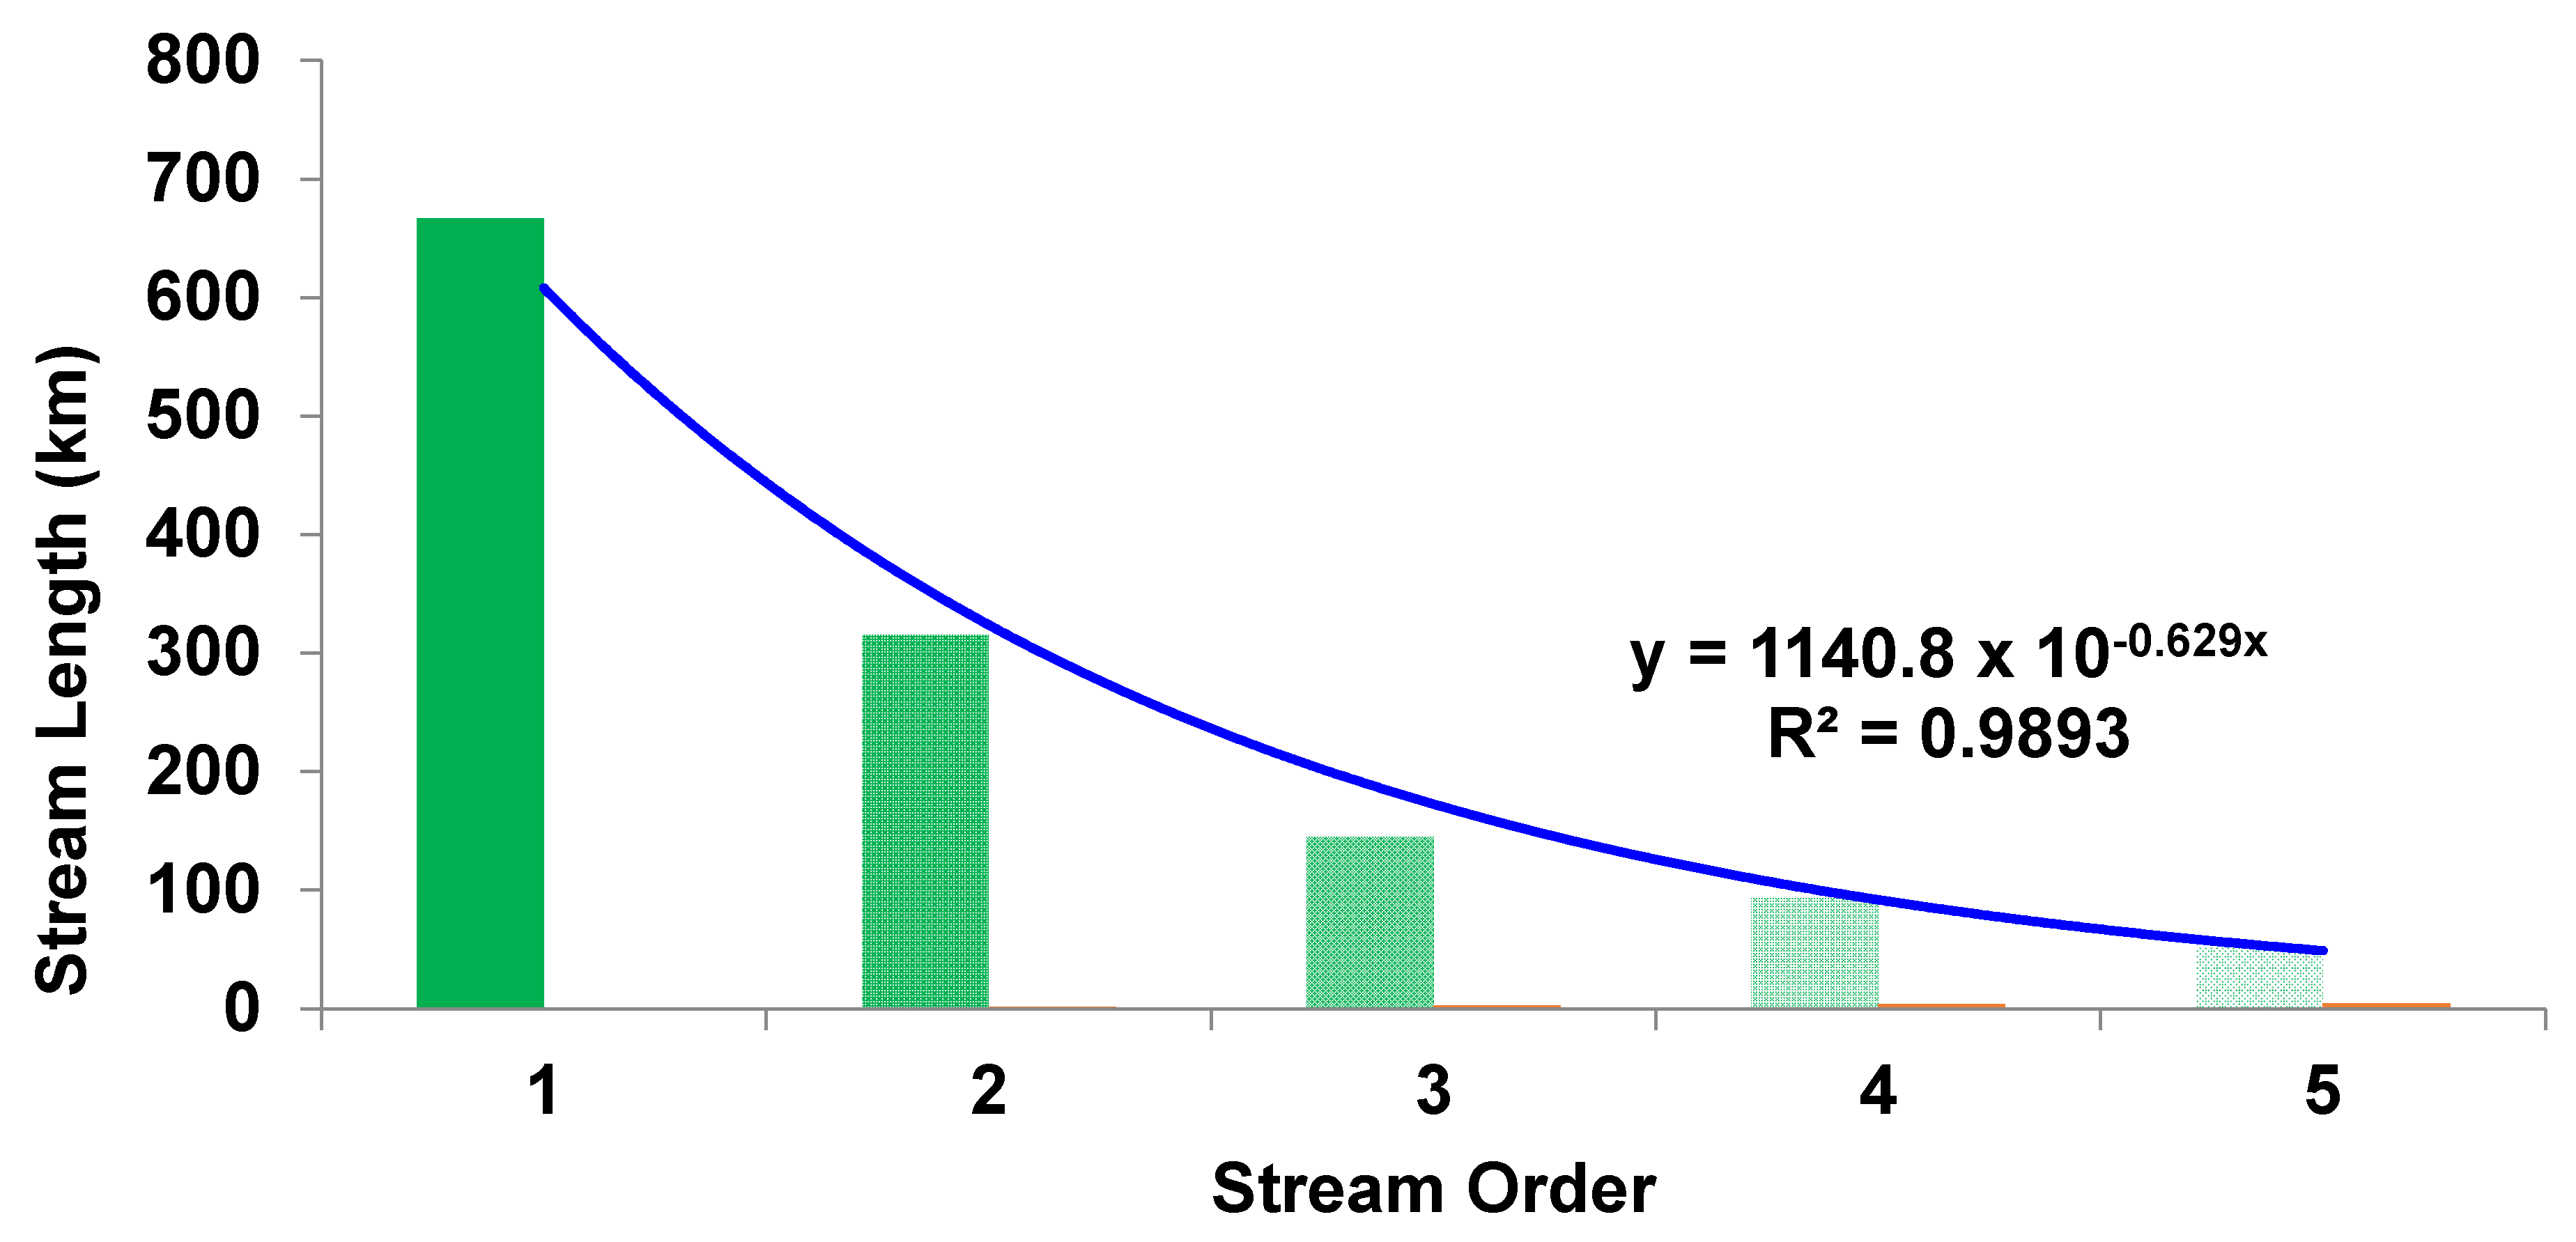
Figure 1. Location map of the study area.
Hydrology 09 00031 g001
Figure 2. Methodology flow diagram for morphological evaluation of Nand Samand Catchment.
Hydrology 09 00031 g002
Figure 3. Stream order map.
Hydrology 09 00031 g003
Figure 4. Drainage density map of the study area.
Hydrology 09 00031 g004
Figure 5. Slope map of the study area.
Hydrology 09 00031 g005
Figure 6. Aspect map of the study area.
Hydrology 09 00031 g006
Figure 7. A correlation plot between stream order and stream number.
Hydrology 09 00031 g007
Figure 8. A graphical representation between stream order and stream length.
Hydrology 09 00031 g008
Figure 9. Dissection map of the Nand Samand catchment.
Hydrology 09 00031 g009
Figure 10. The hypsometric curve of the study area.
Hydrology 09 00031 g010
Figure 11. The study area map created in Google Earth presenting all stream order with junction points.
Hydrology 09 00031 g011
Table 1. Calculated values concerning linear aspects for the Nand Samand catchment.
( u ) ( N u ) ( L u ) ( R L r ) ( L s m ) ( R b ) ( R b s m )
1922666.890.460.722.180
2422316.560.540.751.850
3228145.910.720.641.390
416495.420.540.581.860
58852.21-0.59-0
Total18241276.99 7.291.82
Table 2. Calculated values concerning areal aspects for the Nand Samand catchment.
(A) ( k m 2 ) ( P )
( k m )
( D d )   ( k m k m 2 ) ( F s )   ( 1 k m 2 ) ( T )   ( 1 k m ) ( I f ) ( k m ) (C) ( k m ) ( L g ) ( k m ) (L) (km) ( R f ) ( R c ) ( R l )
865.18197.381.482.116.473.110.680.3482.660.130.280.40
Table 3. Calculated values concerning relief aspects for the Nand Samand catchment.
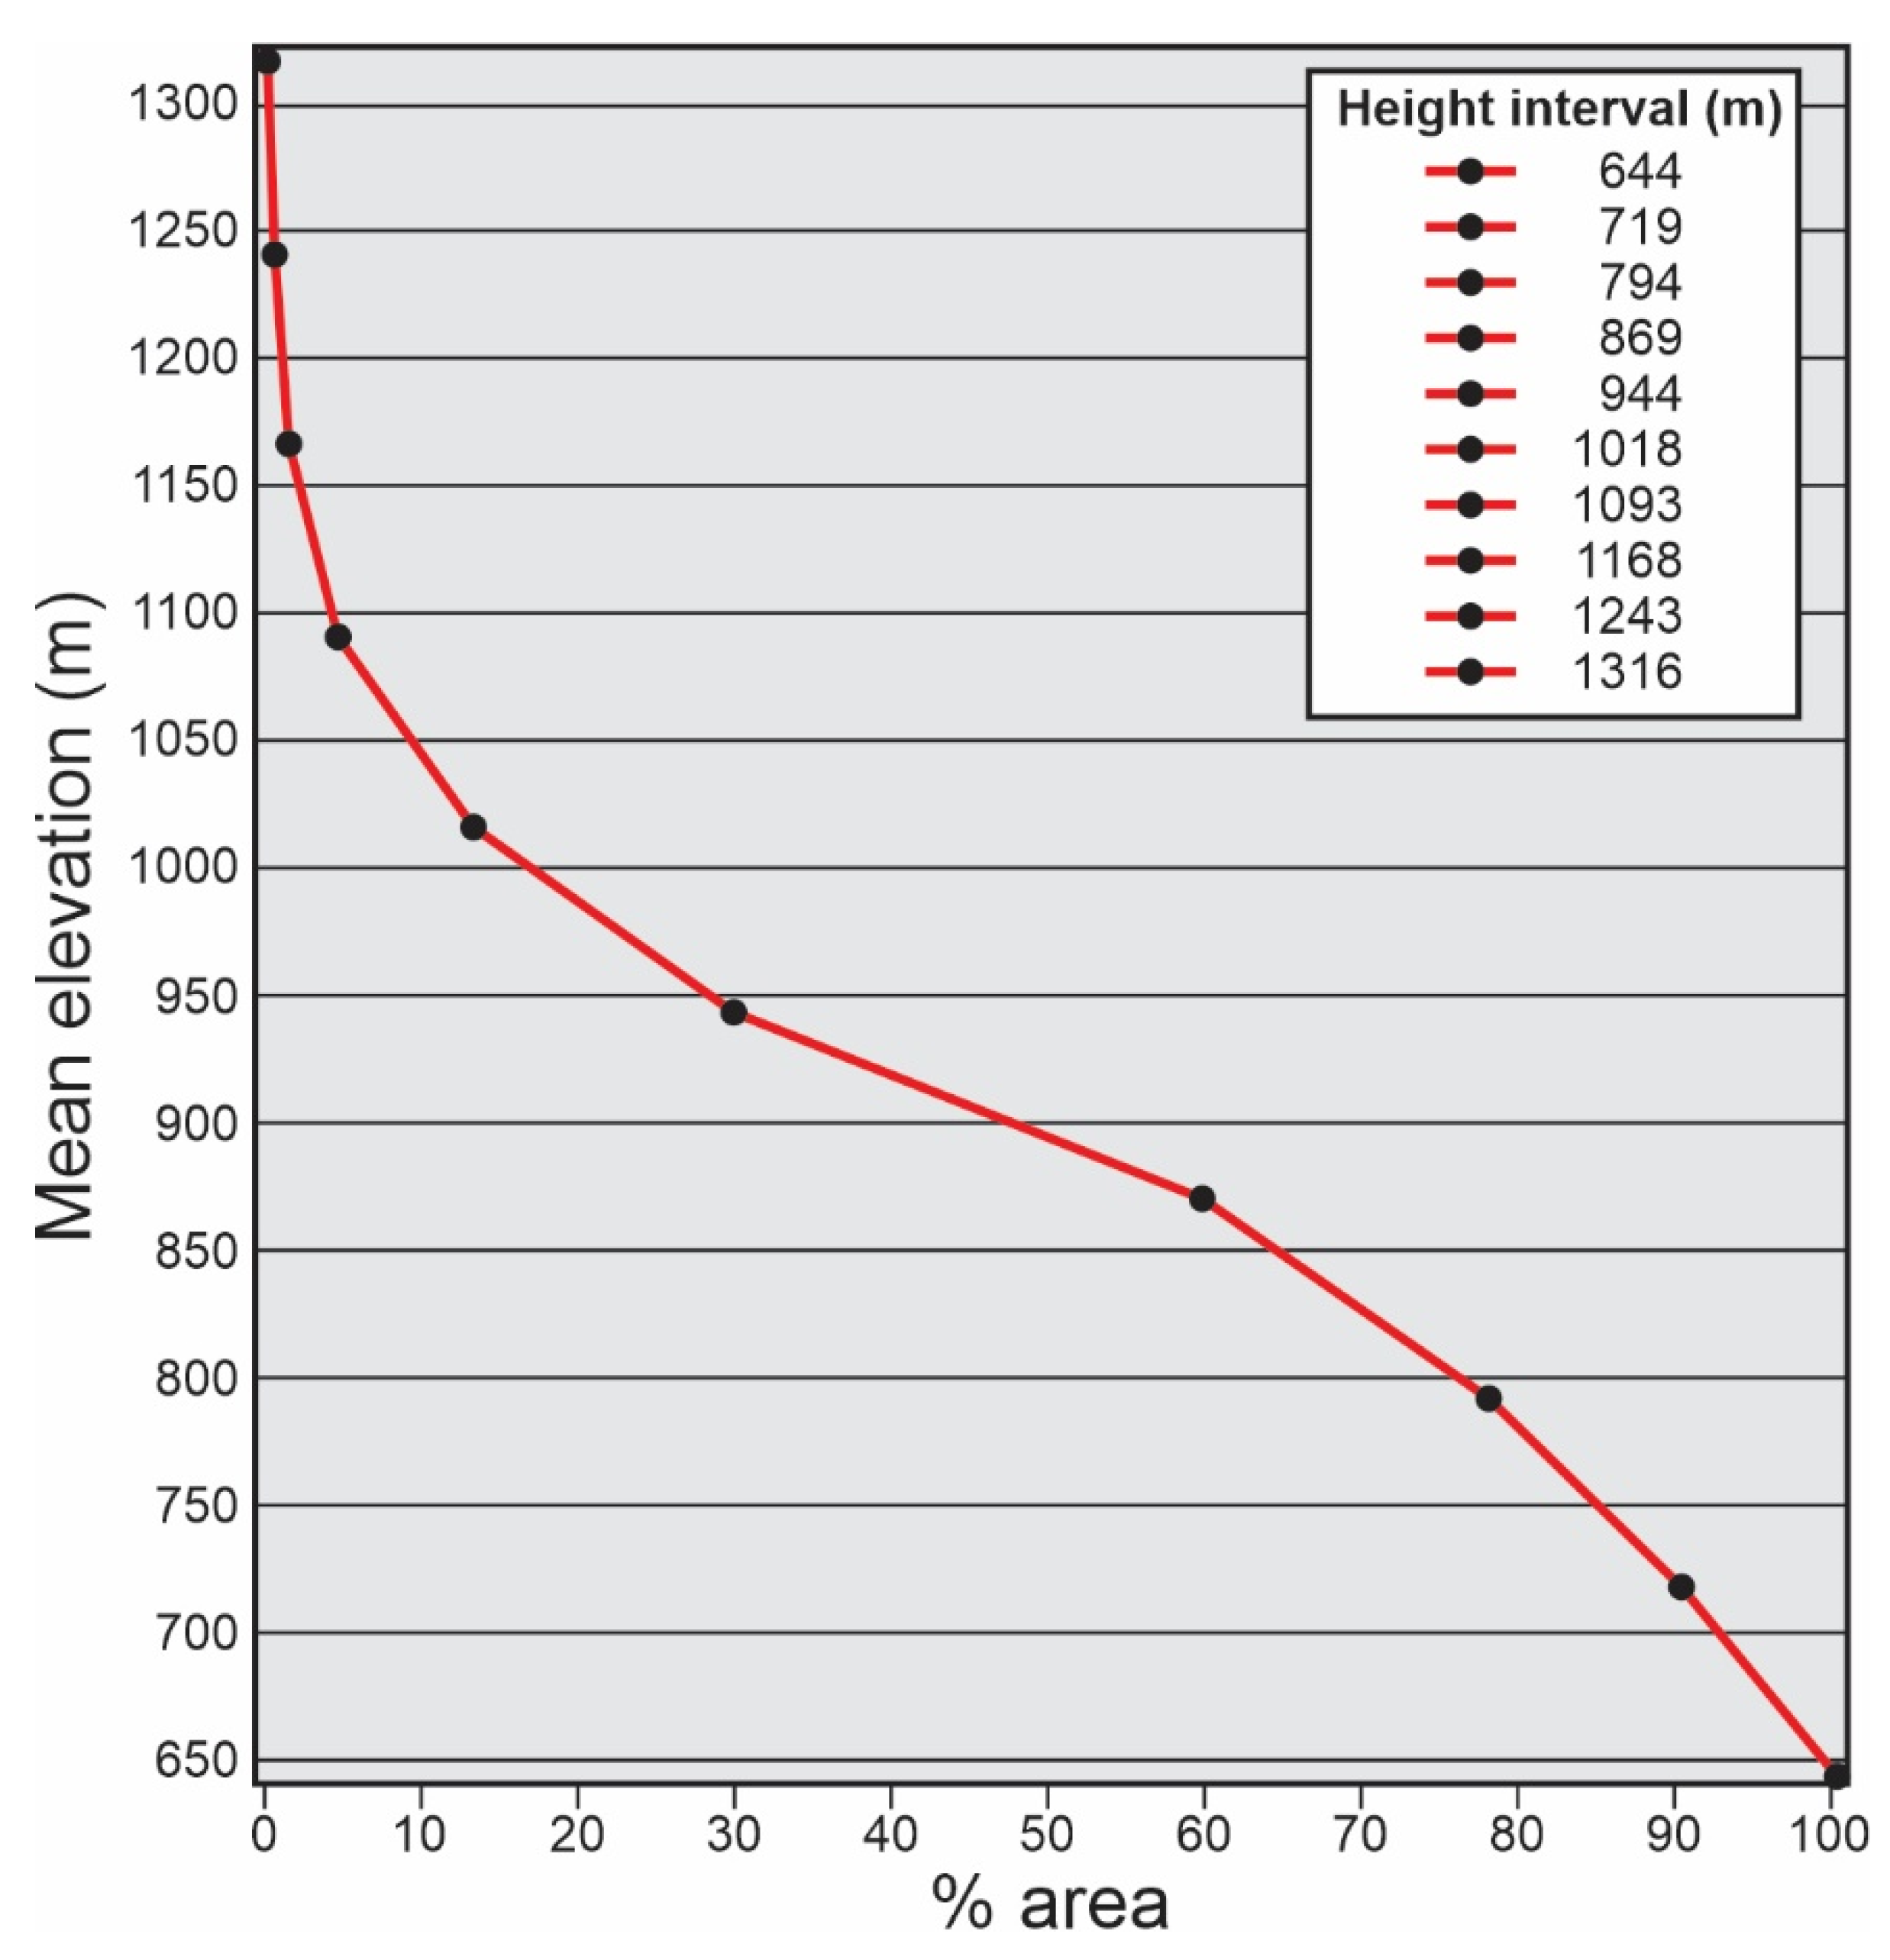
Maximum
Height of
the Catchment (Z) (m)
Minimum Height of the Catchment (z) (m)Catchment Relief (H) (m)Relief
Ratio ( R h )
Relative Relief ( R h p ) Ruggedness
Number ( R n )
13185707480.010.381.10
Publisher’s Note: MDPI stays neutral with regard to jurisdictional claims in published maps and institutional affiliations.

