Technical Note

Characterizing Hydrological Functioning of Three Large Karst Springs in the Salem Plateau, Missouri, USA

Department of Earth & Environmental Sciences, University of Kentucky, Lexington, KY 40506, USA
*
Author to whom correspondence should be addressed.
Hydrology 2022, 9(6), 96; https://doi.org/10.3390/hydrology9060096
Submission received: 1 April 2022 / Revised: 12 May 2022 / Accepted: 20 May 2022 / Published: 27 May 2022
(This article belongs to the Special Issue Hydro-Geology of Karst Areas)

Abstract

:
Spring discharge hydrographs can provide information on karst aquifer connectivity and responses to precipitation. However, few studies have conducted time-series analyses of spring hydrographs over multi-decadal time scales. We examine daily discharge for three large karst springs and daily precipitation for adjoining weather stations during 1928–2019 in the Salem Plateau of southern Missouri, one of the major karst regions in the USA. For different time periods, we conducted baseflow index calculations and time-series (autocorrelation, spectral density, and cross-correlation with precipitation) analyses for discharge data, and Mann–Kendall (MK) trend analyses for discharge and precipitation data. Hydrograph separation indicates discharge is baseflow-dominated (86–94%) at all three springs. The memory effect is lower for Bennett Spring (with an auto-correlation lag time 29–41 days) than for Big Spring (60–92 days) and Greer Spring (77–112 days). Spectral density analysis indicates that annual signals dominate all three springs. Cross-correlation analysis shows a quicker response to precipitation at Bennett Spring (0–1 days) than at Big and Greer springs (1–2 days). MK trend analysis shows significant increases in discharge for all three springs over multiple decades, but not for the period 2007–2019. Increased discharge accompanies regional increases in precipitation, but may also reflect increased recharge associated with reversion of farmland to forest.

Graphical Abstract

1. Introduction

Surface and subsurface drainage networks in karst terrains often develop a single, dynamic flow system [1] that integrates sinkholes (dolines), sinking streams (swallets or ponors), conduits or caves, and springs. Groundwater flow in karst aquifers is characterized by a complex interplay of fast-flowing conduit and slow-flowing matrix systems [2,3]. Solutional widening of the fractures promotes the development of conduits and caves, which can short-circuit surface drainage pathways [4] and converge to a master conduit drained by one large spring [5,6]. The discharge of karst springs can vary significantly [7] as a result of seasonal variability in rainfall and long-term climate [8,9,10]. Consequently, karst aquifers can be highly susceptible to anthropogenic stresses, such as land-use/land-cover (LU/LC) or climate change [11].
Numerous researchers worldwide have studied karst spring responses to precipitation using various approaches (e.g., water tracing, aquifer modeling, and spring hydrograph analyses) [12]. Among those methods, hydrograph separation analysis can provide information on the behavior of the karst aquifer by delineating its flow components [13]. The response of a karst spring to precipitation is mainly controlled by the connectivity between the land surface and the rock mass drained by the spring. A well-developed conduit network allows the quick-flow (storm) response to be separated from baseflow (diffuse flow). Approaches to hydrograph separation in karst include recession curve analysis [14,15], and less commonly, the calculation of the baseflow index (BFI), which describes the proportion of baseflow to total discharge [16]. Time-series analyses (e.g., autocorrelation, cross-correlation, spectral analysis, wavelet transforms, and detrended fluctuation analysis) of hydrographs provide information on system memory and characterize the relationship between input (precipitation) and output (discharge) signals [17,18,19,20].
Few studies have conducted quantitative hydrograph analyses to examine changes in spring discharge at multi-decadal time scales [9,20,21,22,23,24,25,26,27]. Such analyses, in conjunction with analyses of precipitation time series, can provide insights into the potential effects of environmental changes on discharge. Of 419 datasets in the World Karst Spring hydrograph (WoKaS) database [28], 103 (24.5%) have durations ≥ 30 yr and 30 (7.2%) have durations ≥ 60 yr. In this study, we examine the multi-decadal time series in the WoKaS database for three large springs in the Salem Plateau of Missouri, which comprises the largest part of the Ozark Plateaus region, one of the major karst landscapes in the USA [29]. In contrast to springs with long-duration time series in other major karst regions of the USA [22,24,26], the discharge of springs in the Salem Plateau has not been significantly affected by the pumpage of the regional aquifer. Although there have been multiple studies of the spring discharge in the Salem Plateau [30,31,32,33,34,35,36], there is a dearth of studies using statistical time-series analyses. The purpose of this study is to use BFI calculations and time-series analyses to assess diffuse- and quick-flow contributions to spring discharge, characterize the range of spring responses to precipitation over various time scales, and investigate underlying trends in rainfall and discharge that could be attributable to climate and/or LU/LC change.

2. Materials and Methods
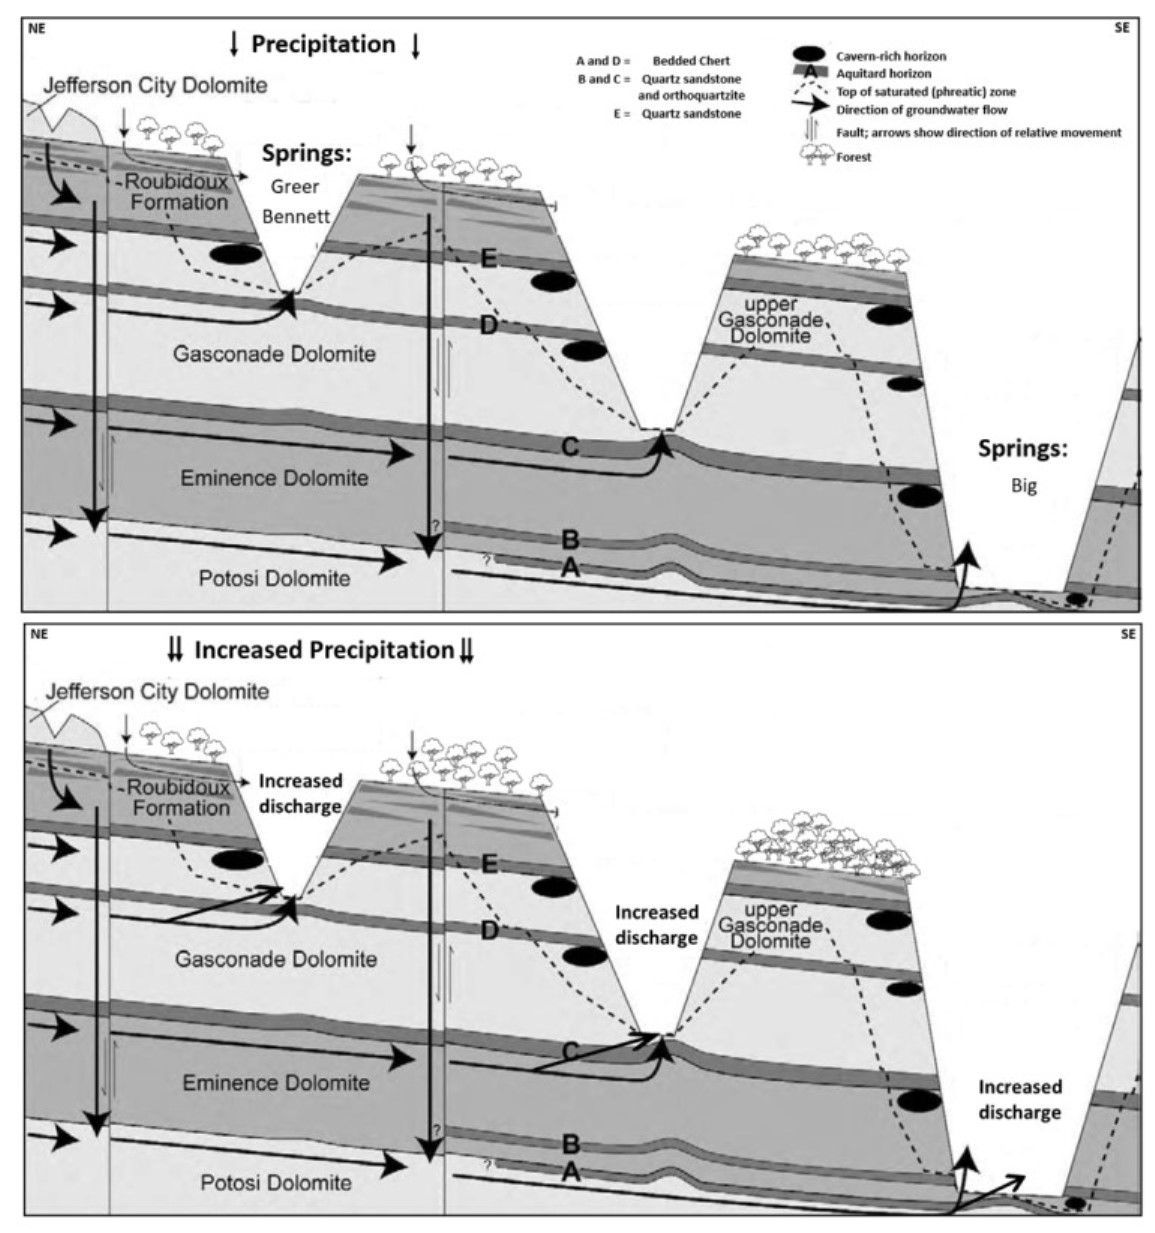
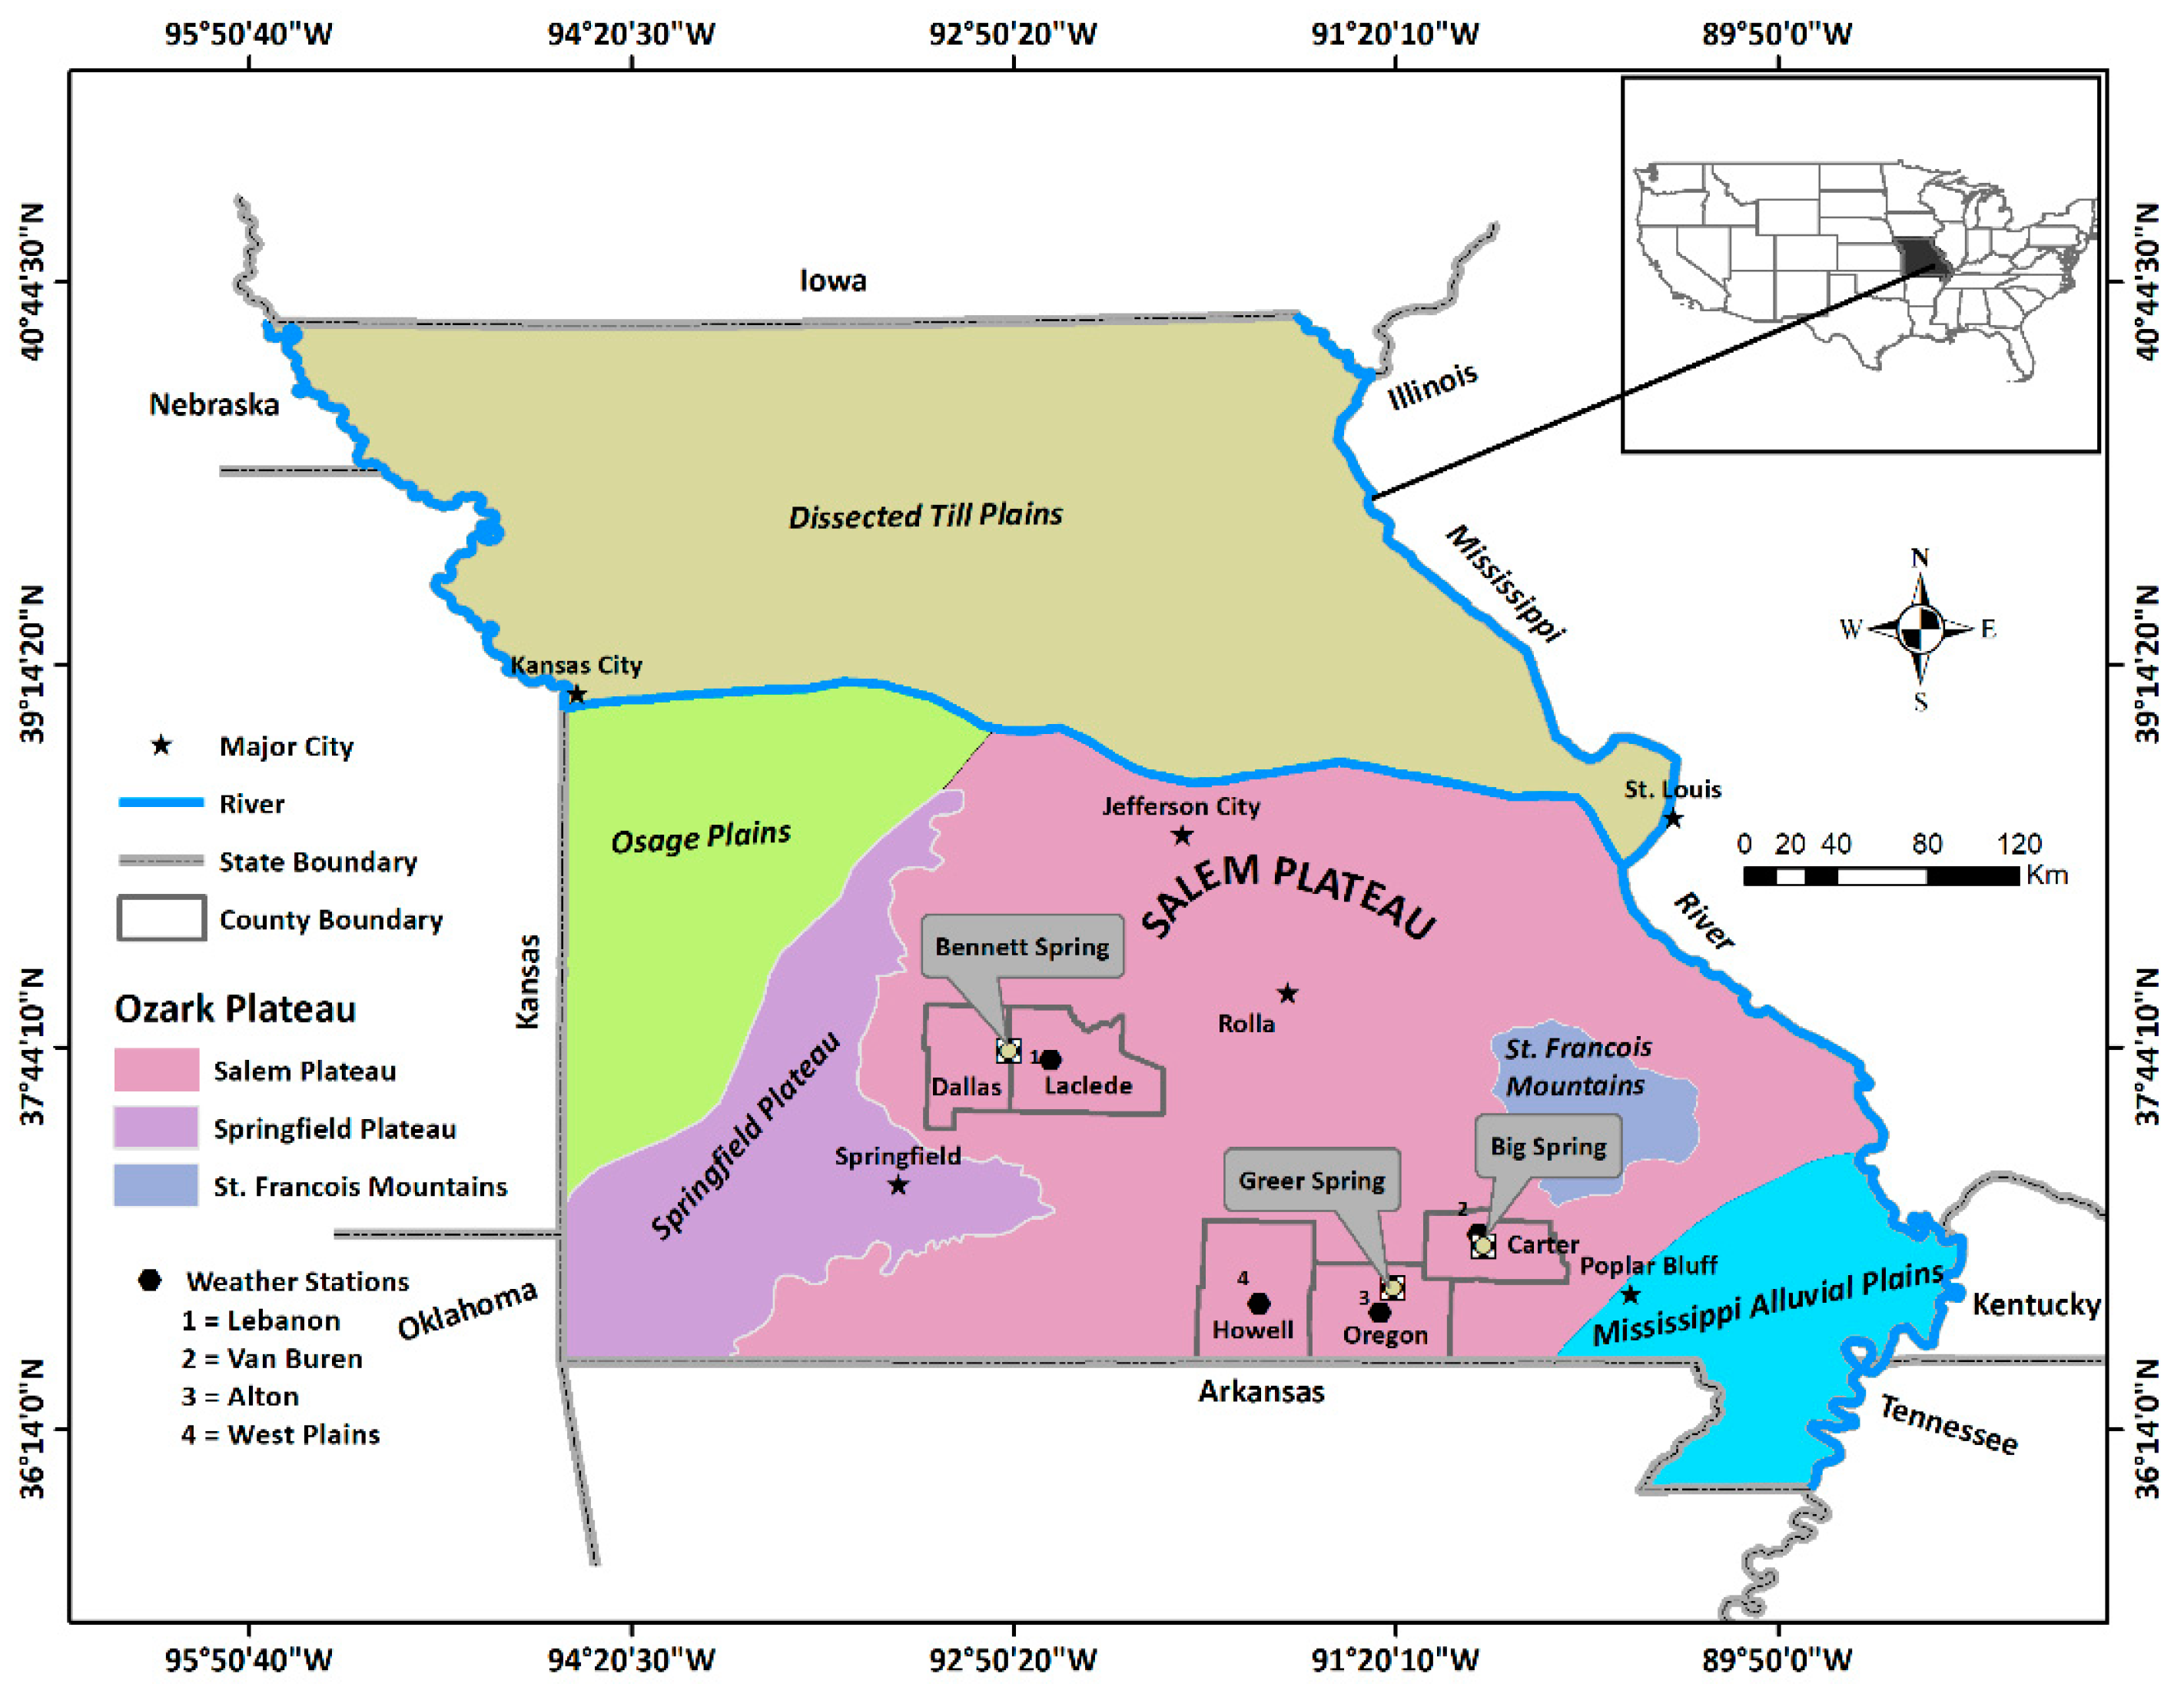
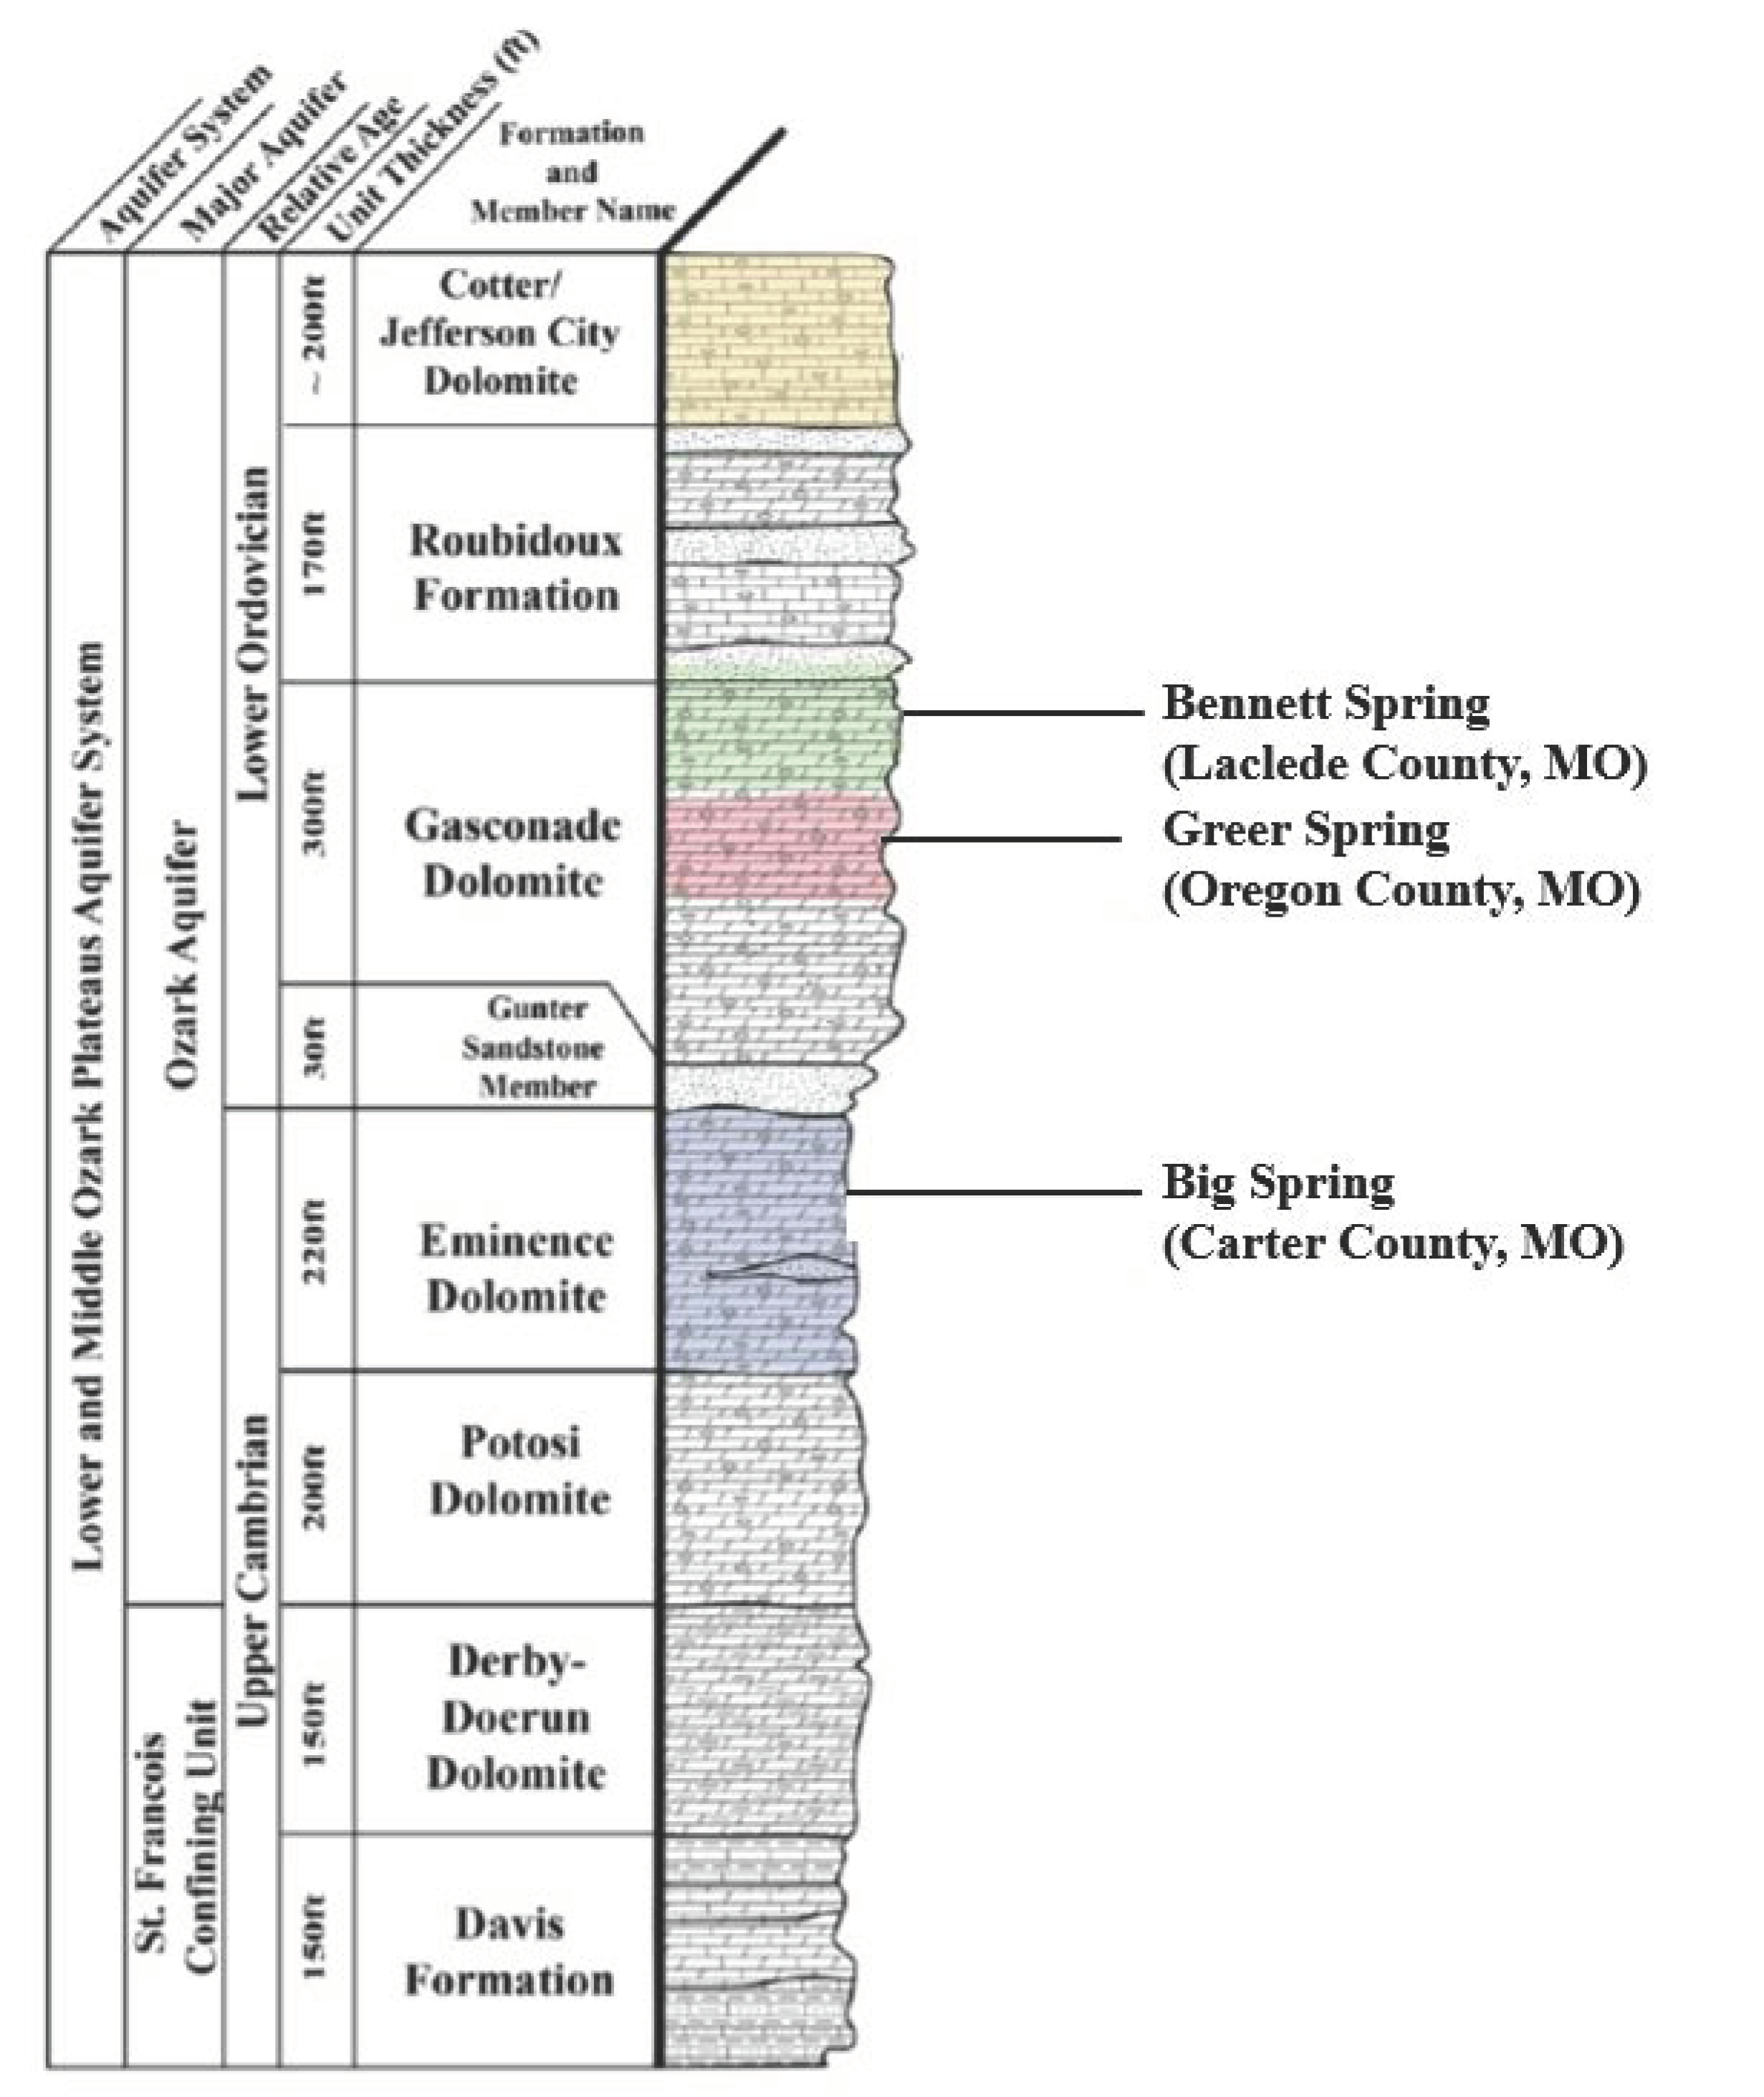
2.1. Study Area

Bennett, Big, and Greer springs (Figure 1) are among 75 first-magnitude springs in the USA [37], defined as having an average discharge of ≥2.83 m3/s [7]. Of 21 first-magnitude karst springs in the USA for which durations of discharge records were listed [38], the durations of Greer, Big, and Bennett springs ranked first, second, and sixth, respectively. Estimates of the drainage-basin areas for these springs have been constrained by extensive dye tracing [32,35,39]. Bennett Spring, Missouri’s third-largest single-orifice spring, is recharged primarily by runoff into sinkholes and losing streams [32]. Its recharge area covers ~687 km2 in Dallas and Laclede counties [40]. Big Spring is the largest spring in the Ozark Plateaus region and the largest single-orifice spring in the USA [41]. Its estimated recharge area occupies 1096–1280 km2 in Shannon, Carter, and Oregon counties [35,36,39]. Greer Spring is the second-largest spring in Missouri, with an estimated recharge area of 891–911 km2, primarily in Howell and Oregon counties [35,39].
The elevation of the Salem Plateau ranges from ~100 to 500 m above sea level [36]. Groundwater flow within the surficial Ozark aquifer occurs within relatively flat-lying, laterally extensive lower Paleozoic carbonates, which are interstratified with siliciclastic units that act as aquitards [42]. Springs occur where downcut river valleys intersect bedrock structural highs and spring basin boundaries may interfinger [42]. The dominant stratigraphic units in the middle and lower Ozark aquifer, from top to bottom, include the Cotter/Jefferson City Dolomite, Roubidoux Formation, Gasconade Dolomite, Eminence Dolomite, and Potosi Dolomite [39] (Figure 2). The Roubidoux Formation is ~76 m thick and consists of poorly sorted sandstone, sandy dolomite, and chert. The Gasconade Dolomite, which is ~46 to 92 m thick, hosts Bennett and Greer springs. Big Spring emerges from the Eminence Dolomite but also derives flow from the Potosi Dolomite [42]; the combined thickness of the two units is ~120 m [39].
Recharge occurs both by diffuse infiltration through regolith that mantles bedrock and by focused infiltration through exposed karst features (e.g., sinkholes and losing stream reaches) [29]. A soil–water balance model for the period from 2005–2014 indicated that recharge rates for the Ozark Plateaus aquifer system were spatially variable, ranging from 0 to 810 mm/yr, with a mean of 340 mm/yr [29]. For the period from 1900–2014 on the Salem Plateau, mean annual precipitation was 1100 mm and ranged from 650 to 1600 mm, while mean annual temperature was 13.5 °C and ranged from an average of −1.4 °C in winter (January–March) to an average of 27.1 °C in summer (July–September). Distribution of precipitation is bimodal, with the greatest amounts in spring (April–June, average 360 mm) and secondary peaks in autumn (October–December). Land cover in the Ozark Plateaus is predominantly forest (47.6%) and agriculture (pasture and crop land, 39.8%), with minor developed areas (6.5%), shrubs and wetlands (4.3%), open water (1.7%), and barren land (0.2%) [29]. Forests were cleared for agriculture during the late 1800s but agricultural acreage began to decrease circa 1960 [29]. Most of the recharge area for Big Spring lies within Mark Twain National Forest [35], whereas land cover for the Bennett and Greer spring basins is mainly agriculture and secondarily forest [39,40,43].

2.2. Data Collection and Processing

Nearly 100 years (1921–2019) of daily discharge records were obtained from the US Geological Survey (USGS) National Water Information System [44]. Daily precipitation data for weather stations adjoining the three springs were collected from the Midwestern Regional Climate Center (MRCC) [45]. Detailed data descriptions, including USGS and MRCC station identification numbers, data records, and elevations, are found in Table 1. Though discharge data were obtained from a single station, rainfall data were gathered from multiple stations associated with each county to account for data gaps. If more than ten records were missing for a given month, the data for that station during that month were excluded from the analyses. Due to the data gaps, the Bennett Spring and Big Spring discharge data were separated into three time intervals: 1928–1941, 1965–1995, and 2007–2019. Greer Spring discharge records were consistent from 1921 to 2019, but discharge was divided into the same time periods as Bennett and Big Spring for some time-series analyses.

2.3. Hydrograph Separation

All spring discharges were partitioned into quick-flow and baseflow components using Web-based Hydrograph Analysis Tool (WHAT) software with a recursive digital filter [46], assuming that karst conduits are analogous to streams and the matrix is analogous to the porous aquifer in WHAT’s dual-domain conceptualization. As WHAT requires complete time series (no missing records), the hydrograph separation was performed for consistent discharge records for individual springs: 1928–1941, 1965–1995, and 2007–2019 for Bennett Spring; 1928–1996 and 2000–2019 for Big Spring; and 1921–2019 for Greer Spring. We initially conducted hydrograph separations using the range of maximum BFI (BFImax) values provided [47], from 0.25 for perennial streams with hard-rock aquifers to 0.80 for perennial streams with porous aquifers. Since hydrographs with BFImax = 0.80 consistently showed baseflow less than total discharge, we subsequently conducted hydrograph separations by increasing BFImax until a linear regression of log10 baseflow versus log10 total discharge resulted in an r2 value of 0.95 for each data set. We used log-transformed data to limit the influence of peak discharge values on the regression, and we selected a cutoff of r2 = 0.95 (instead of a higher value) with the recognition that overly high r2 values would unrealistically overestimate baseflow contributions to discharge peaks.

2.4. Statistical Time-Series Analysis

2.4.1. Autocorrelation

The autocorrelation function (ACF) determines the linear dependency of consecutive values over time [48]. The autocorrelogram is calculated from the decorrelation of lag time (k). The threshold of the autocorrelation function (rk) is usually between 0.1 and 0.2 because white noise dominates beyond this point [15,49]. In general, the shape of the autocorrelogram determines the memory effect of the system, which provides information on the extent of karstification and groundwater flow reserves of the karst aquifer [50]. We conducted autocorrelation analysis on discharge for the time intervals 1928–1941, 1965–1995, and 2007–2019 for all three springs.

2.4.2. Spectral Analysis

Spectral analysis determines the periodic components of the karst aquifers by analyzing the frequency domain in the time series [49]. We used the Lomb–Scargle Periodogram (LSP) algorithm to determine the periodic components on the discharge time series. The periodogram estimates the power of spectral density of a signal. Similar to the autocorrelation, spectral analysis was performed on the discharge time series for 1928–1941, 1965–1995, and 2007–2019 for all three springs. The LSP function was used to identify inflection points (i.e., slope breaks) representing a periodic component (inverse of the frequencies) in the system. The LSP enables calculation of the actual lag time corresponding to the cyclic component (oscillation) and determination of whether periodicity in the system is statistically significant [51].

2.4.3. Cross-Correlation

The cross-correlation function (CCF) transforms the input signal (e.g., precipitation) to the output signal (spring discharge), thereby providing information on the degree of karstification [17,23,49]. The delay between precipitation and spring discharge (from lag 0 to a maximum CCF value) indicates the pressure-pulse transfer time through the aquifers [52]. The cross-correlogram mimics the flood hydrograph, which has a rising limb, peak discharge, and recession limb [53].
As CCFs require consistent paired time series, we used similar discharge and rainfall series for multiple time intervals for each spring. Lebanon 2 W, Van Buren 1 NE and Van Buren 7.2 SW, and Alton were selected as the adjoining weather stations for Bennett, Big, and Greer springs. We conducted CCF calculations using data from these stations for the periods 1965–1995 for Bennett Spring, 1960–1983 for Big Spring, 1994–2019 for Greer Spring, and 2007–2019 for all three springs. Due to interbasin recharge [42], West Plains rainfall was also considered as an input for Big and Greer springs for the periods 1928–1996 and 2000–2019. All time-series analyses (autocorrelation, spectral analysis, and cross-correlation) were performed in R version 3.6 and RStudio version 0.97.124 [54].

2.5. Mann-Kendall Test

The Mann–Kendall (MK) test is a robust non-parametric, ranked-trend test that indicates the presence of a downward or upward trend in a time series. We used the MK trend test on spring discharge and rainfall time-series to observe whether monotonic (increasing or declining) trends occur. The Sen–Theil (Sen’s) slope was calculated to assess the magnitude of the trend in discharge and rainfall records for all three springs [55,56].
Positive serial correlation or autocorrelation can inflate the variance of the MK statistics, thus increasing the possibility of a type-I error (rejecting a null hypothesis where there is no trend) [57]. It is a common practice to prewhiten the time series by autoregressive or autoregressive moving average models to reduce the impact of serial correlation [58,59]. However, prewhitening can change the inherent properties (e.g., trend, seasonality) of the original series, especially for hydroclimatic variables [59]. Therefore, we have not removed the autocorrelation for the MK trend test. Similar to the time-series analysis, the MK trend test was conducted on multiple subsets of discharge and rainfall series using R version 3.6 and RStudio version 0.97.124.

3. Results

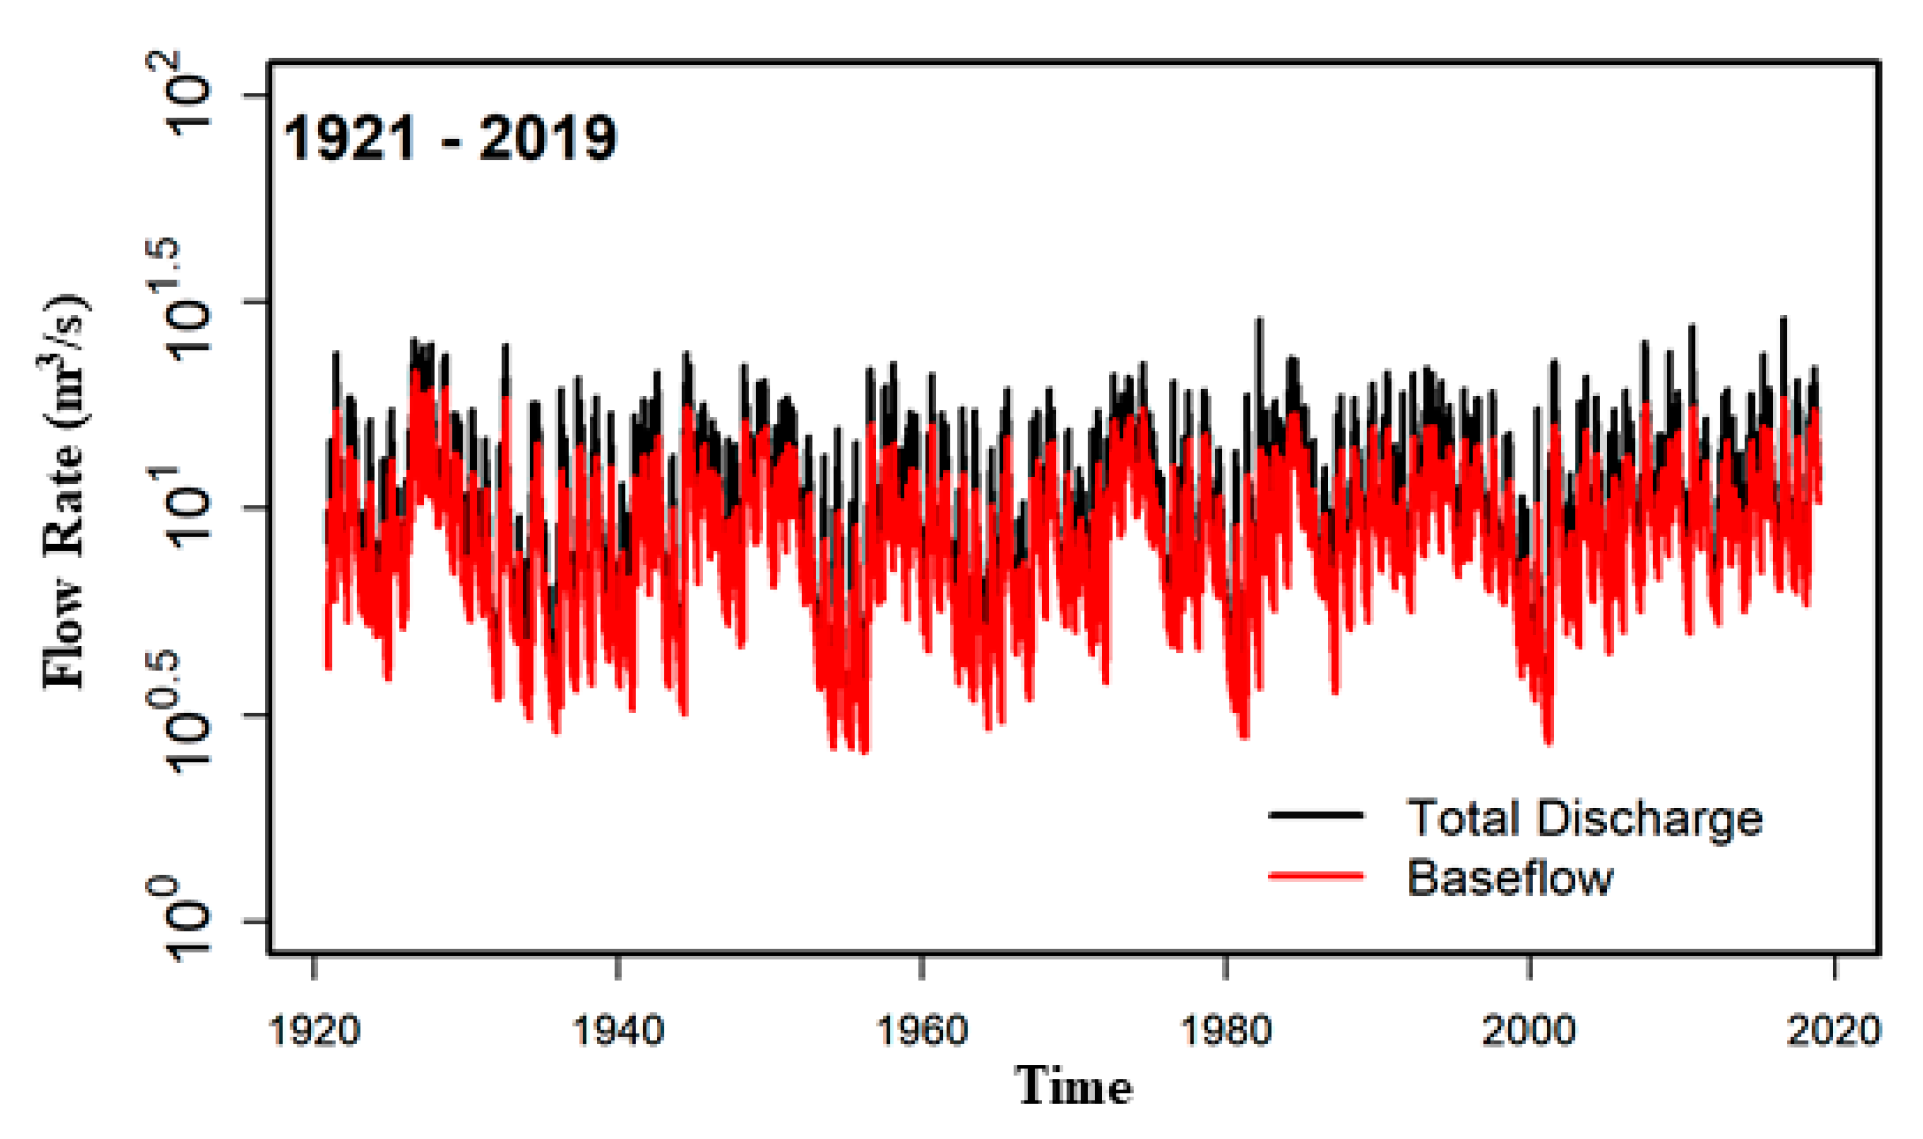
3.1. Spring Discharge and Rainfall

The average discharge was >2.83 m3/s for each period of record for all three springs, which classifies them as first-magnitude, which is consistent with historical data [7]. The mean discharge was highest for Big Spring, whereas the maximum discharge was observed for Bennett Spring (Table 2). Mean discharge values for Bennett Spring were 4.3 m3/s for 1928–1941, 5.6 m3/s for 1965–1995, and 5.4 m3/s for 2007–2019. Discharge ranged from 2.1 m3/s on 12 January 1974 to 180 m3/s on 1 October 1986. For Big Spring, mean discharge values were 12.7 m3/s for 1921–1996 and 13.3 m3/s for 2000–2019. Discharge ranged from 6.7 m3/s on 6 October 1956 to 56.3 m3/s on four dates (3 December 1982; 1 May 1983; 24 February 1985; and 21 November 1985). Mean discharge for Greer Spring was 9.9 m3/s, with a range from 2.9 m3/s on 16 November 1956 to 28.6 m3/s on 3 December 1982.
Mean 1-day rainfall values were similar for Van Buren (3.18 mm), Lebanon (3.26 mm), and Alton (3.31 mm) but notably higher for West Plains (4.48 mm). The two highest 1-day rainfall totals were recorded on 12 March 1982 (212 mm at Alton and 193 mm at Van Buren). Maximum 1-day rainfalls were lower and similar at West Plains (176 mm on 29 April 2017) and Lebanon (167 mm recorded on 27 September 2016).

3.2. Hydrograph Separation

Hydrograph separation indicates that baseflow dominates discharge for all three springs (Table 2 and Figure 3, Figure 4 and Figure 5). Values of BFImax were 0.912 (for both 1928–1941 and 1965–1995) to 0.914 (for 2007–2019) for Bennett Spring, 0.924 (for 1928–1996) to 0.944 (for 2000–2019) for Big Spring, and 0.860 for Greer Spring.

3.3. Statistical Time-Series Analysis

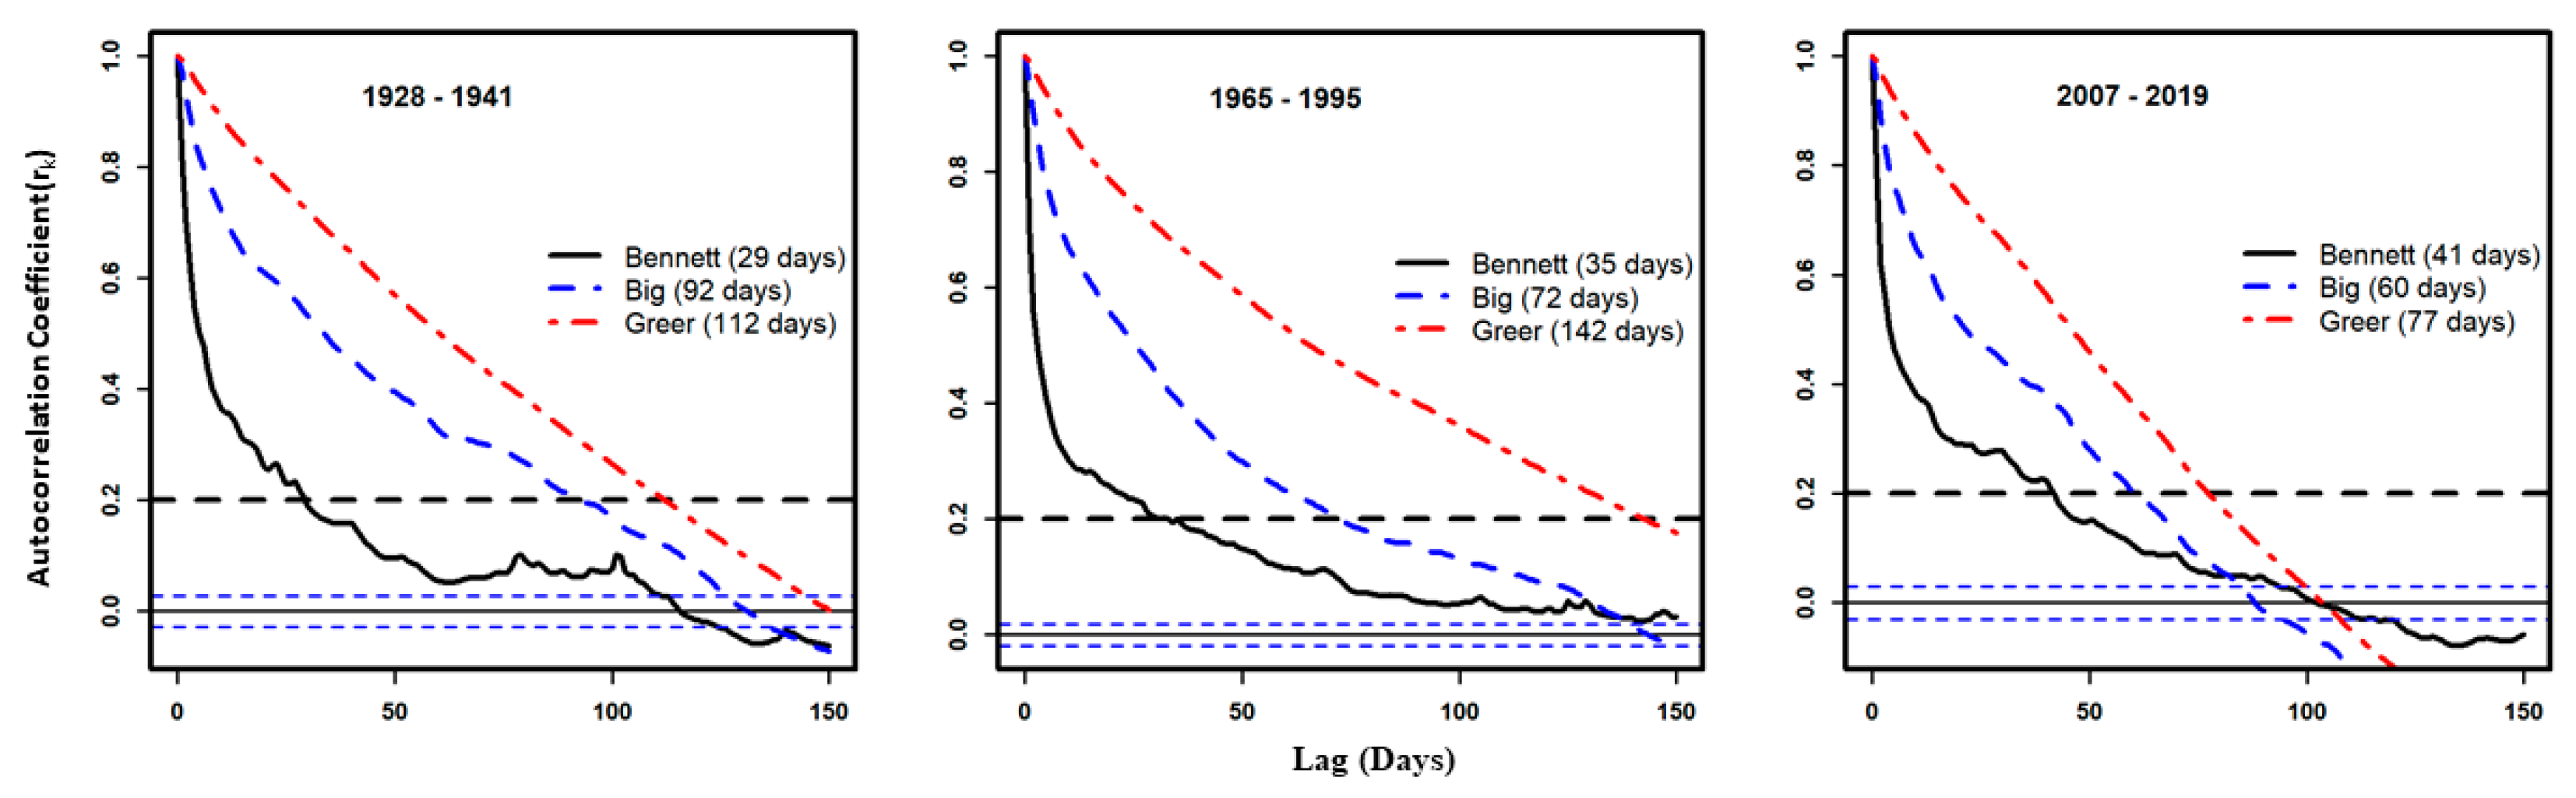
3.3.1. Autocorrelation

For the period from 1928–1941, the steep slope on the auto-correlogram shows a moderate memory effect (k = 29 days) for Bennett Spring (Figure 6). In contrast, the gentle slopes for Big and Greer springs for the same period indicate an extensive memory effect (k = 92 days and 112 days, respectively). Overall, the k value was greatest (142 days) for Greer Spring during 1965–1995. For Bennett Spring, k increased to 35 days for 1965–1995 and 41 days for 2007–2019, whereas k decreased to 72 days and 60 days over the same periods for Big Spring, and decreased to 77 days for Greer Spring during 2007–2019 (Figure 6).

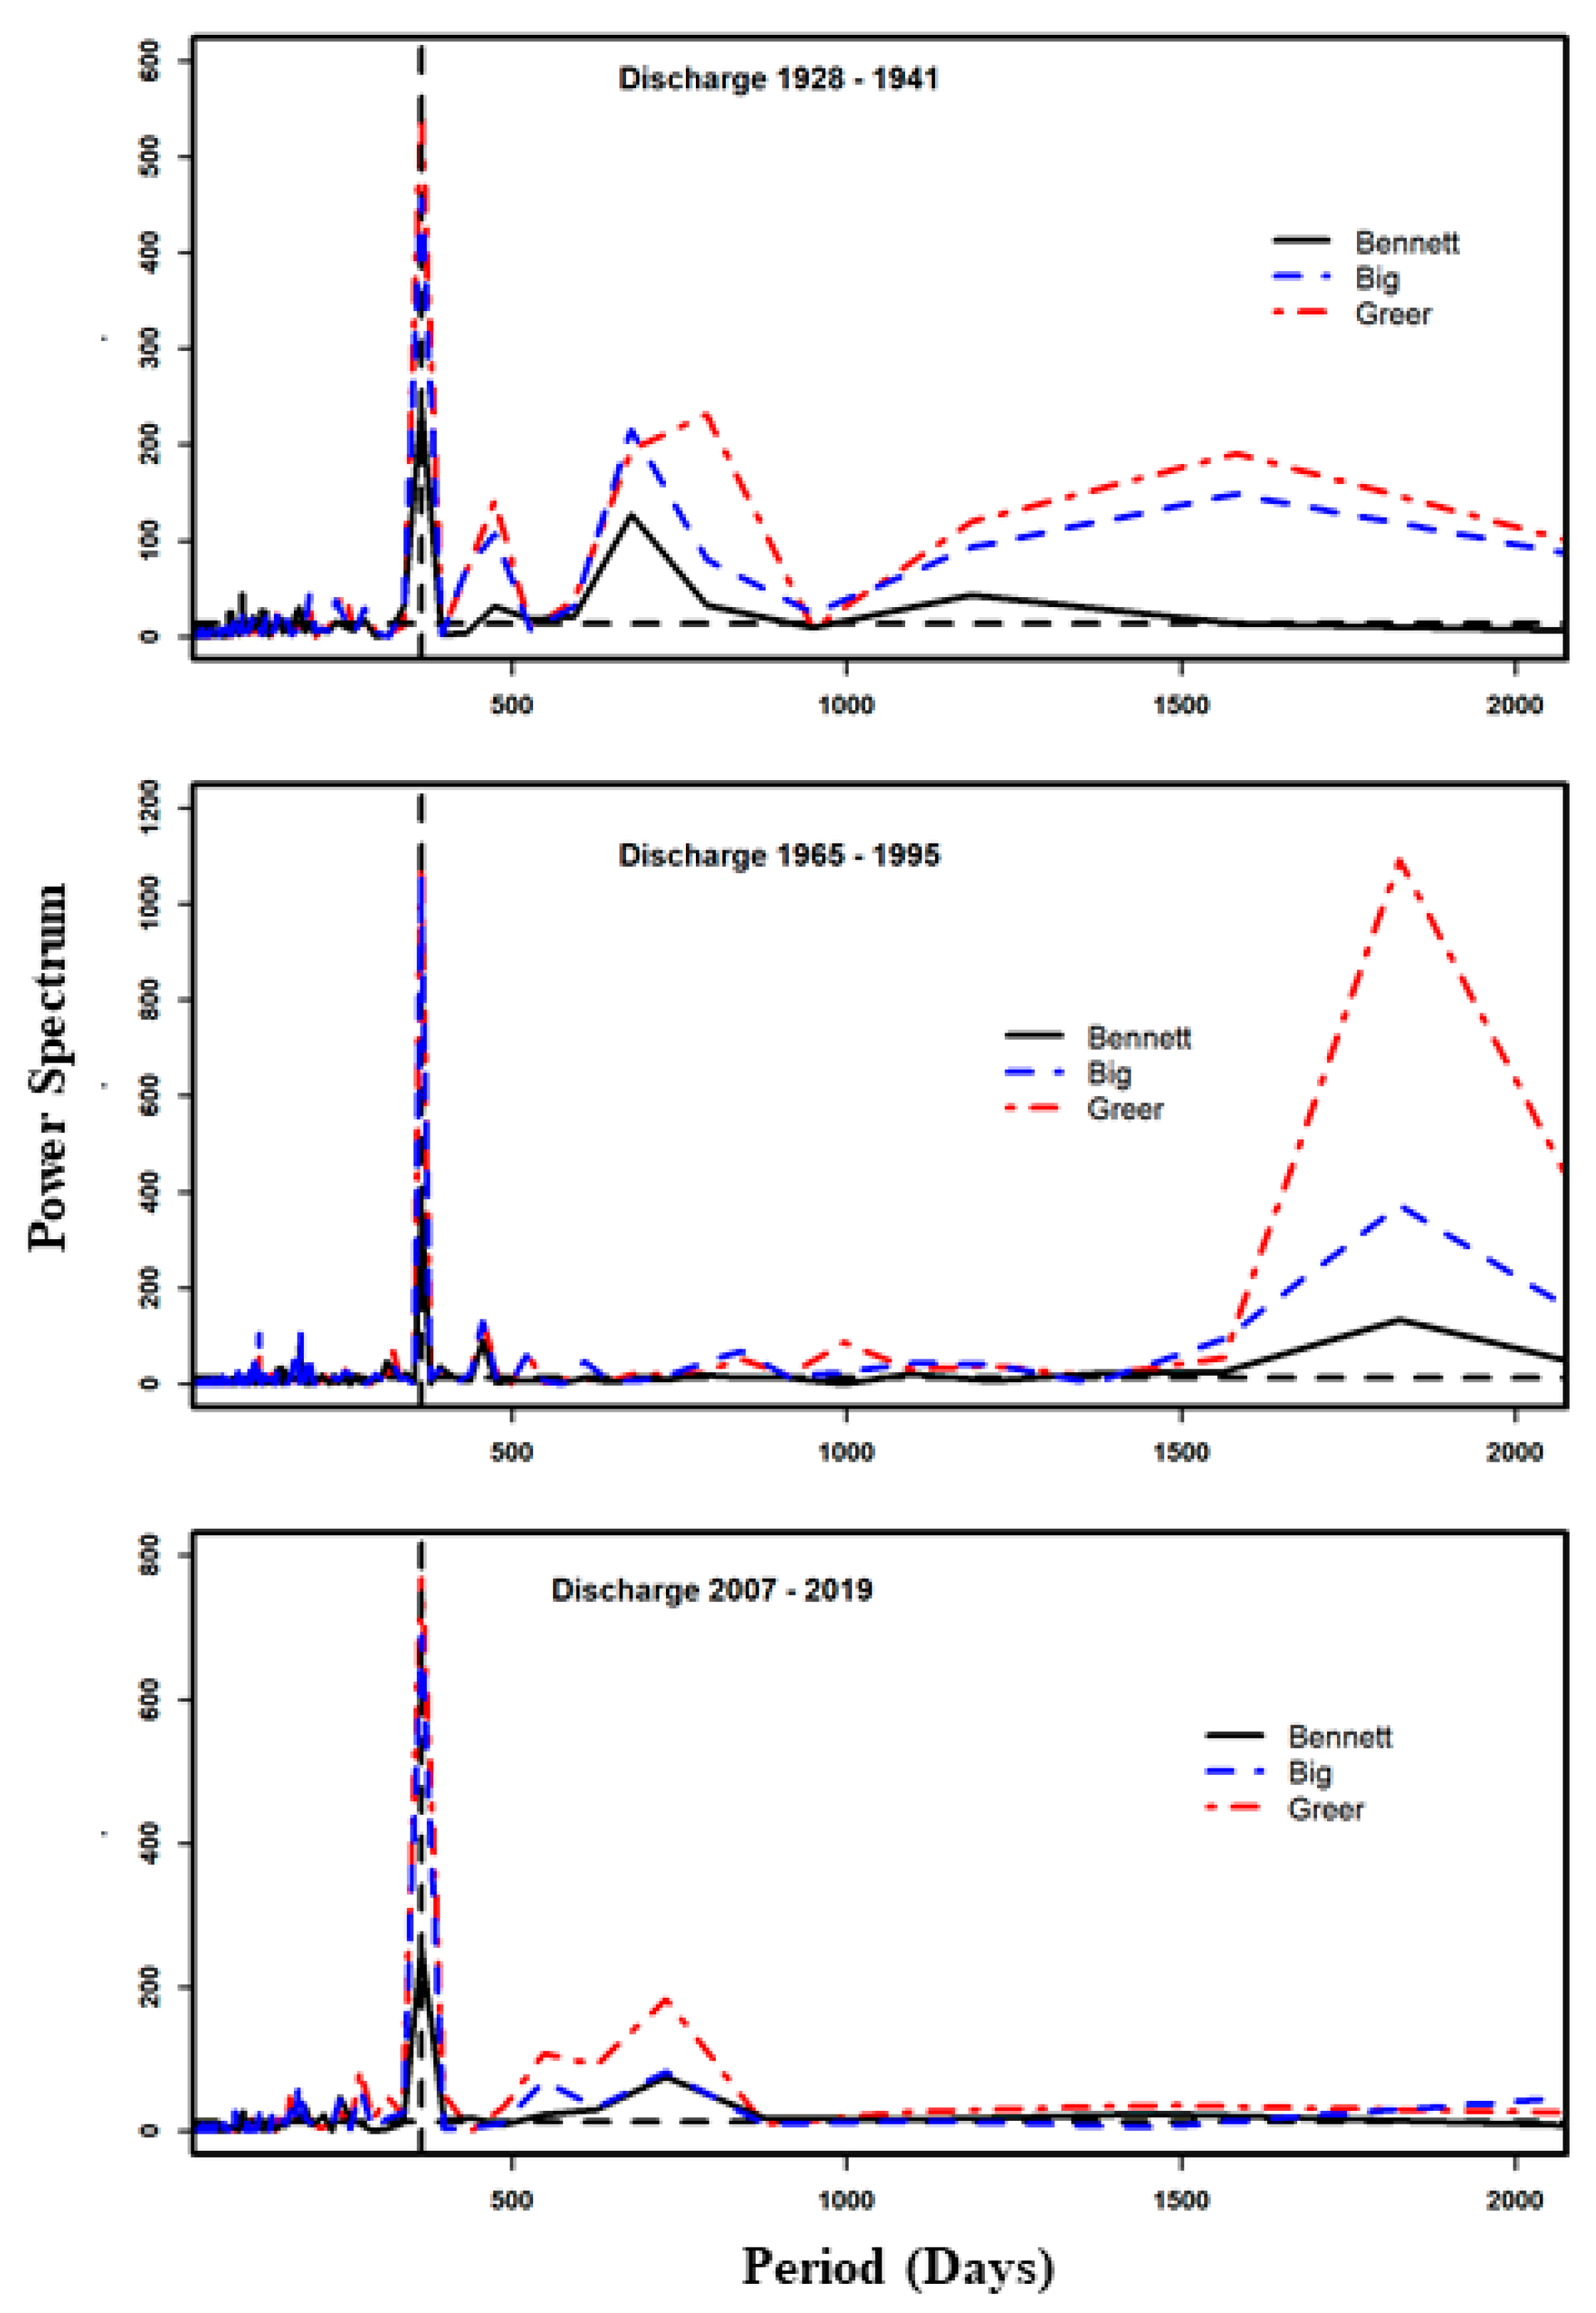
3.3.2. Spectral Analysis

The discharge LSP reveals that the annual signal dominates all three springs (Figure 7), but Bennett Spring has lower power (200–300), indicating a relatively quick response to a single rainfall event [44]. Greer Spring has the highest power spectrum (500–1200). In addition to the annual component, significant seasonal (100–180 days) and pluriannual (400–1800 days) discharge cycles are evident for all three springs (Figure 7).

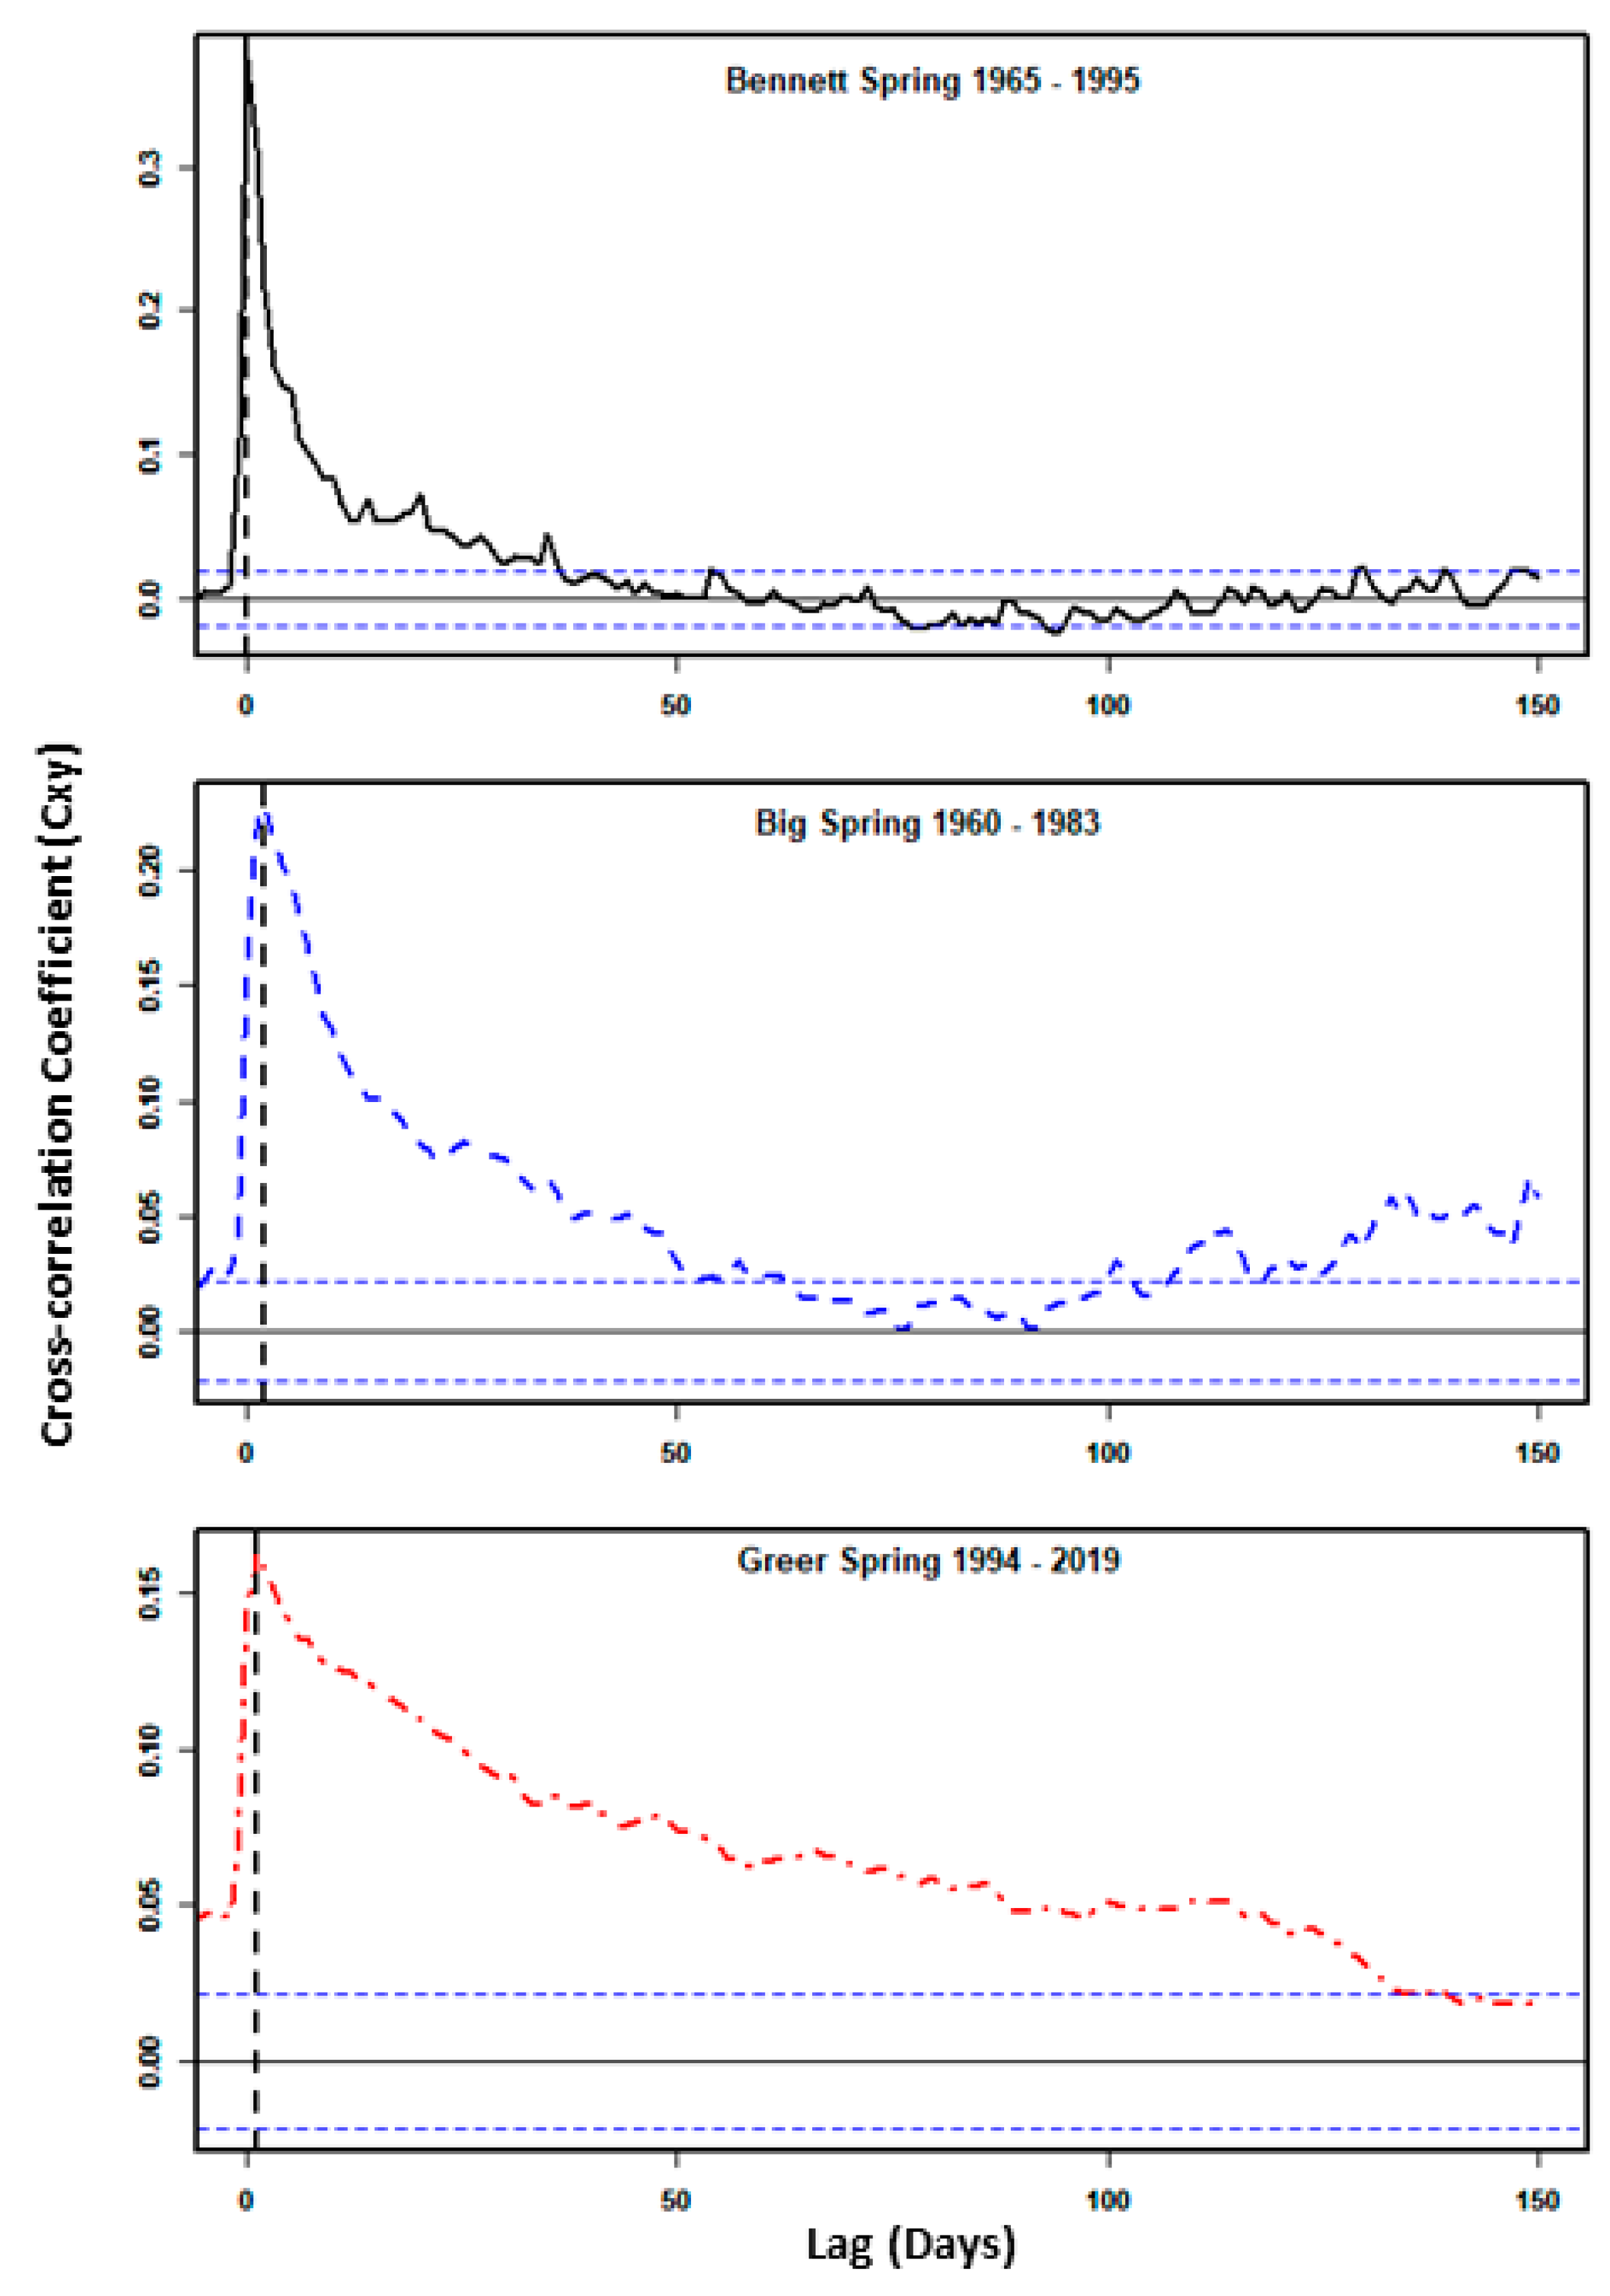
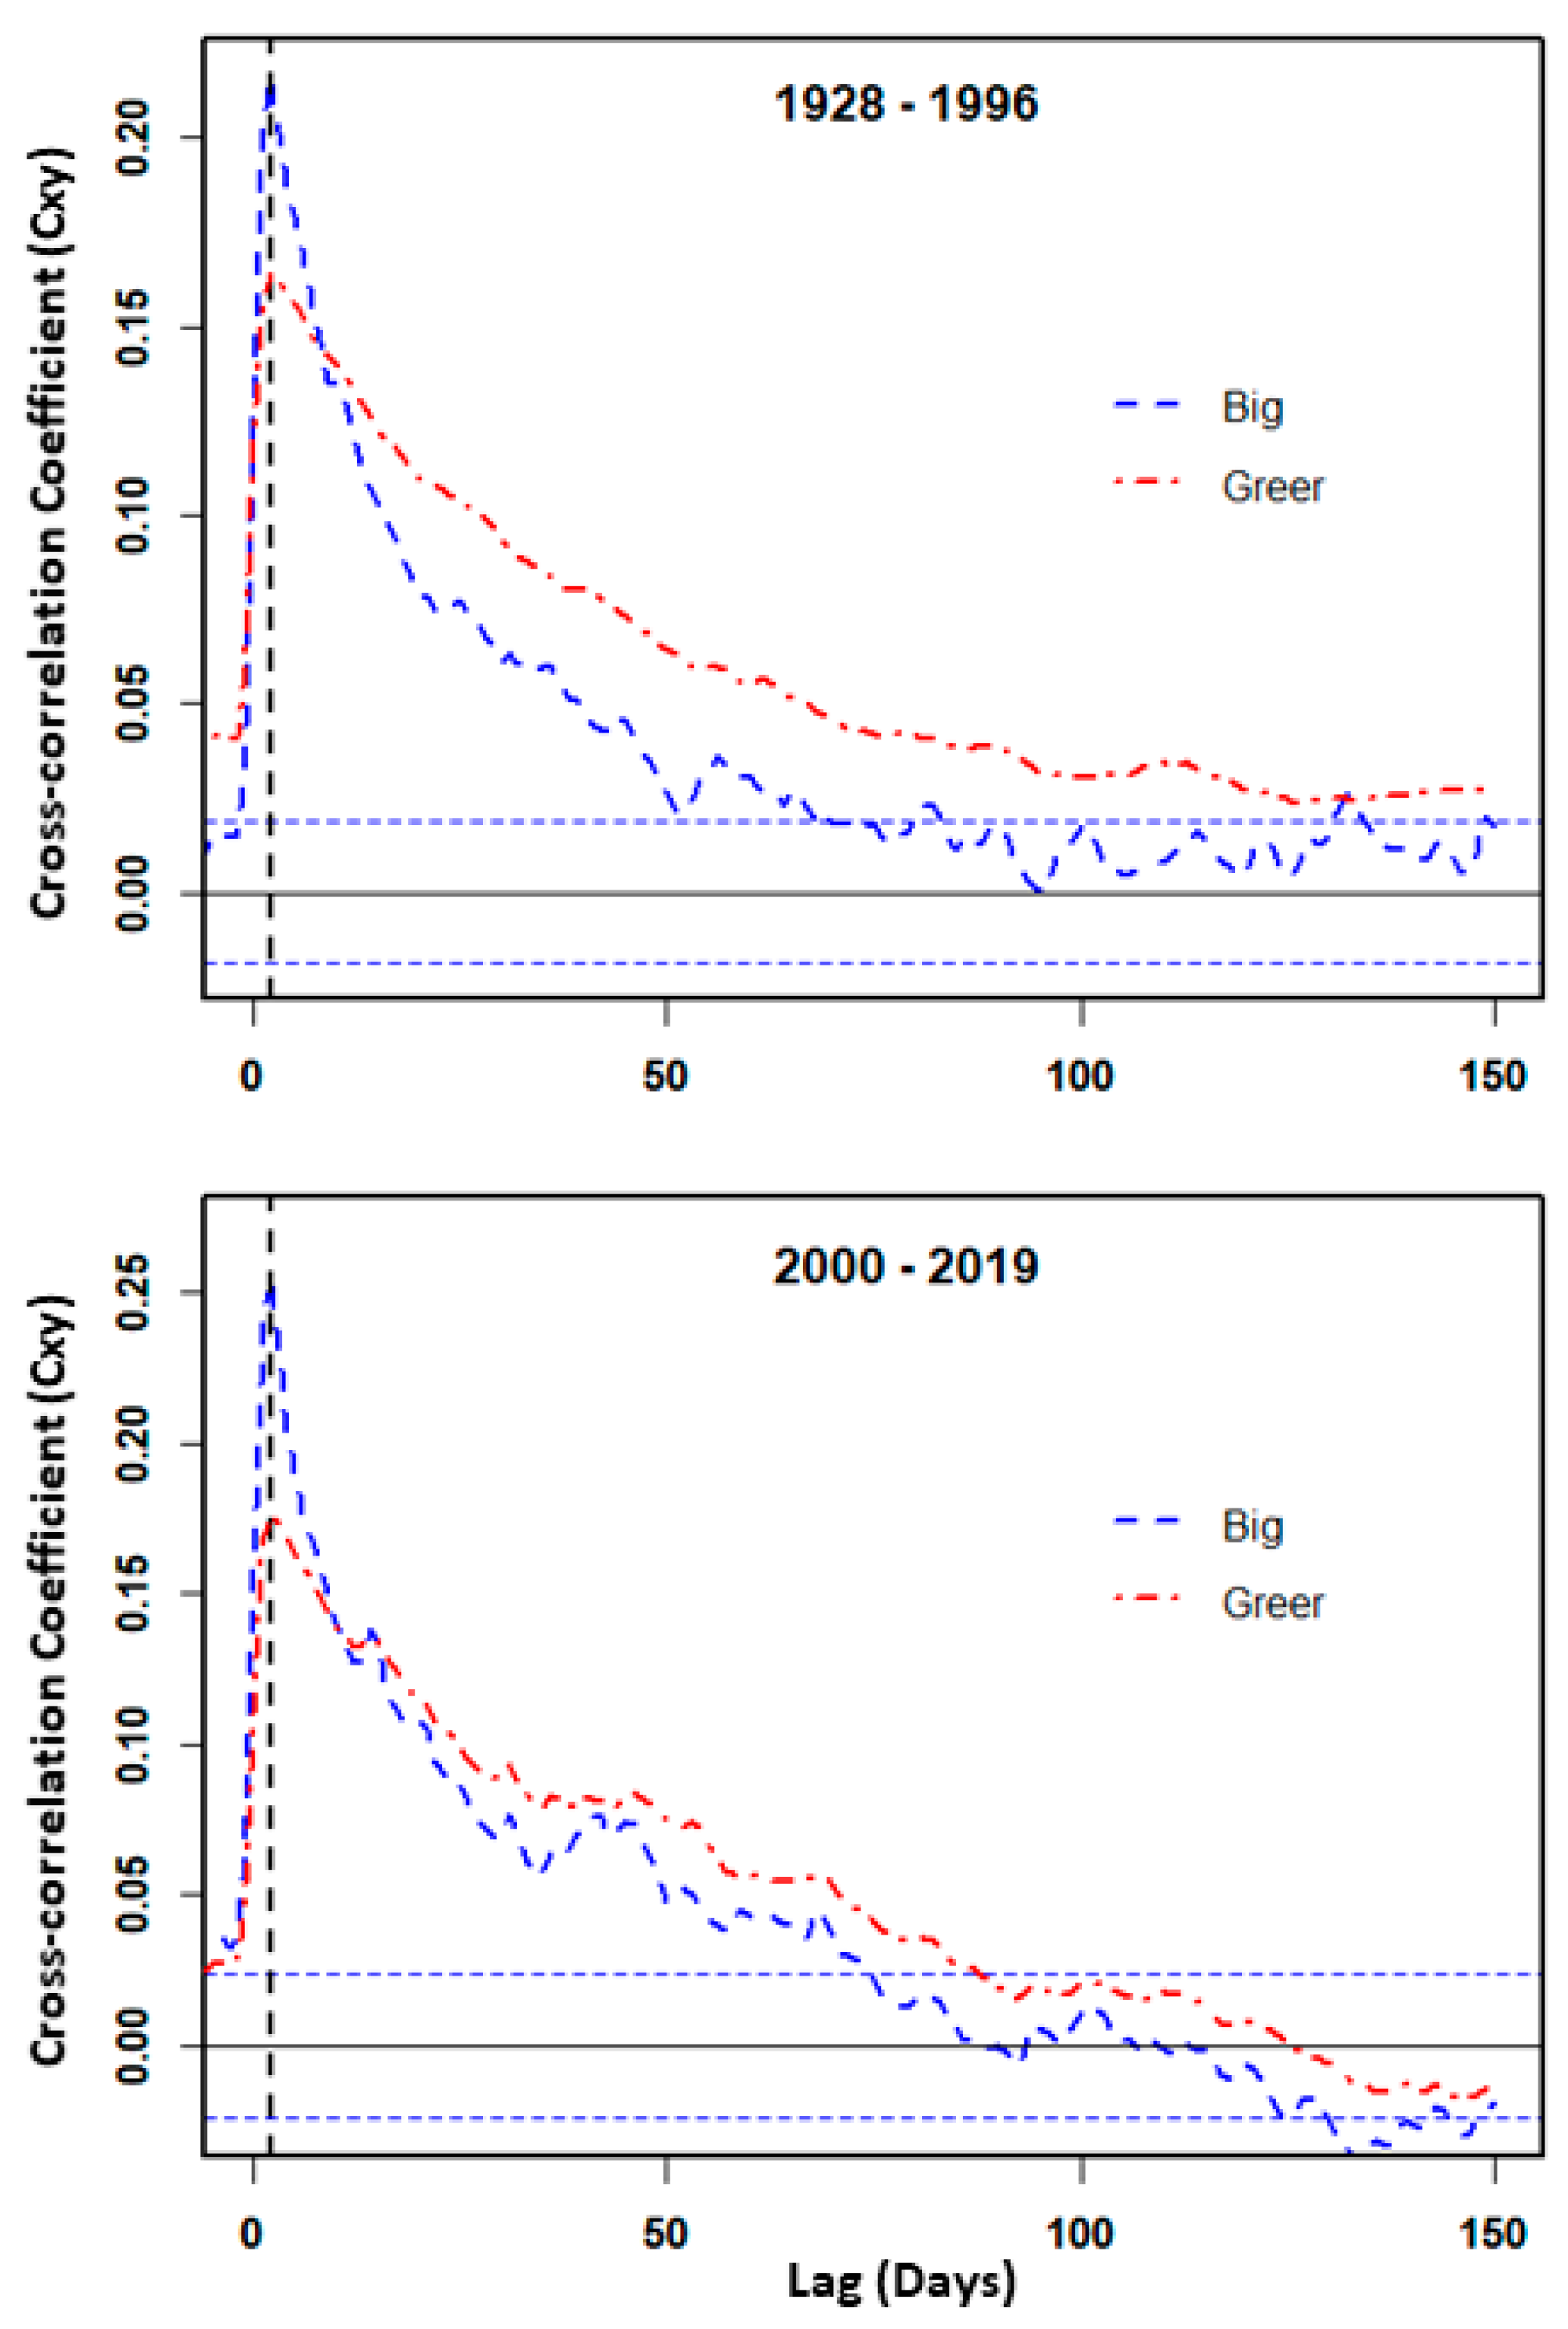
3.3.3. Cross-Correlation

Lag-time (Tlag) values calculated from CCF were relatively brief for all three springs, and peak CCF (Cxy(k)) values were relatively consistent over time for each spring, with Cxy(k) highest at Bennett Spring, intermediate at Big Spring, and lowest at Greer Spring. For rainfall at Lebanon and discharge at Bennett Spring, Tlag was 0 days for 1965–1995 (at peak Cxy(k) = 0.37; Figure 8) and 1 day for 2007–2019 (at peak Cxy(k) = 0.40; Figure 9). For rainfall at Van Buren and discharge at Big Spring, Tlag was 2 days for 1960–1983 (at peak Cxy(k) = 0.22; Figure 8) and 1 day for 2007–2019 (at Cxy(k) = 0.28; Figure 9). The CCF between Alton rainfall and Greer Spring discharge shows a Tlag of 1 day for 1994–2019 at peak Cxy(k) = 0.16 (Figure 8). Considering West Plains’ rainfall as an input to both Big and Greer springs, Tlag values were 2 days for both 1928–1996 (Cxy(k) = 0.21 for Big Spring and 0.15 for Greer Spring) and 2000–2019 (Cxy(k) = 0.26 for Big Spring and 0.17 for Greer Spring) (Figure 10).

3.4. Mann-Kendall Trend Test

For Bennett Spring, there is a significant positive (upward) trend (tau = 0.222, p < 0.001) in discharge but a significant negative trend in precipitation at Lebanon (tau = −0.021, p = 0.003) for 1965–1995 (Table 3). For 2007–2019, there is a significant downward trend in both discharge at Bennett Spring (tau = −0.115, p < 0.001) and precipitation at Lebanon (tau = −0.028, p = 0.009) (Table 3). We observed significant upward trends in discharge at Big Spring for 1965–1995 and 1928–1996 (tau = 0.122 and p < 0.001 for both time intervals), and at Greer Spring for all three intervals (tau = 0.129 and p < 0.001 for 1965–1995; tau = 0.096 and p < 0.001 for 1928–1996; tau = 0.04 and p = 0.04 for 2007–2019) (Table 3). Precipitation for Van Buren (adjacent to Big Spring) shows a significant upward trend for 1965–1995 (tau = 0.025, p < 0.001) but not for 2007–2019, whereas precipitation for Alton (adjacent to Greer Spring) shows a significant upward trend for 2007–2019 (tau = 0.067, p < 0.001) (Table 3). Precipitation for West Plains does not show a significant trend for 1928–1996 or for 2000–2019.

4. Discussion

The discharge values ranged over almost two orders of magnitude for Bennett Spring and over almost an order of magnitude for Big and Greer springs, but discharge overall was dominated by the baseflow at each spring. The actual maximum discharge at Bennett Spring is assumed to be 28 m3/s, 16% of the maximum value in Table 2, because the gauge is affected by runoff in an adjoining ephemeral stream (Spring Hollow) [32]. The actual maximum discharge at Big Spring may be 34 m3/s, 60% of the maximum value in Table 2, because backflooding from the adjoining Current River during periods of high flow complicates discharge measurements [35]. The relative order of mean discharge values scales with the basin area (Bennett < Greer < Big). BFImax values in this study are comparable to that obtained for a Brazilian stream dominated by baseflow from porous rocks (0.95) [60]. Based on a dimensionless theoretical hydrograph using the water levels in observation wells during 2008–2009, a BFI value of ~0.80 was obtained for Big Spring [36]. However, physical hydrograph separation using the program HYSEP [61] overestimated baseflow at Big Spring during 2001–2004 [35]. Combining physical and chemical hydrograph separation (based on specific conductance) at Big Spring resulted in annual BFI values of 0.681 to 0.916, versus values of 0.901 to 0.952 calculated by HYSEP [35]. Annual BFI values determined by physical hydrograph separation for major karst springs elsewhere ranged from 0.727 to 0.902 (mean 0.846, n = 10 years) for an ~81-km2 basin in southwest China [16] and from 0.47 to 0.89 (mean 0.73, n = 7 years) for an ~100-km2 basin in west-central Portugal [62].
Time-series analyses indicate both similarities and differences in the hydraulic functioning of the three springs. ACF results indicate k values in the order Bennett < Big < Greer for each studied period. The overall range of k values (29–142 days) encompasses the range reported for major karst springs in Slovenia (32 days) [23], China (~60 days) [48], France (76 days) [46], Portugal (79 days) [60], Greece (83 days) [50], and Morocco (37–117 days) [21]. The considerable inertia for Big and Greer springs is consistent with tritium, chlorofluorocarbon, and SF6 data that suggest mean groundwater ages of 40 to >200 years [35]. Spectral analyses indicate that the annual signal is the strongest for all three springs in this study, with secondary pluriannual and seasonal peaks. The order of power values (Bennett < Big < Greer) indicates that Bennett Spring is most affected by quick responses to precipitation. Peak Cx,y(k) values are in the order Bennett > Big > Greer, with Tlag values for Bennett Spring (0–1 day) being slightly shorter than for Big and Greer springs (1–2 days). These Tlag values are similar to those determined for Malenščica spring in Slovenia (0–2 days) [23] and Maoshuikeng spring in southwest China (2 days) [48]. The Tlag values for Big Spring are similar to the time constant of 1.5 days used in dimensionless hydrograph modeling [36]. Physical and chemical hydrograph separation and quantitative dye tracing indicate that storm water arrives at Big Spring 8–11 days after infiltration [35]. Collectively, our results suggest that each of the three springs responds to precipitation over different time scales, but that Bennett Spring responds most rapidly, which is consistent with its smaller basin area and with the gauge being affected by runoff at high flow levels. Differences between Big Spring (for which k and power values are lower, peak Cx,y(k) values are higher, and the CCF declines more rapidly after the peak) and Greer Spring indicate that the extent of karst development also plays a role (i.e., the conduit network appears to be better developed in the larger Big Spring basin) [13,17].
Over multiple decades, MK trend analysis indicates significant increases in the discharge for Bennett Spring (1965–1995), Big Spring (1965–1995 and 1928–1996), and Greer Spring (1921–2019). The results are more ambiguous for 2007–2019, with a significantly decreasing trend for Bennett Spring, a slightly significantly increasing trend for Greer Spring, and no significant trend for Big Spring. The results of MK trend analysis for rainfall at individual stations over multiple periods are likewise ambiguous, with decreasing trends for Lebanon (1965–1995 and 2007–2019), an increasing trend for Van Buren for 1960–1983 (but no significant trend for 2007–2019), an increasing trend for Alton (2007–2019), and no significant trends for West Plains (1928–1996 and 2000–2019). However, trend analyses encompassing multiple stations in the region indicate significant multi-decadal increases in rainfall. For the 190.6-km2 Big Barren Creek watershed, located primarily in Carter County, rainfall at six adjoining stations (including West Plains) increased on average 0.22 cm/year from 1955 to 2015 [63]. Mean annual precipitation in the southern Ozark Plateaus (southern Missouri and northern Arkansas) increased 0.27%/year from 1951 to 2011 [29]. Long-term increases in spring discharge may thus reflect increases in precipitation but may also reflect the decreased agricultural LU/LC [29]. In particular, decreasing k values over time for the Big Spring basin may reflect reforestation, which would promote recharge, although Pavlowsky et al. [63] noted “it is not clear to what degree long-term adjustments to historical land clearing are still affecting watersheds today,” and decreased k values for springs in Morocco were associated with drought [21]. Recent (2007–2019) changes in discharge could also result in part from an increase in the frequency of extreme rainfall events [63], which would promote runoff rather than diffuse infiltration. However, the reason for the disappearance of the 1600–1800-day discharge cycle in spectral analysis for 2007–2019 is unclear. Changes in discharge are probably not significantly affected by groundwater pumping; combined daily pumping rates as of 2010 for all counties within each spring basin [29] were only 3.0% to 8.4% of the mean discharge rate for each spring. Overall, the multi-decadal increases in discharge for springs in this study are consistent with the trend for Comal Springs (Texas, 1933–2007) [22] and contrast with multi-decadal decreases for springs in southern Italy [27].

5. Conclusions

Analyses of daily discharge data for three large karst springs and of daily rainfall for the adjoining weather stations in the Salem Plateau of southern Missouri provide insights into the controls on spring discharge over nearly a century (1928–2019). Few studies have conducted quantitative hydrograph analyses of such durations for karst springs, and, other than trend analyses, no long-term time-series analyses had been conducted for the study area, which is one of the major karst regions of the USA. Calculated BFImax values based on physical hydrograph separation indicate that discharge at each spring is baseflow-dominated (86–94%). Statistical time-series analyses indicate that Big and Greer springs are marked by considerable inertia, with k values of 2 to >4 months. Discharge at all three springs shows rapid responses to rainfall (within 2 days) and strong annual periodicity. Significant multi-decadal increases in discharge during the 20th century coincide with regional-scale increases in precipitation, although more recent data (2007–2019) do not show consistent increases in discharge. Since the reforestation of agricultural land (particularly in the Big Spring basin) may have promoted recharge, more detailed studies of LU/LC changes at the basin scale and their impacts on recharge are warranted.

Author Contributions

Conceptualization, A.E.F. and S.K.S.; methodology, A.E.F. and S.K.S.; software, S.K.S.; validation, S.K.S.; formal analysis, S.K.S.; investigation, A.E.F. and S.K.S.; data curation, S.K.S.; writing—original draft preparation, S.K.S.; writing—review and editing, A.E.F. and S.K.S.; visualization, S.K.S.; supervision, A.E.F.; project administration, A.E.F. All authors have read and agreed to the published version of the manuscript.

Funding

This research received no external funding.

Data Availability Statement

Original time-series data are available from sources [44,45]. Results of analyses presented herein are available upon request from the corresponding author.

Conflicts of Interest

The authors declare no conflict of interest.

References

  1. White, W.B. Analysis of karst aquifers. In Regional Ground-Water Quality; Alley, W.M., Ed.; Van Nostrand Reinhold: New York, NY, USA, 1993; pp. 471–489. [Google Scholar]
  2. Kiraly, L. Karstification and groundwater flow. In Evolution of Karst: From Prekarst to Cessation; Gabrovšek, F., Ed.; Založba ZRC: Postojna, Slovenia, 2002; pp. 155–190. [Google Scholar]
  3. Goldscheider, N.; Drew, D. Methods in Karst Hydrogeology; Taylor and Francis: London, UK, 2007. [Google Scholar]
  4. White, W.B. Conceptual models for karstic aquifers. In Karst Modeling; Palmer, A.N., Palmer, M.V., Sasowsky, I.D., Eds.; Special Publication 5; Karst Waters Institute: Leesburg, VA, USA, 1999; pp. 11–16. [Google Scholar]
  5. Dreybrodt, W. The role of dissolution kinetics in the development of karst aquifers in limestone: A model simulation of karst evolution. J. Geol. 1990, 98, 639–655. [Google Scholar] [CrossRef]
  6. Fiorillo, F.; Malik, P. Hydraulic behavior of karst aquifers. Water 2019, 11, 1563. [Google Scholar] [CrossRef] [Green Version]
  7. Meinzer, O.E. Large Springs in the United States; U.S. Geological Survey Water-Supply Paper 557; U.S. Government Printing Office: Washington, DC, USA, 1927. [Google Scholar]
  8. Chen, Z.; Grasby, S.E.; Osadetz, K.G. Relation between climate variability and groundwater levels in the upper carbonate aquifer, southern Manitoba, Canada. J. Hydrol. 2004, 290, 43–62. [Google Scholar] [CrossRef]
  9. Fiorillo, F.; Esposito, L.; Guadagno, F.M. Analyses and forecast of water resources in an ultra-centenarian spring discharge series from Serino (Southern Italy). J. Hydrol. 2007, 336, 125–138. [Google Scholar] [CrossRef]
  10. Smith, B.A.; Hunt, B.B. Flow potential between stacked karst aquifers in Central Texas. In Advances in Research in Karst Media, 4th International Symposium on Karst; Andreo, B., Carrasco, F., Duran, J.J., LaMoreaux, J.W., Eds.; Springer: Heidelberg, Germany, 2010; pp. 43–48. [Google Scholar]
  11. Hartmann, A.; Liu, Y.; Olarinoye, T.; Berthelin, R.; Marx, V. Integrating field work and large-scale modeling to improve assessment of karst water resources. Hydrogeol. J. 2021, 29, 315–329. [Google Scholar] [CrossRef]
  12. Ford, D.; Williams, P. Karst Hydrogeology and Geomorphology; John Wiley & Sons: New York, NY, USA, 2007. [Google Scholar]
  13. Bonacci, O. Karst springs hydrographs as indicators of karst aquifers. Hydrolog. Sci. J. 1993, 38, 51–62. [Google Scholar] [CrossRef]
  14. Fiorillo, F. The recession of spring hydrographs, focused on karst aquifers. Water Resour. Manag. 2014, 28, 1781–1805. [Google Scholar] [CrossRef]
  15. Basha, H.A. Flow recession equations for karst systems. Water Resour. Res. 2020, 56, e2020WR027384. [Google Scholar] [CrossRef]
  16. Zhang, R.; Shu, L.; Zhu, J.; Yu, Z.; Jiang, P. Storage and drainage characteristics of a highly heterogeneous karst aquifer in Houzhai Basin. Groundwater 2016, 54, 878–887. [Google Scholar] [CrossRef]
  17. Mangin, A. Pour une meilleure connaissance des systèmes hydrologiques à partir des analyses corrélatoire et spectrale. J. Hydrol. 1984, 67, 25–43. [Google Scholar] [CrossRef]
  18. Padilla, A.; Pulido-Bosch, A. Study of hydrographs of karstic aquifers by means of correlation and cross-spectral analysis. J. Hydrol. 1995, 68, 73–89. [Google Scholar] [CrossRef]
  19. Labat, D.; Ababou, R.; Mangin, A. Rainfall–runoff relations for karstic springs. Part II: Continuous wavelet and discrete orthogonal multiresolution analyses. J. Hydrol. 2000, 238, 149–178. [Google Scholar] [CrossRef]
  20. Labat, D.; Masbou, J.; Beaulieu, E.; Mangin, A. Scaling behavior of the fluctuations in stream flow at the outlet of karstic watersheds, France. J. Hydrol. 2011, 410, 162–168. [Google Scholar] [CrossRef]
  21. Amraoui, F.; Razack, M.; Bouchaou, L. Turbidity dynamic in karstic systems: Example of Ribaa and Bittit springs in the Middle Atlas (Morocco). Hydrolog. Sci. J. 2003, 48, 971–984. [Google Scholar] [CrossRef]
  22. Cox, W.D.; Meng, L.; Khedun, C.P.; Nordfelt, A.; Quiring, S.M. Discharge variability for an artesian spring of the Edwards Aquifer: Comal Springs (1933–2007). Int. J. Climatol. 2009, 29, 2324–2336. [Google Scholar] [CrossRef]
  23. Kovačič, G. Hydrological study of the Malenščica Karst Spring (SW Slovenia) by means of a time series analysis. Acta Carsologica 2009, 39, 201–215. [Google Scholar] [CrossRef] [Green Version]
  24. Ghosh, D.K.; Wang, D.; Bilskie, M.V.; Hagen, S.C. Quantifying changes of effective springshed area and net recharge through recession analysis of spring flow. Hydrol. Process. 2016, 30, 5053–5062. [Google Scholar] [CrossRef]
  25. Pavlić, K.; Parlov, J. Cross-correlation and cross-spectral analysis of the hydrographs in the northern part of the Dinaric karst of Croatia. Geosciences 2019, 9, 86. [Google Scholar] [CrossRef] [Green Version]
  26. Uddameri, V.; Singaraju, S.; Hernandez, E.A. Is Standardized Precipitation Index (SPI) a useful indicator to forecast groundwater droughts?—Insights from a karst aquifer. J. Am. Water Resour. Assoc. 2019, 55, 70–88. [Google Scholar] [CrossRef]
  27. Fiorillo, F.; Leone, G.; Pagnozzi, M.; Esposito, L. Long-term trends in karst spring discharge and relation to climate factors and changes. Hydrogeol. J. 2021, 29, 347–377. [Google Scholar] [CrossRef]
  28. Olarinoye, T.; Gleeson, T.; Marx, V.; Seeger, S.; Adinehvand, R.; Allocca, V.; Andreo, B.; Apaéstegui, J.; Apolit, C.; Arfib, B.; et al. Global karst springs hydrograph dataset for research and management of the world’s fastest-flowing groundwater. Sci. Data 2020, 7, 59. [Google Scholar] [CrossRef] [PubMed] [Green Version]
  29. Hays, P.D.; Knierim, K.J.; Breaker, B.; Westerman, D.A.; Clark, B.R. Hydrogeology and Hydrologic Conditions of the Ozark Plateaus Aquifer System; U.S. Geological Survey Scientific-Investigations Report 2016-5137; U.S. Geological Survey: Reston, VA, USA, 2016. [Google Scholar]
  30. Dreiss, S.J. Regional scale transport in a Karst Aquifer: 1. Component separation of spring flow hydrographs. Water Resour. Res. 1989, 25, 117–125. [Google Scholar] [CrossRef] [Green Version]
  31. Dreiss, S.J. Regional scale transport in a Karst Aquifer: 2. Linear systems and time moment analysis. Water Resour. Res. 1989, 25, 126–134. [Google Scholar] [CrossRef] [Green Version]
  32. Vandike, J.E. The Hydrogeology of the Bennett Spring Area, Laclede, Dallas, Webster, and Wright Counties, Missouri; Water Resources Report 38; Missouri Division of Geology and Land Survey: Rolla, MO, USA, 1992. [Google Scholar]
  33. Wicks, C.M.; Hoke, J.A. Prediction of the quality and quantity of Maramec Spring water. Groundwater 2000, 38, 218–225. [Google Scholar] [CrossRef]
  34. Winston, W.E.; Criss, R.E. Dynamic hydrologic and geochemical response in a perennial karst spring. Water Resour. Res. 2004, 40, W05106. [Google Scholar] [CrossRef]
  35. Imes, J.L.; Plummer, L.N.; Kleeschulte, M.J.; Schumacher, J.G. Recharge Area, Base-Flow and Quick-Flow Discharge Rates and Ages, and General Water Quality of Big Spring in Carter County, Missouri, 2000–2004; Scientific-Investigations Report 2007-5049; U.S. Geological Survey: Reston, VA, USA, 2007. [Google Scholar]
  36. Criss, R.E. A Darcian model for the flow of Big Spring and the hydraulic head in the Ozark aquifer, Missouri, USA. Acta Carsologica 2010, 39, 379–387. [Google Scholar] [CrossRef] [Green Version]
  37. Frederickson, G.C.; Criss, R.E. Isotope hydrology and residence times of the unimpounded Meramec River Basin, Missouri. Chem. Geol. 1999, 157, 303–317. [Google Scholar] [CrossRef]
  38. Florea, L.J.; Vacher, H.L. Springflow hydrographs: Eogenetic vs. telogenetic karst. Groundwater 2006, 44, 352–361. [Google Scholar] [CrossRef]
  39. Vega, J.J. A Geochemical and Statistical Investigation of the Big Four Springs Region in Southern Missouri. Master’s Thesis, Missouri State University, Springfield, MO, USA, 2020. [Google Scholar]
  40. Owen, A.R.; Pavlowsky, R.T. Base flow hydrology and water quality of an Ozarks spring and associated recharge area, southern Missouri, USA. Environ. Earth Sci. 2011, 64, 169–183. [Google Scholar] [CrossRef]
  41. Vineyard, J.D.; Feder, G.L. Springs of Missouri; Water Resources Report Number 29; Missouri Division of Geology and Land Survey: Rolla, MO, USA, 1974. [Google Scholar]
  42. Weary, D.J.; Orndorff, R.C. Geologic context of large karst springs and caves in the Ozark National Scenic Riverways, Missouri. In U.S. Geological Survey Karst Interest Group Proceedings, San Antonio, TX, USA, 16–18 May 2017; Kuniansky, E.L., Spangler, L.E., Eds.; Scientific-Investigations Report 2017-5023; U.S. Geological Survey: Reston, VA, USA, 2017; pp. 135–146. [Google Scholar]
  43. Missouri Spatial Data Information Service. The Missouri Map. Available online: https://arcg.is/1XznKW (accessed on 3 May 2022).
  44. National Water Information System. Available online: https://waterdata.usgs.gov/nwis/inventory (accessed on 30 March 2022).
  45. cli-MATE: MRCC Application Tools Environment. Available online: https://mrcc.purdue.edu/CLIMATE/ (accessed on 30 March 2022).
  46. Lim, K.J.; Engel, B.A.; Tang, Z.; Choi, J.; Kim, K.S.; Muthukrishnan, S.; Tripathy, D. Automated Web-based Hydrograph Analysis Tool, WHAT. J. Am. Water Resour. Assoc. 2005, 41, 1407–1416. [Google Scholar] [CrossRef]
  47. Eckhardt, K. How to construct recursive digital filters for baseflow separation. Hydrol. Process. 2005, 19, 507–515. [Google Scholar] [CrossRef]
  48. Larocque, M.; Mangin, A.; Razack, M.; Banton, O. Contribution of correlation and spectral analyses to the regional study of a large karst aquifer. J. Hydrol. 1998, 205, 217–231. [Google Scholar] [CrossRef]
  49. Herman, E.K.; Toran, L.; White, W.B. Quantifying the place of karst aquifers in the groundwater to surface water continuum: A time series analysis of storm behavior in Pennsylvania water resources. J. Hydrol. 2009, 376, 307–317. [Google Scholar] [CrossRef]
  50. Liu, L.; Chen, X.; Xu, G.; Shu, L. Use of hydrologic time-series data for identification of hydrodynamic function and behavior in a karstic water system in China. Hydrogeol. J. 2011, 19, 1577–1585. [Google Scholar] [CrossRef]
  51. VanderPlas, J. Understanding the Lomb-Scargle periodogram. Astrophys. J. Suppl. Ser. 2018, 236, 16. [Google Scholar] [CrossRef]
  52. Panagopoulos, G.; Lambrakis, N. The contribution of time series analysis to the study of the hydrodynamic characteristics of the karst system: Application on two typical karst aquifers of Greece. J. Hydrol. 2006, 329, 368–376. [Google Scholar] [CrossRef]
  53. Kurniawan, I.A.; Adji, T.N.; Nurkholis, A.; Haryono, E.; Fatoni, H.; Waskito, W.A.; Cahyadi, A.; Agniy, R.F. Karst aquifer response by time series analysis applications in Jonggrangan karst, Java Island, Indonesia. Environ. Earth Sci. 2019, 78, 379. [Google Scholar] [CrossRef]
  54. R Core Team. R: A Language and Environment for Statistical Computing, version 3.3.1; R Foundation for Statistical Computing: Vienna, Austria, 2019. [Google Scholar]
  55. Mayowa, O.O.; Pour, S.H.; Shahid, S.; Mohsenipour, M.; Harun, S.B.; Heryansyah, A.; Tarmizi, I. Trends in rainfall and rainfall-related extremes in the east coast of peninsular Malaysia. J. Earth Syst. Sci. 2015, 124, 1609–1622. [Google Scholar] [CrossRef] [Green Version]
  56. Jia, Z.; Zang, H.; Zheng, X.; Xu, Y. Climate change and its influence on the karst groundwater recharge in the Jinci Spring region, northern China. Water 2017, 9, 267. [Google Scholar] [CrossRef] [Green Version]
  57. Von Storch, H. Misuses of statistical analysis in climate research. In Analysis of Climate Variability: Application of Statistical Techniques; Von Storch, H., Navarra, A., Eds.; Springer: New York, NY, USA, 1995; pp. 11–26. [Google Scholar]
  58. Chen, X.; Gelder, V. Detecting changes in extreme precipitation and extreme streamflow in the Dongjiang River Basin in southern China. Hydrol. Earth Syst. Sci. 2008, 12, 207–221. [Google Scholar] [CrossRef] [Green Version]
  59. Razavi, S.; Vogel, R. Prewhitening of hydroclimatic time series? Implication for inferred change and variability across time scales. J. Hydrol. 2018, 557, 109–115. [Google Scholar] [CrossRef]
  60. Collischonn, W.; Fan, F.M. Defining parameters for Eckhardt’s digital baseflow filter. Hydrol. Process. 2013, 27, 2614–2622. [Google Scholar] [CrossRef]
  61. Sloto, R.A.; Krause, M.Y. HYSEP: A Computer Program for Streamflow Hydrograph Separation and Analysis; U.S. Geological Survey Water-Resources Investigations Report 96-4040; U.S. Geological Survey: Lemoyne, PA, USA, 1996. [Google Scholar]
  62. Paiva, I.; Cunha, L. Characterization of the hydrodynamic functioning of the Degracias-Sicó Karst Aquifer, Portugal. Hydrogeol. J. 2020, 28, 2613–2629. [Google Scholar] [CrossRef]
  63. Pavlowsky, R.T.; Owen, M.R.; Bradley, R.A. Historical Rainfall Analysis for the Big Barren Creek Watershed, Southeast Missouri (1955–2015); Report EDR-16-001; Ozarks Environmental and Water Resources Institute, Missouri State University: Springfield, MO, USA, 2016. [Google Scholar]
Figure 1. Map of state of Missouri showing physiographic regions and monitoring sites.
Hydrology 09 00096 g001
Figure 2. Hydrostratigraphic column showing Ozark aquifer and underlying confining unit; 1.00 ft = 0.305 m. Adapted with permission from Ref. [39]. Copyright 2020, Jordan Vega.
Hydrology 09 00096 g002
Figure 3. Separation of flow components for Bennett Spring over different time intervals using WHAT.
Hydrology 09 00096 g003
Figure 4. Separation of flow components for Big Spring over different time intervals using WHAT.
Hydrology 09 00096 g004
Figure 5. Separation of flow components for Greer Spring using WHAT.
Hydrology 09 00096 g005
Figure 6. Autocorrelation plots for the studied springs for 1928–1941, 1965–1995, and 2007–2019. The horizontal black dashed line at rk = 0.2 indicates the white noise threshold. The horizontal blue dashed lines represent the statistical significance at 95% of confidence intervals.
Hydrology 09 00096 g006
Figure 7. Lomb–Scargle periodograms for the studied springs for 1928–1941, 1965–1995, and 2007–2019. The horizontal dashed line represents the power spectrum (=15) above which the slope breaks (i.e., periodicities) are significant.
Hydrology 09 00096 g007
Figure 8. Cross-correlation plots for rainfall at adjoining stations and discharge at the studied springs for different time intervals. The horizontal blue dashed lines represent the statistical significance at 95% of confidence intervals.
Hydrology 09 00096 g008
Figure 9. Cross-correlation plots for rainfall at adjoining stations and discharge at the studied springs for 2007–2019. The horizontal blue dashed lines represent the statistical significance at 95% of confidence intervals.
Hydrology 09 00096 g009
Figure 10. Cross-correlation plots for rainfall at West Plains and discharge at Big and Greer springs for 1928–1996 and 2000–2019, respectively. The horizontal blue dashed lines represent the statistical significance at 95% of confidence intervals.
Hydrology 09 00096 g010
Table 1. Sources of data used in the study. Note that annual data gaps exist for all sites except Greer Spring. Elevation in m above sea level. Discharge data are taken from [44] and precipitation data from [45].
SiteData TypeSite NumberElevation (m)Period of Record
Bennett SpringDischarge69235002641928–2019
Big SpringDischarge70675001311921–2019
Greer SpringDischarge70710001721921–2019
Lebanon 2WPrecipitation2348253801892–2019
Van Buren 1 NEPrecipitation2385691511937–2006
Van Buren 7.2 SWPrecipitationUS1MOFSA0351992001–2019
AltonPrecipitation2301272481940–2019
West PlainsPrecipitation238803371948–2019
Table 2. Summary statistics for discharge, stormflow, and baseflow (in m3/s) for studied springs.
Bennett Spring
1928–1941 (n = 4748 days)MeanStd. ErrorMedianMax.Min.
Discharge4.300.053.4373.11.6
Surface Runoff0.380.020.1141.10
Baseflow3.920.043.2837.71.6
1965–1995 (n = 10,957 days)MeanStd. ErrorMedianMax.Min.
Discharge5.560.044.331802.1
Surface Runoff0.470.020.111230
Baseflow5.090.034.1756.32.0
2007–2019 (n = 4383 days)MeanStd. ErrorMedianMax.Min.
Discharge5.390.074.1088.62.1
Surface Runoff0.460.030.1050.60
Baseflow4.930.053.9537.91.2
Big Spring
1921–1996 (n = 27,394 days)MeanStd. ErrorMedianMax.Min.
Discharge12.70.0311.256.66.68
Surface Runoff0.950.010.5832.30
Baseflow11.70.0210.534.74.81
2000–2019 (n = 6939 days)MeanStd. ErrorMedianMax.Min.
Discharge13.30.0512.237.97.22
Surface Runoff0.740.010.4417.60
Baseflow12.60.0511.733.74.12
Greer Spring
1921–2019 (n = 35,794 days)MeanStd. ErrorMedianMax.Min.
Discharge9.910.029.4228.92.94
Surface Runoff1.390.011.0319.80
Baseflow8.520.028.1821.42.57
Table 3. Summary of Mann–Kendall trend test of the discharge for studied springs and rainfall. Kendall tau, Z-values, and Sen’s slope values represent means for each time series. Z-value and Sen’s slope were not calculated for Greer Spring for 1921–2019 time series because of the large number of data points. * indicates no statistical significance at a 95% confidence interval.
Variable (Time Interval)SpringKendall tauZ-ValueSen’s Slopep-Value
Discharge (1965–1995)Bennett0.22234.70.009<0.001
Big0.12219.20.008<0.001
Greer0.12920.20.009<0.001
Discharge (1928–1996)Big0.12219.20.007<0.001
Discharge (1921–2019)Greer0.096--<0.001
Discharge (2007–2019)Bennett−0.115−11.3−0.005<0.001
Big0.0161.590.0020.11 *
Greer0.022.040.010.04
Variable (Time Interval)StationKendall tauZ-ValueSen’s Slopep-Value
Precipitation (1960–1983)Van Buren0.0254.830.0001<0.001
Precipitation (1965–1995)Lebanon−0.015−2.940.00004<0.001
Precipitation (1928–1996)West Plains0.0081.470.00010.14 *
Precipitation (2000–2019)West Plains−0.006−9.01−0.0000040.36 *
Precipitation (2007–2019)Lebanon−0.023−2.58−0.00040.009
Van Buren0.0141.74−0.000030.08 *
Alton0.0678.010.0003<0.001
Publisher’s Note: MDPI stays neutral with regard to jurisdictional claims in published maps and institutional affiliations.

