1. Introduction
Numerous measurement data have been obtained at various layers, such as gene expression, protein, metabolites, and so on. In addition, in metabolic simulations using genome-scale metabolic models (GSMs) for metabolism, there is a growing research effort in developing simulations and analysis methods using omics data and in improving prediction accuracy based on these results [
1,
2,
3,
4].
In addition, the mass isotope
13C labeling data [
5,
6,
7,
8,
9,
10], metabolome data [
1] by LC-MS, and other methods were also used to predict and estimate intracellular metabolic states in previous studies. However, it was still a time-consuming and labor-intensive process to reacquire, simulate, and analyze omics data every time the culture medium composition, culture conditions, or target organisms or strains changed. The more accurate and comprehensive the available data was, the better the prediction accuracy through simulation and analysis, but it was not known how much data was useful for the purpose or how much the prediction accuracy could be improved.
One such previous study was a patent that uses L-lysin production as an example [
11]. In this method, the fluxes important for L-lysin production were predicted by (1) elementary mode analysis [
12], which was very computationally demanding, and (2) selection of independent metabolic fluxes (called free fluxes) equal to the number of degrees of freedom in the stoichiometric matrix [
13], generation of their combinations, and application to metabolic models. However, the GS, a commonly used metabolic model for metabolic simulation, was a very large model in terms of both the number of constituent metabolites and metabolic reactions. Therefore, it was difficult to apply elementary mode analysis due to the limitation of computational costs. Similarly, the method that used the same number of free fluxes as the stoichiometric matrix was difficult to apply in a large-scale model, such as the GSM because the degrees of freedom were very high. Furthermore, it was very difficult to obtain the solution space and its bounds analytically in GSM.
Therefore, in this study, we aimed to propose a search for fluxes and their combinations/numbers that were important for predicting metabolic flux distributions based on simulation using GSM, in view of the labor savings of experimental measurements. Flux sampling is used to obtain the candidate solutions (flux distribution) necessary for this purpose [
14]. Flux sampling was a method of sampling a set of possible solutions from the solution space defined by GSM. Algorithms, such as ACHR (the artificially centered hit-and-run) [
15], CHRR (the coordinate hit-and-run with rounding) [
16], and OptGP (the optimized general parallel) [
17], have been implemented, including flux balance analysis (FBA) [
18] to find the optimal value for the objective function and flux variability analysis (FVA) [
19], which found the range of possible fluxes for an objective function [
20,
21], which was used to compare and analyze GSMs and metabolic differences due to strain characteristics and conditions, such as correlations between fluxes that could not be determined by these methods alone [
20,
21]. In this study, OptGP [
17], which supports parallelization, was used as the flux sampling algorithm. As a case study, acetic acid production from glucose in
Escherichia coli was assumed, and iJO1366 [
22] was used as the GSM. A comparison of flux sampling results under default conditions [
14] with experimental fluxes for substrates, growth, and products suggested that flux sampling under default conditions might not be sufficient to cover the range obtained experimentally for these fluxes. Therefore, the utility of flux sampling was tested by constraining the representative fluxes for substrate, growth, and products to allow for sufficient variation. The flux sampling results were then analyzed to identify the variables important for estimating flux distributions and estimating the number of variables needed. The flux distribution extracted from the flux sampling results using the values of important variables was compared with the
13C-MFA results [
5] and compared with the flux distribution of the central carbon metabolic pathway. This suggested that the modified flux sampling method used in this study was useful for predicting flux distributions, extracting key variables for this purpose, and estimating the number of necessary variables.
2. Materials and Methods
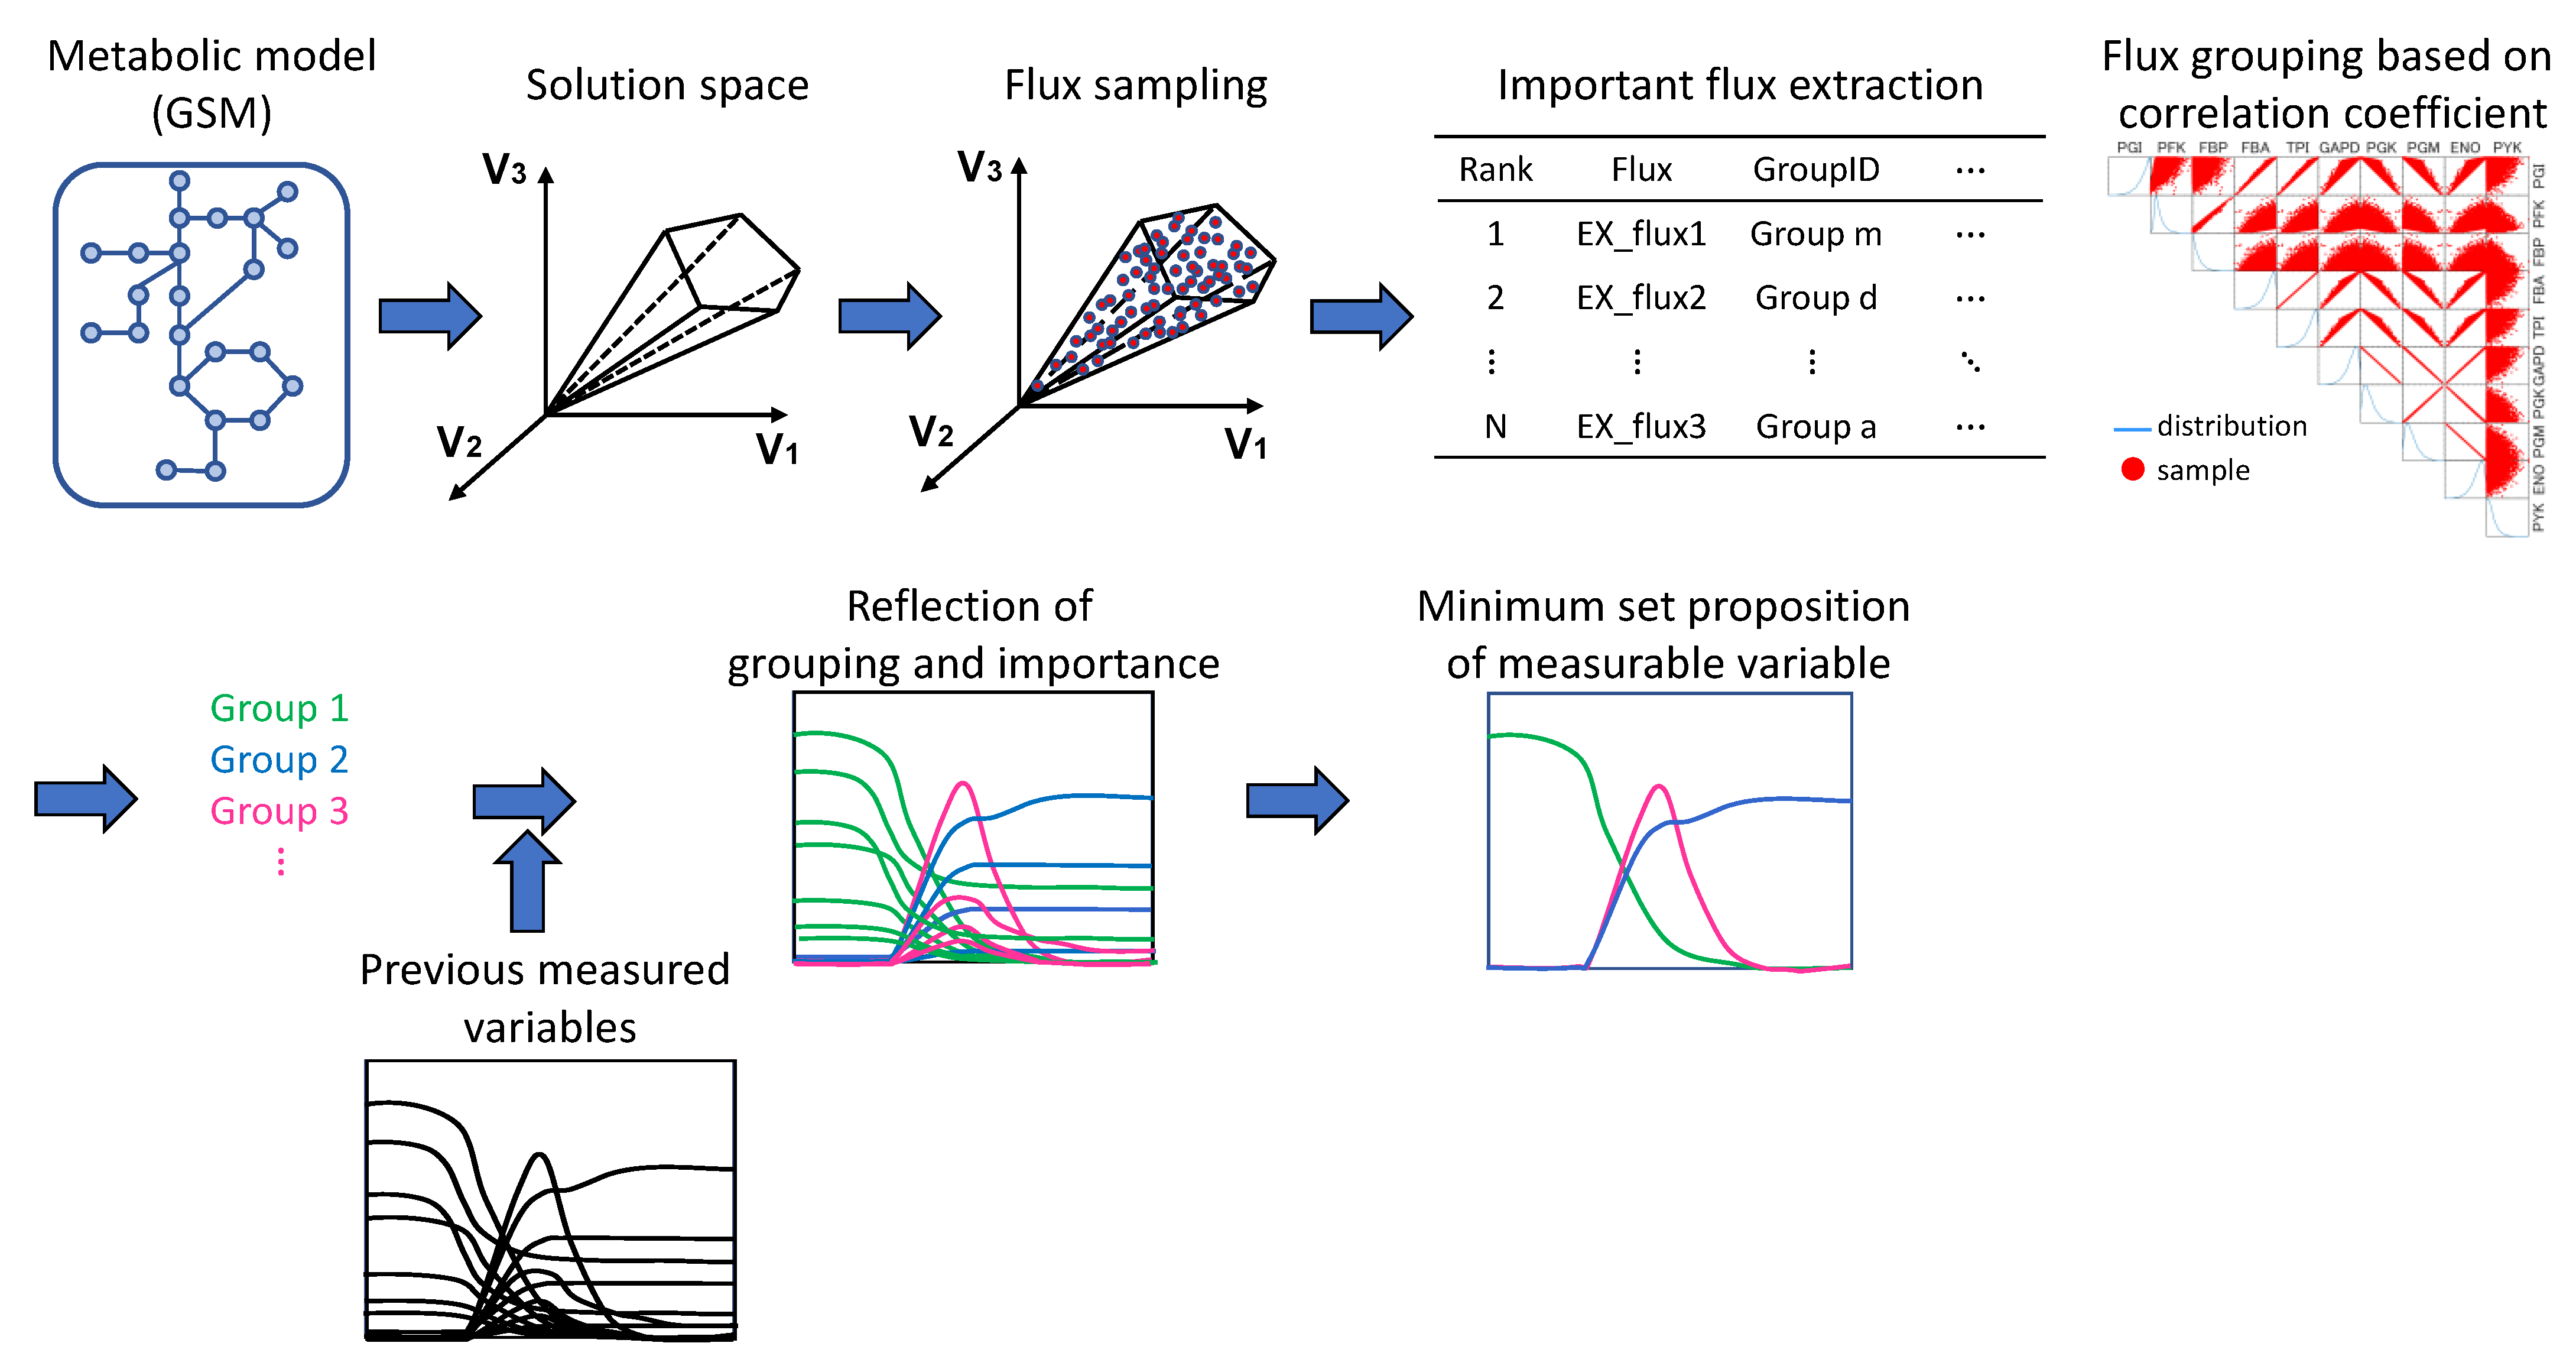
The workflow of the simulation and analysis, using the metabolic model as a starting point, is shown in
Figure 1.
2.1. Metabolic Model
As a test case, a culture of
E. coli with acetic acid production using glucose as the carbon source was used. The metabolic model used was the
E. coli GSM iJO1366 [
22].
2.2. Flux Sampling
ACHR [
15], CHRR [
16], and OptGP [
17], which were commonly used algorithms in flux sampling, were based on a hit-and-run (HR) algorithm. These algorithms performed the next sampling based on the information from the current sampling (current sample, search direction, step size). In the HR algorithm, direction and step size were randomly chosen, iteratively [
17]. ACHR algorithm was tailored to sample in the elongated direction of the solution space [
15]. With OptGP, more sampling was performed by setting multiple starting points for sampling in ACHR and parallelizing them [
17]. On the other hand, it has been suggested that the sampling performance of the HR-based algorithms, including ACHR and OptGP, was greatly affected by the nonuniform shape of solution space [
16]. Therefore, CHRR performed faster and more efficient sampling than ACHR by uniformly rounding the solution space [
16]. Previous studies have compared the performance of these algorithms, and the results suggested CHRR as the best flux sampling algorithm [
14]. However, in CHRR, empirically, when there were multiple fluxes with a very narrow range that could be taken in a large-scale GSM, there were cases where the first rounding of solution space did not go well, and the flux sampling could not proceed. On the other hand, with ACHR and OptGP, flux sampling was possible even with GSMs that did not work well when CHRR was applied (including the
E. coli GSM iJO1366 used in this study). Therefore, we thought that ACHR and OptGP would be more useful than CHRR in terms of flux sampling in a wider range of GSMs. As a result, we decided to use OptGP [
17], as implemented in COBRApy [
23], as the flux sampling algorithm.
Flux sampling was compared to the default OptGP, which used the GSM, and OptGP, which ensured sufficient variation in fluxes such as substrates, products, and growth, which were important as phenotypes.
For the default OptGP, flux sampling was performed with the following parameters (thinning = 10,000, sample number = 20,000, and process = 10). For the latter implementation, 1000 patterns of flux value sets were generated using FBA within the range of these three fluxes to ensure sufficient variation to cover the experimentally measured data for the phenotypically important substrate, product, and growth fluxes. First, the specific uptake flux values for the carbon source, glucose, were generated uniformly at random over the predefined range based on experimental data. Next, the specific uptake flux of glucose was fixed at the generated value, and FBA was performed with the objective functions of maximizing and minimizing the specific growth rate for each specific glucose uptake flux, respectively. In this way, the possible range of the specific growth rate was set between the minimum and maximum values of the flux for each glucose uptake condition. The specific growth rate values were randomly selected within each set range. Finally, using the two flux values generated and selected above as constraints, FBA was performed with the objective function of maximizing and minimizing the specific acetic acid production flux, respectively. The possible ranges of specific acetic acid production flux values were similarly set, and those flux values were randomly selected within those ranges. These values were then used as constraints for flux sampling, and sequential flux sampling was performed by OptGP for each constraint (sample number per a flux constraint = 20; other parameters, such as thinning and total number of samples, were the same as the default OptGP shown above).
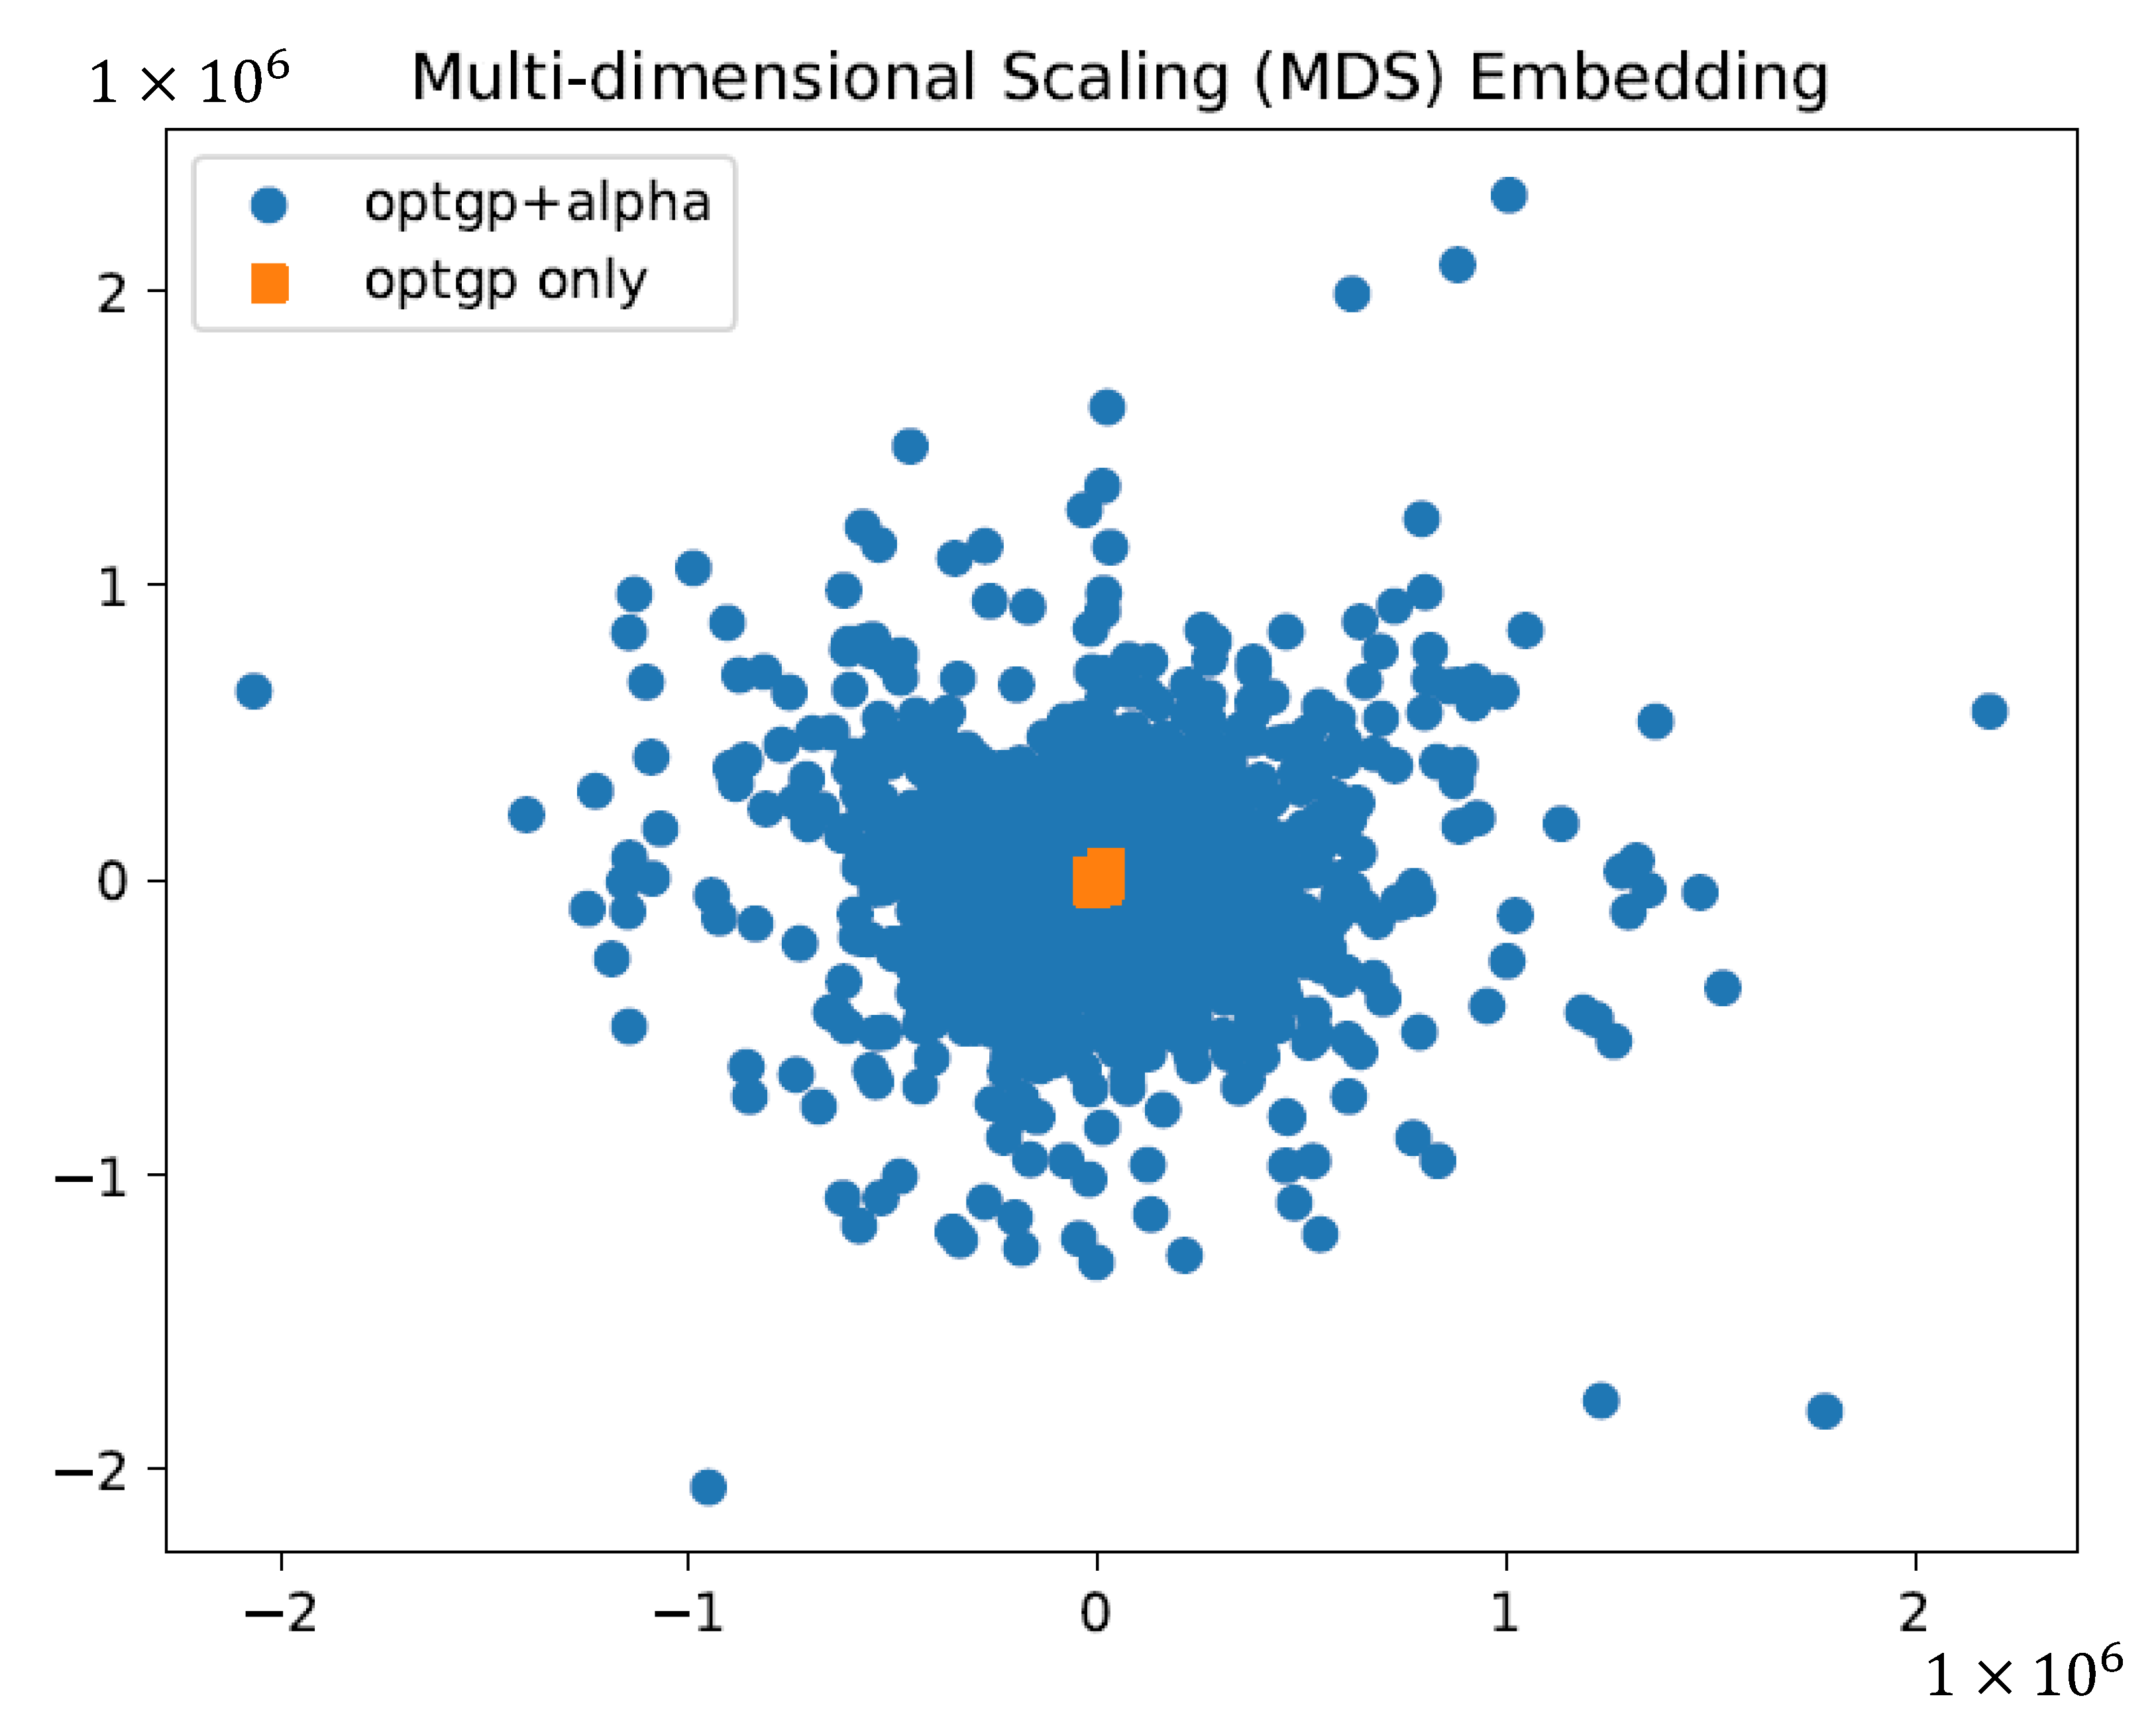
2.3. Verification of the Effect of Using Constraints on Sampling by Dimensional Compression
To verify whether it was important to ensure variations in flux values for substrates, growth, and products, which were important for phenotyping, samples (solution sets) obtained in the same way except with and without the use of constraints were visualized and compared on a two-dimensional plane using multidimensional scaling (MDS) [
24].
2.4. Search and Evaluation of Fluxes and Combinations of Fluxes Important for Metabolic Flux Distribution Prediction
The search for fluxes important for flux distribution prediction was conducted by (1) selecting any flux and its value, (2) using the selected flux value (±10%) as a query, extracting samples that met the conditions from the generated samples, (3) performing steps (1)–(2) exhaustively for all fluxes and their values, (4) ranking the fluxes based on the average number of samples hit, and (5) considering the fluxes with the highest ranking as important fluxes for the prediction of flux distribution. In the search for important fluxes, since it was difficult to measure intracellular fluxes with high precision, the fluxes taken up from and discharged into the culture medium, which were relatively easy to measure, were targeted here.
On the other hand, the number of fluxes needed to predict flux distribution was estimated from the flux sampling results. Since the number of metabolic fluxes in metabolic models such as the GSM was very large, grouping by correlation among fluxes was used to narrow the number. The samples (flux distributions) obtained by flux sampling were used to determine the correlation coefficient for each flux pair for all fluxes in the metabolic model, and the fluxes were grouped using an absolute value of 0.95 as the threshold value. Using these results, the following procedure was used to estimate the number of fluxes needed to predict the flux distribution. (1) Randomly select one flux from each group obtained from the grouping based on the correlation coefficient. (2) Randomly select one solution from the samples (flux distributions) obtained by flux sampling. (3) Using those values as a query in random order, the solutions were narrowed down from the samples step by step. (4) This was performed for all samples to obtain the minimum number of fluxes required to narrow the solution down to one. (5) (1)–(4) were also performed for 800 different flux combinations (permutations). (6) To estimate the number of fluxes needed to predict the flux distribution, the mean and median of the minimum number of fluxes required to narrow down to one solution in all cases performed were calculated. (7) Fluxes were sorted in descending order by mean and median, and those values were rounded down to the nearest whole number and considered as the number of fluxes needed to predict the flux distribution.
2.5. Validation of Important Flux
Since it was difficult to measure many intracellular fluxes experimentally, we used the results of
13C-based metabolic flux analysis (MFA) for validation.
13C-MFA was the method of choice for detailed inference of intracellular metabolic fluxes in cells or organisms under quasi-steady-state conditions [
25]. The carbon source was selected as glucose, and the Zhao and Shimizu [
5] literature was used for validation as one of the references from which the acetic acid production flux and the flux values predicted to be important in the previous section could be obtained.
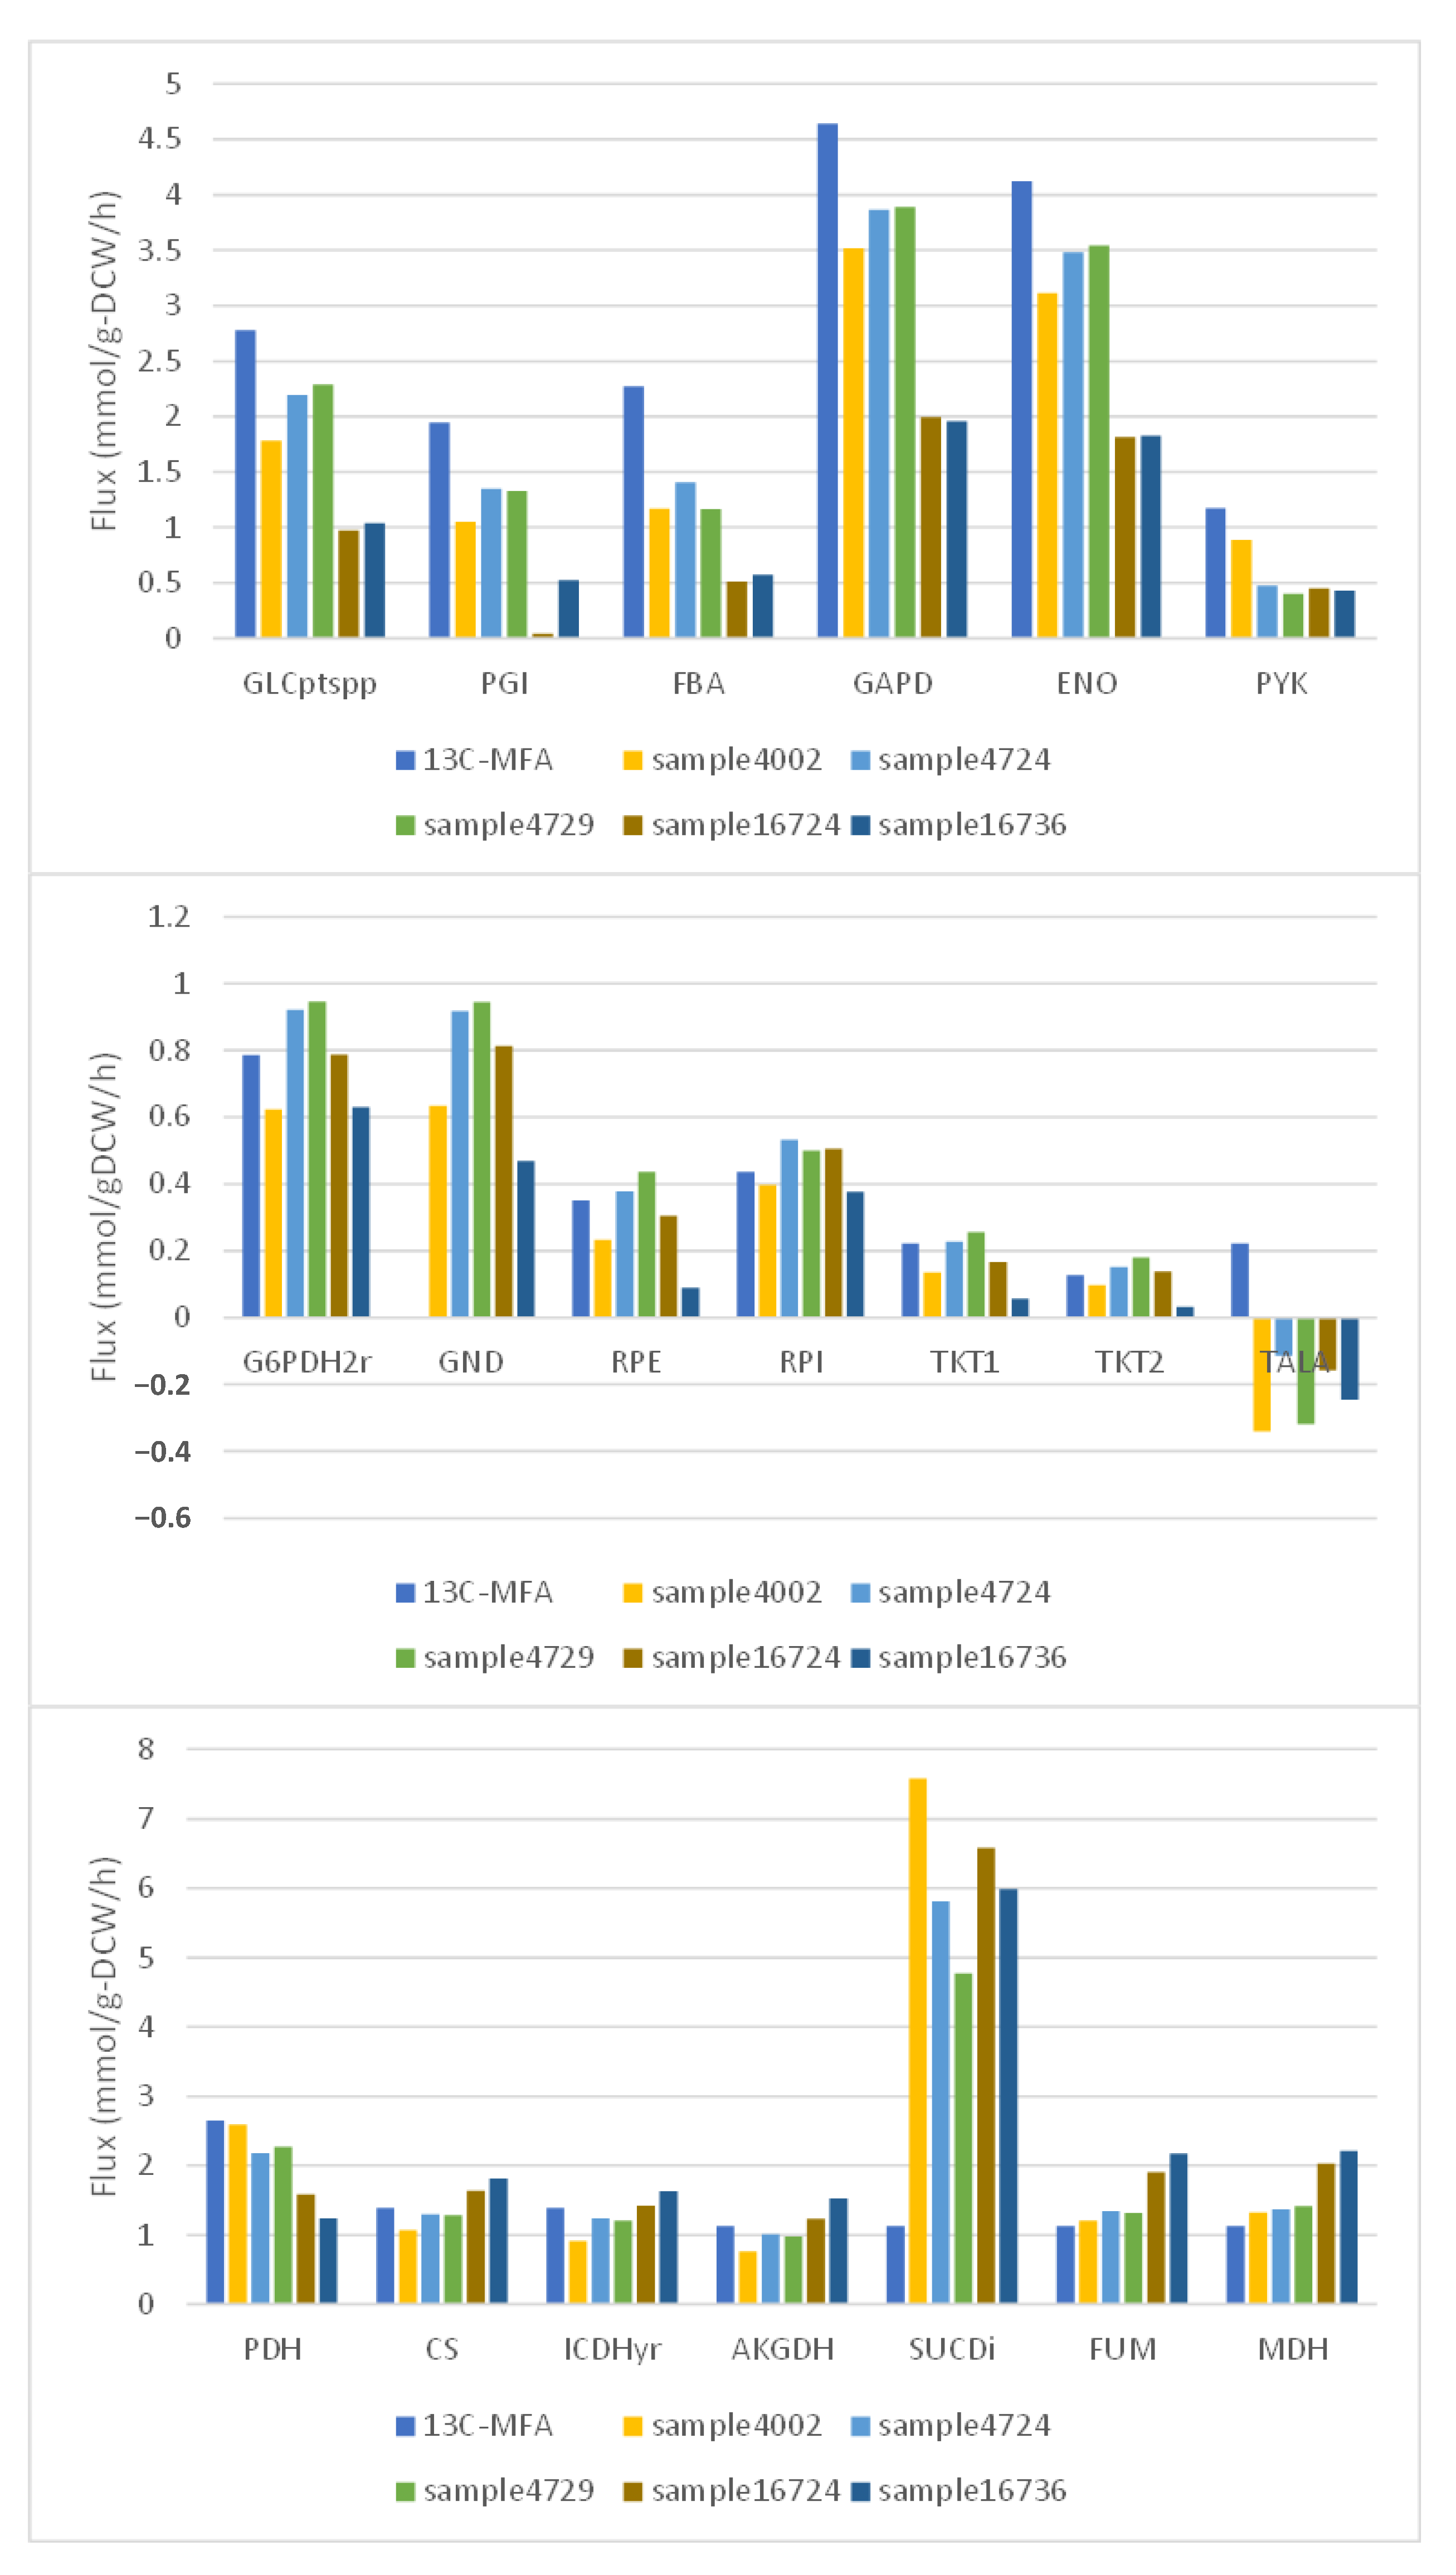
First, values were obtained from the literature for the fluxes considered important for predicting the flux distribution. We selected flux distributions, whose flux values were within ±10% of the literature values, from flux sampling results. The selected flux distributions were compared with the major flux distributions of 13C-MFA, and the samples were evaluated for validity by the mean absolute percent error of those flux values.
2.6. Computer Code and Software
In this research, all simulation and calculation were run on a server with CPU Xeon Gold 6136 (3GHz) ×2, and Memory 512GB. Also, COBRA Toolbox v3,33 (
https://github.com/opencobra/cobratoolbox.git (accessed on 4 October 2021)), MATLAB© 2018b (The MathWorks Inc., Natick, MA, USA), COBRApy v0.22.1 (
https://github.com/opencobra/cobrapy (accessed on 19 January 2022)), GLPK v5.0 (Gnu Linear Programming Kit) were used. Scripts (computer codes) were used for flux balance analysis, flux variability analysis, production envelope, flux sampling, sampling analysis, and are available at github (
https://github.com/yukuriya3/fluxsampling_for_pred (accessed on 23 April 2023)).
4. Discussion
Flux sampling was performed using acetic acid production from glucose using E. coli GSM iJO1366 as a case study.
For flux sampling, 1000 patterns of constraints were generated that ensured sufficient variability for phenotypically important substrate, product, and growth-related fluxes and were used for sampling by OptGP. Normalization of the results by specific glucose uptake flux and visualization by MDS suggested an improvement to obtain a wider and more diverse sample (
Figure 3). On the other hand, it was difficult to accurately estimate the volume of the solution space or the volume of the sampled space [
26,
27]. Therefore, it was unclear how much of the entire solution space was sampled and what was needed to improve the sampling.
Using the flux values in the sample obtained by the modified OptGP to search for and extract solutions from the entire sample allowed us to evaluate and extract fluxes (variables) that were important for estimating the flux distribution based on the number of solutions obtained. Apart from the fluxes of water, protons, and the fluxes of glucose, growth, and acetic acid, which were used as constraints, the fluxes of iron, oxygen, carbon dioxide, ammonia, and inorganic phosphate were the most important fluxes. For these fluxes, they were relatively easy to measure and were generally included in the culture on minimal media. Therefore, although the study was conducted only for
E. coli, if these fluxes could also be obtained from flux sampling results for a wide range of micro-organisms, it was expected that they might be fluxes that should be commonly measured during the culture of many micro-organisms. The results of this study also suggested that fluxes related to iron would be particularly useful in predicting flux distribution. Biologically, iron uptake affected
E. coli growth [
28,
29], while iron metabolism and homeostasis were strictly regulated [
30].
E. coli GSM iJO1366 contained iron-related fluxes, such as uptake and efflux of divalent and trivalent iron ions, biomass synthesis, iron-sulfur clusters, and multiple redox reactions. The fluxes related to iron were found to be important fluxes in this study, partly because the possible range of these fluxes was relatively larger than the other fluxes. However, whether this was due to the formation of futile cycles in the GSM or a lack of regulatory information, it was considered to require a more detailed investigation.
On the other hand, as mentioned in
Section 2.4, to estimate the number of measurement variables needed to approximately predict the metabolic flux distribution indicative of the metabolic state of the cell, we investigated the minimum number of fluxes needed to narrow the solution to one within the obtained sample. The results suggested that seven or eight fluxes were generally sufficient to estimate the flux distribution when combining flux values from different groups, based on groupings conducted based on an absolute value of correlation coefficients. Since these fluxes included data obtained by the analysis of the culture medium supernatant and gas analyses, combining variables that were relatively easy to measure would be sufficient to estimate the flux distribution.
Due to the difficulty of measuring flux values, we used the results of 13C-MFA to validate the fluxes that were important in predicting the obtained flux distributions. Flux distributions with values close to those from the flux sampling results were extracted. The obtained flux distributions were then compared with the 13C-MFA results. The resulting flux distribution had a mean absolute percentage error of approximately 54% from the closest flux distribution. This was because the fluxes of transaldolase in the pentose phosphate pathway and of succinate dehydrogenase in the TCA cycle differed significantly from the 13C-MFA results. In particular, the fluxes of succinate dehydrogenase, which differed greatly between the two, were thought to form futile cycles with other fluxes in GSM. Therefore, if the fluxes of succinate dehydrogenase were excluded, the difference between 13C-MFA and the results extracted from the flux sampling would be greatly reduced. Considering the difference between 13C-MFA in the glucose uptake flux, which was the starting point of carbon metabolism, and those in the flux sampling results, it was thought that the two central carbon metabolism fluxes were quite close. Therefore, this result suggested that the fluxes important in predicting the flux distribution obtained from the flux sampling results were valid.
OptGP flux sampling was performed under different constraints with sufficient variation to include experimentally obtained flux values for phenotypically important substrate, product, and growth fluxes. As a result, flux sampling could be carried out in a wider range than OptGP without additional constraints. In addition, although this study was limited to acetic acid production from glucose in E. coli, these results suggested that the analysis of the result obtained from flux sampling by OptGP with additional constraints could provide information about the important variables, their numbers, and combinations to predict flux distribution. This meant that, instead of performing the time-consuming and labor-intensive task of obtaining tens or hundreds of items of omics data every time the host, culture condition, or target product changed, we could predict and narrow down the variables to be measured and their numbers in advance based on simulation using GSM. In addition, by reducing the number of variables to be measured, a more accurate measurement of them could be expected. Thus, the method presented in this study was considered very useful in reducing the cost of experimental work on a simulation basis.
In the future, we will plan to combine the method presented in this study with reduced cost, which corresponds to the sensitivity analysis of FBA using GSM, to improve the method and to verify its versatility in GSMs of various micro-organisms, and investigate flux sampling under nutrient-rich culture conditions with a larger solution space.


