
Measurement of the Mapping between Intracranial EEG and fMRI Recordings in the Human Brain

 , and
, and
Abstract
1. Introduction
2. Methods
2.1. Data Acquisition
2.2. Data Processing
3. Model Comparison
4. Results
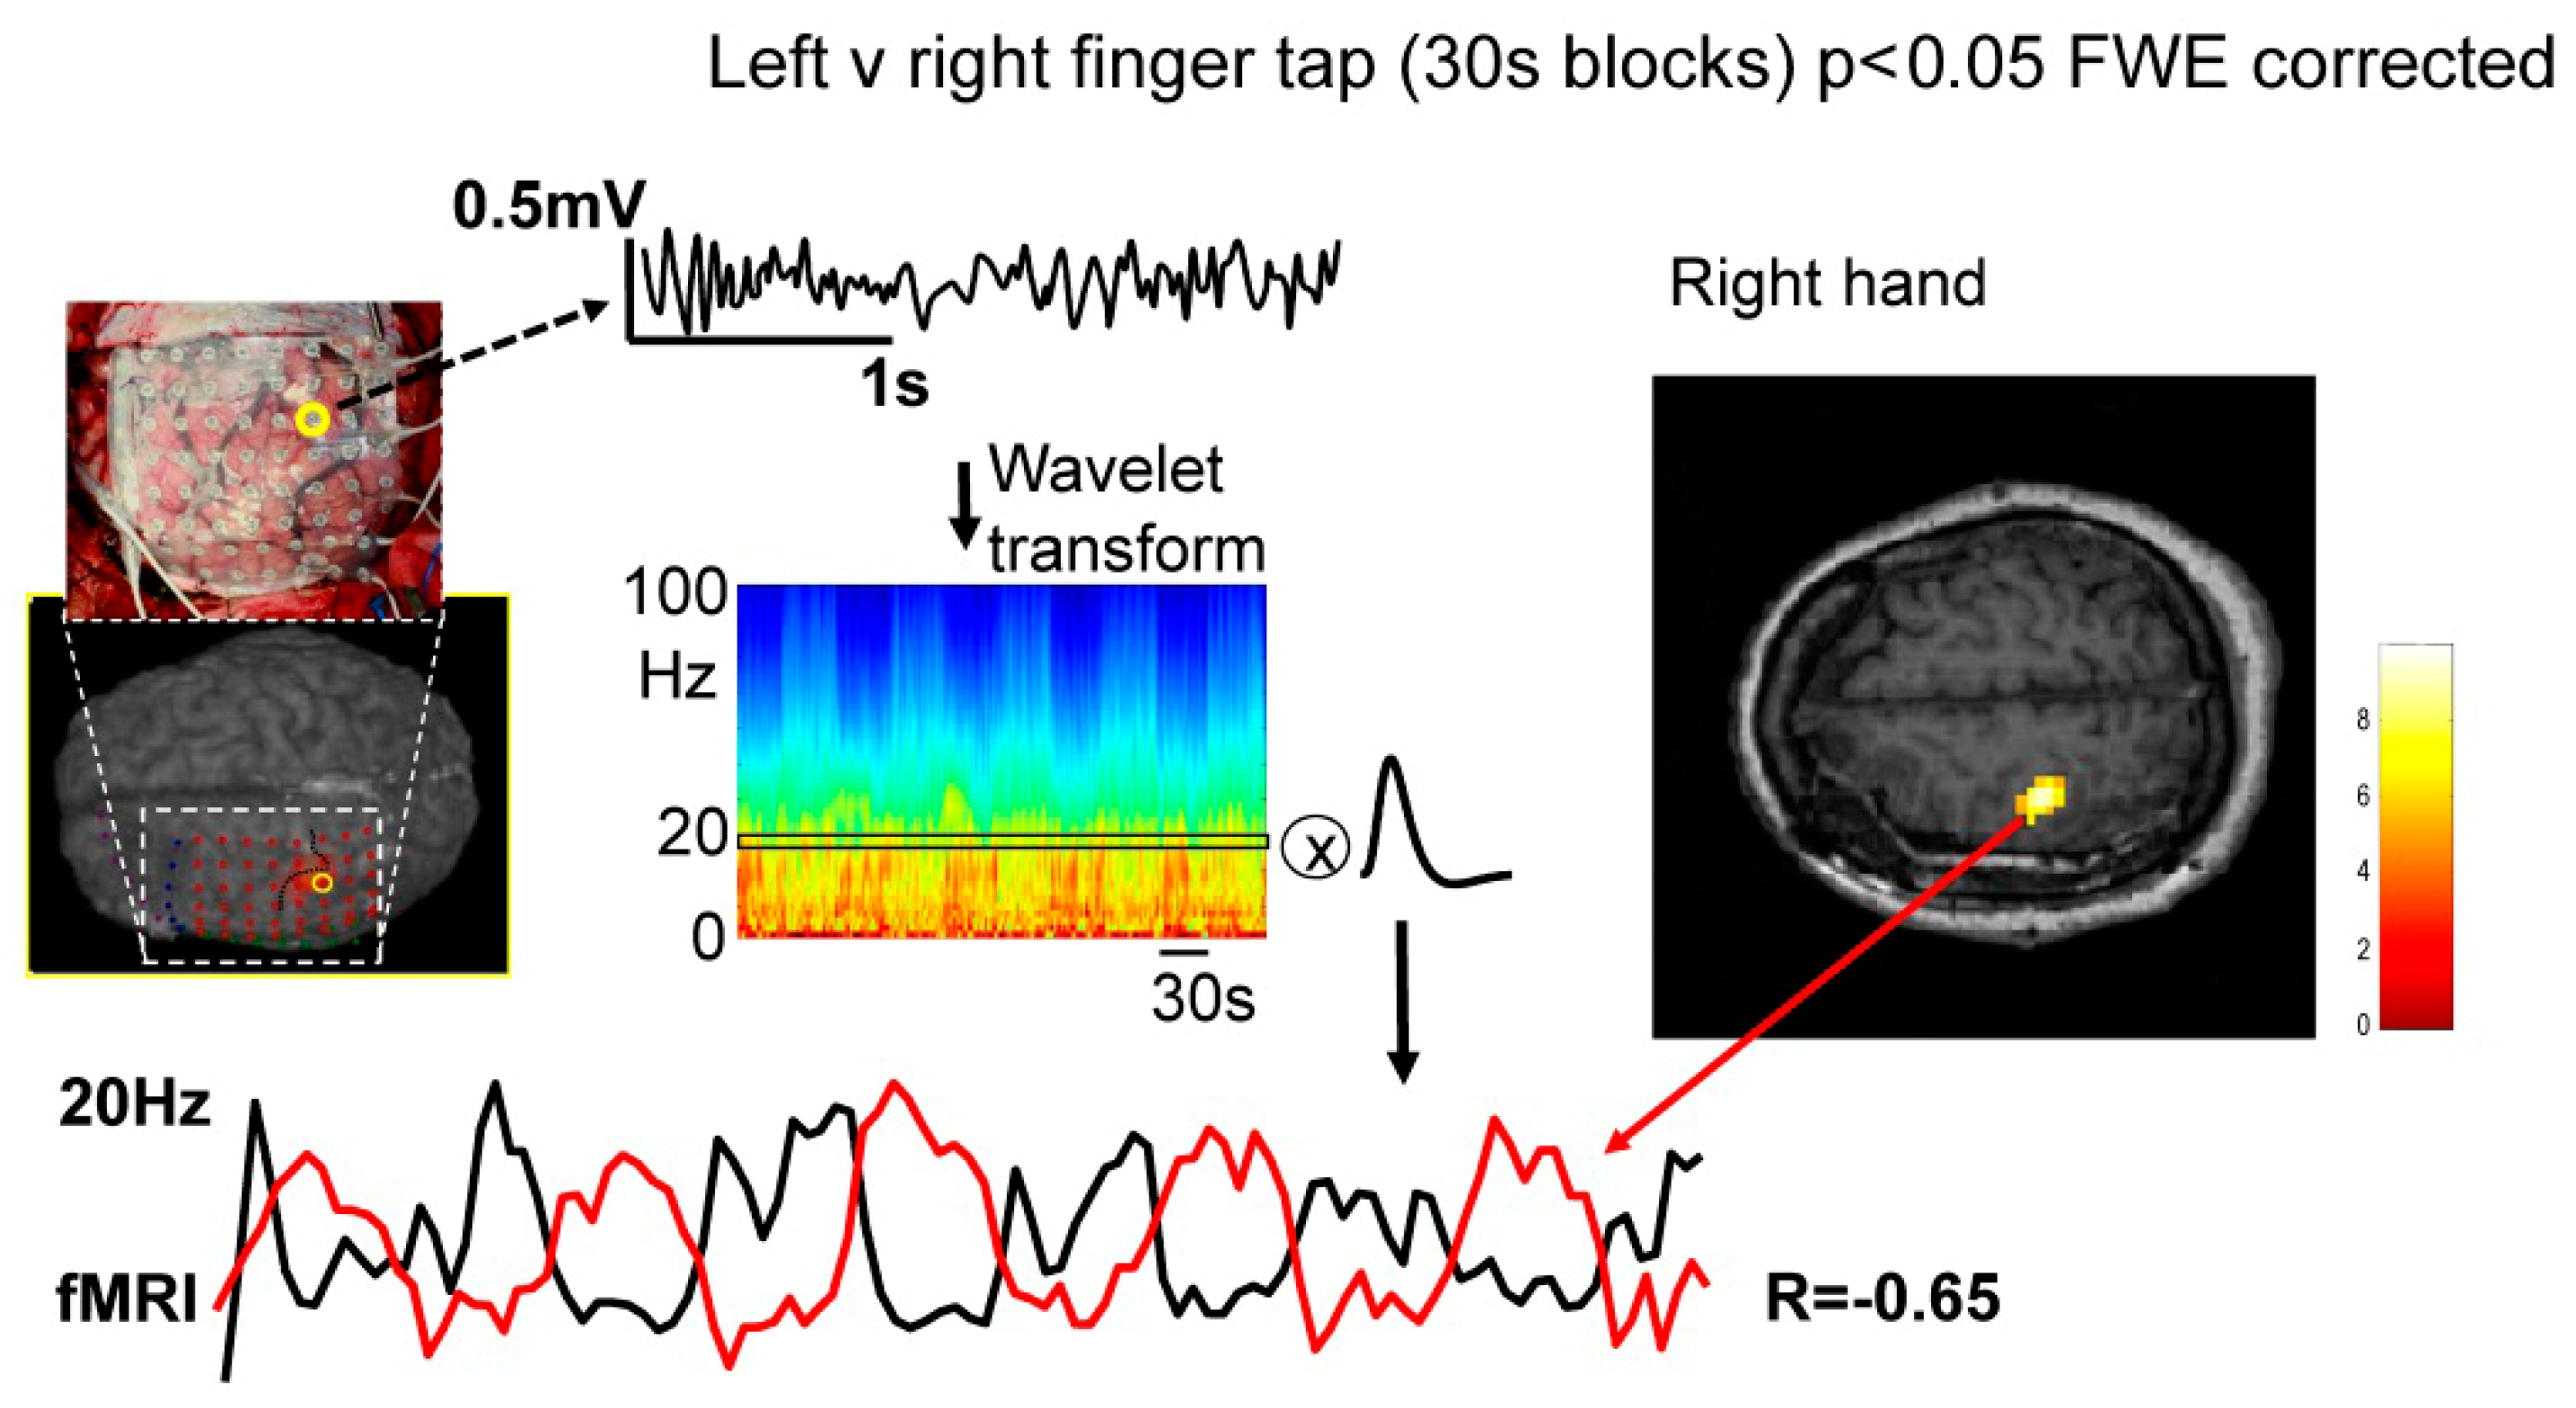
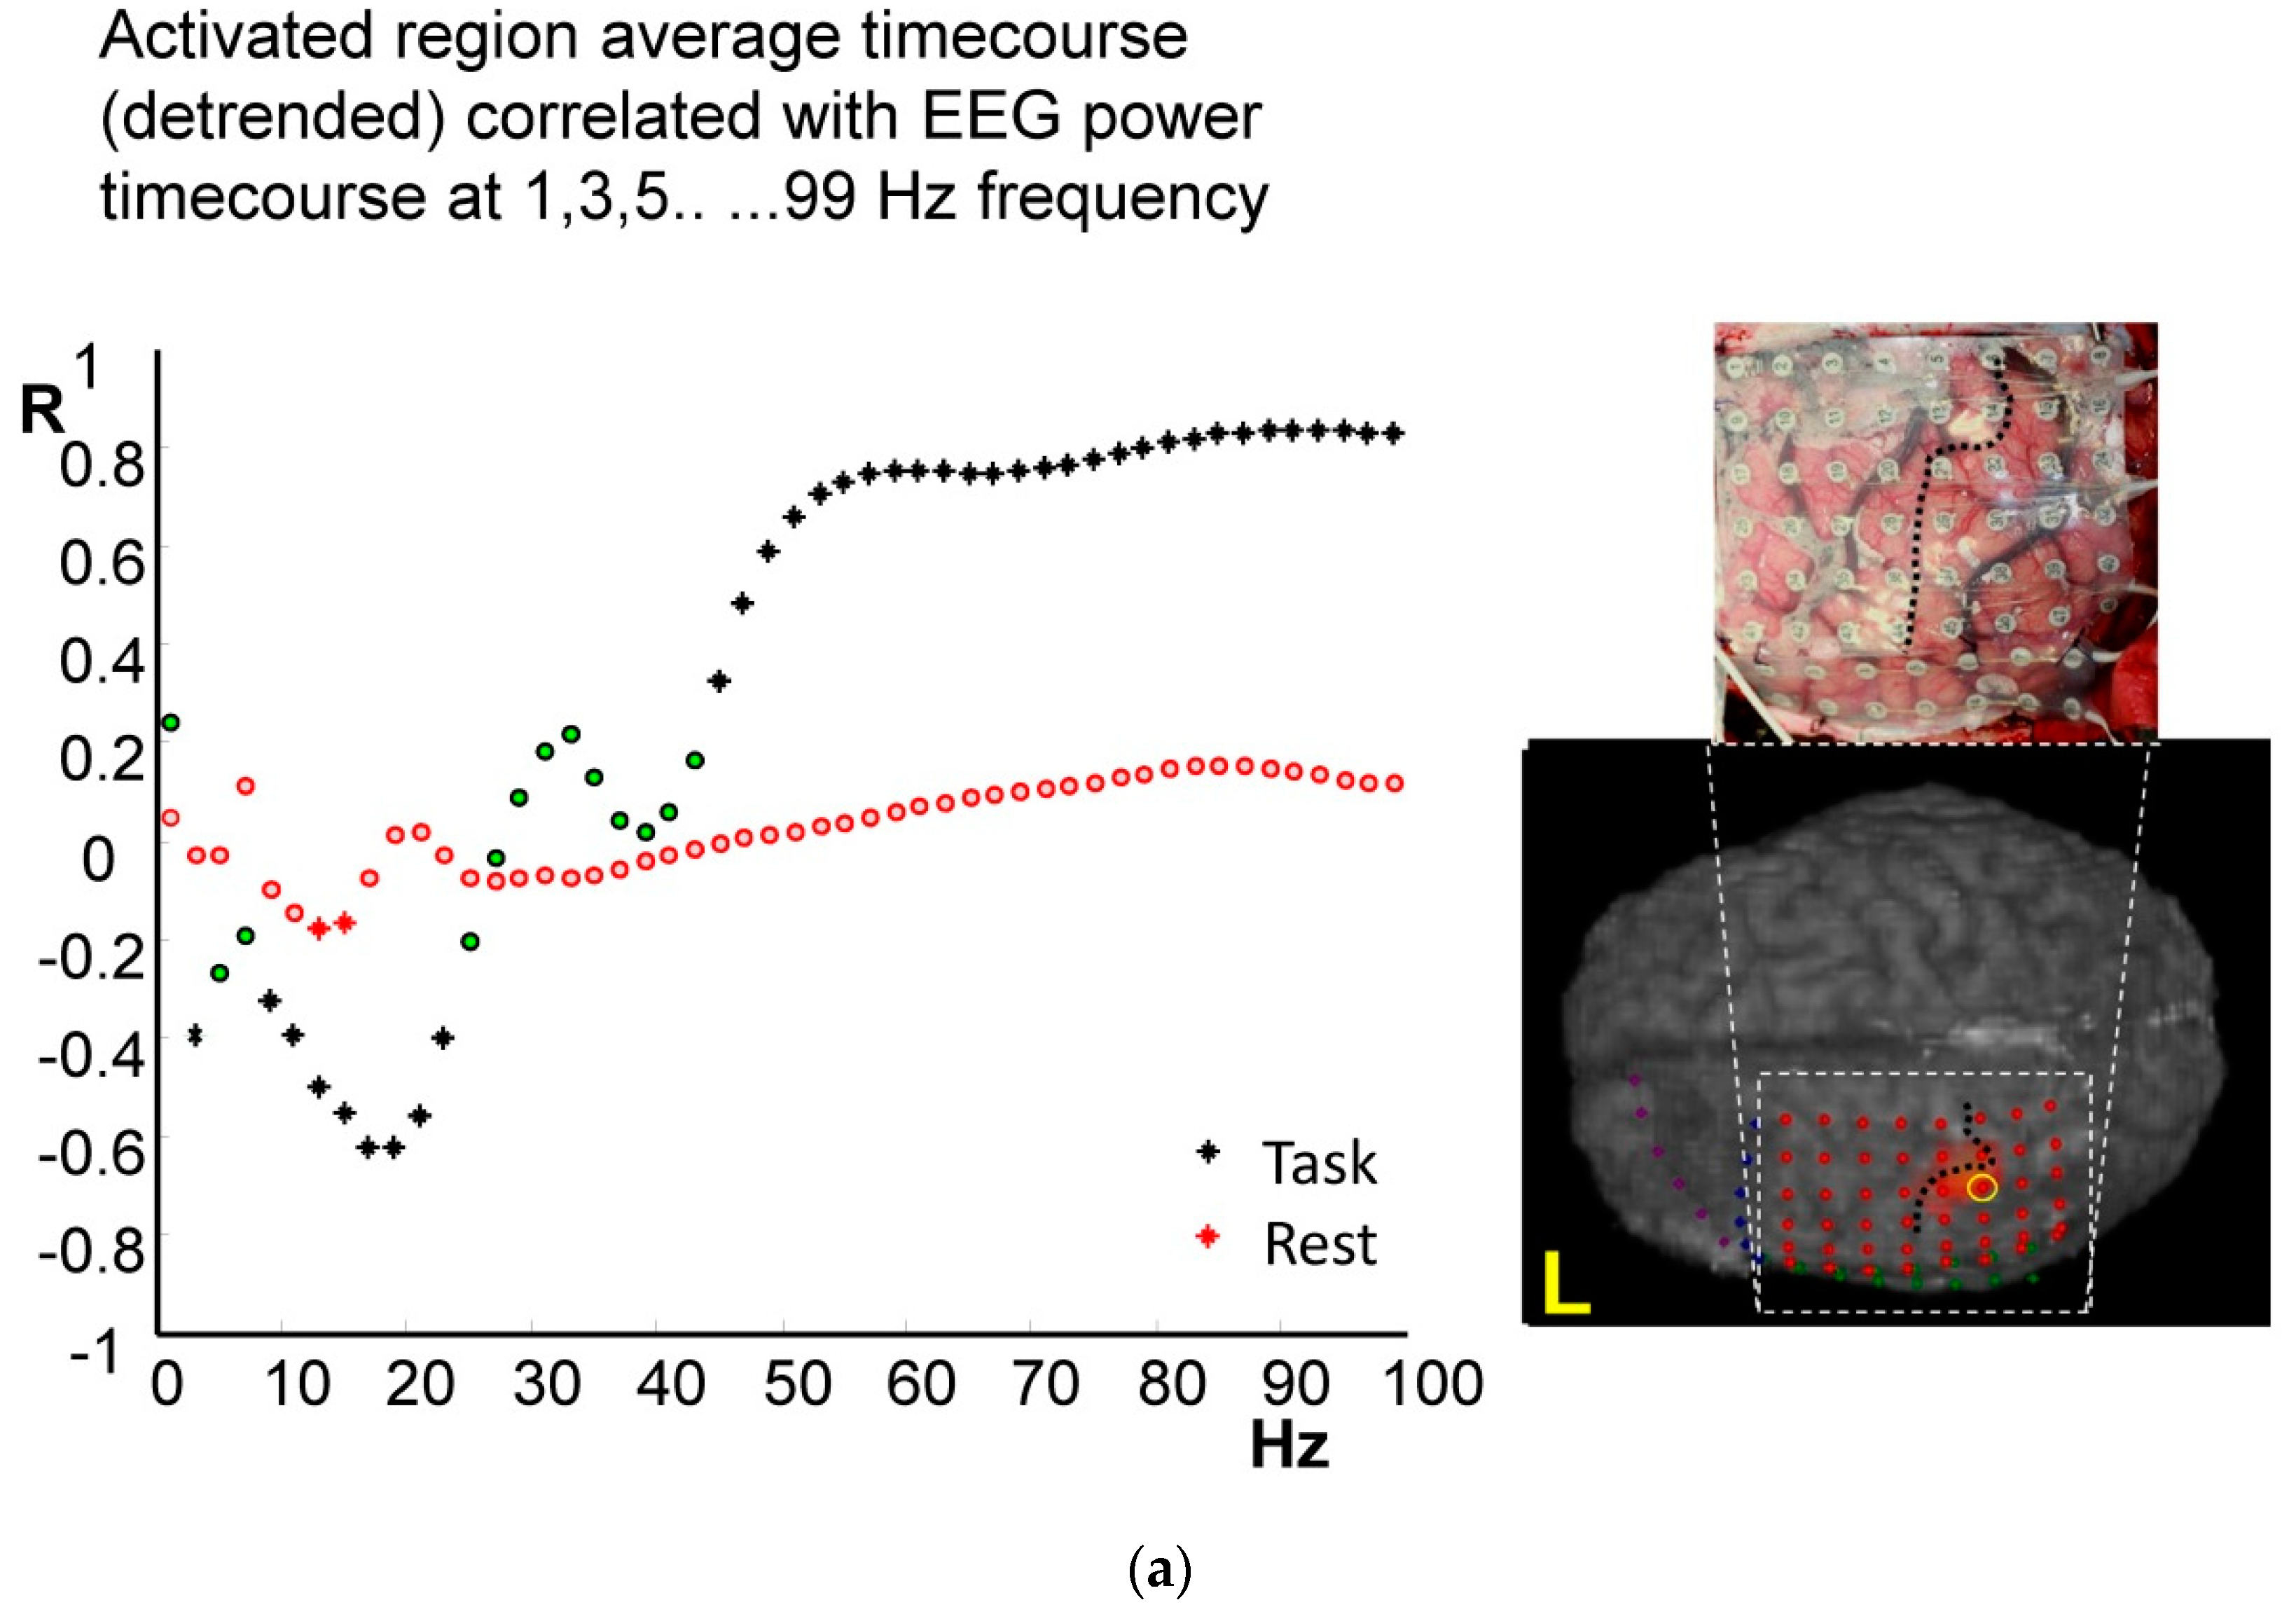
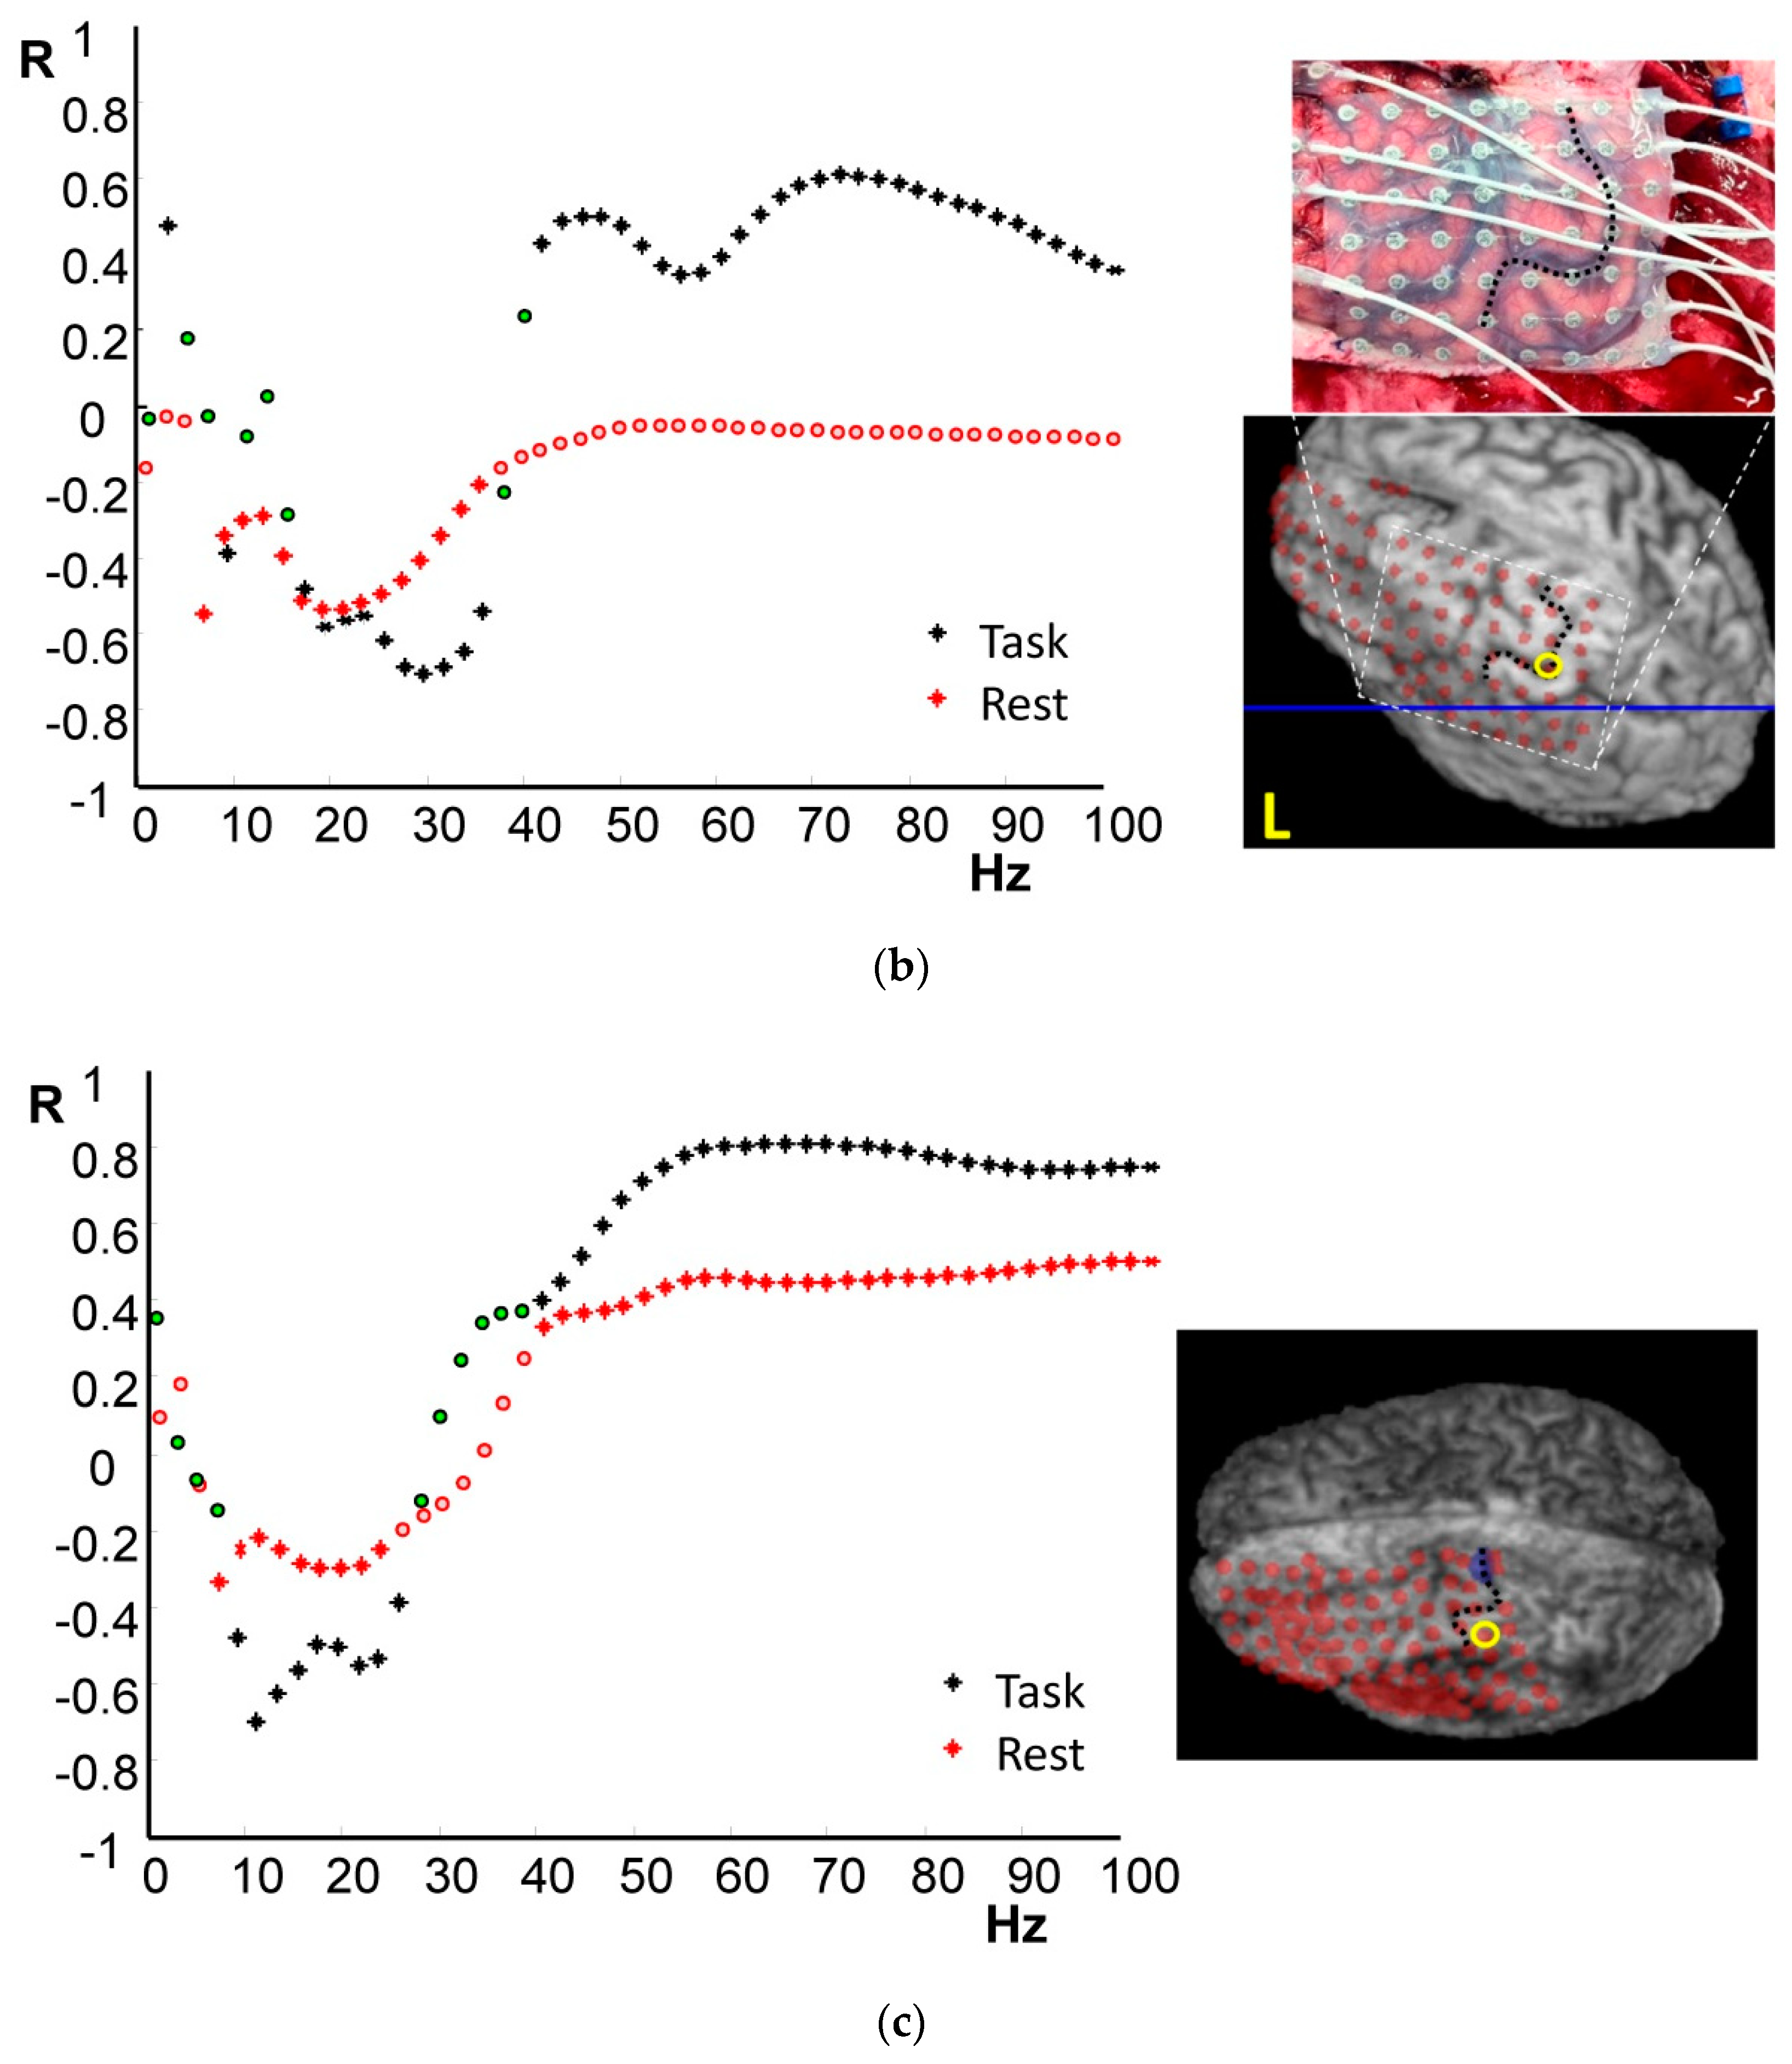
4.1. Frequency-Specific ECoG-fMRI Correlation during a Motor Task vs. Resting State
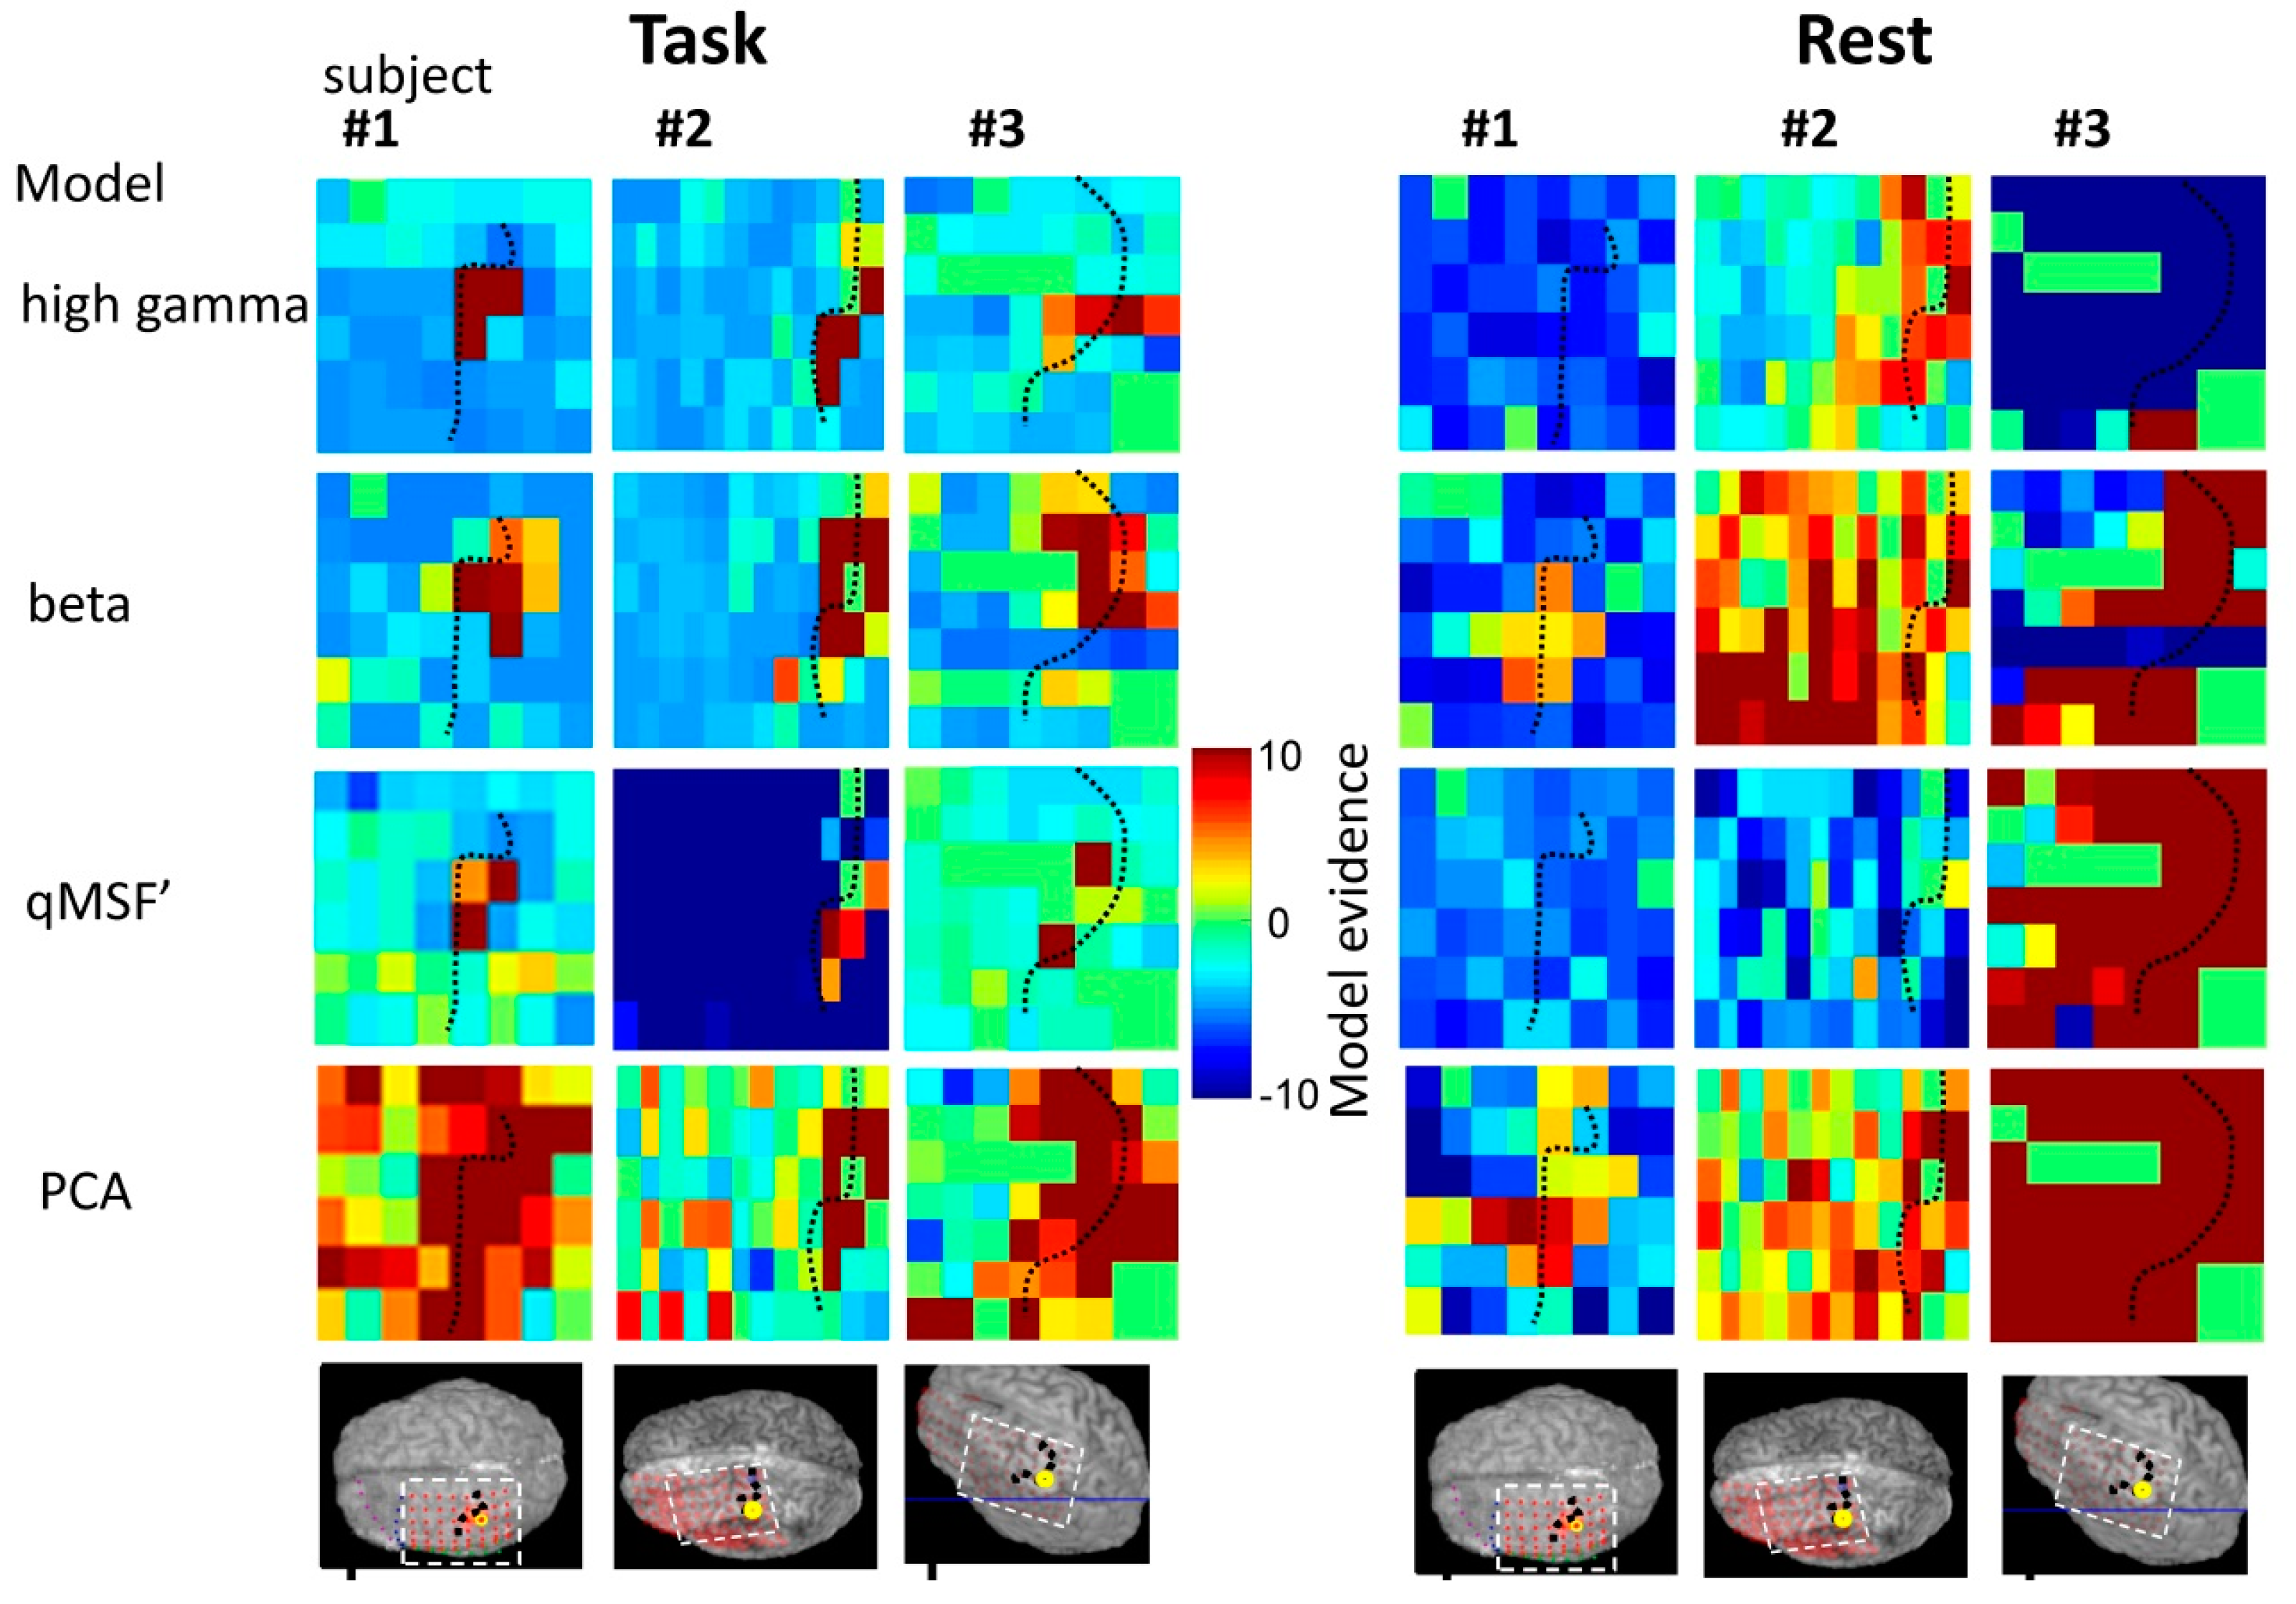
4.2. Comparison of Frequency-Specific and Cross-Spectral EEG Models of fMRI
4.2.1. Motor Task
4.2.2. Resting State
5. Discussion
5.1. Local Coupling
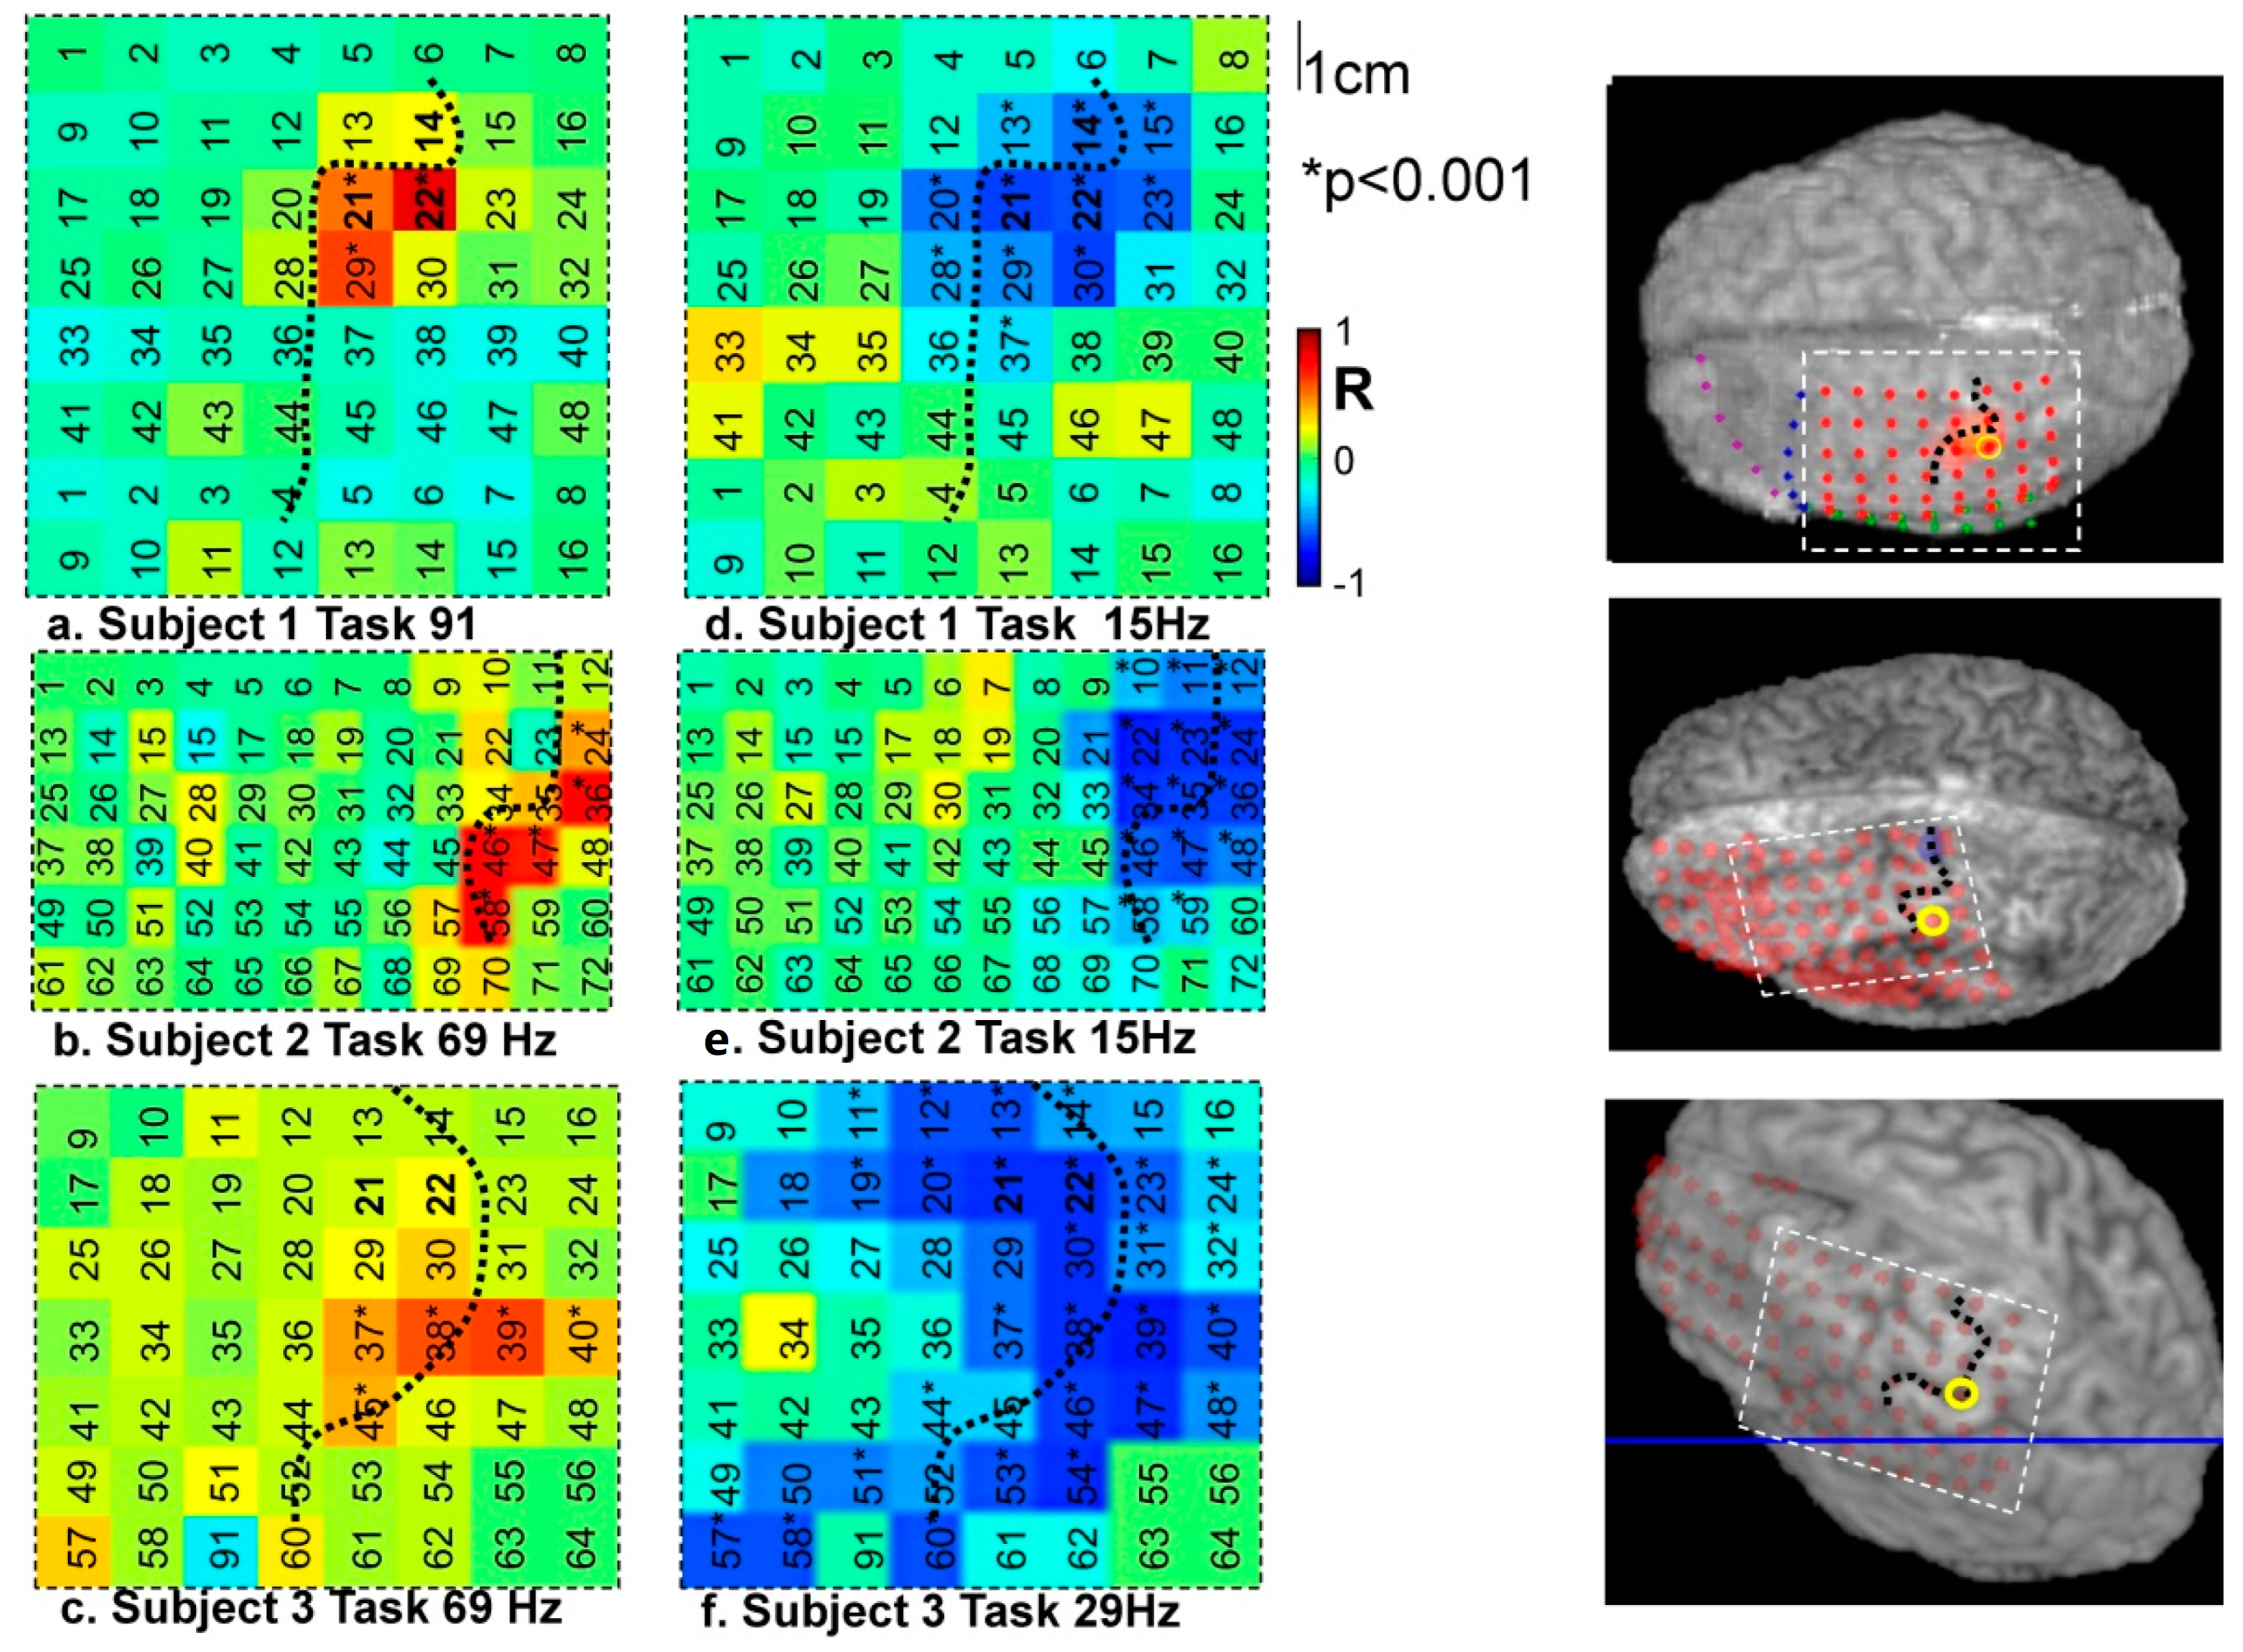
5.2. Spatial Coupling Aspects
5.3. Novelty of Our Electrophysiological BOLD Predictors
5.4. Epilepsy and ECoG-fMRI: Feature for Study and Potential Confound
5.5. Further Limitations
6. Conclusions
Supplementary Materials
Author Contributions
Funding
Institutional Review Board Statement
Informed Consent Statement
Data Availability Statement
Conflicts of Interest
Appendix A
Cross-Spectral Single Predictors of BOLD: Introduction and Theory
References
- Friston, K.J. Modalities, modes, and models in functional neuroimaging. Science 2009, 326, 399–403. [Google Scholar] [CrossRef]
- Logothetis, N.K. What we can do and what we cannot do with fMRI. Nature 2008, 453, 869–878. [Google Scholar] [CrossRef]
- Logothetis, N.K.; Pauls, J.; Augath, M.; Trinath, T.; Oeltermann, A. Neurophysiological investigation of the basis of the fMRI signal. Nature 2001, 412, 150–157. [Google Scholar] [CrossRef]
- Niessing, J.; Ebisch, B.; Schmidt, K.E.; Niessing, M.; Singer, W.; Galuske, R.A.W. Hemodynamic signals correlate tightly with synchronized gamma oscillations. Science 2005, 309, 948–951. [Google Scholar] [CrossRef]
- Mukamel, R.; Gelbard, H.; Arieli, A.; Hasson, U.; Fried, I.; Malach, R. Coupling between neuronal firing, field potentials, and FMRI in human auditory cortex. Science 2005, 309, 951–954. [Google Scholar] [CrossRef]
- Goense, J.B.; Logothetis, N.K. Neurophysiology of the BOLD fMRI signal in awake monkeys. Curr. Biol. 2008, 18, 631–640. [Google Scholar] [CrossRef]
- Scheeringa, R.; Fries, P.; Petersson, K.M.; Oostenveld, R.; Grothe, I.; Norris, D.G.; Hagoort, P.; Bastiaansen, M.C. Neuronal dynamics underlying high- and low-frequency EEG oscillations contribute independently to the human BOLD. Signal. Neuron. 2011, 69, 572–583. [Google Scholar] [CrossRef]
- Rosa, M.J.; Kilner, J.; Blankenburg, F.; Josephs, O.; Penny, W. Estimating the transfer function from neuronal activity to BOLD using simultaneous EEG-fMRI. Neuroimage 2010, 49, 1496–1509. [Google Scholar] [CrossRef]
- Conner, C.R.; Ellmore, T.M.; Pieters, T.A.; DiSano, M.A.; Tandon, N. Variability of the relationship between electrophysiology and BOLD-fMRI across cortical regions in humans. J. Neurosci. 2011, 31, 12855–12865. [Google Scholar] [CrossRef]
- Hermes, D.; Miller, K.J.; Vansteensel, M.J.; Aarnoutse, E.J.; Leijten, F.S.; Ramsey, N.F. Neurophysiologic correlates of fMRI in human motor cortex. Hum. Brain Mapp. 2012, 33, 1689–1699. [Google Scholar] [CrossRef]
- Murta, T.; Leite, M.; Carmichael, D.W.; Figueiredo, P.; Lemieux, L. Electrophysiological correlates of the BOLD signal for EEG-informed fMRI. Hum. Brain Mapp. 2015, 36, 391–414. [Google Scholar] [CrossRef] [PubMed]
- Canolty, R.T.; Knight, R.T. The functional role of cross-frequency coupling. Trends Cogn. Sci. 2010, 14, 506–515. [Google Scholar] [CrossRef] [PubMed]
- Kilner, J.M.; Mattout, J.; Henson, R.; Friston, K.J. Hemodynamic correlates of EEG: A heuristic. Neuroimage 2005, 28, 280–286. [Google Scholar] [CrossRef] [PubMed]
- Rubino, D.; Robbins, K.A.; Hatsopoulos, N.G. Propagating waves mediate information transfer in the motor cortex. Nat. Neurosci. 2006, 9, 1549–1557. [Google Scholar] [CrossRef] [PubMed]
- Akam, T.; Kullmann, D.M. Oscillations and filtering networks support flexible routing of information. Neuron 2010, 67, 308–320. [Google Scholar] [CrossRef] [PubMed]
- Miller, K.J.; Hermes, D.; Honey, C.J.; Hebb, A.O.; Ramsey, N.F.; Knight, R.T.; Ojemann, J.G.; Fetz, E.E. Human motor cortical activity is selectively phase-entrained on underlying rhythms. PLoS Comput. Biol. 2012, 8, e1002655. [Google Scholar] [CrossRef]
- Tao, J.X.; Ray, A.; Hawes-Ebersole, S.; Ebersole, J.S. Intracranial EEG substrates of scalp EEG interictal spikes. Epilepsia 2005, 46, 669–676. [Google Scholar] [CrossRef]
- Santiuste, M.; Nowak, R.; Russi, A.; Tarancon, T.; Oliver, B.; Ayats, E.; Scheler, G.; Graetz, G. Simultaneous magnetoencephalography and intracranial EEG registration: Technical and clinical aspects. J. Clin. Neurophysiol. 2008, 25, 331–339. [Google Scholar] [CrossRef]
- Magri, C.; Schridde, U.; Murayama, Y.; Panzeri, S.; Logothetis, N.K. The amplitude and timing of the BOLD signal reflects the relationship between local field potential power at different frequencies. J. Neurosci. 2012, 32, 1395–1407. [Google Scholar] [CrossRef]
- Nir, Y.; Mukamel, R.; Dinstein, I.; Privman, E.; Harel, M.; Fisch, L.; Gelbard-Sagiv, H.; Kipervasser, S.; Andelman, F.; Neufeld, M.Y.; et al. Interhemispheric correlations of slow spontaneous neuronal fluctuations revealed in human sensory cortex. Nat. Neurosci. 2008, 11, 1100–1108. [Google Scholar] [CrossRef]
- Schölvinck, M.L.; Maier, A.; Ye, F.Q.; Duyn, J.H.; Leopold, D.A. Neural basis of global resting-state fMRI activity. Proc. Natl. Acad. Sci. USA 2010, 107, 10238–10243. [Google Scholar] [CrossRef] [PubMed]
- Ebrahiminia, F.; Cichy, R.M.; Khaligh-Razavi, S.M. A multivariate comparison of electroencephalogram and functional magnetic resonance imaging to electrocorticogram using visual object representations in humans. Front. Neurosci. 2022, 16, 983602. [Google Scholar] [CrossRef] [PubMed]
- Haufe, S.; DeGuzman, P.; Henin, S.; Arcaro, M.; Honey, C.J.; Hasson, U.; Parra, L.C. Elucidating relations between fMRI, ECoG, and EEG through a common natural stimulus. NeuroImage 2018, 179, 79–91. [Google Scholar] [CrossRef] [PubMed]
- Siero, J.C.W.; Hermes, D.; Hoogduin, H.; Luijten, P.R.; Ramsey, N.F.; Petridou, N. BOLD matches neuronal activity at the mm scale: A combined 7T fMRI and ECoG study in human sensorimotor cortex. NeuroImage 2014, 101, 177–184. [Google Scholar] [CrossRef]
- Carmichael, D.W.; Thornton, J.S.; Rodionov, R.; Thornton, R.; McEvoy, A.W.; Ordidge, R.J.; Allen, P.J.; Lemieux, L. Feasibility of simultaneous intracranial EEG-fMRI in humans: A safety study. Neuroimage 2010, 49, 379–390. [Google Scholar] [CrossRef] [PubMed]
- Carmichael, D.W.; Thornton, J.S.; Rodionov, R.; Thornton, R.; McEvoy, A.; Allen, P.J.; Lemieux, L. Safety of localizing epilepsy monitoring intracranial electroencephalograph electrodes using MRI: Radiofrequency-induced heating. J. Magn. Reson. Imaging 2008, 28, 1233–1244. [Google Scholar] [CrossRef] [PubMed]
- Carmichael, D.W.; Vulliemoz, S.; Rodionov, R.; Thornton, J.S.; McEvoy, A.W.; Lemieux, L. Simultaneous intracranial EEG-fMRI in humans: Protocol considerations and data quality. Neuroimage 2012, 63, 301–309. [Google Scholar] [CrossRef] [PubMed]
- Allen, P.J.; Josephs, O.; Turner, R. A method for removing imaging artifact from continuous EEG recorded during functional MRI. Neuroimage 2000, 12, 230–239. [Google Scholar] [CrossRef]
- Friston, K.J.; Holmes, A.P.; Poline, J.B.; Grasby, P.J.; Williams, S.C.; Frackowiak, R.S.; Turner, R. Analysis of fMRI time-series revisited. Neuroimage 1995, 2, 45–53. [Google Scholar] [CrossRef]
- Biswal, B.; Yetkin, F.Z.; Haughton, V.M.; Hyde, J.S. Functional connectivity in the motor cortex of resting human brain using echo-planar MRI. Magn. Reson. Med. 1995, 34, 537–541. [Google Scholar] [CrossRef]
- Tallon-Baudry, C.; Bertrand, O.; Peronnet, F.; Pernier, J. Induced gamma-band activity during the delay of a visual short-term memory task in humans. J. Neurosci. 1998, 18, 4244–4254. [Google Scholar] [CrossRef] [PubMed]
- Kilner, J.M.; Kiebel, S.J.; Friston, K.J. Applications of random field theory to electrophysiology. Neurosci. Lett. 2005, 374, 174–178. [Google Scholar] [CrossRef] [PubMed]
- Penny, W.D.; Stephan, K.E.; Mechelli, A.; Friston, K.J. Comparing dynamic causal models. Neuroimage 2004, 22, 1157–1172. [Google Scholar] [CrossRef] [PubMed]
- Saignavongs, M.; Ciumas, C.; Petton, M.; Bouet, R.; Boulogne, S.; Rheims, S.; Carmichael, D.W.; Lachaux, J.P.; Ryvlin, P. Neural Activity Elicited by a Cognitive Task can be Detected in Single-Trials with Simultaneous Intracerebral EEG-fMRI Recordings. Int. J. Neural. Syst. 2017, 27, 1750001. [Google Scholar] [CrossRef]
- Buffalo, E.A.; Fries, P.; Landman, R.; Buschman, T.J.; Desimone, R. Laminar differences in gamma and alpha coherence in the ventral stream. Proc. Natl. Acad. Sci. USA 2011, 108, 11262–11267. [Google Scholar] [CrossRef]
- Engel, A.K.; Fries, P. Beta-band oscillations--signalling the status quo? Curr. Opin. Neurobiol. 2010, 20, 156–165. [Google Scholar] [CrossRef]
- Murta, T.; Chaudhary, U.J.; Tierney, T.M.; Dias, A.; Leite, M.; Carmichael, D.W.; Figueiredo, P.; Lemieux, L. Phase-amplitude coupling and the BOLD signal: A simultaneous intracranial EEG (icEEG)-fMRI study in humans performing a finger-tapping task. Neuroimage 2017, 146, 438–451. [Google Scholar] [CrossRef]
- Lachaux, J.P.; Fonlupt, P.; Kahane, P.; Minotti, L.; Hoffmann, D.; Bertrand, O.; Baciu, M. Relationship between task-related gamma oscillations and BOLD signal: New insights from combined fMRI and intracranial EEG. Hum. Brain Mapp. 2007, 28, 1368–1375. [Google Scholar] [CrossRef]
- Deligianni, F.; Centeno, M.; Carmichael, D.W.; Clayden, J.D. Relating resting-state fMRI and EEG whole-brain connectomes across frequency bands. Front. Neurosci. 2014, 8, 258. [Google Scholar] [CrossRef]
- Kopell, N.; Ermentrout, G.B.; Whittington, M.A.; Traub, R.D. Gamma rhythms and beta rhythms have different synchronization properties. Proc. Natl. Acad. Sci. USA 2000, 97, 1867–1872. [Google Scholar] [CrossRef]
- Uhlhaas, P.J.; Singer, W. Neural synchrony in brain disorders: Relevance for cognitive dysfunctions and pathophysiology. Neuron 2006, 52, 155–168. [Google Scholar] [CrossRef] [PubMed]
- Bragin, A.; Engel, J., Jr.; Wilson, C.L.; Fried, I.; Buzsaki, G. High-frequency oscillations in human brain. Hippocampus 1999, 9, 137–142. [Google Scholar] [CrossRef]
- Zijlmans, M.; Jacobs, J.; Zelmann, R.; Dubeau, F.; Gotman, J. High-frequency oscillations mirror disease activity in patients with epilepsy. Neurology 2009, 72, 979–986. [Google Scholar] [CrossRef] [PubMed]


| Implantation Scheme | ||
|---|---|---|
| Patient ID | #1 |  |
| Epilepsy | FLE | |
| Anatomical location of electrodes | - L pre/postcentral gyrus - L supramarginal gyrus - I (IFG) and M (MFG) frontal gyri | |
| Type of electrodes | two 6-contact strips, one 8 × 8 contact grid, one 2 × 8 contact grid | |
| Patient ID | #2 | 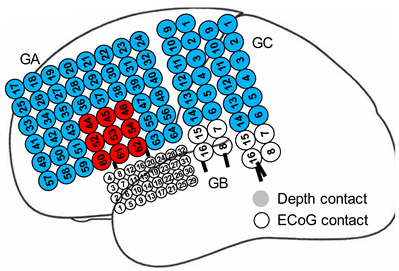 |
| Epilepsy | FLE | |
| Anatomical location of electrodes | - L frontal lobe (laterally and inferiorly) - L M (MFG) and I (IFG) frontal gyri - L temporal lobe | |
| Type of electrodes | one 6 × 8 contact grid, two 2 × 8 contact grids, one 4 × 8 high-density contact grid, two 6-contact strips, two 6-contact depths | |
| Patient ID | #3 |  |
| Epilepsy | FLE | |
| Anatomical location of electrodes | - L frontal and parietal convexity - L frontal pole - L S frontal gyrus (SFG) - L I frontal gyrus - L mesial frontal surface | |
| Type of electrodes | one 8 × 8 contact grid, one 2 × 8 contact grid, one 8-contact strip, one 6-contact strip, one high-density 4 × 8 contact grid |
| Model Evidence | ||||||
|---|---|---|---|---|---|---|
| Motor Task | ||||||
| Model | #Predictors | Frequency Range (Hz) | ||||
| #1 | #2 | #3 | Sum | |||
| qmsf’ | 1 | 0–100 | 48.3 | 15.4 | 1.5 | 65.2 |
| qrmsf | 1 | 0–100 | 15.2 | −0.4 | 3.3 | 18.1 |
| CofM | 1 | 0–100 | −1.5 | −7.2 | 12.5 | 3.8 |
| ICofM | 1 | 0–100 | 1.0 | −3.6 | −10.6 | −13.2 |
| I40 Hz | 1 | 0–100 | 1.6 | −20.2 | −11.1 | −29.6 |
| PCA | 10–18 | 0–100 | 35.1 | 23.2 | 18.3 | 76.5 |
| beta | 1 | 13–31 | 10.8 | 16.1 | 12.7 | 39.6 |
| gammah | 1 | 53–99 | 39.0 | 26.9 | 12.7 | 78.6 |
| 6-band | 6 | 0–100 | −46.4 | −49.0 | −57.8 | −153.2 |
| Rest | ||||||
| qmsf’ | 1 | 0–100 | −5.8 | −5.8 | 40.7 | 29.1 |
| qrmsf | 1 | 0–100 | −5.7 | 0.6 | 19.8 | 14.7 |
| CofM | 1 | 0–100 | −5.1 | −6.6 | −4.7 | −16.4 |
| ICofM | 1 | 0–100 | −7.8 | −14.9 | −6.5 | −29.2 |
| I40 Hz | 1 | 0–100 | −7.7 | −19.1 | 19.1 | −7.7 |
| PCA | 10–18 | 0–100 | 1.2 | 7.9 | 81.6 | 90.6 |
| beta | 1 | 13–31 | −5.9 | 6.2 | 55.3 | 55.6 |
| gammah | 1 | 53–99 | −7.3 | 4.0 | −15.0 | −18.3 |
| 6-band | 6 | 0–100 | −180.0 | −73.6 | −101.6 | −355.1 |
| multiple predictor model | ||||||
| cross spectral model | Bold text indicates significant result | |||||
Disclaimer/Publisher’s Note: The statements, opinions and data contained in all publications are solely those of the individual author(s) and contributor(s) and not of MDPI and/or the editor(s). MDPI and/or the editor(s) disclaim responsibility for any injury to people or property resulting from any ideas, methods, instructions or products referred to in the content. |
© 2024 by the authors. Licensee MDPI, Basel, Switzerland. This article is an open access article distributed under the terms and conditions of the Creative Commons Attribution (CC BY) license (https://creativecommons.org/licenses/by/4.0/).
Share and Cite
Carmichael, D.W.; Vulliemoz, S.; Murta, T.; Chaudhary, U.; Perani, S.; Rodionov, R.; Rosa, M.J.; Friston, K.J.; Lemieux, L. Measurement of the Mapping between Intracranial EEG and fMRI Recordings in the Human Brain. Bioengineering 2024, 11, 224. https://doi.org/10.3390/bioengineering11030224
Carmichael DW, Vulliemoz S, Murta T, Chaudhary U, Perani S, Rodionov R, Rosa MJ, Friston KJ, Lemieux L. Measurement of the Mapping between Intracranial EEG and fMRI Recordings in the Human Brain. Bioengineering. 2024; 11(3):224. https://doi.org/10.3390/bioengineering11030224
Chicago/Turabian StyleCarmichael, David W, Serge Vulliemoz, Teresa Murta, Umair Chaudhary, Suejen Perani, Roman Rodionov, Maria Joao Rosa, Karl J Friston, and Louis Lemieux. 2024. "Measurement of the Mapping between Intracranial EEG and fMRI Recordings in the Human Brain" Bioengineering 11, no. 3: 224. https://doi.org/10.3390/bioengineering11030224
APA StyleCarmichael, D. W., Vulliemoz, S., Murta, T., Chaudhary, U., Perani, S., Rodionov, R., Rosa, M. J., Friston, K. J., & Lemieux, L. (2024). Measurement of the Mapping between Intracranial EEG and fMRI Recordings in the Human Brain. Bioengineering, 11(3), 224. https://doi.org/10.3390/bioengineering11030224