1. Introduction
Blood pressure (BP) is an essential physiological parameter in the human body and refers to the BP against the walls of blood vessels. BP allows us to assess the function of heart and blood vessels [
1]. Maintaining normal BP levels helps reduce the risk of heart disease and prevents diseases such as atherosclerosis and stroke [
2]. Hypertension is a prevalent health problem worldwide, with an estimated 1.28 billion people aged 30–79 years suffering from the disease. Hypertension has become a common chronic disease, with its prevalence increasing every year, and one of the leading causes of premature death in humans. Hypertension is also closely related to obesity, high blood cholesterol and diabetes, etc. Maintaining a high BP for a long time may cause substantial damage to the heart, kidneys and other organs and lead to myocardial infarction, stroke and other serious consequences [
3]. However, about 46% of patients have no visible symptoms and do not realize they have high BP. For this reason, the World Health Organization encourages people to take regular BP measurements to note changes in BP for early prevention and treatment.
Traditional noninvasive BP measurement methods are susceptible to many limitations. For example, cuff sphygmomanometers need to be appropriately worn, need to be kept at rest during measurement, and are accessible to external interference that can affect the results. In addition, specific individuals, such as children, pregnant women and the obese may not be suitable for traditional BP measurement methods [
4]. To overcome these limitations, scientists are developing more advanced noninvasive BP measurement technologies, such as contactless BP measurement and wearable BP monitors. These new technologies provide a more accurate, convenient, and continuous way to monitor BP and are expected to improve the effectiveness and convenience of BP monitoring. Ambulatory BP monitoring is a medical method of continuously measuring an individual’s BP value over 24 h. Mobile BP monitoring is achieved by wearing a portable monitor that automatically measures BP at specific intervals, including daytime and nighttime [
5]. As BP changes with different activities and sleep states, ambulatory monitoring can provide more accurate and comprehensive BP data, which is more helpful in assessing a hypertension status and monitoring the effectiveness of treatment. It also reveals the fluctuation of a patient’s BP, helping doctors to more accurately formulate a personalized treatment plan and promoting the efficacy and safety of hypertension management.
A PPG is a biomedical signal that refers to blood flow pulsation signals. PPG signals can be measured using photoplethysmography sensors placed on the skin’s surface. These sensors measure the minor fluctuations caused by blood flow beneath the skin, making it an excellent physiological signal for predicting BP. In recent years, many researchers have fed PPG signals into deep-learning models to predict BP [
6,
7,
8]. Maqsood et al. [
9] compared different machine learning methods and different feature extraction techniques for BP estimation using PPG signals and concluded that deep learning algorithms can achieve better results on time domain features. Zhong [
10] proposed a BP estimation model based on a hybrid attentional gating U-Net (MAGU), which utilizes PPG signals and incorporates a hybrid attentional gating mechanism to enhance feature extraction in deep networks. Bernard [
11] used PPG signals for BP estimation and evaluated different machine-learning algorithms. Rong et al. [
12] developed a deep learning model consisting of a signal pre-processing module and an MTFF neural network module. H. Ankishan [
13] developed a mathematical model and system that uses physiological signals and voice messages to calculate systolic blood pressure (SBP) and diastolic blood pressure (DBP). Hu et al. [
14] proposed a global hybrid multi-scale convolutional network to obtain multi-scale information by summing three branches over attention weights on multiple scales. Ali [
15] developed a hybrid LSTM-ANN model for BP prediction and deployed it on the STM32 microcontroller for actual time prediction.
Researchers have shown an increasing interest in studying multi-wavelength photoplethysmography (MWPPG) in recent years. While a traditional single-wavelength PPG measurement primarily focuses on parameters such as BP and heart rate, an MWPPG measurement offers a wealth of additional information, including indicators of cardiac function, blood flow velocity, and vascular elasticity. The propagation speed and characteristics of a PPG in different tissues can be measured by utilizing multiple light sources with different wavelengths. The advantage of this approach lies in its ability to acquire a more comprehensive and detailed biological signal, aiding researchers in gaining a deeper understanding of cardiovascular health and the underlying mechanisms of related diseases. Sirkiä [
16] developed an MWPPG sensor that combines an external pressure generation system and a sensing system to detect different skin depths and extract information about various blood vessels in the skin. Lu et al. [
17] developed a method to assess systemic vascular resistance (SVR) based on the small artery pulse transit time (aPTT) of an MWPPG. Liu et al. [
18] proposed a PCA-based MWPPG cuffless BP measurement algorithm. Slapničar [
19] used a modified RGB camera to estimate BP by measuring the PTT between different skin layers. Jukka-Pekka Sirkiä [
20] developed a device that can receive signals from different depths of the cutaneous vasculature, proposed that PPG signals with longer wavelengths are more sensitive to pressure-induced vasodilatation than PPG signals with shorter wavelengths, and emphasized the potential of the MWPPG for BP prediction.
In this paper, we combine the continuous wavelet transform (CWT) into a multi-wavelength PPG fusion algorithm to overcome the limitations of single-wavelength PPG signals in cuffless BP monitoring. After filtering the MWPPG signals and removing outliers, the pre-processed four-channel data are individually CWT transformed and added to the dataset as images. We applied the method of fusing the four-channel CWT images into a 12-channel array for inputting into the deep learning model, which achieved better results than simply feeding the CWT-transformed images of the single-wavelength PPG signal to the deep learning model. Finally, we verify the effectiveness of the proposed MWPPG fusion-based BP prediction algorithm on a self-constructed dataset and discuss the reasons why better results can be achieved.
2. Materials and Methods
2.1. Data Collection
In the experiment, we recruited volunteers for PPG signal acquisition. A self-designed multi-wavelength PPG detection device was used [
21]. The acquisition wavelength and depth are shown in
Figure 1. The detailed information of the monitoring device is as follows: a 200 Hz sampling rate; a DCM08 sensor module for data collection whose wavelengths are 660 nm (Channel 1), 730 nm (Channel 2), 850 nm (Channel 3) and 940 nm (Channel 4); an ADPD4100 multi-mode sensor front-end module; and a STM32F411 microprocessor module with a core of ARM Cortex-M4 of 100 MHz. The device acquires PPG signals from each volunteer’s fingertip at a sampling rate of 200 Hz, with a duration of 1 min for each acquisition, and the collected data is saved as a txt file. This study was approved by the Biomedical Ethics Committee of Guilin University of Electronic Science and Technology (GUET-20220301-001). After the volunteers signed the informed consent form, the PPG data collection started.
The data collection process for this experiment has the following requirements:
Before data collection, the subject is required to clean the fingertip area to avoid contamination affecting the test results;
Before data collection, the subject should sit quietly and remain calm for 15 min to ensure the accuracy of the measurement results;
During data collection, the subject is to naturally extend the index finger of the left hand and lightly press it on the sensor, keeping it still;
Immediately after acquiring the PPG signal, the BP of the volunteer was measured; the device used to measure BP was the Omron HEM-7201, and the estimated BP was used as a label for constructing the model.
We ultimately retained 1 min of an appropriate PPG signal from each of the 180 volunteers for the following study. Individual samples with missing or incomplete wavelength signals were discarded during the collection process to facilitate subsequent studies of the performance of MWPPG feature fusion. The final data collected for analysis included 162 volunteers, 66 of whom were diagnosed with hypertension (SBP ≥ 130 mmHg or DBP ≥ 90 mmHg) [
22].
2.2. Data Processing
After data filtering to remove anomalous signals, a 0.5–8 Hz Butterworth second-order bandpass filter is used for filtering. This filter effectively removes shallow and high-frequency noise signals, leaving the filtered signal smoother and more stable. In practical signal processing applications, bandpass filters usually improve the signal-to-noise ratio and effectively remove interference noise.
In some previous related studies, single-channel PPGs were directly used as model inputs. However, this requires rigorous data pre-processing, such as filtering low-quality data noise and other operations. However, due to the temporal nature of the PPG, multiple noise-filtering processes may lead to the loss of beneficial information in the signal, which may negatively affect the model’s performance. Another part of the study transforms the PPG into a 2D CWT image form before using it as model input.
The wavelet basis function is defined as a translation followed by a scale transformation of the function in the basic function
Ψ(
t) as follows:
The fundamental functions a and b are both constants while
a > 0. Suppose the constants
a and
b are varied continuously in a certain interval. Many fundamental functions satisfying the conditions can be obtained in that case, called wavelet bases. In any space L^2 (R), if there is a signal sequence
x(
t) square productive and
x(
t) ∈ L^2 (R), the continuous wavelet transform of the signal
x(
t) is given by:
There are many kinds of commonly used wavelet basis functions, and the same type of wavelet basis includes a variety of wavelet bases with different parameters. And each wavelet basis has a different effect, highlighting the importance of selecting a wavelet basis. With the increasing types of wavelet bases, the number of wavelet functions that can realize specific functions is also increasing, and researchers can choose the wavelet function that can achieve the best experimental results according to the requirements of the scientific research. After many experiments, it is found that the use of the “cgau1” wavelet basis function for the continuous wavelet transform to generate a two-dimensional scale map is the best effect, so the length of 5 s sliding 1 s each time in the window on the PPG to take the value. In batches, the continuous wavelet transform of “cgau1” is applied to the PPGs of 5 s segments.
4. Results
The pre-processing stage of this paper takes the method of the simultaneous four-wavelength cutting of PPG signals to ensure the same number of samples within each wavelength PPG dataset. Meanwhile, to remove the influence of dataset division on the results, the same random seed is set for each wavelength PPG dataset when randomly dividing the dataset to ensure that the samples’ order in the training set and test set of each wavelength PPG dataset is the same. This treatment aims to ensure that no additional bias is introduced into the dataset during the division process, thus ensuring the representativeness and consistency of the samples in the training and test sets. The ten-fold cross-validation method is used in this paper to evaluate the BP prediction performance of individual single-wavelength PPG signals or four-wavelength PPG signals in the study.
4.1. Performance of BP Prediction Base on Single-Wavelength PPG
After pre-processing operations such as filtering, abnormal segment rejection and normalization, this study targets the single-wavelength PPG signal for further analysis. Firstly, the one-dimensional signal was converted into a two-dimensional image using CWT, and it was input into the ACNN-BiLSTM model in the form of an RGB three-channel. In this paper, several sets of experiments were conducted to evaluate the BP prediction performance of PPG signals at different wavelengths. The specific results are shown in
Table 1. Through
Table 1, we learn that, in the case of using a single wavelength, the best BP prediction is achieved using the PPG signal acquired by Channel 4. Compared with the PPG signal obtained by Channel 2 on the SBP prediction, the R
2 improves from 0.82 to 0.89, the
MAE decreases from 4.17 mmHg to 3.57 mmHg, the RMSE decreases from 9.78 mmHg to 7.72 mmHg, and the AAMI criteria were satisfied.
In a performance analysis of blood pressure prediction using data from different wavelength channels in the first trial, we found that data using the 940 nm wavelength (Channel 4) performed the best in predicting systolic blood pressure (SBP), with a coefficient of determination (R2) as high as 0.89, a mean absolute error (MAE) of 3.57 mmHg, and a root mean squared error (RMSE) of 7.72 mmHg, all of which were superior to the other channels and met the standards of the American Association for the Advancement of Medical Instrumentation (AAMI). In contrast, the data using the 730 nm wavelength (Channel 2) had the lowest error in predicting diastolic blood pressure (DBP), and although it did not have the highest R2 value, it had a small mean error, suggesting that it was more accurate in DBP prediction and also met the AAMI criteria. Data from other channels such as those of 660 nm (Channel 1) and 850 nm (Channel 3) performed relatively poorly in predicting blood pressure and did not meet the AAMI criteria. In summary, Channel 4 demonstrated the highest prediction accuracy and goodness of fit in this trial and was the optimal choice for predicting blood pressure.
The PPG data collected by Channel 4 using the 940 nm wavelength performed well in predicting blood pressure, which may be attributed to the superior ability of the 940 nm wavelength to penetrate skin and tissues, as well as its high absorption of hemoglobin and deoxyhemoglobin, which makes the PPG signal more sensitive to changes in blood flow dynamics. In addition, this specific wavelength may provide a better signal-to-noise ratio of the signal, helping to accurately extract the signal of blood pressure changes from background noise. Physiological and biochemical factors may also have different effects on different wavelengths of light, and the 940 nm wavelength may find the optimal balance among these factors.
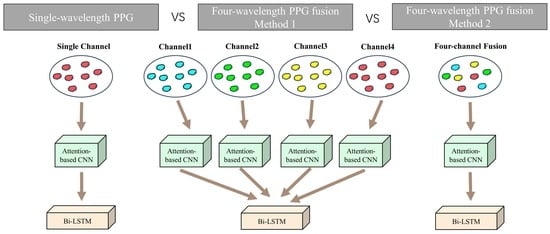
4.2. Performance of BP Prediction Base on Four-Wavelength PPG
As shown in
Figure 2, two experiments on the WMPPG aiming at BP prediction using four-wavelength PPG signals are conducted in this paper. Trial 2 was used as a comparison experiment to expand the ACNN part of the deep learning model into four side-by-side branches. The structure of each branch is the same as that of the input single-channel PPG signal, and all use RGB three-channel inputs. Thanks to the four ACNN branches, the model can input one to four channels of PPG at the same time. Then, the features extracted from the CNNs of the four branches are spliced, and the spliced features are input into the Bi-LSTM network in the next part. In Trial 3, only the 3-channel input of the CNN part is converted to a 12-channel input to process the previously mentioned 12-channel data obtained by fusing the four-wavelength PPG signals.
Subsequently, this paper conducted a comparative experiment between multi-wavelength PPG signals and single-wavelength BP prediction. It evaluated the effect of using four-wavelength PPG signals to predict BP, and the results are shown in
Table 2.
Table 2 shows that for the signals that were more challenging to predict SBP with, the results of Trial 2 improved the
R2 from 0.89 to 0.94, the MAE from 3.57 mmHg to 1.88 mmHg, and the RMSE from 7.72 mmHg to 5.0 mmHg. The results of Trial 3 compared with those of the Trial 2 experiments showed that the
R2 improved from 0.94 to 0.95, MAE from 1.88 mmHg to 1.67 mmHg, and RMSE from 5.66 mmHg to 5.28 mmHg compared with the results of Trial 2.
In order to further compare the BP prediction performance of Trial 2 and Trial 3, the British Hypertension Society (BHS) Programs [
23] were used in this paper to evaluate the two experiments separately. According to the British Hypertension Society’s recommended rating criteria for blood pressure measurement equipment, grade A is given if 60% of measurements are differing from the true value by less than 5 mmHg, 85% of measurements are differing from the true value by less than 10 mmHg, and 95% of measurements are differing from the true value by less than 15 mmHg. The percentage of instruments with smaller prediction errors is definitely smaller than the percentage with larger prediction errors. Therefore, we can see in
Table 3 that the percentage of prediction errors less than 5 mmHg, the percentage of prediction errors less than 10 mmHg, and the percentage of prediction errors less than 15 mmHg increase in that order. The specific evaluation results are shown in
Table 3 and
Table 4. Regarding SBP and DBP, both Trial 2 and Trial 3 achieved the A-level scores of the BHS index. Regarding predicting SBP, 94% of the Trial 3 data had a prediction error of less than 5 mmHg, while 89% of the Trial 2 data had a prediction error of less than 5 mmHg. Regarding predicting DBP, the proportion of prediction errors less than 5 mmHg in Trial 3 is even higher than 95%, while the ratio of prediction errors less than 5 mmHg taken in Trial 2 is 92%.
And, to further demonstrate the advantages of validating Trial 3 in predicting blood pressure, we show the Bland–Altman plots of the Trial 3 and Channel 4 experiments with the best performance in single-wavelength PPG. The Bland–Altman plot is an effective tool for assessing the consistency of two measures, favored for its intuitive graphical representation and low requirement for assumptions about data distribution. The plot makes it straightforward to identify a systematic bias and assess the level of consistency by showing the difference in the mean values of the two measurements and the consistency bounds of the difference. In addition, it reveals trends in differences with measurements and allows for the clinically meaningful assessment of the data. The Bland–Altman plot is also suitable for reproducibility assessment and subgroup analysis, enhancing its ability to analyze data under different conditions. Thanks to the support of a wide range of statistical softwares (Python 3.7, matplotlib 3.3.3), producing and analyzing Bland–Altman plots is fast and easy, making them widely used in medicine, biostatistics, and other scientific fields. As shown in
Figure 4, the 95% confidence intervals of SBP and DBP for Trial 3 are in the range of [−10.129, 10.560] and [−4.052, 5.474]. The mean difference between the predicted and true values of SBP and DBP are 0.216 and 0.711. This indicates that Trial 3 can predict blood pressure with a high accuracy.
5. Discussion
The PPG signal, which can be easily collected using a photoelectric sensor placed on the skin’s surface, is widely used in physiological monitoring, health diagnosis, medical monitoring, and other fields. However, studies utilizing multi-wavelength PPG signals to estimate BP are relatively rare. In this study, we explored the feasibility and effectiveness of fusing four-channel PPG data through theoretical and experimental analyses and proposed the ACNN-BiLSTM model for BP prediction. We compared the performance of BP prediction using different single-wavelength PPG signals and using four-wavelength PPG signals. It is shown that the BP prediction model based on the ACNN-BiLSTM model with four-wavelength PPG signals has a higher accuracy and generalization ability.
5.1. Comparison of BP Prediction Using Single-Wavelength PPG Signals
In terms of predicting SBP, through
Table 1, we can see that in the case of BP prediction using single-wavelength PPG signals, the best results were achieved using Channel 4 PPG signals for BP prediction which reached the AAMI criterion. This may be because Channel 4 has a wavelength of 940 nm, which can irradiate to a deeper depth than the rest of the channels and can acquire richer physiological information. This is precisely because more information about vascular reflexes and BP changes can be obtained. This advantage makes the scheme using Channel 4 achieve excellent performance in BP prediction. In addition, the experimental results also reveal the limitations exhibited by the other three channels. The wavelengths of these channels may not be able to reach the deeper tissues, as Channel 4 channel does, and therefore, do not fully capture the subtle differences in vascular reflexes and BP changes. Lacking this vital information, these channels exhibit relatively low levels of accuracy and reliability in BP prediction.
In terms of DBP prediction, there was no significant difference in DBP prediction using the PPG signals of the four channels, and all met the AAMI criteria. However, the PPG signal using Channel4 still showed a slight advantage. This is due to the more straightforward prediction of DBP relative to SBP. DBP requires less physiological information in the prediction process, so even if some of the channels are illuminated at shallow depths and do not have access to deeper physiological information under the skin, the DBP can still be predicted well by relying only on the physiological information from the more superficial layers of the skin surface. This result also demonstrates that the prediction of DBP relative to the prediction of SBP relies less on deeper physiological information. In contrast, the prediction of SBP requires more comprehensive and accurate physiologic information to achieve better results.
5.2. Advantages of Using Multi-Wavelength PPG Signals over Single Wavelengths
According to the observations in
Table 1 and
Table 2, BP prediction using four-wavelength PPG signals can significantly improve the accuracy of BP prediction compared to single-wavelength PPG signals. This is because when using four-wavelength PPG signals for BP prediction, more physiological information can be obtained to improve the accuracy of BP prediction compared to single-wavelength PPG signals. The four-wavelength PPG signal contains different wavelengths, each corresponding to a different tissue depth. In this way, by comprehensively analyzing the PPG signals of different channels, the prediction model can catch the characteristics of BP changes more thoroughly and accurately. Meanwhile, the advantage of using multi-wavelength PPG signals is that more physiological information about the blood vessels under the skin can be obtained. PPG signals of different wavelengths can be absorbed and reflected in tissues at different depths, providing a more comprehensive range of vascular reflexes and hemodynamic features. This integrated multichannel approach helps compensate for missing information or limitations with a single channel. In addition, using a four-wavelength PPG signal allows for better handling of interfering factors. Since different wavelengths have different absorption and scattering properties of light, the effect of some interfering signals on the prediction can be eliminated by comparing PPG signals of different wavelengths. By combining data from multiple channels, the prediction model can understand and analyze BP changes more comprehensively, thus improving the accuracy of BP prediction.
In Trial 3, better BP prediction can be achieved by the fused 12-channel array of four-wavelength PPG signals being directly input into the network model compared to Trial 2. This is because, through the fused array, the network model can simultaneously analyze and understand the relatedness and interactions between different channels. On the one hand, by fusing the four-wavelength PPG signals into a 12-channel array, the network model can more comprehensively access physiological information. Each channel represents a different depth of tissue information so that the whole 12-channel array can provide more prosperous and diverse features of BP changes. In this way, the prediction model can more accurately learn and understand the relatedness between different channels, thus improving the accuracy of BP prediction.
On the other hand, only the Bi-LSTM part of Trial 2 started to process the PPG signals of the four channels simultaneously. In contrast, Trial 3 was simultaneously processing four channels of data in both the CNN and the Bi-LSTM parts. This means that Trial 3 utilizes all channels of data more comprehensively and consistently throughout the prediction process. This unified processing may help improve the network model’s understanding and learning of the relatedness between the different channel signals, improving BP prediction.
5.3. Performance Comparison with Previous Studies Using Only PPG Waveforms for BP Estimation
This study presents a method for predicting BP using a four-wavelength PPG signal fusion method designed to predict BP by exploiting potential information between wavelengths. The fused four-wavelength data can be used to build BP estimation models that are fast, simple, robust, and do not require manual feature engineering to capture rapid, intermittent BP changes.
Table 5 compares our proposed method with PPG-based BP estimation studies published in the last few years, including the estimation dataset used, the length of the PPG signal used, and the model, mainly containing results from ME, SD, or MAE. Fair quantitative comparisons are difficult because of the differences in datasets, method implementation, and validation procedures among the studies. In addition, comparisons should be made, considering the trade-offs between performance, speed, and computational complexity metrics. Following this, we discuss the advantages offered by our proposed method.
5.4. Advantages and Disadvantages
This study aims to compare the effectiveness of BP prediction using PPG signals acquired at four different wavelengths and to provide a reference for wearable device manufacturers. At the same time, we propose a novel method of fusing multi-wavelength PPG signals and inputting them into a network model for BP prediction, significantly improving prediction accuracy. However, it should be pointed out that the performance of the neural network model relies heavily on a large amount of high-quality, noise-free PPG signal data, and the quality of the PPG signal is also affected by the acquisition environment. In this paper, the PPG signals were acquired in a quiet environment with suitable temperature and humidity, and the subjects were sedentary. Therefore, the feasibility and accuracy of this BP prediction method still need to be further evaluated for those cases where the acquisition environment is poor, or the subjects are in an active state.
In the current study, the validation of the model was limited to a relatively small group of hypertensive patients, which does limit our ability to assess the validity and generalizability of the model to a wider range of hypertensive patients. A hypertensive subgroup of only 66 participants may not fully capture the diversity of different hypertensive stages, ages, genders, lifestyles, and other variables that may influence model performance. To overcome this limitation, future studies should expand the sample size to include a larger number of hypertensive patients, which would allow for a more comprehensive assessment of the model’s performance in predicting and treating hypertension.


 ,
, 


