
Development of a Probability-Based In Vitro Eye Irritation Screening Platform

 and
and
Abstract

1. Introduction
2. Methods and Materials
2.1. Cell Culture
2.2. Cell Micropatterning
2.3. Test Compound Treatment for Micropatterned Cells
2.4. Bulk Apoptosis Assay
2.5. Apoptosis Assay on Micropattern Substrates
2.6. Quantification and Digitization of Apoptosis Assay Readout
2.7. Calcium Influx TRPV1 Channel Activation Assay
2.8. Quantification and Digitization of TRPV1 Activation Assay Readout
2.9. Statistical Analysis and Logistical Regression Modelling
3. Results and Discussion
3.1. Partitioning of Human Corneal Epithelial Cells Using Cell Micropatterning
3.2. Digitization of Apoptosis Assay Using Primary hCEC Micropatterns
3.3. Establishment of Nociceptor Activation Assay in Primary hCECs
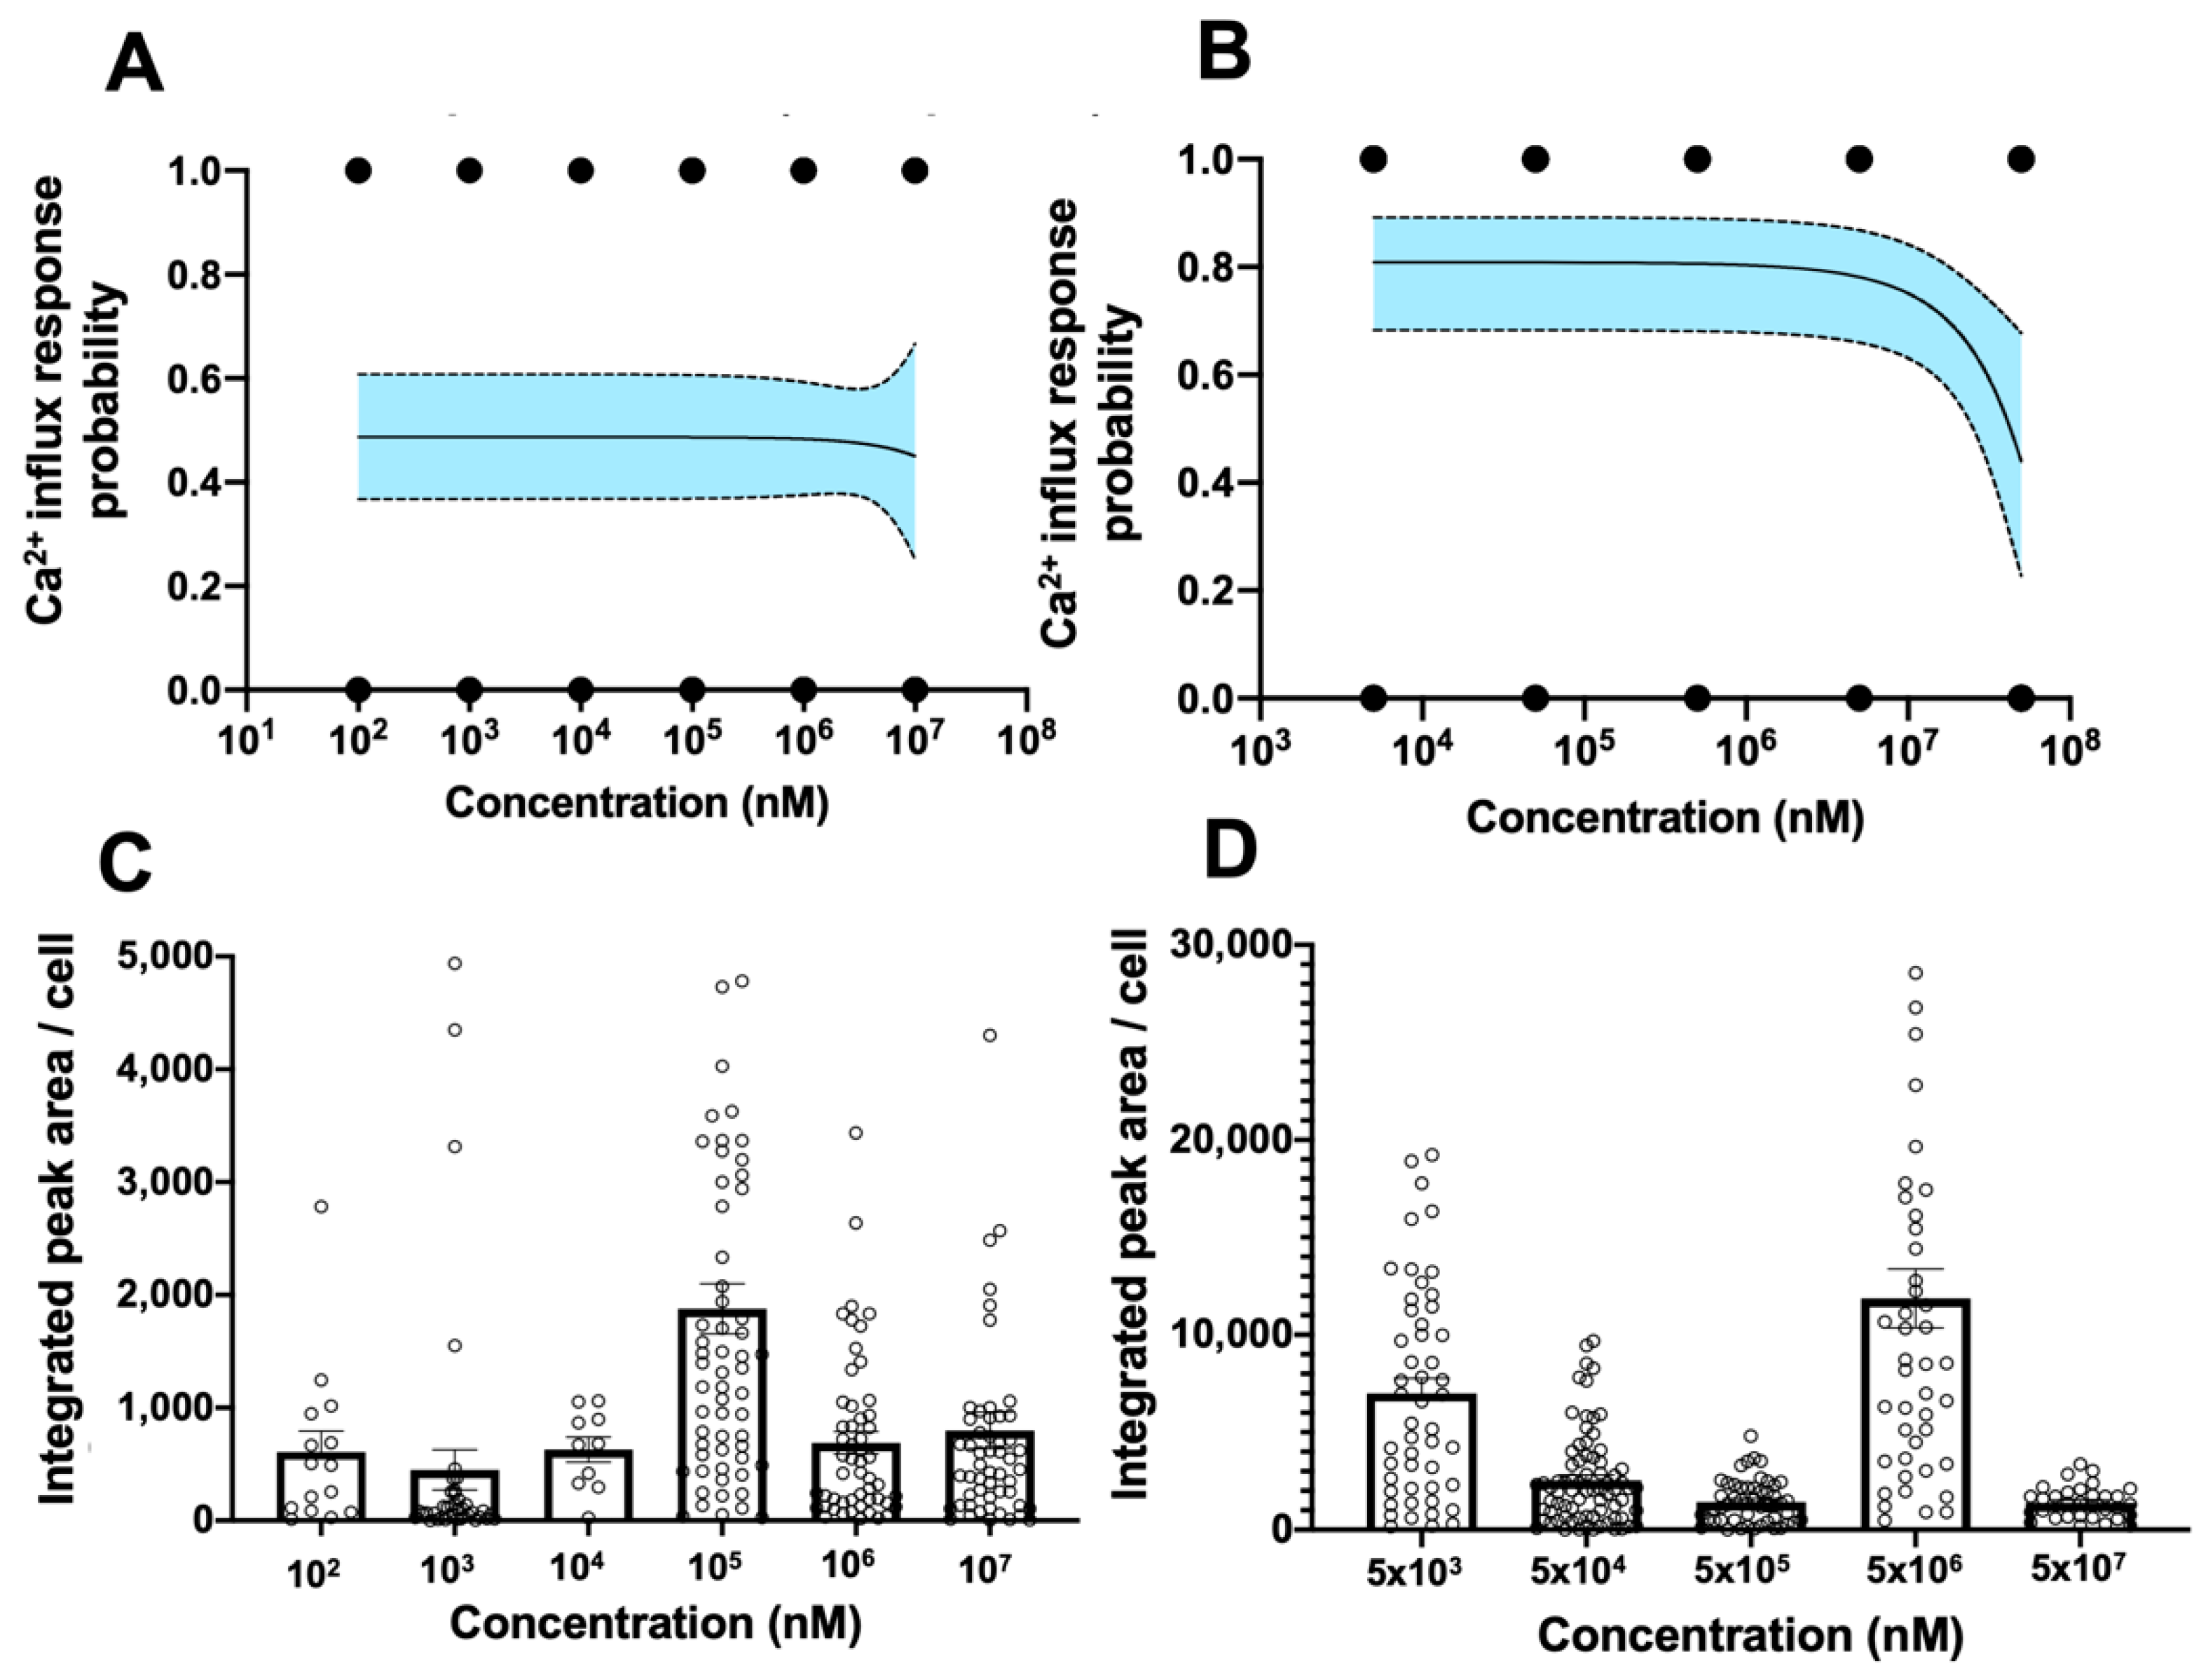
3.4. Establishment of Digitized TRPV1 Activation Assay in Primary hCECs
3.5. Combined Probability of Digitized Readouts from Apoptosis and TRPV1 Activation Assay
4. Conclusions
Supplementary Materials
Author Contributions
Funding
Data Availability Statement
Acknowledgments
Conflicts of Interest
References
- OECD Test No. 492: Reconstructed Human Cornea-like Epithelium (RhCE) Test Method for Identifying Chemicals Not Requiring Classification and Labelling for Eye Irritation or Serious Eye Damage; OECD: Paris, France, 2023. [CrossRef]
- Lotz, C. Alternative methods for the replacement of eye irritation testing. Altex 2016, 33, 55–67. [Google Scholar] [CrossRef] [PubMed]
- Wilson, S.L.; Ahearne, M.; Hopkinson, A. An overview of current techniques for ocular toxicity testing. Toxicology 2015, 327, 32–46. [Google Scholar] [CrossRef] [PubMed]
- Citi, V.; Piragine, E.; Brogi, S.; Ottino, S.; Calderone, V. Development of in vitro corneal models: Opportunity for pharmacological testing. Methods Protoc. 2020, 3, 74. [Google Scholar] [CrossRef] [PubMed]
- Bonneau, N.; Baudouin, C.; Goazigo, A.R.; Brignole-Baudouin, F. An overview of current alternative models in the context of ocular surface toxicity. J. Appl. Toxicol. 2022, 42, 718–737. [Google Scholar] [CrossRef] [PubMed]
- Kandarova, H.; Letasiova, S.; Adriaens, E.; Guest, R.; Willoughby, J.; Drzewiecka, A.; Gruszka, K.; Alépée, N.; Verstraelen, S.; Van Rompay, A.R. CON4EI: EpiOcular™ Eye Irritation Test (EpiOcular™ EIT) for hazard identification and labelling of eye irritating chemicals. Toxicol. Vitr. 2017, 49, 21–33. [Google Scholar] [CrossRef]
- Lee, M.; Hwang, J.-H.; Lim, K.-M. Alternatives to in vivo draize rabbit eye and skin irritation tests with a focus on 3D reconstructed human cornea-like epithelium and epidermis models. Toxicol. Res. 2017, 33, 191–203. [Google Scholar] [CrossRef] [PubMed]
- Leung, C.M.; De Haan, P.; Ronaldson-Bouchard, K.; Kim, G.A.; Ko, J.; Rho, H.S.; Chen, Z.; Habibovic, P.; Jeon, N.L.; Takayama, S.; et al. A guide to the organ-on-a-chip. Nat. Rev. Methods Primers 2022, 2, 33. [Google Scholar] [CrossRef]
- OECD Test No. 491: Short Time Exposure In Vitro Test Method for Identifying i) Chemicals Inducing Serious Eye Damage and ii) Chemicals Not Requiring Classification for Eye Irritation or Serious Eye Damage; OECD: Paris, France, 2023. [CrossRef]
- OECD Test No. 496: In vitro Macromolecular Test Method for Identifying Chemicals Inducing Serious Eye Damage and Chemicals Not Requiring Classification for Eye Irritation or Serious Eye Damage; OECD: Paris, France, 2023. [CrossRef]
- Kapoor, Y.; Howell, B.A.; Chauhan, A. Liposome assay for evaluating ocular toxicity of surfactants. Investig. Opthalmology Vis. Sci. 2009, 50, 2727–2735. [Google Scholar] [CrossRef]
- Hayashi, T.; Itagaki, H.; Fukuda, T.; Tamura, U.; Kato, S. Multivariate factorial analysis of data obtained in seven in vitro test systems for predicting eye irritancy. Toxicol. Vitr. 1994, 8, 215–220. [Google Scholar] [CrossRef]
- van Smeden, M.; Moons, K.G.; de Groot, J.A.; Collins, G.S.; Altman, D.G.; Eijkemans, M.J.; Reitsma, J.B. Sample size for binary logistic prediction models: Beyond events per variable criteria. Stat. Methods Med. Res. 2019, 28, 2455–2474. [Google Scholar] [CrossRef]
- Degot, S.; Auzan, M.; Chapuis, V.; Béghin, A.; Chadeyras, A.; Nelep, C.; Calvo-Muñoz, M.L.; Young, J.; Chatelain, F.; Fuchs, A. Improved visualization and quantitative analysis of drug effects using micropatterned cells. JoVE (J. Vis. Exp.) 2010, 46, e2514. [Google Scholar] [CrossRef]
- Comes, N.; Gasull, X.; Callejo, G. Proton sensing on the ocular surface: Implications in eye pain. Front. Pharmacol. 2021, 12, 773871. [Google Scholar] [CrossRef] [PubMed]
- Fakih, D.; Migeon, T.; Moreau, N.; Baudouin, C.; Goazigo, A.R.-L.; Parsadaniantz, S.M. Transient receptor potential channels: Important players in ocular pain and dry eye disease. Pharmaceutics 2022, 14, 1859. [Google Scholar] [CrossRef] [PubMed]
- Schneider, C.A.; Rasband, W.S.; Eliceiri, K.W. NIH Image to ImageJ: 25 years of image analysis. Nat. Methods 2012, 9, 671–675. [Google Scholar] [CrossRef] [PubMed]
- Schindelin, J.; Arganda-Carreras, I.; Frise, E.; Kaynig, V.; Longair, M.; Pietzsch, T.; Preibisch, S.; Rueden, C.; Saalfeld, S.; Schmid, B.; et al. Fiji: An open-source platform for biological-image analysis. Nat. Methods 2012, 9, 676–682. [Google Scholar] [CrossRef] [PubMed]
- Warmflash, A.; Sorre, B.; Etoc, F.; Siggia, E.D.; Brivanlou, A.H. A method to recapitulate early embryonic spatial patterning in human embryonic stem cells. Nat. Methods 2014, 11, 847–854. [Google Scholar] [CrossRef] [PubMed]
- Saito, K.; Miyazawa, M.; Nukada, Y.; Ei, K.; Abo, T.; Sakaguchi, H. Predictive performance of the Short Time Exposure test for identifying eye irritation potential of chemical mixtures. Toxicol. Vitr. 2015, 29, 617–620. [Google Scholar] [CrossRef] [PubMed]
- Takahashi, Y.; Koike, M.; Honda, H.; Ito, Y.; Sakaguchi, H.; Suzuki, H.; Nishiyama, N. Development of the short time exposure (STE) test: An in vitro eye irritation test using SIRC cells. Toxicol. Vitr. 2008, 22, 760–770. [Google Scholar] [CrossRef] [PubMed]
- Hayashi, K.; Mori, T.; Abo, T.; Koike, M.; Takahashi, Y.; Sakaguchi, H.; Nishiyama, N. A tiered approach combining the short time exposure (STE) test and the bovine corneal opacity and permeability (BCOP) assay for predicting eye irritation potential of chemicals. J. Toxicol. Sci. 2012, 37, 269–280. [Google Scholar] [CrossRef]
- Lilja, J.; Lindegren, H.; Forsby, A. Surfactant-induced TRPV1 activity—A novel mechanism for eye irritation? Toxicol. Sci. 2007, 99, 174–180. [Google Scholar] [CrossRef]
- Cholewinski, A.; Burgess, G.; Bevan, S. The role of calcium in capsaicin-induced desensitization in rat cultured dorsal root ganglion neurons. Neuroscience 1993, 55, 1015–1023. [Google Scholar] [CrossRef] [PubMed]
- Fritzsche, M.; Fernandes, R.A.; Colin-York, H.; Santos, A.M.; Lee, S.F.; Lagerholm, B.C.; Davis, S.J.; Eggeling, C. CalQuo: Automated, simultaneous single-cell and population-level quantification of global intracellular Ca2+ responses. Sci. Rep. 2015, 5, 16487. [Google Scholar] [CrossRef] [PubMed]
- Lehmann, R.; Hatt, H.; van Thriel, C. Alternative in vitro assays to assess the potency of sensory irritants—Is one TRP channel enough? Neurotoxicology 2017, 60, 178–186. [Google Scholar] [CrossRef] [PubMed]
- Lebrun, S.; Nguyen, L.; Chavez, S.; Chan, R.; Le, D.; Nguyen, M.; Jester, J.V. Same-chemical comparison of nonanimal eye irritation test methods: Bovine corneal opacity and permeability, EpiOcular™, isolated chicken eye, ocular Irritection®, OptiSafe™, and short time exposure. Toxicol. Vitr. 2021, 72, 105070. [Google Scholar] [CrossRef] [PubMed]
- Ye, D.-J.; Kwon, Y.-J.; Baek, H.-S.; Shin, S.; Lee, C.; Yun, J.-W.; Nam, K.T.; Lim, K.-M.; Chun, Y.-J. Discovery of ezrin expression as a potential biomarker for chemically induced ocular irritation using human corneal epithelium cell line and a reconstructed human cornea-like epithelium model. Toxicol. Sci. 2018, 165, 335–346. [Google Scholar] [CrossRef]
- OECD Test No. 467: Defined Approaches for Serious Eye Damage and Eye Irritation; OECD: Paris, France, 2022. [CrossRef]
- Alépée, N.; Adriaens, E.; Abo, T.; Magby, J.; Mewes, K.; Giusti, A. Development of a Defined Approach for Eye hazard identification of chemicals having surfactant properties according to the three UN GHS categories. Toxicol. Vitr. 2023, 89, 105576. [Google Scholar] [CrossRef]


Disclaimer/Publisher’s Note: The statements, opinions and data contained in all publications are solely those of the individual author(s) and contributor(s) and not of MDPI and/or the editor(s). MDPI and/or the editor(s) disclaim responsibility for any injury to people or property resulting from any ideas, methods, instructions or products referred to in the content. |
© 2024 by the authors. Licensee MDPI, Basel, Switzerland. This article is an open access article distributed under the terms and conditions of the Creative Commons Attribution (CC BY) license (https://creativecommons.org/licenses/by/4.0/).
Share and Cite
Arora, S.; Goralczyk, A.; Andra, S.; Lim, S.Y.J.; Toh, Y.-C. Development of a Probability-Based In Vitro Eye Irritation Screening Platform. Bioengineering 2024, 11, 315. https://doi.org/10.3390/bioengineering11040315
Arora S, Goralczyk A, Andra S, Lim SYJ, Toh Y-C. Development of a Probability-Based In Vitro Eye Irritation Screening Platform. Bioengineering. 2024; 11(4):315. https://doi.org/10.3390/bioengineering11040315
Chicago/Turabian StyleArora, Seep, Anna Goralczyk, Sujana Andra, Soon Yew John Lim, and Yi-Chin Toh. 2024. "Development of a Probability-Based In Vitro Eye Irritation Screening Platform" Bioengineering 11, no. 4: 315. https://doi.org/10.3390/bioengineering11040315
APA StyleArora, S., Goralczyk, A., Andra, S., Lim, S. Y. J., & Toh, Y.-C. (2024). Development of a Probability-Based In Vitro Eye Irritation Screening Platform. Bioengineering, 11(4), 315. https://doi.org/10.3390/bioengineering11040315