

The Effect of Transverse Sinus Stenosis Caused by Arachnoid Granulation on Patients with Venous Pulsatile Tinnitus: A Multiphysics Interaction Simulation Investigation

Abstract

1. Introduction
2. Materials and Methods
2.1. Image Data Acquisition
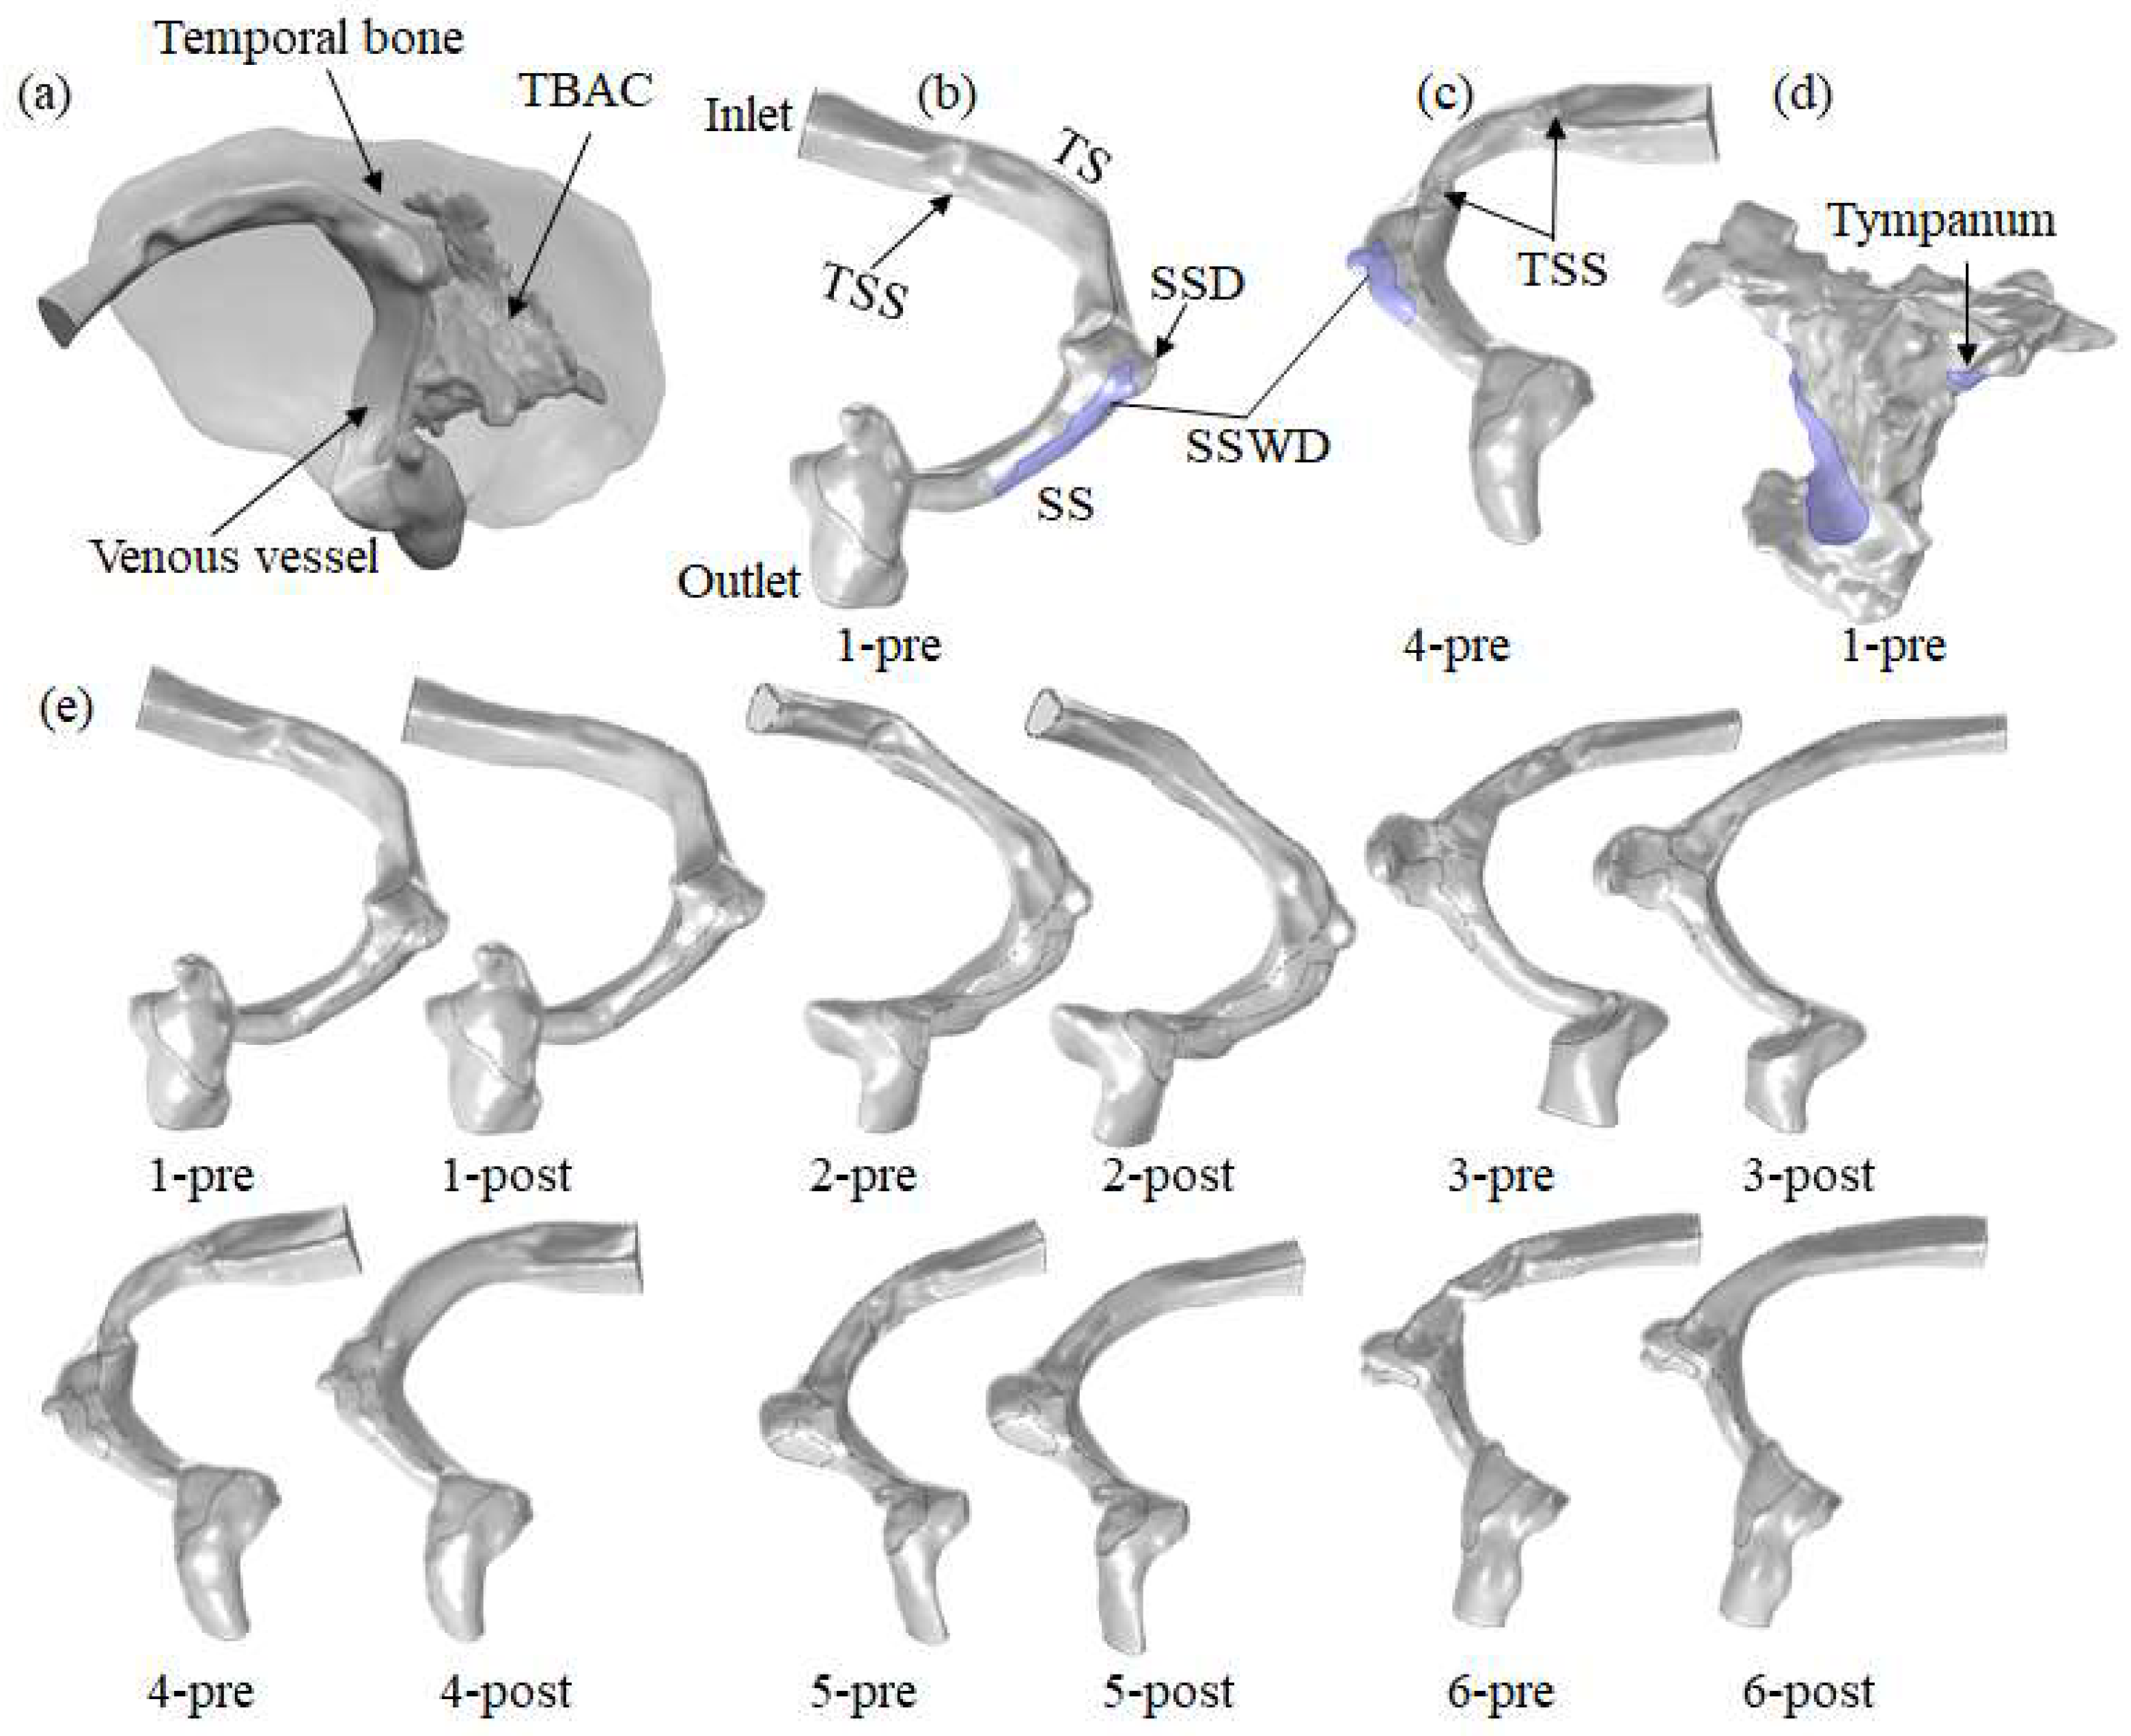
2.2. Model Reconstruction
2.3. Governing Equations
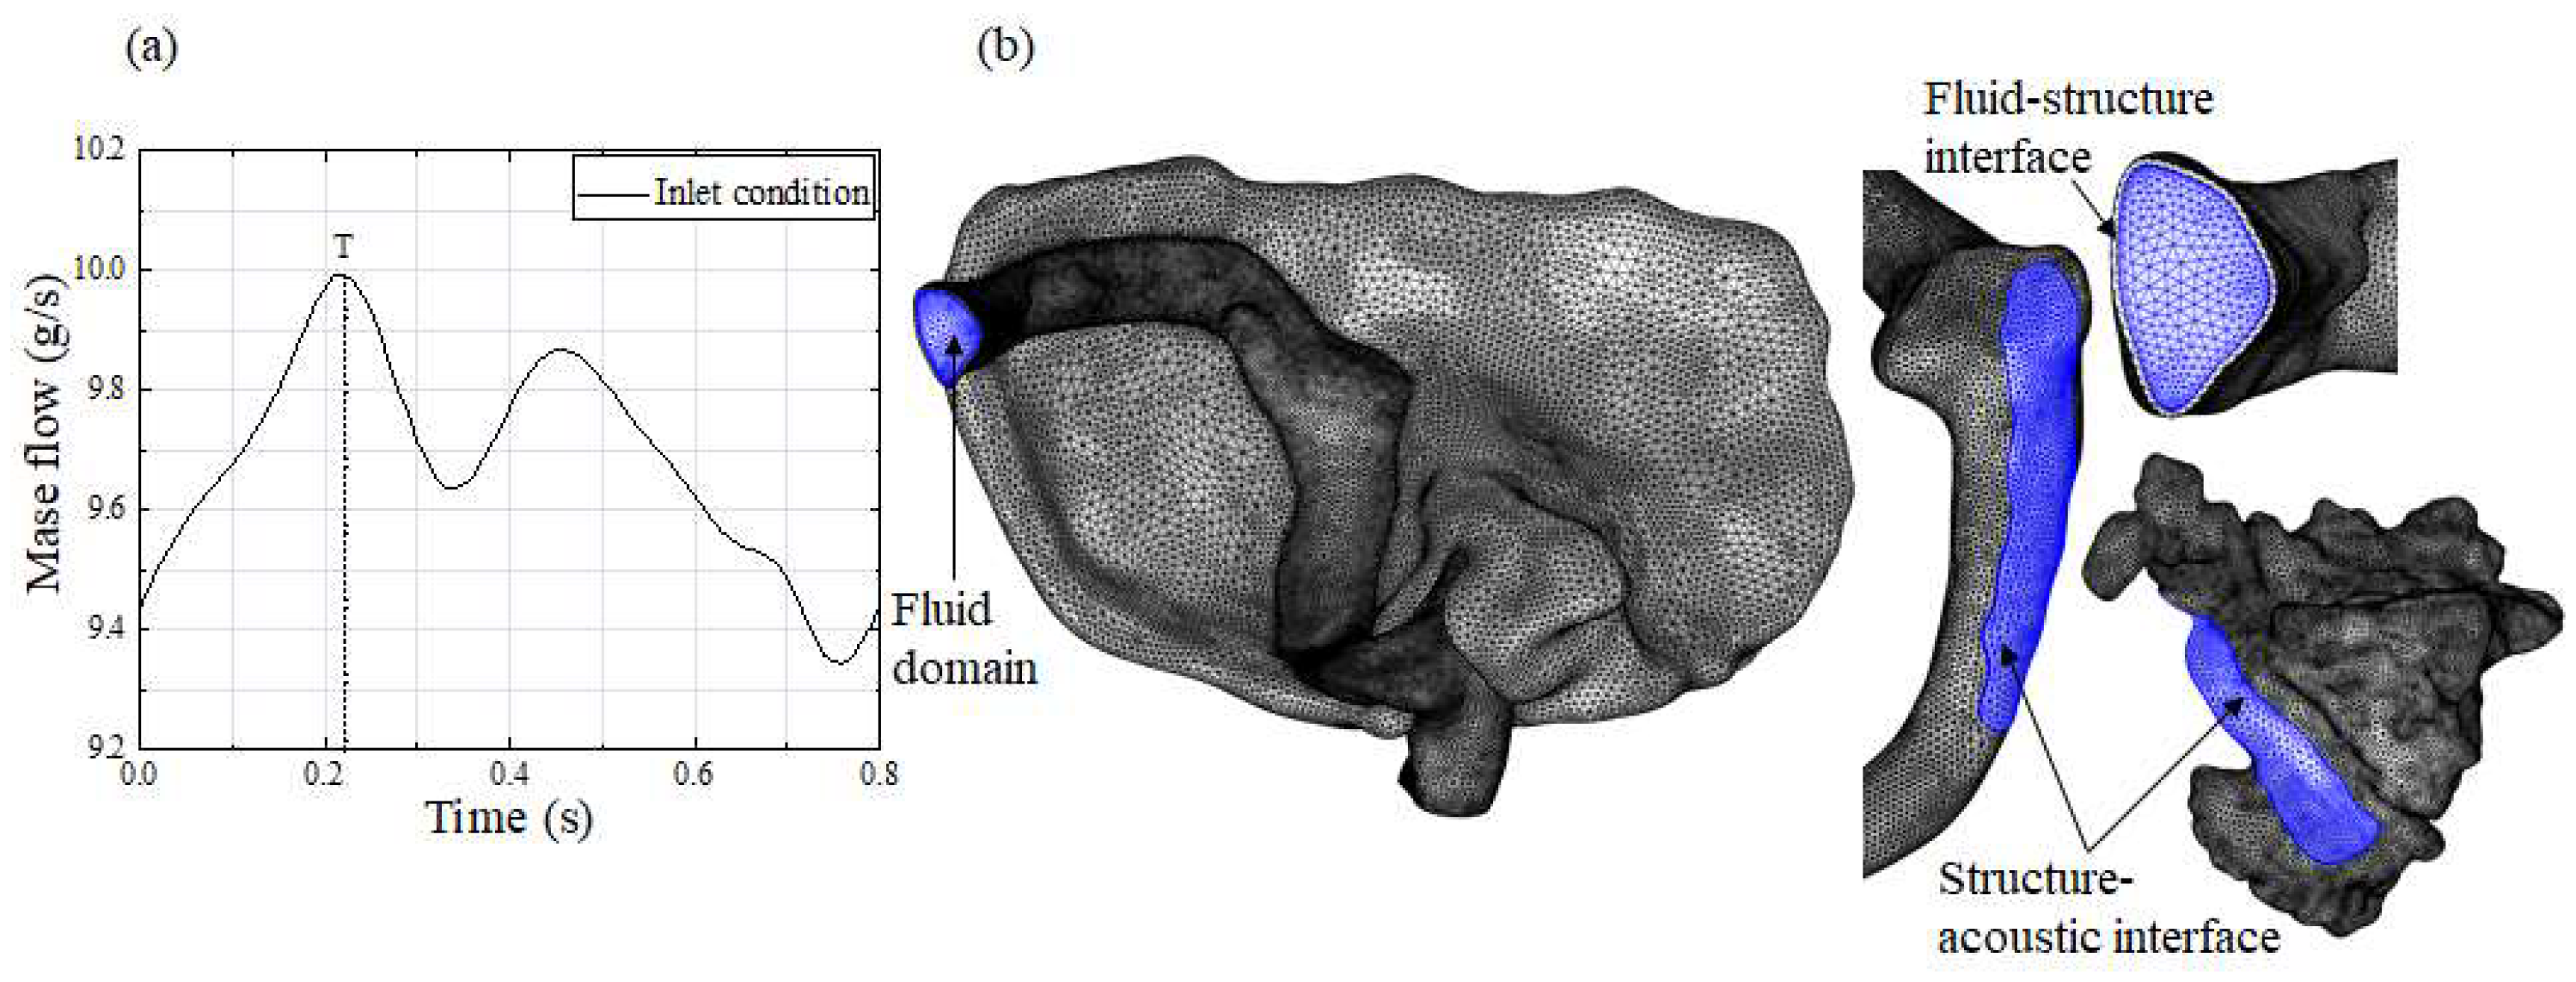
2.4. Boundary Condition and Calculation Setting
2.5. Mesh Generation
2.6. Hemodynamic Analysis
3. Results
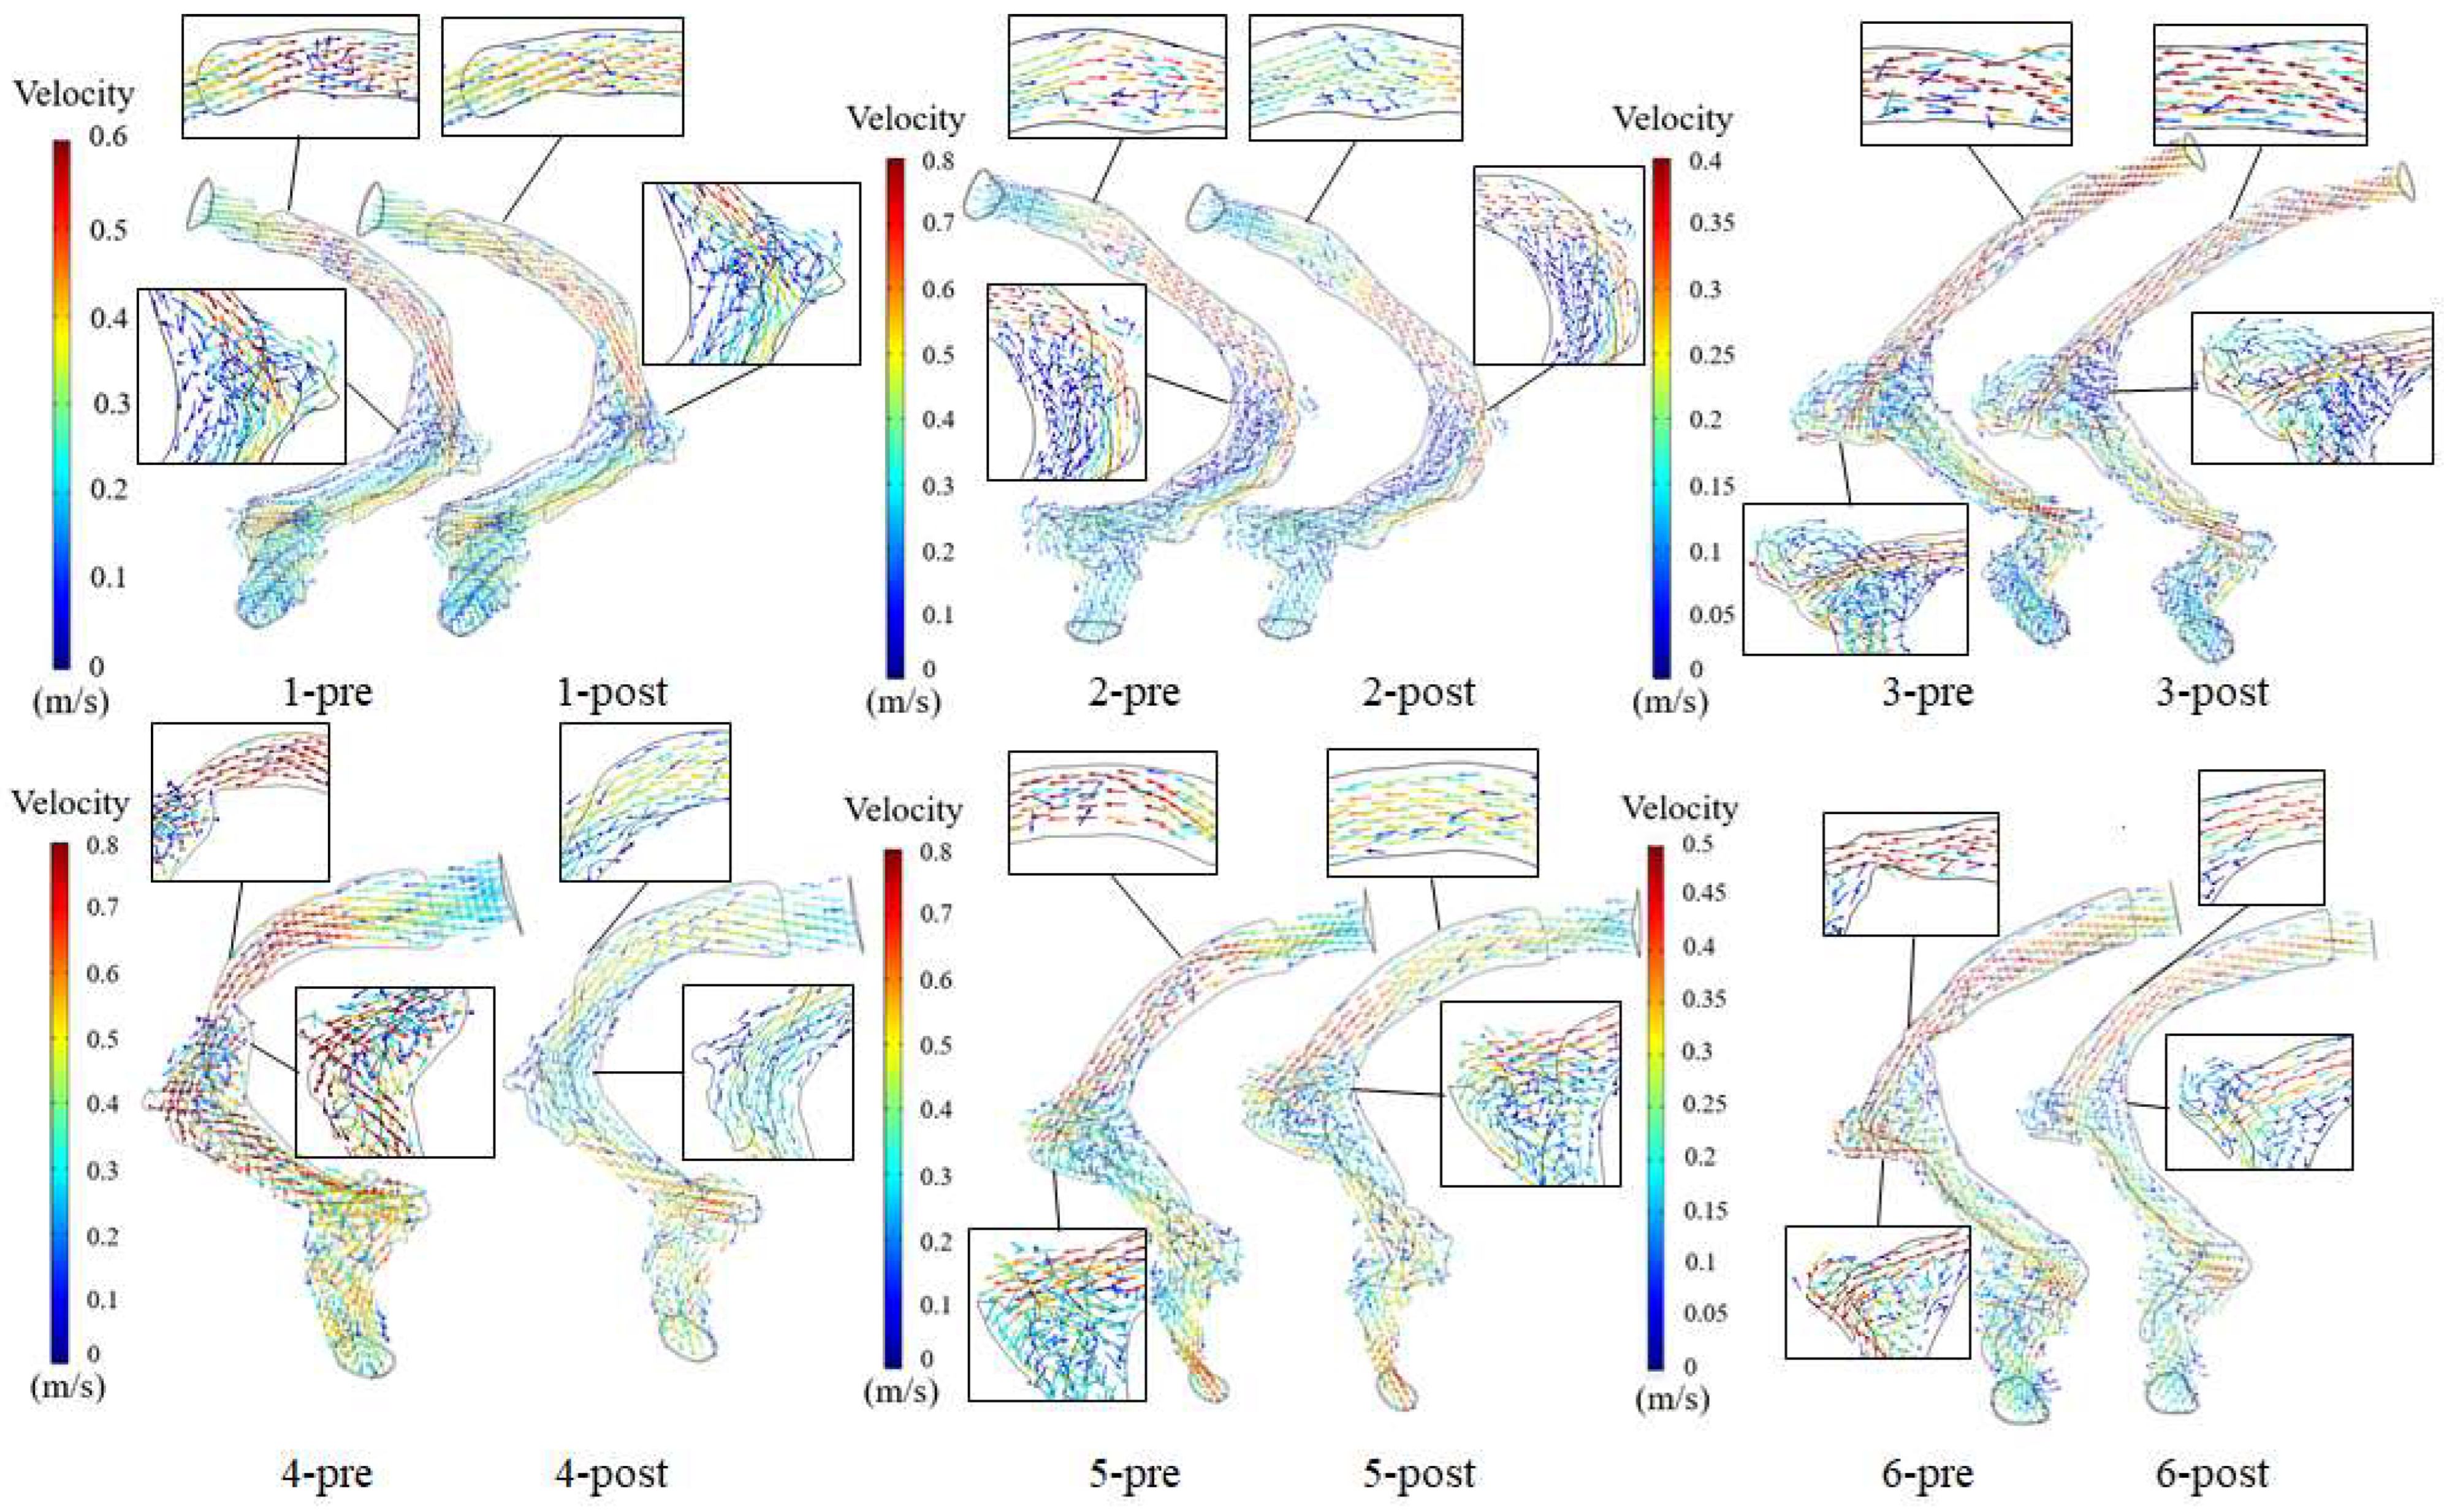
3.1. Velocity Field
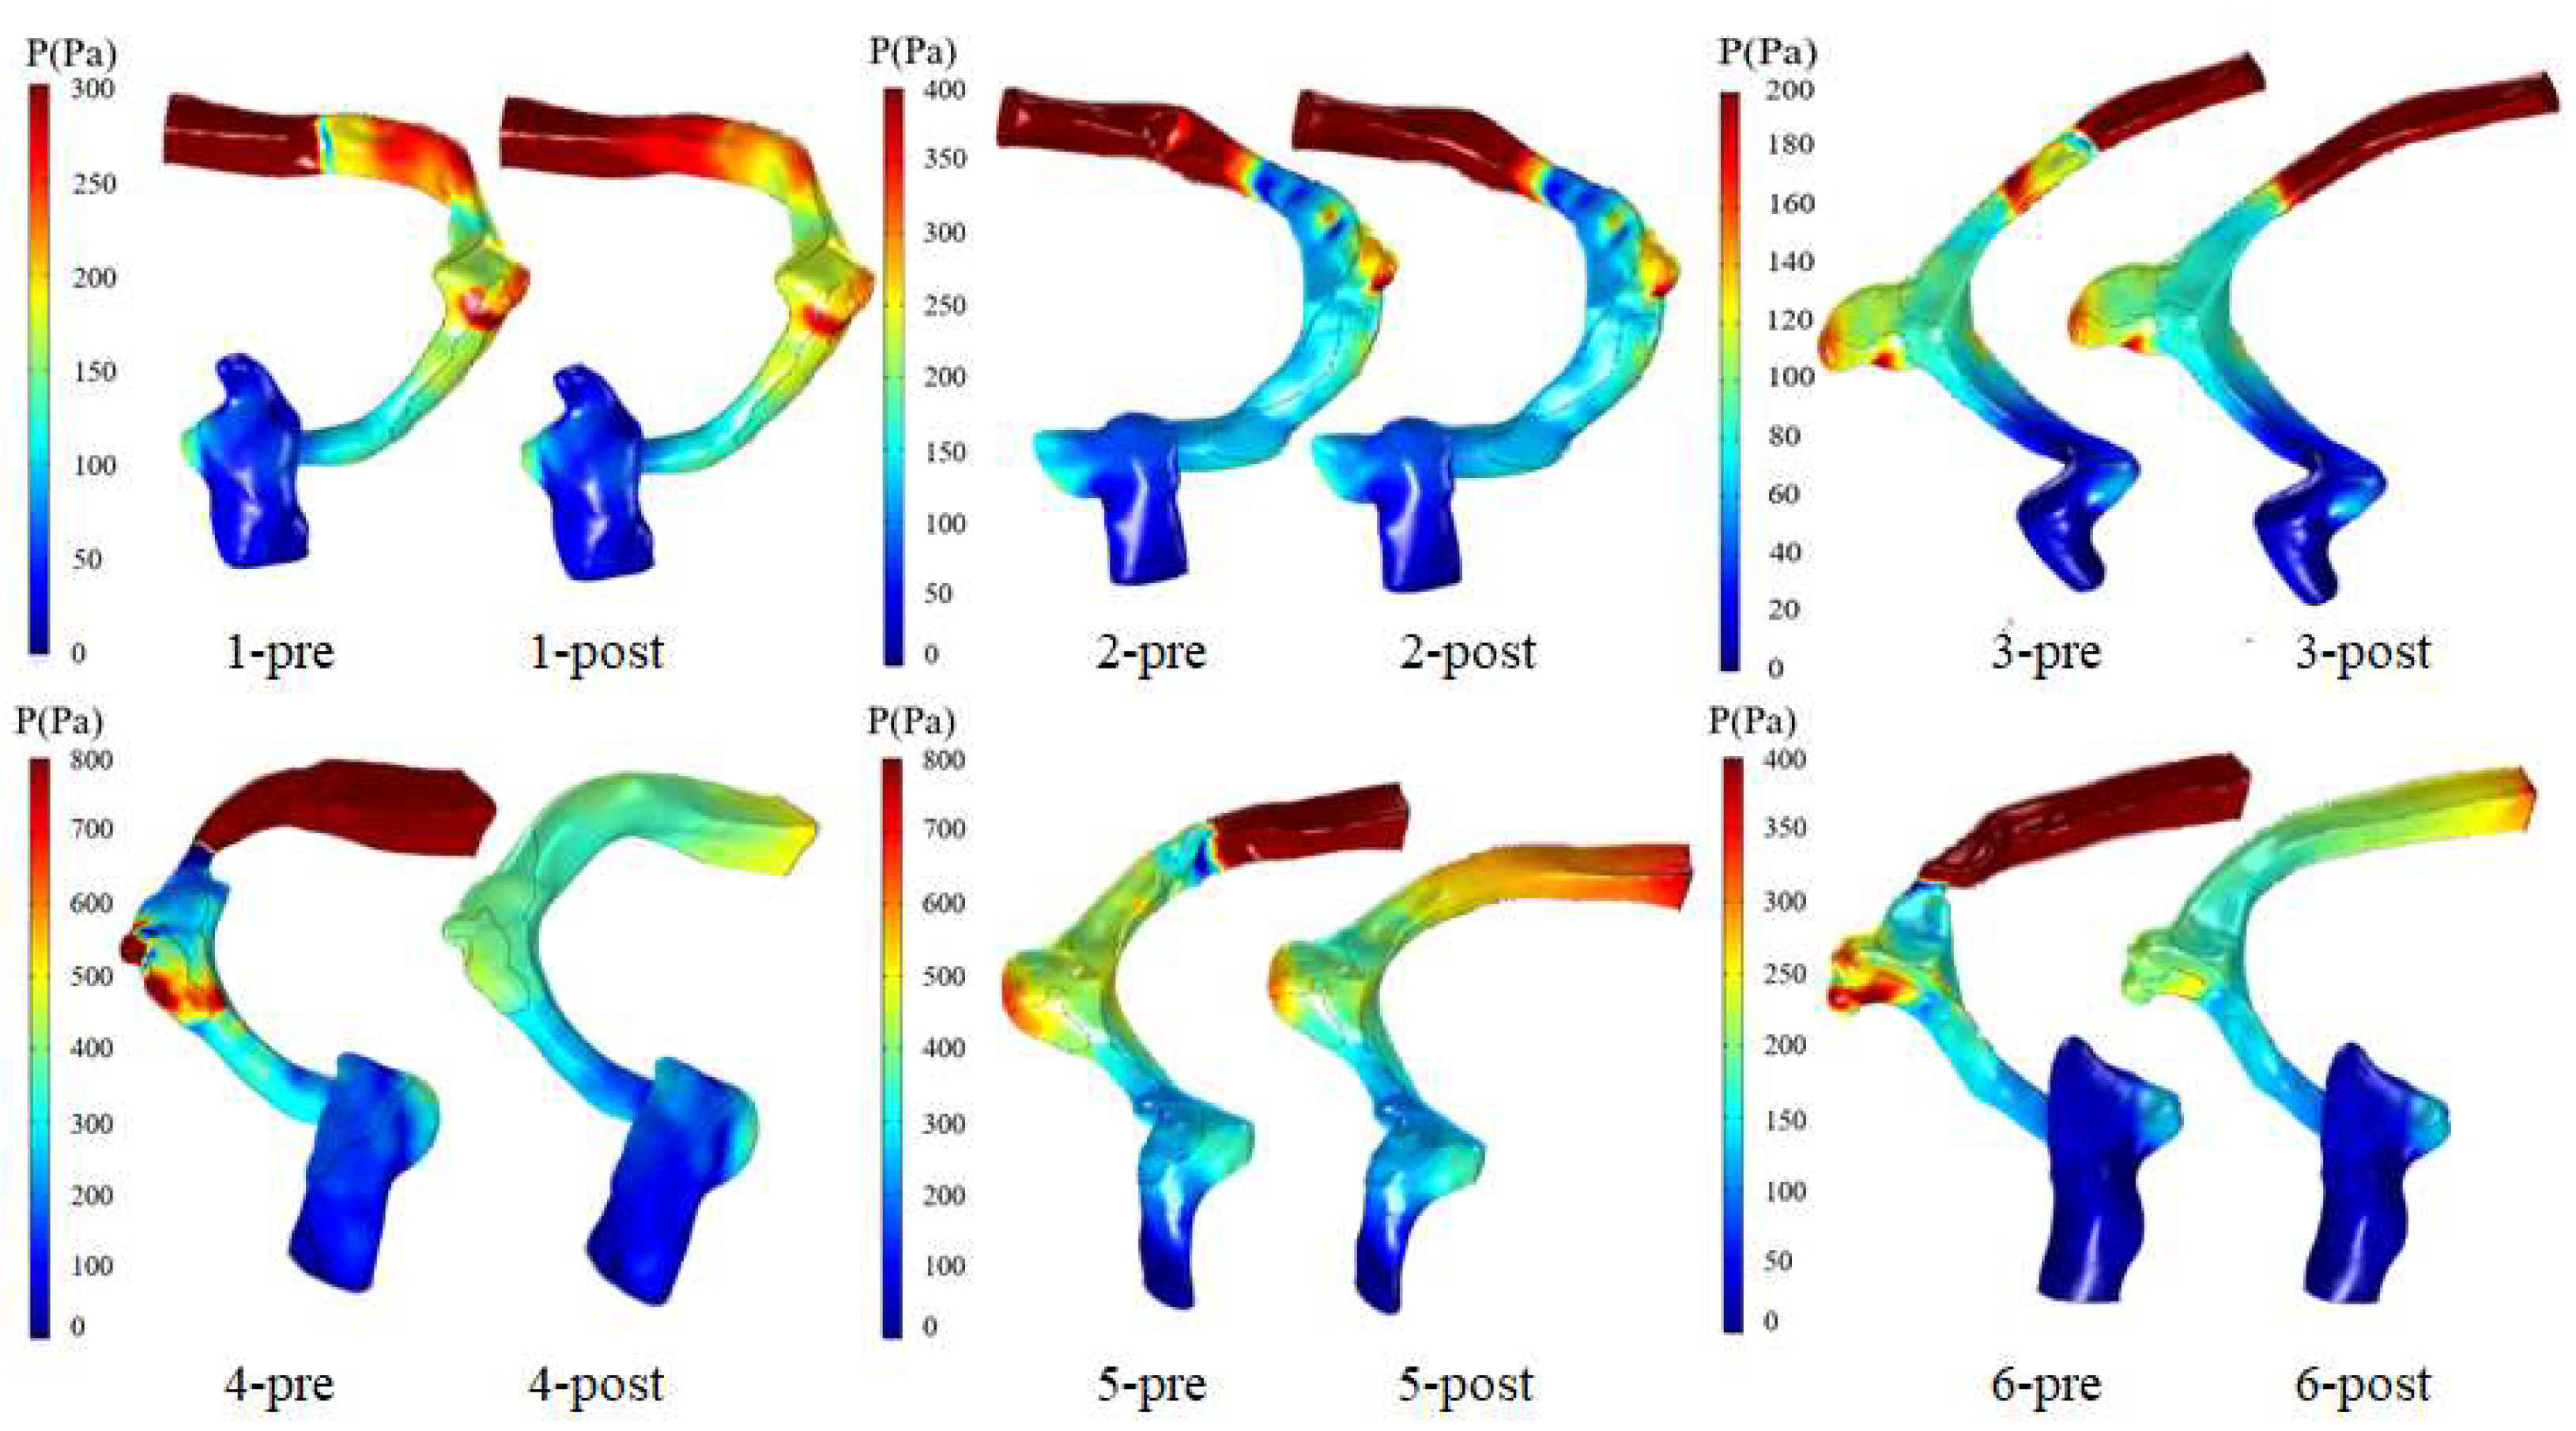
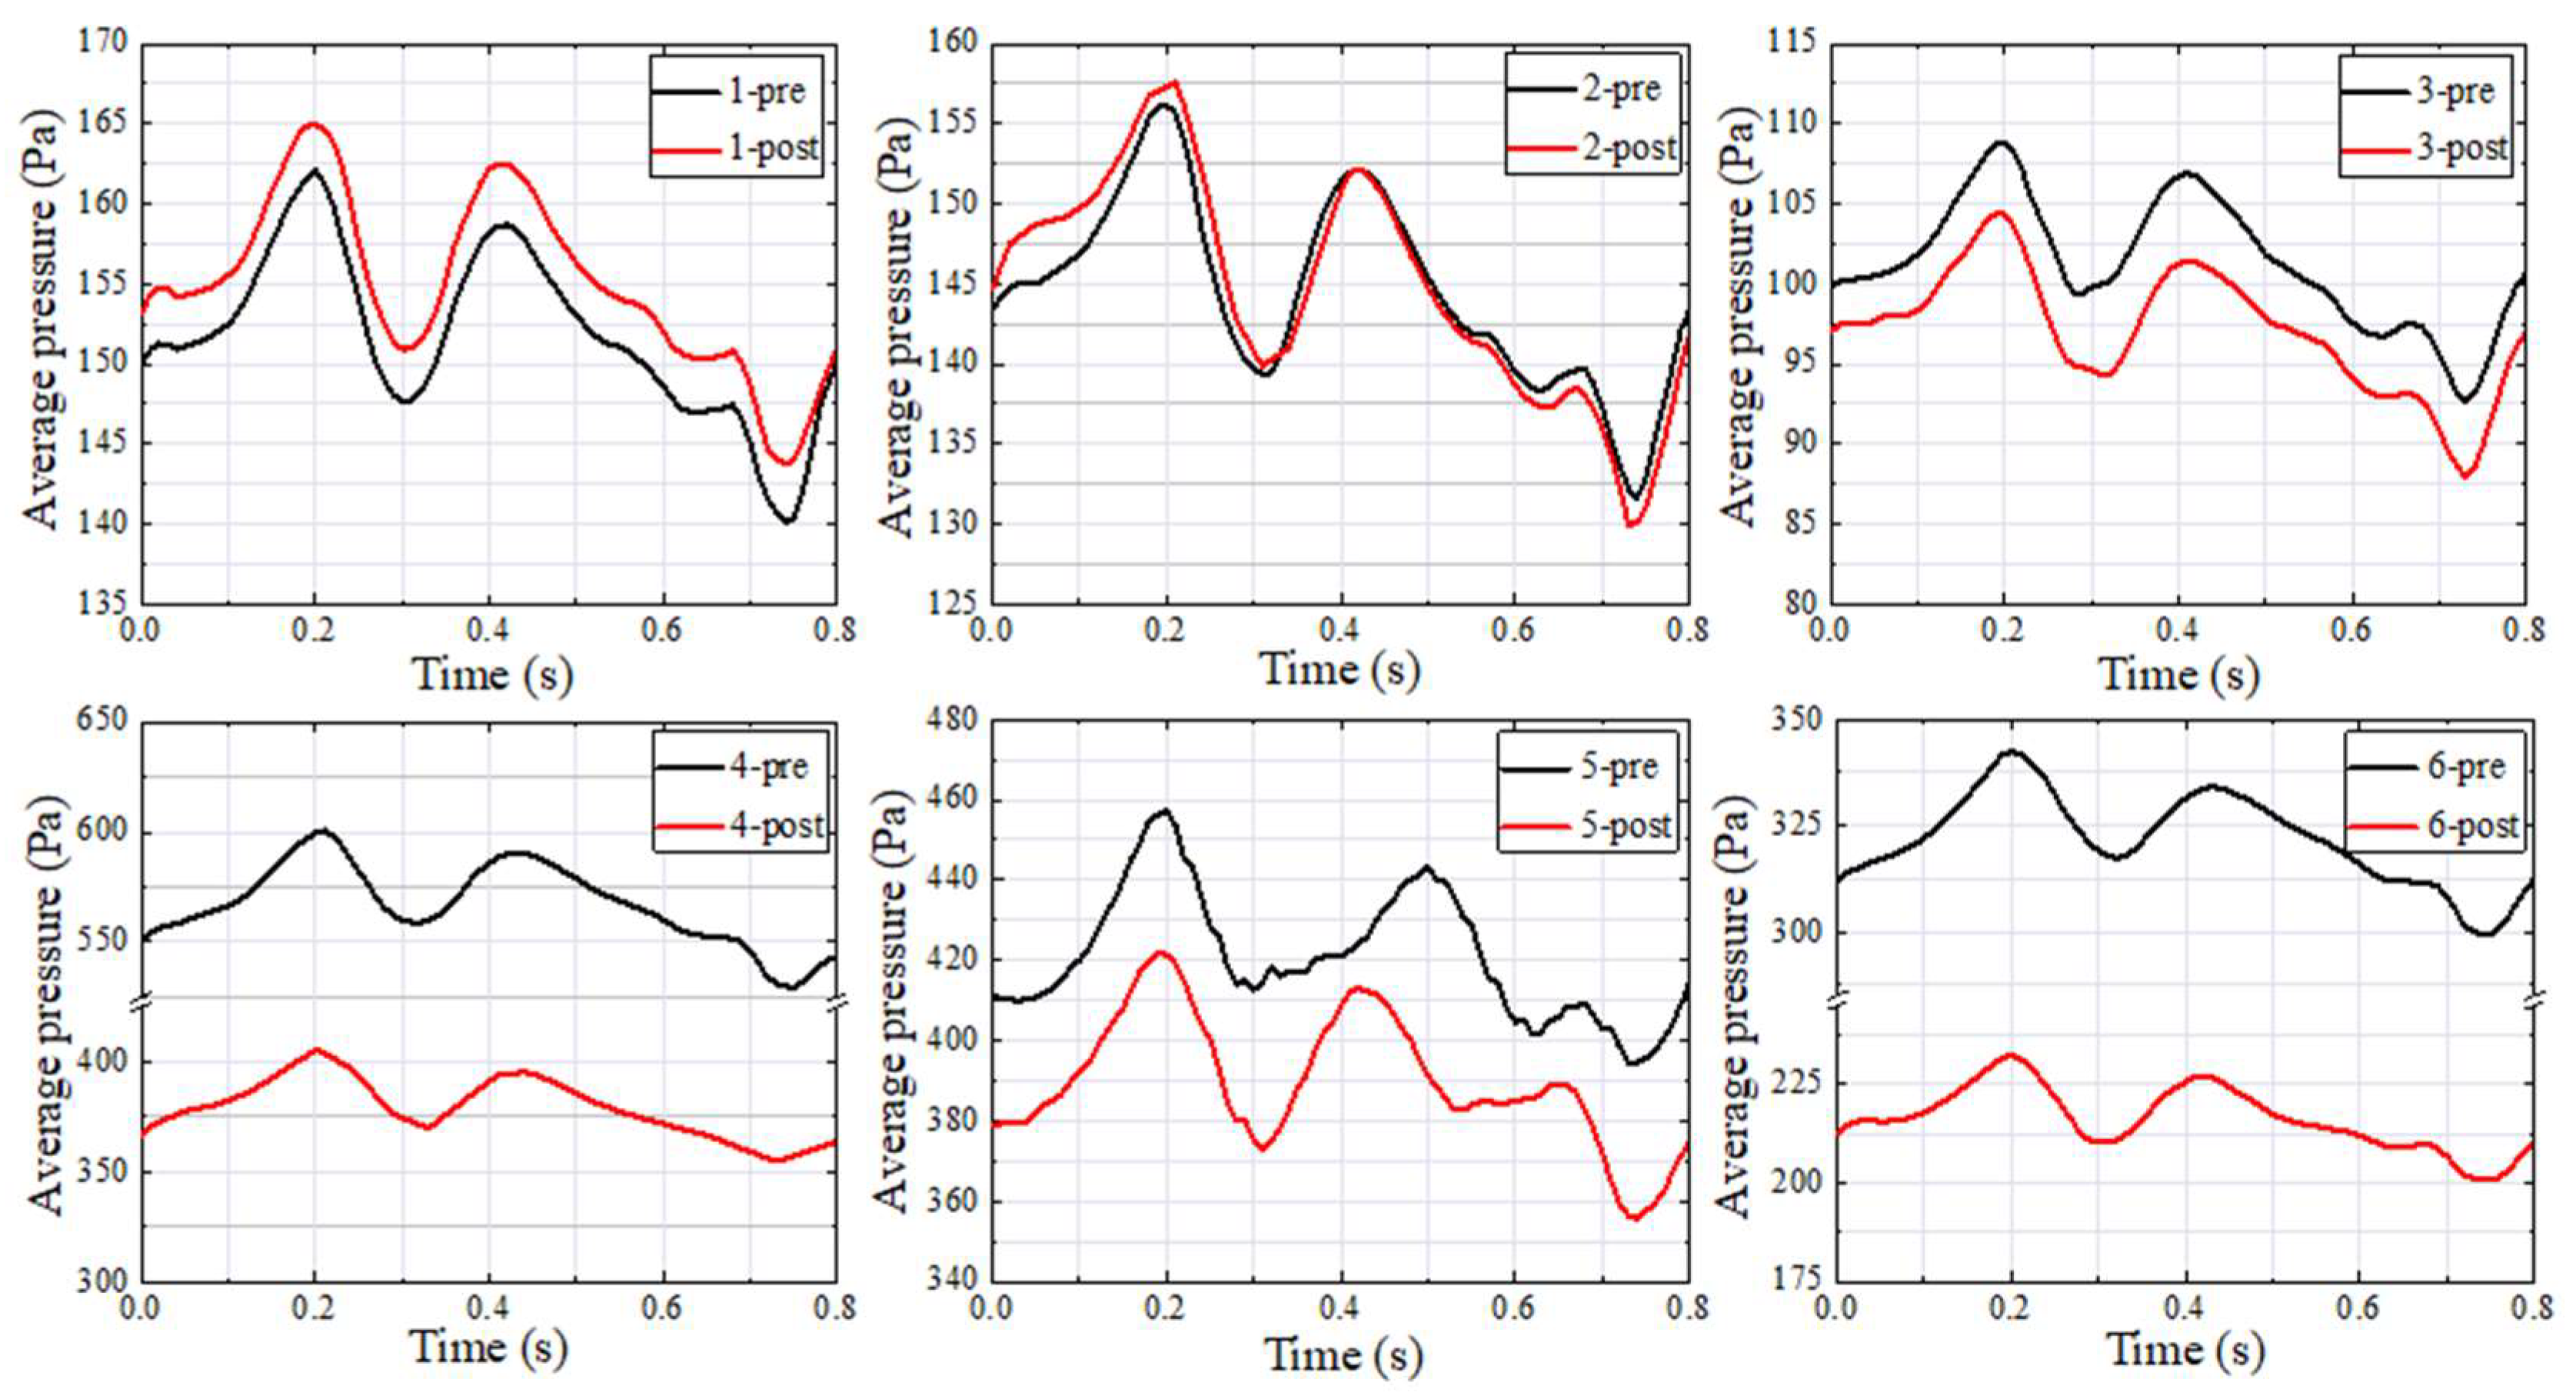
3.2. Wall Pressure
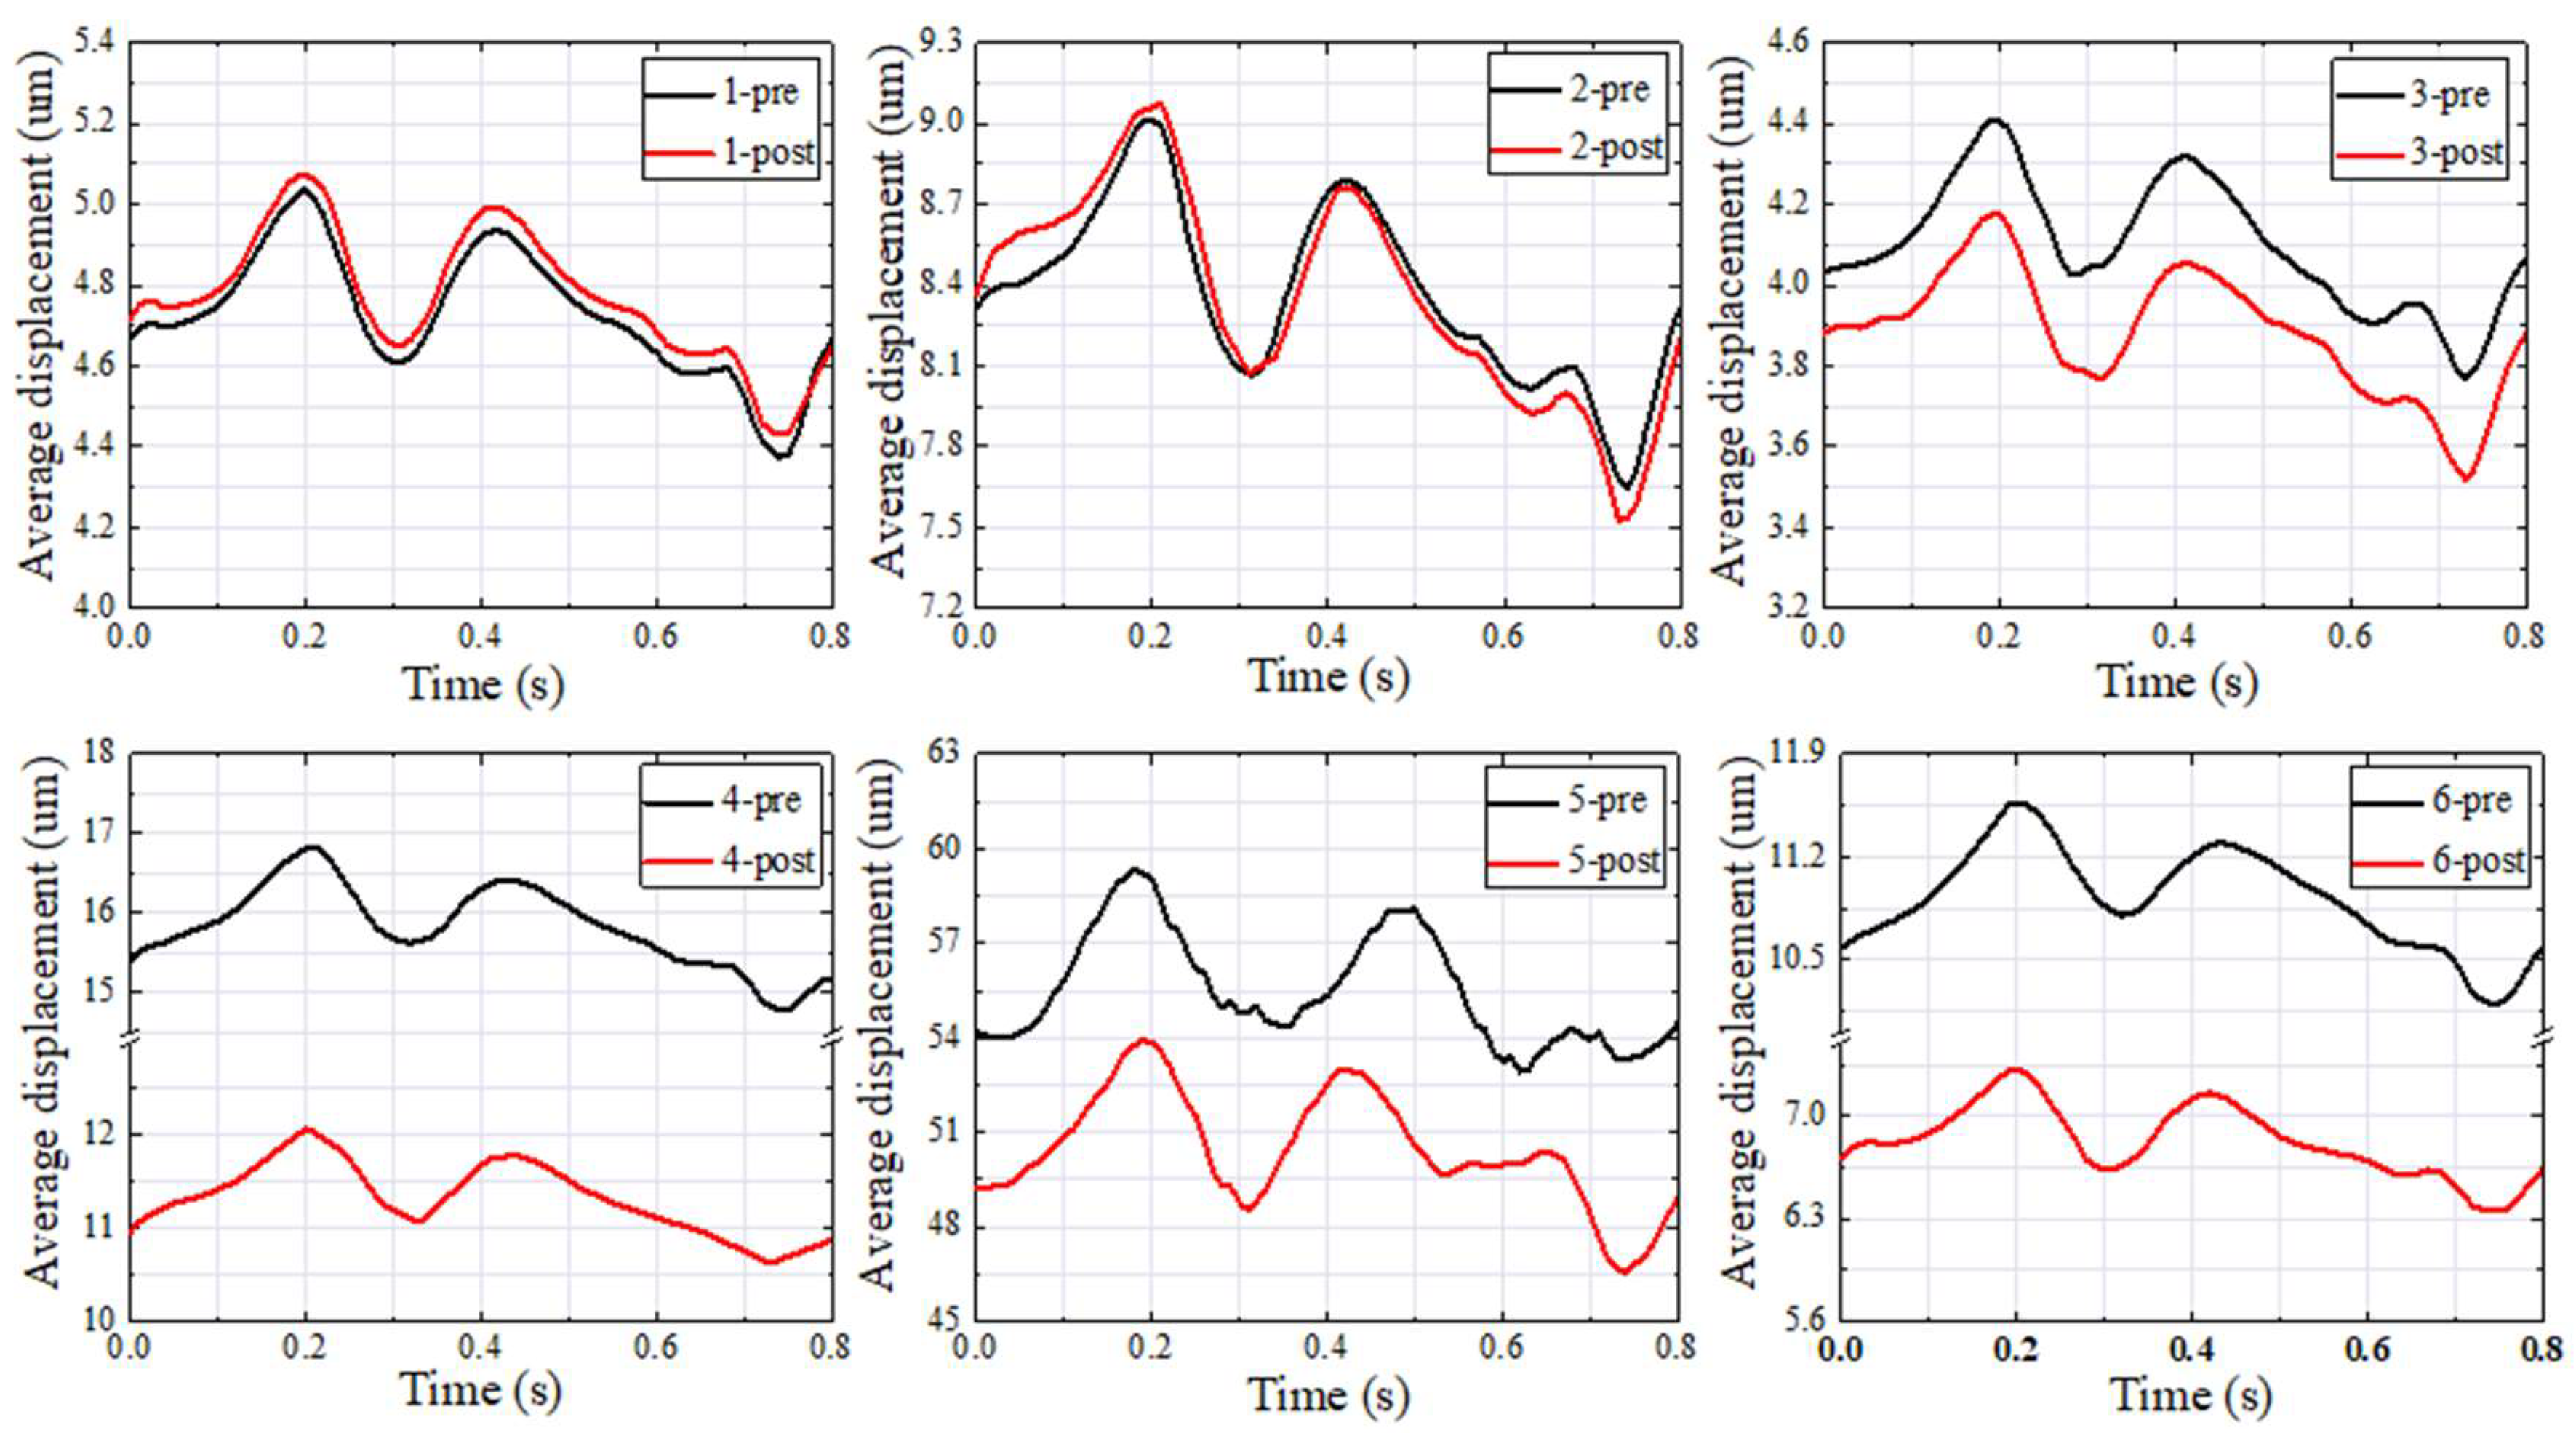
3.3. Vessel Wall Displacement
3.4. Sound Pressure Level
4. Discussion
5. Conclusions
Author Contributions
Funding
Institutional Review Board Statement
Informed Consent Statement
Data Availability Statement
Conflicts of Interest
Nomenclature
| CTA | computed tomography angiography |
| VPT | venous pulsatile tinnitus |
| SS | sigmoid sinus |
| TSS | transverse sinus stenosis |
| SSD | sigmoid sinus diverticulum |
| SSWD | sigmoid sinus wall dehiscence |
| TBAC | temporal bone air cell |
References
- Lv, S.; Yuan, J.-T.; Xie, Q.-W.; Tang, S.-X.; Wang, Y.-W. Analysis of Etiology, Diagnosis, and Treatment Strategy and Efficacy of Pulsatile Tinnitus Caused by Abnormal Vascular Anatomy. Curr. Med. Sci. 2023, 43, 173–183. [Google Scholar] [CrossRef] [PubMed]
- Han, Y.; Xia, J.; Jin, L.; Qiao, A.; Su, T.; Li, Z.; Xiong, J.; Wang, H.; Zhang, Z. Computational fluid dynamics study of the effect of transverse sinus stenosis on the blood flow pattern in the ipsilateral superior curve of the sigmoid sinus. Eur. Radiol. 2021, 31, 6286–6294. [Google Scholar] [CrossRef] [PubMed]
- Baguley, D.; McFerran, D.; Hall, D. Tinnitus. Lancet 2013, 382, 1600–1607. [Google Scholar] [CrossRef] [PubMed]
- Li, Y.; Chen, H.; He, L.; Cao, X.; Wang, X.; Chen, S.; Li, R.; Yuan, C. Hemodynamic assessments of venous pulsatile tinnitus using 4D-flow MRI. Neurology 2018, 91, E586–E593. [Google Scholar] [CrossRef] [PubMed]
- Tian, S.; Wang, L.; Yang, J.; Mao, R.; Liu, Z.; Fan, Y. Sigmoid sinus cortical plate dehiscence induces pulsatile tinnitus through amplifying sigmoid sinus venous sound. J. Biomech. 2017, 52, 68–73. [Google Scholar] [CrossRef] [PubMed]
- Hewes, D.; Morales, R.; Raghavan, P.; Eisenman, D.J. Pattern and severity of transverse sinus stenosis in patients with pulsatile tinnitus associated with sigmoid sinus wall anomalies. Laryngoscope 2020, 130, 1028–1033. [Google Scholar] [CrossRef] [PubMed]
- Mu, Z.; Li, X.; Zhao, D.; Qiu, X.; Dai, C.; Meng, X.; Huang, S.; Gao, B.; Lv, H.; Li, S.; et al. Hemodynamics study on the relationship between the sigmoid sinus wall dehiscence and the blood flow pattern of the transverse sinus and sigmoid sinus junction. J. Biomech. 2022, 135, 111022. [Google Scholar] [CrossRef] [PubMed]
- Han, Y.; Yang, Q.; Yang, Z.; Xia, J.; Su, T.; Yu, J.; Jin, L.; Qiao, A. Computational Fluid Dynamics Simulation of Hemodynamic Alterations in Sigmoid Sinus Diverticulum and Ipsilateral Upstream Sinus Stenosis After Stent Implantation in Patients with Pulsatile Tinnitus. World Neurosurg. 2017, 106, 308–314. [Google Scholar] [CrossRef] [PubMed]
- Guédon, A.; Checkouri, T.; Fantoni, M.; Civelli, V.; Labeyrie, M.-A.; Saint-Maurice, J.-P.; Vallée, F.; Houdart, E. Blood Flow Velocity: A Decision Tool for Stenting Indication in Venous Pulsatile Tinnitus. Clin. Neuroradiol. 2023, 33, 729–737. [Google Scholar] [CrossRef]
- Farid, M.; Alawamry, A.; Zaitoun, M.M.A.; Bessar, A.A.; Darwish, E.A.F. Relentless pulsatile tinnitus secondary to dural sinovenous stenosis: Is endovascular sinus stenting the answer? Clin. Radiol. 2021, 76, 526–531. [Google Scholar] [CrossRef]
- Pereira, V.M.; Cancelliere, N.M.; Najafi, M.; MacDonald, D.; Natarajan, T.; Radovanovic, I.; Krings, T.; Rutka, J.; Nicholson, P.; Steinman, D.A. Torrents of torment: Turbulence as a mechanism of pulsatile tinnitus secondary to venous stenosis revealed by high-fidelity computational fluid dynamics. J. Neurointerventional Surg. 2021, 13, 732–737. [Google Scholar] [CrossRef] [PubMed]
- Mu, Z.; Liu, L.; Sun, Y.; Gao, B.; Lv, H.; Zhao, P.; Liu, Y.; Wang, Z. Multiphysics coupling numerical simulation of flow-diverting stents in the treatment of patients with pulsatile tinnitus. Int. J. Numer. Meth. Biomed. 2021, 37, e3526. [Google Scholar] [CrossRef] [PubMed]
- Cheng, Y.; Oertel, H.; Schenkel, T. Fluid-structure coupled CFD simulation of the left ventricular flow during filling phase. Ann. Biomed. Eng. 2005, 33, 567–576. [Google Scholar] [CrossRef] [PubMed]
- Athani, A.; Ghazali, N.N.N.; Badruddin, I.A.; Kamangar, S.; Anqi, A.E.; Algahtani, A. Investigation of two-way fluid-structure interaction of blood flow in a patient-specific left coronary artery. Bio-Med. Mater. Eng. 2022, 33, 13–30. [Google Scholar] [CrossRef] [PubMed]
- Zhu, Z.; Ji, S.; Liang, L.; Wang, H.; Xia, H.; Tang, P. Hemodynamic study of blood flow in the aorta during the interventional robot treatment using fluid-structure interaction. Biomech. Model Mechanobiol. 2023, 22, 1857–1872. [Google Scholar] [CrossRef] [PubMed]
- Tian, S.; Fan, X.; Wang, Y.; Liu, Z.; Wang, L. A study on relationship between pulsatile tinnitus and temporal bone pneumatization grade. Comput. Methods Biomech. Biomed. Eng. 2019, 22, 788–796. [Google Scholar] [CrossRef] [PubMed]
- Hsieh, Y.L.; Xu, X.; Hsieh, Y.D.; Hsieh, Y.C.; Wang, D.; Guo, P.; Wang, W. Hydroacoustic analysis and extraluminal compression surgical insights of venous pulsatile tinnitus. Auris Nasus Larynx 2021, 48, 852–863. [Google Scholar] [CrossRef] [PubMed]
- Mu, Z.; Zhuang, L.; Zhao, P.; Gao, B.; Liu, Y.; Wang, Z.; Yang, S.; Wang, X. Multiphysics Interaction Analysis of the Therapeutic Effects of the Sigmoid Sinus Wall Reconstruction in Patients with Venous Pulsatile Tinnitus. Bioengineering 2023, 10, 715. [Google Scholar] [CrossRef] [PubMed]
- Cho, S.W.; Kim, S.W.; Sung, M.H.; Ro, K.C.; Ryou, H.S. Fluid-structure interaction analysis on the effects of vessel material properties on blood flow characteristics in stenosed arteries under axial rotation. Korea-Aust. Rheol. J. 2011, 23, 7–16. [Google Scholar] [CrossRef]
- Lofink, P.; Mueller, W. Numerical Modeling of Fluid-Structure Interaction of Blood in a Vein by Simulating Conservation of Mass and Linear Momentum with the Finite Element Method in FEniCS. PAMM 2013, 13, 209–210. [Google Scholar] [CrossRef]
- Du, C.F.; Mo, Z.J.; Tian, S.; Wang, L.Z.; Fan, J.; Liu, S.Y.; Fan, Y.B. Biomechanical investigation of thoracolumbar spine in different postures during ejection using a combined finite element and multi-body approach. Int. J. Numer. Meth. Biomed. 2014, 30, 1121–1131. [Google Scholar] [CrossRef] [PubMed]
- Hudde, H.; Engel, A. Measuring and modeling basic properties of the human middle ear and ear canal. Part III: Eardrum impedances, transfer functions and model calculations. Acta Acust. United Acust. 1998, 84, 1091–1108. [Google Scholar]
- Hudde, H.; Engel, A. Measuring and Modeling Basic Properties of the Human Middle Ear and Ear Canal. Part II: Ear Canal, Middle Ear Cavities, Eardrum, and Ossicles. Acta Acust. United Acust. 1998, 84, 894–913. [Google Scholar]
- Valluru, K.; Parkhill, J.; Gautam, A.; Haraldsson, H.; Kao, E.; Leach, J.; Wright, A.; Ballweber, M.; Meisel, K.; Saloner, D.; et al. Sound Measurement in Patient-Specific 3D Printed Bench Models of Venous Pulsatile Tinnitus. Otol. Neurotol. 2020, 41, E7–E14. [Google Scholar] [CrossRef] [PubMed]
- Huang, S.; Li, X.; Xue, X.; Qiu, X.; Mu, Z.; Fu, M.; Gao, B.; Zhao, P.; Wang, Z. Hemodynamic study of the therapeutic effects of the different degrees of sigmoid sinus diverticulum reconstruction on patients. Med. Eng. Phys. 2020, 86, 8–15. [Google Scholar] [CrossRef] [PubMed]
- Shim, Y.J.; Lee, H.; Park, S.-M.; Kim, D.; Koo, J.-W.; Song, J.-J. Causes and outcomes of revision surgery in subjects with pulsatile tinnitus. Front. Neurol. 2023, 14, 1215636. [Google Scholar] [CrossRef] [PubMed]
- Patsalides, A.; Santillan, A.; Sundararajan, S.H.; Michael, M.; Suurna, M.; Alexiades, G. Venous sinus stenting for the treatment of isolated pulsatile tinnitus: Results of a prospective trial. Interv. Neuroradiol. 2021, 27, 266–274. [Google Scholar] [CrossRef] [PubMed]
- Hsieh, Y.-L.; Gao, X.; Chen, X.; Wang, S.; Wang, W. Resurfacing Dehiscence(s) Without Reducing Diverticulum Effectively Silences Pulsatile Tinnitus: Novel Surgical Techniques for Diverticulum and Intraoperative Microphone Monitoring. Otol. Neurotol. 2023, 45, 154–162. [Google Scholar] [CrossRef]
- Li, Z.; Jin, L. Study on the correlation between hemodynamic status of the transverse sinus-sigmoid sinus and the clinical efficacy of sigmoid sinus wall reconstruction. Interv. Neuroradiol. 2021, 28, 687–694. [Google Scholar] [CrossRef]
- Ding, X.; Zhang, X.; Huang, Z.; Feng, X. The Characteristic and Short-Term Prognosis of Tinnitus Associated with Sudden Sensorineural Hearing Loss. Neural Plast. 2018, 2018, 6059697. [Google Scholar] [CrossRef]

| Patients | Age | Gender | Side | Diagnosis |
|---|---|---|---|---|
| 1 | 41 | Female | Left | SSWD+SSD+TSS+HJB |
| 2 | 26 | Female | Left | SSWD+SSD+TSS |
| 3 | 55 | Female | Right | SSWD+SSD+TSS |
| 4 | 61 | Female | Right | SSWD+SSD+TSS+HJB |
| 5 | 53 | Male | Right | SSWD+SSD+TSS |
| 6 | 58 | Female | Right | SSWD+SSD+TSS+HJB |
| Patients | Inlet Area (mm2) | Outlet Area (mm2) | TSS Rate (%) | TSS Position | SSWD Area (mm2) | TBAC Volume (mm3) | Tympanum Area (mm2) |
|---|---|---|---|---|---|---|---|
| 1 | 40.73 | 60.74 | 65.11 | Middle | 129.02 | 5778.50 | 16.74 |
| 2 | 51.31 | 42.31 | 57.93 | Middle | 221.97 | 6517.60 | 63.66 |
| 3 | 22.80 | 58.50 | 60.94 | Middle | 140.74 | 8707.00 | 16.14 |
| 4 | 73.77 | 52.45 | 67.62 | Middle and proximal | 90.25 | 7638.00 | 29.73 |
| 5 | 64.00 | 36.64 | 62.43 | Middle and proximal | 98.15 | 4393.60 | 13.01 |
| 6 | 34.34 | 55.75 | 62.34 | Middle and proximal | 30.75 | 6855.20 | 15.49 |
| Patients | Pavg (Pa) | Davg (um) | SPLavg (dB) | Pavg Difference (Pa) | Davg Difference (um) | SPLavg Difference (dB) |
|---|---|---|---|---|---|---|
| 1–pre | 161.34 | 5.02 | 69.63 | −3.33 | −0.04 | −0.30 |
| 1–post | 164.67 | 5.06 | 69.93 | |||
| 2–pre | 155.72 | 8.99 | 78.89 | −1.90 | −0.09 | −1.02 |
| 2–post | 157.62 | 9.08 | 79.90 | |||
| 3–pre | 108.32 | 4.39 | 62.42 | 4.68 | 0.24 | −0.32 |
| 3–post | 103.64 | 4.15 | 62.74 | |||
| 4–pre | 600.71 | 16.83 | 67.35 | 196.69 | 4.80 | 9.27 |
| 4–post | 404.02 | 12.03 | 58.08 | |||
| 5–pre | 469.67 | 60.78 | 96.05 | 50.39 | 7.17 | 11.25 |
| 5–post | 419.27 | 53.61 | 84.80 | |||
| 6–pre | 341.92 | 11.56 | 59.72 | 110.44 | 4.27 | 18.40 |
| 6–post | 231.48 | 7.29 | 41.32 |
Disclaimer/Publisher’s Note: The statements, opinions and data contained in all publications are solely those of the individual author(s) and contributor(s) and not of MDPI and/or the editor(s). MDPI and/or the editor(s) disclaim responsibility for any injury to people or property resulting from any ideas, methods, instructions or products referred to in the content. |
© 2024 by the authors. Licensee MDPI, Basel, Switzerland. This article is an open access article distributed under the terms and conditions of the Creative Commons Attribution (CC BY) license (https://creativecommons.org/licenses/by/4.0/).
Share and Cite
Mu, Z.; Zhao, P.; Yang, S.; Zhuang, L.; Ding, H.; Qiu, X.; Gao, B.; Liu, Y.; Gong, S.; Wang, G.; et al. The Effect of Transverse Sinus Stenosis Caused by Arachnoid Granulation on Patients with Venous Pulsatile Tinnitus: A Multiphysics Interaction Simulation Investigation. Bioengineering 2024, 11, 612. https://doi.org/10.3390/bioengineering11060612
Mu Z, Zhao P, Yang S, Zhuang L, Ding H, Qiu X, Gao B, Liu Y, Gong S, Wang G, et al. The Effect of Transverse Sinus Stenosis Caused by Arachnoid Granulation on Patients with Venous Pulsatile Tinnitus: A Multiphysics Interaction Simulation Investigation. Bioengineering. 2024; 11(6):612. https://doi.org/10.3390/bioengineering11060612
Chicago/Turabian StyleMu, Zhenxia, Pengfei Zhao, Shifeng Yang, Lihui Zhuang, Heyu Ding, Xiaoyu Qiu, Bin Gao, Youjun Liu, Shusheng Gong, Guopeng Wang, and et al. 2024. "The Effect of Transverse Sinus Stenosis Caused by Arachnoid Granulation on Patients with Venous Pulsatile Tinnitus: A Multiphysics Interaction Simulation Investigation" Bioengineering 11, no. 6: 612. https://doi.org/10.3390/bioengineering11060612
APA StyleMu, Z., Zhao, P., Yang, S., Zhuang, L., Ding, H., Qiu, X., Gao, B., Liu, Y., Gong, S., Wang, G., Wang, Z., & Wang, X. (2024). The Effect of Transverse Sinus Stenosis Caused by Arachnoid Granulation on Patients with Venous Pulsatile Tinnitus: A Multiphysics Interaction Simulation Investigation. Bioengineering, 11(6), 612. https://doi.org/10.3390/bioengineering11060612