
Machine Learning and Graph Signal Processing Applied to Healthcare: A Review
 , and
, and
Abstract
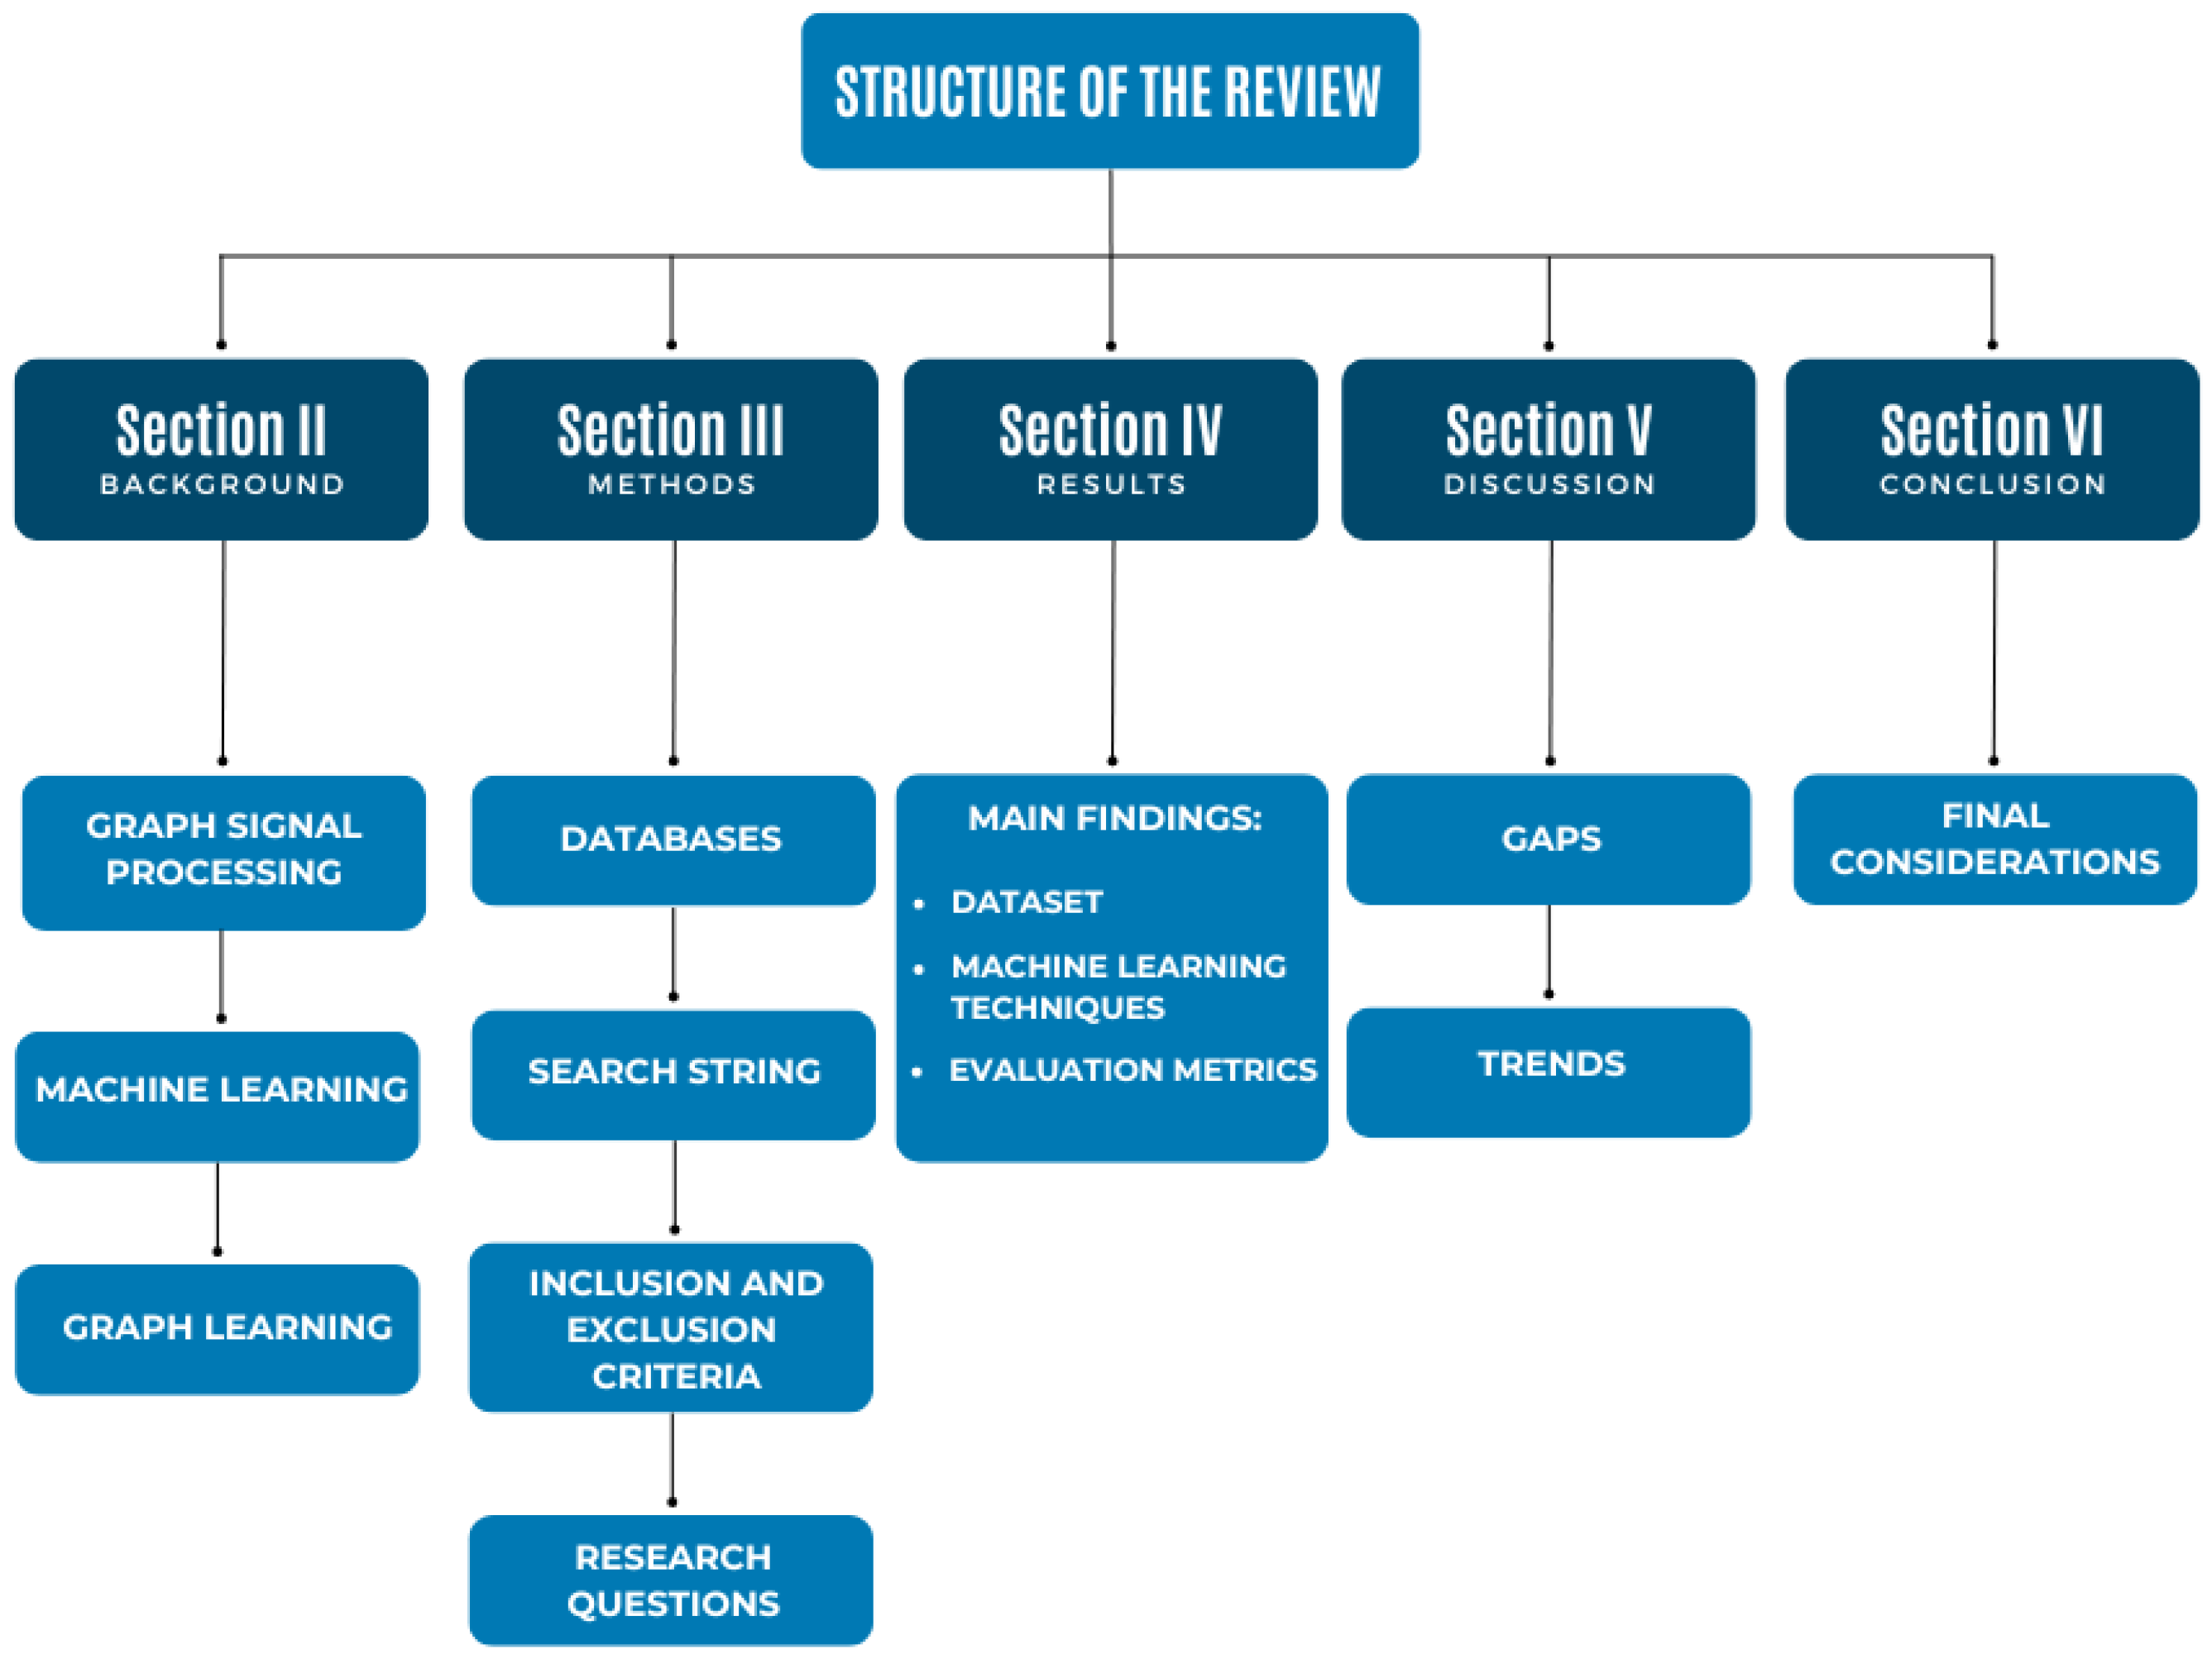
:1. Introduction
- A comprehensive overview of ML and GSP applied to healthcare;
- A panorama of the datasets most used in ML applied to GSP in healthcare and their corresponding description;
- The identification of gaps, open problems, and promising future research directions in ML applied to GSP in healthcare.
2. Background
2.1. Graph Signal Processing
- Spectral graph theory: This is based on the graph Laplacian matrix and considers signals over undirected graphs with real and non-negative weights [1];
- Algebraic signal processing theory: This considers the adjacency matrix, which assumes the role of the elementary operator. This approach is used in signal analysis of directed and undirected graphs, which may have real or complex weights [30].
2.2. Machine Learning and Deep Learning
3. Methods
- 1.
- “Graph signal processing” AND (COVID OR disease);
- 2.
- “Graph signal processing” AND (health OR medical OR medicine) AND (“Neural Network” OR “Machine Learning” OR “Deep Learning”).
- Year of publication;
- First author’s country of affiliation;
- Studied area.
- Dataset (size, type, and characteristics of sample);
- Proposed technique versus the technique used for the comparison;
- Objective of the study;
- Performance metrics.
4. Results
5. Discussion
6. Conclusions
Author Contributions
Funding
Institutional Review Board Statement
Informed Consent Statement
Data Availability Statement
Conflicts of Interest
References
- Sandryhaila, A.; Moura, J.M. Big data analysis with signal processing on graphs: Representation and processing of massive data sets with irregular structure. IEEE Signal Process. Mag. 2014, 31, 80–90. [Google Scholar] [CrossRef]
- Chen, S.; Varma, R.; Sandryhaila, A.; Kovačević, J. Discrete Signal Processing on Graphs: Sampling Theory. IEEE Trans. Signal Process. 2015, 63, 6510–6523. [Google Scholar] [CrossRef]
- Giudici, P.; Sarlin, P.; Spelta, A. The interconnected nature of financial systems: Direct and common exposures. J. Bank. Financ. 2020, 112, 105149. [Google Scholar] [CrossRef]
- Shi, W.; Rajkumar, R. Point-GNN: Graph neural network for 3d object detection in a point cloud. In Proceedings of the IEEE/CVF Conference on Computer Vision and Pattern Recognition, Seattle, WA, USA, 13–19 June 2020; pp. 1711–1719. [Google Scholar]
- Dong, G.; Tang, M.; Wang, Z.; Gao, J.; Guo, S.; Cai, L.; Gutierrez, R.; Campbel, B.; Barnes, L.E.; Boukhechba, M. Graph neural networks in IoT: A survey. ACM Trans. Sens. Netw. 2023, 19, 1–50. [Google Scholar] [CrossRef]
- Jiang, W.; Luo, J. Graph neural network for traffic forecasting: A survey. Expert Syst. Appl. 2022, 207, 117921. [Google Scholar] [CrossRef]
- Ferrer-Cid, P.; Barcelo-Ordinas, J.M.; Garcia-Vidal, J. Data reconstruction applications for IoT air pollution sensor networks using graph signal processing. J. Netw. Comput. Appl. 2022, 205, 103434. [Google Scholar] [CrossRef]
- Majeed, A.; Rauf, I. Graph theory: A comprehensive survey about graph theory applications in computer science and social networks. Inventions 2020, 5, 10. [Google Scholar] [CrossRef]
- Mateos, G.; Segarra, S.; Marques, A.G.; Ribeiro, A. Connecting the dots: Identifying network structure via graph signal processing. IEEE Signal Process. Mag. 2019, 36, 16–43. [Google Scholar] [CrossRef]
- Deng, S.; Wang, S.; Rangwala, H.; Wang, L.; Ning, Y. Cola-GNN: Cross-location attention based graph neural networks for long-term ILI prediction. In Proceedings of the 29th ACM International Conference on Information & Knowledge Management, Virtual Event, Ireland, 19–23 October 2020; pp. 245–254. [Google Scholar]
- Xia, F.; Sun, K.; Yu, S.; Aziz, A.; Wan, L.; Pan, S.; Liu, H. Graph learning: A survey. IEEE Trans. Artif. Intell. 2021, 2, 109–127. [Google Scholar] [CrossRef]
- Wu, Z.; Pan, S.; Chen, F.; Long, G.; Zhang, C.; Philip, S.Y. A comprehensive survey on graph neural networks. IEEE Trans. Neural Netw. Learn. Syst. 2020, 32, 4–24. [Google Scholar] [CrossRef]
- Zhang, Z.; Cui, P.; Zhu, W. Deep learning on graphs: A survey. IEEE Trans. Knowl. Data Eng. 2020, 34, 249–270. [Google Scholar] [CrossRef]
- Zhang, S.; Tong, H.; Xu, J.; Maciejewski, R. Graph convolutional networks: A comprehensive review. Comput. Soc. Netw. 2019, 6, 1–23. [Google Scholar] [CrossRef] [PubMed]
- Kipf, T.N.; Welling, M. Semi-supervised classification with graph convolutional networks. arXiv 2016, arXiv:1609.02907. [Google Scholar]
- Wu, F.; Souza, A.; Zhang, T.; Fifty, C.; Yu, T.; Weinberger, K. Simplifying graph convolutional networks. In Proceedings of the International Conference on Machine Learning, Long Beach, CA, USA, 10–15 June 2019; pp. 6861–6871. [Google Scholar]
- Sun, X.; Man, Y.; Zhao, Y.; He, J.; Liu, N. Incorporating description embeddings into medical knowledge graphs representation learning. In Proceedings of the Human Centered Computing: 4th International Conference, HCC 2018, Mérida, Mexico, 5–7 December 2018; Revised Selected Papers 4. Springer: Cham, Swizerland, 2019; pp. 188–194. [Google Scholar]
- Wu, X.; Duan, J.; Pan, Y.; Li, M. Medical Knowledge Graph: Data Sources, Construction, Reasoning, and Applications. Big Data Min. Anal. 2023, 6, 201–217. [Google Scholar] [CrossRef]
- Bullmore, E.; Sporns, O. The economy of brain network organization. Nat. Rev. Neurosci. 2012, 13, 336–349. [Google Scholar] [CrossRef] [PubMed]
- Van den Heuvel, M.P.; Sporns, O. Network hubs in the human brain. Trends Cogn. Sci. 2013, 17, 683–696. [Google Scholar] [CrossRef]
- Sporns, O. Structure and function of complex brain networks. Dialogues Clin. Neurosci. 2022, 15, 247–262. [Google Scholar] [CrossRef]
- Padole, H.; Joshi, S.D.; Gandhi, T.K. Graph Wavelet-Based Multilevel Graph Coarsening and Its Application in Graph-CNN for Alzheimer’s Disease Detection. IEEE Access 2020, 8, 60906–60917. [Google Scholar] [CrossRef]
- Itani, S.; Thanou, D. Combining anatomical and functional networks for neuropathology identification: A case study on autism spectrum disorder. Med. Image Anal. 2021, 69, 101986. [Google Scholar] [CrossRef] [PubMed]
- Peng, G.; Zhao, K.; Zhang, H.; Xu, D.; Kong, X. Temporal relative transformer encoding cooperating with channel attention for EEG emotion analysis. Comput. Biol. Med. 2023, 106537. [Google Scholar] [CrossRef]
- Einizade, A.; Mozafari, M.; Jalilpour, S.; Bagheri, S.; Sardouie, S.H. Neural decoding of imagined speech from EEG signals using the fusion of graph signal processing and graph learning techniques. Neurosci. Inform. 2022, 2, 100091. [Google Scholar] [CrossRef]
- Bouman, P.M.; Noteboom, S.; Nobrega Santos, F.A.; Beck, E.S.; Bliault, G.; Castellaro, M.; Calabrese, M.; Chard, D.T.; Eichinger, P.; Filippi, M.; et al. Multicenter evaluation of AI-generated DIR and PSIR for cortical and juxtacortical multiple sclerosis lesion detection. Radiology 2023, 307, e221425. [Google Scholar] [CrossRef] [PubMed]
- Ortega, A.; Frossard, P.; Kovačević, J.; Moura, J.M.; Vandergheynst, P. Graph signal processing: Overview, challenges, and applications. Proc. IEEE 2018, 106, 808–828. [Google Scholar] [CrossRef]
- Sandryhaila, A.; Moura, J.M. Discrete signal processing on graphs. IEEE Trans. Signal Process. 2013, 61, 1644–1656. [Google Scholar] [CrossRef]
- Ribeiro, G.B.; Lima, J.B. Graph signal processing in a nutshell. J. Commun. Inf. Syst. 2018, 33. [Google Scholar] [CrossRef]
- Shuman, D.I.; Narang, S.K.; Frossard, P.; Ortega, A.; Vandergheynst, P. The emerging field of signal processing on graphs: Extending high-dimensional data analysis to networks and other irregular domains. IEEE Signal Process. Mag. 2013, 30, 83–98. [Google Scholar] [CrossRef]
- Chung, F.R. Spectral Graph Theory; American Mathematical Society: Washington, DC, USA, 1997; Volume 92. [Google Scholar]
- Bondy, A.; Murty, U. Graph Theory; Springer: London, UK, 2008. [Google Scholar]
- Helm, J.M.; Swiergosz, A.M.; Haeberle, H.S.; Karnuta, J.M.; Schaffer, J.L.; Krebs, V.E.; Spitzer, A.I.; Ramkumar, P.N. Machine learning and artificial intelligence: Definitions, applications, and future directions. Curr. Rev. Musculoskelet. Med. 2020, 13, 69–76. [Google Scholar] [CrossRef] [PubMed]
- Janiesch, C.; Zschech, P.; Heinrich, K. Machine learning and deep learning. Electron. Mark. 2021, 31, 685–695. [Google Scholar] [CrossRef]
- Topuz, B.; Çakici Alp, N. Machine learning in architecture. Autom. Constr. 2023, 154, 105012. [Google Scholar] [CrossRef]
- Mienye, I.D.; Sun, Y. A Survey of Ensemble Learning: Concepts, Algorithms, Applications, and Prospects. IEEE Access 2022, 10, 99129–99149. [Google Scholar] [CrossRef]
- Shailaja, K.; Seetharamulu, B.; Jabbar, M. Machine learning in healthcare: A review. In Proceedings of the 2018 Second International Conference on Electronics, Communication and Aerospace Technology (ICECA), Coimbatore, India, 29–31 March 2018; IEEE: Piscataway, NJ, USA, 2018; pp. 910–914. [Google Scholar]
- Bhardwaj, R.; Nambiar, A.R.; Dutta, D. A study of machine learning in healthcare. In Proceedings of the 2017 IEEE 41st Annual Computer Software and Applications Conference (COMPSAC), Turin, Italy, 4–8 July 2017; IEEE: Piscataway, NJ, USA, 2017; Volume 2, pp. 236–241. [Google Scholar]
- Alloghani, M.; Al-Jumeily, D.; Mustafina, J.; Hussain, A.; Aljaaf, A.J. A systematic review on supervised and unsupervised machine learning algorithms for data science. In Supervised and Unsupervised Learning for Data Science; Springer: Berlin/Heidelberg, Germany, 2020; pp. 3–21. [Google Scholar]
- LeCun, Y.; Bottou, L.; Bengio, Y.; Haffner, P. Gradient-based learning applied to document recognition. Proc. IEEE 1998, 86, 2278–2324. [Google Scholar] [CrossRef]
- LeCun, Y.; Bengio, Y.; Hinton, G. Deep learning. Nature 2015, 521, 436–444. [Google Scholar] [CrossRef] [PubMed]
- Traore, B.B.; Kamsu-Foguem, B.; Tangara, F. Deep convolution neural network for image recognition. Ecol. Inform. 2018, 48, 257–268. [Google Scholar] [CrossRef]
- Badea, M.S.; Felea, I.I.; Florea, L.M.; Vertan, C. The use of deep learning in image segmentation, classification and detection. arXiv 2016, arXiv:1605.09612. [Google Scholar]
- Deng, L.; Yu, D. Deep learning: Methods and applications. Found. Trends® Signal Process. 2014, 7, 197–387. [Google Scholar] [CrossRef]
- Khan, M.; Jan, B.; Farman, H.; Ahmad, J.; Farman, H.; Jan, Z. Deep learning methods and applications. In Deep Learning: Convergence to Big Data Analytics; Springer: Singapore, 2019; pp. 31–42. [Google Scholar]
- Cong, S.; Zhou, Y. A review of convolutional neural network architectures and their optimizations. Artif. Intell. Rev. 2023, 56, 1905–1969. [Google Scholar] [CrossRef]
- Hubel, D.H.; Wiesel, T.N. Receptive fields, binocular interaction and functional architecture in the cat’s visual cortex. J. Physiol. 1962, 160, 106. [Google Scholar] [CrossRef]
- O’Shea, K.; Nash, R. An introduction to convolutional neural networks. arXiv 2015, arXiv:1511.08458. [Google Scholar]
- Barragán-Montero, A.; Javaid, U.; Valdés, G.; Nguyen, D.; Desbordes, P.; Macq, B.; Willems, S.; Vandewinckele, L.; Holmström, M.; Löfman, F.; et al. Artificial intelligence and machine learning for medical imaging: A technology review. Phys. Med. 2021, 83, 242–256. [Google Scholar] [CrossRef]
- Monti, F.; Boscaini, D.; Masci, J.; Rodola, E.; Svoboda, J.; Bronstein, M.M. Geometric deep learning on graphs and manifolds using mixture model CNNs. In Proceedings of the IEEE Conference on Computer Vision and Pattern Recognition, Honolulu, HI, USA, 22–25 July 2017; pp. 5115–5124. [Google Scholar]
- Zhou, J.; Cui, G.; Hu, S.; Zhang, Z.; Yang, C.; Liu, Z.; Wang, L.; Li, C.; Sun, M. Graph neural networks: A review of methods and applications. AI Open 2020, 1, 57–81. [Google Scholar] [CrossRef]
- Defferrard, M.; Bresson, X.; Vandergheynst, P. Convolutional neural networks on graphs with fast localized spectral filtering. Adv. Neural Inf. Process. Syst. 2016, 29. [Google Scholar]
- Khambhati, A.N.; Sizemore, A.E.; Betzel, R.F.; Bassett, D.S. Modeling and interpreting mesoscale network dynamics. NeuroImage 2018, 180, 337–349. [Google Scholar] [CrossRef] [PubMed]
- Dong, S.; Wang, P.; Abbas, K. A survey on deep learning and its applications. Comput. Sci. Rev. 2021, 40, 100379. [Google Scholar] [CrossRef]
- Li, R.; Yuan, X.; Radfar, M.; Marendy, P.; Ni, W.; O’Brien, T.J.; Casillas-Espinosa, P.M. Graph Signal Processing, Graph Neural Network and Graph Learning on Biological Data: A Systematic Review. IEEE Rev. Biomed. Eng. 2023, 16, 109–135. [Google Scholar] [CrossRef] [PubMed]
- Yin, D.; Kaiser, M. Understanding neural flexibility from a multifaceted definition. NeuroImage 2021, 235, 118027. [Google Scholar] [CrossRef] [PubMed]
- Tian, Y.; Liu, M.; Sun, Y.; Fu, S. When liver disease diagnosis encounters deep learning: Analysis, challenges, and prospects. iLIVER 2023, 2, 73–87. [Google Scholar] [CrossRef]
- Heimerl, F.; Lohmann, S.; Lange, S.; Ertl, T. Word cloud explorer: Text analytics based on word clouds. In Proceedings of the 2014 47th Hawaii International Conference on System Sciences, Waikoloa, HI, USA, 6–9 January 2014; IEEE: Piscataway, NJ, USA, 2014; pp. 1833–1842. [Google Scholar]
- Word cloud analysis of historical changes in the subject matter of public health practice in the United Kingdom. Public Health 2021, 197, 39–41. [CrossRef] [PubMed]
- Ratinaud, P. IRaMuTeQ: Interface de R pour les Analyses Multidimensionnelles de Textes et de Questionnaires. Téléchargeable à l’adresse. 2009. Available online: http://www.iramuteq.org (accessed on 20 May 2024).
- McNaught, C.; Lam, P. Using Wordle as a supplementary research tool. Qual. Rep. 2010, 15, 630–643. [Google Scholar] [CrossRef]
- Swain, S.; Jebarajakirthy, C.; Sharma, B.K.; Maseeh, H.I.; Agrawal, A.; Shah, J.; Saha, R. Place Branding: A Systematic Literature Review and Future Research Agenda. J. Travel Res. 2023, 63, 00472875231168620. [Google Scholar] [CrossRef]
- Mandják, T.; Lavissière, A.; Hofmann, J.; Bouchery, Y.; Lavissière, M.C.; Faury, O.; Sohier, R. Port marketing from a multidisciplinary perspective: A systematic literature review and lexicometric analysis. Transp. Policy 2019, 84, 50–72. [Google Scholar] [CrossRef]
- Chaves, M.M.N.; dos Santos, A.P.R.; dos Santosa, N.P.; Larocca, L.M. Use of the software IRAMUTEQ in qualitative research: An experience report. In Computer Supported Qualitative Research; Springer: Cham, Switzerland, 2017; pp. 39–48. [Google Scholar]
- Van Eck, N.; Waltman, L. Software survey: VOSviewer, a computer program for bibliometric mapping. Scientometrics 2010, 84, 523–538. [Google Scholar] [CrossRef] [PubMed]
- Toutain, M.; Elmoataz, A.; Desquesnes, X.; Pruvot, J.H. A Unified Geometric Model for Virtual Slide Image Processing and Classification. IEEE J. Sel. Top. Signal Process. 2016, 10, 151–160. [Google Scholar] [CrossRef]
- Parisot, S.; Ktena, S.I.; Ferrante, E.; Lee, M.; Guerrero, R.; Glocker, B.; Rueckert, D. Disease prediction using graph convolutional networks: Application to Autism Spectrum Disorder and Alzheimer’s disease. Med. Image Anal. 2018, 48, 117–130. [Google Scholar] [CrossRef] [PubMed]
- Pervaiz, U.; Vidaurre, D.; Woolrich, M.W.; Smith, S.M. Optimising network modelling methods for fMRI. NeuroImage 2020, 211, 116604. [Google Scholar] [CrossRef] [PubMed]
- Sardellitti, S.; Barbarossa, S.; Lorenzo, P.D. Graph Topology Inference Based on Sparsifying Transform Learning. IEEE Trans. Signal Process. 2019, 67, 1712–1727. [Google Scholar] [CrossRef]
- Hu, M.; Zhai, G.; Li, D.; Fan, Y.; Duan, H.; Zhu, W.; Yang, X. Combination of near-infrared and thermal imaging techniques for the remote and simultaneous measurements of breathing and heart rates under sleep situation. PLoS ONE 2018, 13, e0190466. [Google Scholar] [CrossRef]
- Zhang, Y.; Tetrel, L.; Thirion, B.; Bellec, P. Functional annotation of human cognitive states using deep graph convolution. NeuroImage 2021, 231, 117847. [Google Scholar] [CrossRef]
- Van Eck, N.J.; Waltman, L. Citation-based clustering of publications using CitNetExplorer and VOSviewer. Scientometrics 2017, 111, 1053–1070. [Google Scholar] [CrossRef] [PubMed]
- Brahim, A.; Farrugia, N. Graph Fourier transform of fMRI temporal signals based on an averaged structural connectome for the classification of neuroimaging. Artif. Intell. Med. 2020, 106, 101870. [Google Scholar] [CrossRef]
- Chen, Y.; Tang, Y.; Wang, C.; Liu, X.; Zhao, L.; Wang, Z. ADHD classification by dual subspace learning using resting-state functional connectivity. Artif. Intell. Med. 2020, 103, 101786. [Google Scholar] [CrossRef]
- Griffa, A.; Amico, E.; Liégeois, R.; Van De Ville, D.; Preti, M.G. Brain structure-function coupling provides signatures for task decoding and individual fingerprinting. NeuroImage 2022, 250, 118970. [Google Scholar] [CrossRef] [PubMed]
- Lei, B.; Zhu, Y.; Yu, S.; Hu, H.; Xu, Y.; Yue, G.; Wang, T.; Zhao, C.; Chen, S.; Yang, P.; et al. Multi-scale enhanced graph convolutional network for mild cognitive impairment detection. Pattern Recognit. 2023, 134, 109106. [Google Scholar] [CrossRef]
- Wang, J.; Xiao, L.; Wilson, T.W.; Stephen, J.M.; Calhoun, V.D.; Wang, Y.P. Examining brain maturation during adolescence using graph Laplacian learning based Fourier transform. J. Neurosci. Methods 2020, 338, 108649. [Google Scholar] [CrossRef]
- Padole, H.; Joshi, S.; Gandhi, T.K. Early Detection of Alzheimer’s Disease using Graph Signal Processing on Neuroimaging Data. In Proceedings of the 2018 2nd European Conference on Electrical Engineering and Computer Science (EECS), Bern, Switzerland, 20–22 December 2018; pp. 302–306. [Google Scholar]
- Hu, C.; Sepulcre, J.; Johnson, K.A.; Fakhri, G.E.; Lu, Y.M.; Li, Q. Matched signal detection on graphs: Theory and application to brain imaging data classification. NeuroImage 2016, 125, 587–600. [Google Scholar] [CrossRef]
- Valenchon, J.; Coates, M. Multiple-graph Recurrent Graph Convolutional Neural Network Architectures for Predicting Disease Outcomes. In Proceedings of the ICASSP 2019—2019 IEEE International Conference on Acoustics, Speech and Signal Processing, Brighton, UK, 12–17 May 2019; pp. 3157–3161. [Google Scholar]
- Sartipi, S.; Torkamani-Azar, M.; Cetin, M. EEG Emotion Recognition via Graph-based Spatio-Temporal Attention Neural Networks. In Proceedings of the 2021 43rd Annual International Conference of the IEEE Engineering in Medicine and Biology Society (EMBC), Virtual, 1–5 November 2021; pp. 571–574. [Google Scholar]
- Guo, Y.; Nejati, H.; Cheung, N.M. Deep neural networks on graph signals for brain imaging analysis. In Proceedings of the 2017 IEEE International Conference on Image Processings (ICIP), Beijing, China, 17–20 September 2017; pp. 3295–3299. [Google Scholar]
- Einizade, A.; Mozafari, M.; Rezaei-Dastjerdehei, M.; Aghdaei, E.; Mijani, A.M.; Hajipour Sardouie, S. Detecting ADHD children based on EEG signals using Graph Signal Processing techniques. In Proceedings of the 2020 27th National and 5th International Iranian Conference on Biomedical Engineering (ICBME), Tehran, Iran, 26–27 November 2020; pp. 264–270. [Google Scholar] [CrossRef]
- Itani, S.; Thanou, D. A Graph Signal Processing Framework for the Classification of Temporal Brain Data. In Proceedings of the 2020 28th European Signal Processing Conference (EUSIPCO), Amsterdam, The Netherlands, 18–21 January 2021; pp. 1180–1184. [Google Scholar]
- Einizade, A.; Sardouie, S.H. A Unified Approach for Simultaneous Graph Learning and Blind Separation of Graph Signal Sources. IEEE Trans. Signal Inf. Process. Netw. 2022, 8, 543–555. [Google Scholar] [CrossRef]
- Omidvarnia, A.; Liégeois, R.; Amico, E.; Preti, M.G.; Zalesky, A.; Van De Ville, D. On the Spatial Distribution of Temporal Complexity in Resting State and Task Functional MRI. Entropy 2022, 24, 1148. [Google Scholar] [CrossRef]
- Saeidi, M.; Karwowski, W.; Farahani, F.V.; Fiok, K.; Hancock, P.A.; Sawyer, B.D.; Christov-Moore, L.; Douglas, P.K. Decoding Task-Based fMRI Data with Graph Neural Networks, Considering Individual Differences. Brain Sci. 2022, 12, 1094. [Google Scholar] [CrossRef]
- Annaby, M.; Said, M.; Eldeib, A.; Rushdi, M. EEG-based motor imagery classification using digraph Fourier transforms and extreme learning machines. Biomed. Signal Process. Control 2021, 69, 102831. [Google Scholar] [CrossRef]
- Pusil, S.; Dimitriadis, S.I.; López, M.E.; Pereda, E.; Maestú, F. Aberrant MEG multi-frequency phase temporal synchronization predicts conversion from mild cognitive impairment-to-Alzheimer’s disease. Neuroimage Clin. 2019, 24, 101972. [Google Scholar] [CrossRef]
- Saboksayr, S.S.; Mateos, G.; Cetin, M. Online discriminative graph learning from multi-class smooth signals. Signal Process. 2021, 186, 108101. [Google Scholar] [CrossRef]
- Zawadzka, T.; Wierciński, T.; Meller, G.; Rock, M.; Zwierzycki, R.; Wróbel, M.R. Graph Representation Integrating Signals for Emotion Recognition and Analysis. Sensors 2021, 21, 4035. [Google Scholar] [CrossRef] [PubMed]
- Deng, J.; Sun, J.; Lu, S.; Yue, K.; Liu, W.; Shi, H.; Zou, L. Exploring neural activity in inflammatory bowel diseases using functional connectivity and DKI-fMRI fusion. Behav. Brain Res. 2023, 443, 114325. [Google Scholar] [CrossRef] [PubMed]
- Ouahidi, Y.E.; Tessier, H.; Lioi, G.; Farrugia, N.; Pasdeloup, B.; Gripon, V. Pruning Graph Convolutional Networks to Select Meaningful Graph Frequencies for FMRI Decoding. In Proceedings of the 2022 30th European Signal Processing Conference (EUSIPCO), Belgrade, Serbia, 29 August–2 September 2022; pp. 937–941. [Google Scholar]
- Einizade, A.; Nasiri, S.; Sardouie, S.H.; Clifford, G.D. ProductGraphSleepNet: Sleep staging using product spatio-temporal graph learning with attentive temporal aggregation. Neural Netw. 2023, 164, 667–680. [Google Scholar] [CrossRef] [PubMed]
- El rai, M.C.; Darweesh, M.; Al-Saad, M. Semi-Supervised Segmentation of Echocardiography Videos Using Graph Signal Processing. Electronics 2022, 11, 3462. [Google Scholar] [CrossRef]
- Edwards, M.; Xie, X.; Palmer, R.I.; Tam, G.K.; Alcock, R.; Roobottom, C. Graph convolutional neural network for multi-scale feature learning. Comput. Vis. Image Underst. 2020, 194, 102881. [Google Scholar] [CrossRef]
- Li, L.; Zhou, J.; Jiang, Y.; Huang, B. Propagation source identification of infectious diseases with graph convolutional networks. J. Biomed. Inform. 2021, 116, 103720. [Google Scholar] [CrossRef]
- Geng, R.; Gao, Y.; Zhang, H.; Zu, J. Analysis of the Spatio-Temporal Dynamics of COVID-19 in Massachusetts via Spectral Graph Wavelet Theory. IEEE Trans. Signal Inf. Process. Netw. 2022, 8, 670–683. [Google Scholar] [CrossRef]
- Lei, X.; Tie, J.; Pan, Y. Inferring Metabolite-Disease Association Using Graph Convolutional Networks. IEEE/ACM Trans. Comput. Biol. Bioinform. 2022, 19, 688–698. [Google Scholar] [CrossRef]
- Zhang, J.; Jiang, Z.; Hu, X.; Song, B. A novel graph attention adversarial network for predicting disease-related associations. Methods 2020, 179, 81–88. [Google Scholar] [CrossRef]
- Bamunu Mudiyanselage, T.; Lei, X.; Senanayake, N.; Zhang, Y.; Pan, Y. Predicting CircRNA disease associations using novel node classification and link prediction models on Graph Convolutional Networks. Methods 2022, 198, 32–44. [Google Scholar] [CrossRef]
- Wang, W.; Zhou, F.; Tay, D.B.; Jiang, J. Gene selection for cancer detection using graph signal processing. Inform. Med. Unlocked 2021, 25, 100662. [Google Scholar] [CrossRef]
- Zhi, H.Y.; Zhao, L.; Lee, C.C.; Chen, C.Y.C. A Novel Graph Neural Network Methodology to Investigate Dihydroorotate Dehydrogenase Inhibitors in Small Cell Lung Cancer. Biomolecules 2021, 11, 477. [Google Scholar] [CrossRef] [PubMed]
- El Rai, M.C.; Darweesh, M.; Al-Saad, M.; Mansoor, W.; Al-Ahmad, H. SemiSegPolyp: Semi-Supervised Polyp Segmentation using Graph Signals. In Proceedings of the 2022 29th IEEE International Conference on Electronics, Circuits and Systems (ICECS), Glasgow, UK, 24–26 October 2022; pp. 1–4. [Google Scholar]
- Zhang, J.; Gong, J.; Barnes, L. HCNN: Heterogeneous Convolutional Neural Networks for Comorbid Risk Prediction with Electronic Health Records. In Proceedings of the 2017 IEEE/ACM International Conference on Connected Health: Applications, Systems and Engineering Technologies (CHASE), Philadelphia, PA, USA, 17–19 July 2017; pp. 214–221. [Google Scholar]
- Thomas, P.J.; Leow, A.; Klumpp, H.; Phan, K.L.; Ajilore, O. Default Mode Network Hypoalignment of Function to Structure Correlates With Depression and Rumination. Biol. Psychiatry Cogn. Neurosci. Neuroimaging 2023, 9, 101–111. [Google Scholar] [PubMed]
- Surapaneni, S.P.; Manikandan, M.S. Graph Signal Processing Based Classification of Noisy and Clean PPG Signals Using Machine Learning Classifiers for Intelligent Health Monitor. In Proceedings of the 2023 15th International Conference on Electronics, Computers and Artificial Intelligence (ECAI), Bucharest, Romania, 29–30 June 2023; pp. 1–6. [Google Scholar]
- Khoshkhabar, M.; Meshgini, S.; Afrouzian, R.; Danishvar, S. Automatic Liver Tumor Segmentation from CT Images Using Graph Convolutional Network. Sensors 2023, 23, 7561. [Google Scholar] [CrossRef] [PubMed]
- Ju, R.; Hu, C.; zhou, p.; Li, Q. Early diagnosis of Alzheimer’s disease based on resting-state brain networks and deep learning. IEEE/ACM Trans. Comput. Biol. Bioinform. 2017, 16, 244–257. [Google Scholar] [CrossRef] [PubMed]
- Huang, J.; Li, Y. Sparse inverse covariance network-based modeling for mild cognitive impairment classification. In Proceedings of the 2017 IEEE International Conference on Imaging Systems and Techniques (IST), Beijing, China, 18–20 October 2017; IEEE: Piscataway, NJ, USA, 2017; pp. 1–5. [Google Scholar]
- de Vos, F.; Koini, M.; Schouten, T.M.; Seiler, S.; van der Grond, J.; Lechner, A.; Schmidt, R.; de Rooij, M.; Rombouts, S.A. A comprehensive analysis of resting state fMRI measures to classify individual patients with Alzheimer’s disease. NeuroImage 2018, 167, 62–72. [Google Scholar] [CrossRef] [PubMed]
- Segarra, S.; Marques, A.G.; Mateos, G.; Ribeiro, A. Network topology inference from spectral templates. IEEE Trans. Signal Inf. Process. Netw. 2017, 3, 467–483. [Google Scholar] [CrossRef]
- Kalofolias, V. How to learn a graph from smooth signals. In Proceedings of the 19th International Conference on Artificial Intelligence and Statistics, Cadiz, Spain, 9–11 May 2016; pp. 920–929. [Google Scholar]
- Dong, X.; Thanou, D.; Frossard, P.; Vandergheynst, P. Learning Laplacian matrix in smooth graph signal representations. IEEE Trans. Signal Process. 2016, 64, 6160–6173. [Google Scholar] [CrossRef]
- Parisot, S.; Ktena, S.I.; Ferrante, E.; Lee, M.; Moreno, R.G.; Glocker, B.; Rueckert, D. Spectral graph convolutions for population-based disease prediction. In Proceedings of the Medical Image Computing and Computer Assisted Intervention—MICCAI 2017, Quebec City, QC, Canada, 11–13 September 2017; Springer: Berlin/Heidelberg, Germany, 2017; pp. 177–185. [Google Scholar]
- Vivar, G.; Zwergal, A.; Navab, N.; Ahmadi, S.A. Multi-modal disease classification in incomplete datasets using geometric matrix completion. In Proceedings of the Graphs in Biomedical Image Analysis and Integrating Medical Imaging and Non-Imaging Modalities: Second International Workshop, GRAIL 2018, Granada, Spain, 20 September 2018; Springer: Berlin/Heidelberg, Germany, 2018; pp. 24–31. [Google Scholar]
- Dhillon, I.S.; Guan, Y.; Kulis, B. Weighted graph cuts without eigenvectors a multilevel approach. IEEE Trans. Pattern Anal. Mach. Intell. 2007, 29, 1944–1957. [Google Scholar] [CrossRef]
- Shuman, D.I.; Faraji, M.J.; Vandergheynst, P. A multiscale pyramid transform for graph signals. IEEE Trans. Signal Process. 2015, 64, 2119–2134. [Google Scholar] [CrossRef]
- Loukas, A. Graph Reduction with Spectral and Cut Guarantees. Mach. Learn. Res. 2019, 20, 1–42. [Google Scholar]
- Nielsen, J.A.; Zielinski, B.A.; Fletcher, P.T.; Alexander, A.L.; Lange, N.; Bigler, E.D.; Lainhart, J.E.; Anderson, J.S. Multisite functional connectivity MRI classification of autism: ABIDE results. Front. Hum. Neurosci. 2013, 7, 599. [Google Scholar] [CrossRef] [PubMed]
- Dodero, L.; Minh, H.Q.; San Biagio, M.; Murino, V.; Sona, D. Kernel-based classification for brain connectivity graphs on the Riemannian manifold of positive definite matrices. In Proceedings of the 2015 IEEE 12th International Symposium on Biomedical Imaging (ISBI), Brooklyn, NY, USA, 16–19 April 2015; IEEE: Piscataway, NJ, USA, 2015; pp. 42–45. [Google Scholar]
- Wee, C.Y.; Yap, P.T.; Shen, D. Diagnosis of autism spectrum disorders using temporally distinct resting-state functional connectivity networks. CNS Neurosci. Ther. 2016, 22, 212–219. [Google Scholar] [CrossRef] [PubMed]
- Heinsfeld, A.S.; Franco, A.R.; Craddock, R.C.; Buchweitz, A.; Meneguzzi, F. Identification of autism spectrum disorder using deep learning and the ABIDE dataset. Neuroimage Clin. 2018, 17, 16–23. [Google Scholar] [CrossRef] [PubMed]
- Ktena, S.I.; Parisot, S.; Ferrante, E.; Rajchl, M.; Lee, M.; Glocker, B.; Rueckert, D. Distance metric learning using graph convolutional networks: Application to functional brain networks. In Proceedings of the Medical Image Computing and Computer Assisted Intervention—MICCAI 2017, Quebec City, QC, Canada, 11–13 September 2017; Springer: Berlin/Heidelberg, Germany, 2017; pp. 469–477. [Google Scholar]
- Abraham, A.; Milham, M.P.; Di Martino, A.; Craddock, R.C.; Samaras, D.; Thirion, B.; Varoquaux, G. Deriving reproducible biomarkers from multi-site resting-state data: An Autism-based example. NeuroImage 2017, 147, 736–745. [Google Scholar] [CrossRef] [PubMed]
- Iidaka, T. Resting state functional magnetic resonance imaging and neural network classified autism and control. Cortex 2015, 63, 55–67. [Google Scholar] [CrossRef] [PubMed]
- Ding, L.; Wang, M.; Sun, D.; Li, A. A novel method for identifying potential disease-related miRNAs via a disease–miRNA–target heterogeneous network. Mol. BioSystems 2017, 13, 2328–2337. [Google Scholar] [CrossRef] [PubMed]
- Chen, X.; Liu, M.X.; Yan, G.Y. RWRMDA: Predicting novel human microRNA–disease associations. Mol. Biosyst. 2012, 8, 2792–2798. [Google Scholar] [CrossRef] [PubMed]
- Ding, L.; Wang, M.; Sun, D.; Li, A. TPGLDA: Novel prediction of associations between lncRNAs and diseases via lncRNA-disease-gene tripartite graph. Sci. Rep. 2018, 8, 1065. [Google Scholar] [CrossRef]
- Chen, X.; Yan, G.Y. Novel human lncRNA–disease association inference based on lncRNA expression profiles. Bioinformatics 2013, 29, 2617–2624. [Google Scholar] [CrossRef]
- Zhang, Y.; Zhou, D.; Chen, S.; Gao, S.; Ma, Y. Single-image crowd counting via multi-column convolutional neural network. In Proceedings of the IEEE Conference on Computer Vision and Pattern Recognition, Las Vegas, NV, USA, 26 June–1 July 2016; pp. 589–597. [Google Scholar]
- Lipton, Z.C.; Berkowitz, J.; Elkan, C. A critical review of recurrent neural networks for sequence learning. arXiv 2015, arXiv:1506.00019. [Google Scholar]
- Kao, J.Y.; Tian, D.; Mansour, H.; Ortega, A.; Vetro, A. Disc-GLasso: Discriminative graph learning with sparsity regularization. In Proceedings of the 2017 IEEE International Conference on Acoustics, Speech and Signal Processing (ICASSP), New Orleans, LA, USA, 5–9 March 2017; IEEE: Piscataway, NJ, USA, 2017; pp. 2956–2960. [Google Scholar]
- Luiten, J.; Voigtlaender, P.; Leibe, B. PReMVOS: Proposal-generation, refinement and merging for video object segmentation. In Proceedings of the Asian Conference on Computer Vision. Springer, Perth, Australia, 2–6 December 2018; pp. 565–580. [Google Scholar]
- Wang, H.; Wang, W.; Liu, J. Temporal memory attention for video semantic segmentation. In Proceedings of the 2021 IEEE International Conference on Image Processing (ICIP), Anchorage, AK, USA, 19–22 September 2021; IEEE: Piscataway, NJ, USA, 2021; pp. 2254–2258. [Google Scholar]
- Jain, S.; Wang, X.; Gonzalez, J.E. Accel: A corrective fusion network for efficient semantic segmentation on video. In Proceedings of the IEEE/CVF Conference on Computer Vision and Pattern Recognition, Long Beach, CA, USA, 15–20 June 2019; pp. 8866–8875. [Google Scholar]
- Caelles, S.; Maninis, K.K.; Pont-Tuset, J.; Leal-Taixé, L.; Cremers, D.; Van Gool, L. One-shot video object segmentation. In Proceedings of the IEEE Conference on Computer Vision and Pattern Recognition, Honolulu, HI, USA, 21–26 July 2017; pp. 221–230. [Google Scholar]
- Qiu, J.; Dong, Y.; Ma, H.; Li, J.; Wang, K.; Tang, J. Network embedding as matrix factorization: Unifying deepwalk, line, pte, and node2vec. In Proceedings of the Eleventh ACM International Conference on Web Search and Data Mining, Marina Del Rey, CA, USA, 5–9 February 2018; pp. 459–467. [Google Scholar]
- Zhang, Z.; Cui, P.; Li, H.; Wang, X.; Zhu, W. Billion-scale network embedding with iterative random projection. In Proceedings of the 2018 IEEE International Conference on Data Mining (ICDM), Singapore, 17–20 November 2018; IEEE: Piscataway, NJ, USA, 2018; pp. 787–796. [Google Scholar]
- Perozzi, B.; Kulkarni, V.; Chen, H.; Skiena, S. Don’t walk, skip! online learning of multi-scale network embeddings. In Proceedings of the 2017 IEEE/ACM International Conference on Advances in Social Networks Analysis and Mining 2017, Sydney, Australia, 31 July–3 August 2017; pp. 258–265. [Google Scholar]
- Wu, H.; Chen, G.; Wen, Z.; Qin, J. Collaborative and adversarial learning of focused and dispersive representations for semi-supervised polyp segmentation. In Proceedings of the IEEE/CVF International Conference on Computer Vision, Montreal, BC, Canada, 11–17 October 2021; pp. 3489–3498. [Google Scholar]
- Kramer, M.A.; Kolaczyk, E.D.; Kirsch, H.E. Emergent network topology at seizure onset in humans. Epilepsy Res. 2008, 79, 173–186. [Google Scholar] [CrossRef]
- Statnikov, A.; Tsamardinos, I.; Dosbayev, Y.; Aliferis, C.F. GEMS: A system for automated cancer diagnosis and biomarker discovery from microarray gene expression data. Int. J. Med Inform. 2005, 74, 491–503. [Google Scholar] [CrossRef] [PubMed]
- Health, M.D.P. Archive of COVID-19 Cases in Massachusetts. 2020. Available online: https://www.mass.gov/coronavirus-disease-2019-covid-19 (accessed on 20 May 2024).
- Došilović, F.K.; Brčić, M.; Hlupić, N. Explainable artificial intelligence: A survey. In Proceedings of the 2018 41st International Convention on Information and Communication Technology, Electronics and Microelectronics (MIPRO), Opatija, Croatia, 21–25 May 2018; pp. 0210–0215. [Google Scholar]
- Gunning, D.; Stefik, M.; Choi, J.; Miller, T.; Stumpf, S.; Yang, G.Z. XAI—Explainable artificial intelligence. Sci. Robot. 2019, 4, 44–58. [Google Scholar] [CrossRef] [PubMed]
- Tjoa, E.; Guan, C. A Survey on Explainable Artificial Intelligence (XAI): Toward Medical XAI. IEEE Trans. Neural Netw. Learn. Syst. 2021, 32, 4793–4813. [Google Scholar] [CrossRef]
- Tortorella, G.L.; Fogliatto, F.S.; Mac Cawley Vergara, A.; Vassolo, R.; Sawhney, R. Healthcare 4.0: Trends, challenges and research directions. Prod. Plan. Control 2020, 31, 1245–1260. [Google Scholar] [CrossRef]
- Yang, G.; Pang, Z.; Jamal Deen, M.; Dong, M.; Zhang, Y.T.; Lovell, N.; Rahmani, A.M. Homecare Robotic Systems for Healthcare 4.0: Visions and Enabling Technologies. IEEE J. Biomed. Health Inform. 2020, 24, 2535–2549. [Google Scholar] [CrossRef]
- Wehde, M. Healthcare 4.0. IEEE Eng. Manag. Rev. 2019, 47, 24–28. [Google Scholar] [CrossRef]
- Fabila-Carrasco, J.S.; Tan, C.; Escudero, J. Permutation Entropy for Graph Signals. IEEE Trans. Signal Inf. Process. Netw. 2022, 8, 288–300. [Google Scholar] [CrossRef]
- Fabila-Carrasco, J.S.; Tan, C.; Escudero, J. Dispersion entropy for graph signals. Chaos Solitons Fractals 2023, 175, 113977. [Google Scholar] [CrossRef]


| Medical Specialty | Ref. |
|---|---|
| Neurology | [22,23,24,25,67,68,69,71,73,74,75,76,77,78,79,80,81,82,83,84,85,86,87,88,89,90,91,92,93,94] |
| Cardiology | [95,96] |
| Infectology | [97,98] |
| Genetics | [99,100,101] |
| Oncology | [102,103] |
| Gastroenterology | [104] |
| Medical Clinical | [105] |
| Cytology | [66] |
| Psychiatry | [106] |
| Pneumology | [107] |
| Hepatology | [108] |
| Ref. | Year | Objective of the Study | Proposed Technique | Techniques Used for Comparison |
|---|---|---|---|---|
| [66] | 2015 | Image preprocessing, segmentation, and classification of Feulgen- and Papanicolaou- stained slides. | Partial difference equations on weighted graphs. | Graph cuts, random walks, shortest-path algorithms, maximum spanning forests, and power watershed algorithm. |
| [79] | 2016 | Alzheimer’s detection. | Matched signal detection (MSD) theory for signals on graphs (simple-MSD, constrained-MSD, probabilistic-MSD). | Principal component analysis (PCA), support vector machine (SVM), and linear discriminant analysis (LDA). |
| [82] | 2017 | Brain image data modeling and extraction. | Autoencoders for analysis of high-dimensional graph signals. | PCA, robust PCA (RPCA), graph-based filtering (GBF), and stacked autoencoder (SAE). |
| [105] | 2017 | Prediction of risk of comorbidities. | Heterogeneous convolutional neural network (HCNN), based on predictive learning. | Logistic regression (LR) and standard CNN. |
| [67] | 2018 | Autism and Alzheimer’s classification | GCN for population analysis. | Random forest (RF) and multi-layer perceptron (MLP). |
| [78] | 2018 | Alzheimer’s detection. | Graph frequency analysis for highly discriminative feature extraction and GCNN-based classifier. | MSD-G [79], RsBN-DL [109], Sparse-Cov [110], and EN-LogReg [111]. |
| [69] | 2019 | Orthonormal data transformation applied to images of patients with epilepsy. | Orthonormal sparsifying transform and graph Fourier transform (GFT). | SpecTemp [112], Kalofilias [113], and Dong et al. [114] |
| [80] | 2019 | Alzheimer’s detection. | Multiple feature-specific adjacency matrices for learning using GCNN. | Linear SVM, MLP, RF, Parisot et al. [115], and Vivar et al. [116]. |
| [89] | 2019 | Predicting cognitive impairment in Alzheimer’s disease (AD). | Multifrequency dynamic network analysis for building a connectome biomarker. | PCA. |
| [83] | 2020 | Attention deficit hyperactivity disorder (ADHD) detection. | GSP and GL to obtain structural and functional characteristics. | MLP with double input symmetrical relevance (DISR) and MLP with minimum redundancy maximum relevance (mRMR). |
| [77] | 2020 | Detection of central brain regions. | GFT based on Laplacian learning for analyzing graphs in the frequency domain. | Radial basis function (RBF) kernel and Pearson correlation methods for calculating the graph Laplacian. |
| [22] | 2020 | Alzheimer’s detection. | Graph coarsening in a GCNN. | Heavy Edge [117], Kron Reduction [118], and spectral approximation [119]. |
| [74] | 2020 | ADHD classification. | Dual-subspace classification algorithm using individual resting state functional connectivity. | RMf, fusion fMRI, R-Relielf, L1BioSVM, FCNet, 3D-CNN, and Deep fMRI |
| [73] | 2020 | Autism classification. | GFT and ML for analyzing the test and time series to calculate descriptive statistics for the region of interest. | [120,121,122,123,124,125,126]. |
| [68] | 2020 | Classification of neurological function. | Graph-based modeling of the brain’s functional connectivity with elastic net and independent component analysis (ICA). | RF, Dictionary Learning, and Higher Dimensional YEO parcellation. |
| [100] | 2020 | Prediction of RNA association with disease. | Graph attention adversarial network (GAAN), based on the integration of state-of-the-art GCN and the attention mechanism. | Ding’s method [127], RWRMDA [128], TPGLDA [129], RLSMDA [130], GCN, GAT, and GAN. |
| [96] | 2020 | Aortic root segmentation. | Multi-resolution graph using irregularly spaced patch sampling and a graph-based CNN as a classifier. | Hand-crafted and Fully connected graph. |
| [102] | 2021 | Gene selection for cancer detection. | Algorithm for selecting significant genes with GSP techniques, using the Laplacian matrix of the graph. | Locally linear embedding (LLE) and PCA. |
| [81] | 2021 | Emotion recognition. | Spatio-temporal attention neural network with GFT signals as input. | Multi-column convolutional neural network (MCNN) [131] and bidirectional long short-term memory (BiLSTM) [132]. |
| [23], [84] | 2021 | Autism classification. | Connectivity matrix with GFT values, extension of the Fukunaga–Koontz transform for feature extraction to train the decision tree (DT). | Spatial filtering method and the GFT. |
| [103] | 2021 | Lung cancer detection. | Multi-graph neural network (MGNN) with three models: GIAN, GIAT, and SGCA. | ML algorithms, RF and support vector regression (SVR). |
| [71] | 2021 | Multidomain brain decoding. | Multidomain decoding model on short time series incorporating Laplacian graph with GCN. | Classical brain decoding model, which applies multi-class linear SVM. |
| [97] | 2021 | Identification of the focus of disease spread. | GSP, GCN, and neighborhood loss calculation to optimize the average error distance. | Label propagation framework for source identification, Unbiased Betweenness. |
| [88] | 2021 | Motor imagery classification. | Graph-theoretic models of multichannel EEG signals with multivariate autoregressive models for directed graphs and extreme learning machine classifiers. | SVM, K-nearest neighbor classifiers (KNN), and Extreme Learning Machines (ELMs). |
| [90] | 2021 | Emotion classification/epileptic seizure analysis. | GFT for the extraction of discriminative features used in learning tasks and the proximal gradient method for data acquired in real time. | [113,133] and SVM. |
| [91] | 2021 | Emotion recognition and analysis. | GSP to integrate emotion recognition and analysis of signals. | – |
| [25] | 2022 | Brainwave decoding. | Fusion of GSP and GL resources for a method called graph-based imagined speech BCI decoder (GraphIS). | – |
| [75] | 2022 | Task decoding and individual fingerprinting | SVM classification and GSP functional data filtering for functional connectivity and structural connectome decomposition. | – |
| [85] | 2022 | Elimination of noise from epileptic EEG signals. | Unified objective function for GraphJADE with GL and use block coordinate descent to optimize it. | Unified objective function GraDe with GL and the blind separation methods. |
| [95] | 2022 | Left ventricular segmentation in echocardiography videos. | GraphECV with GSP for semi-supervised learning and minimization of the Sobolev norm of graph signals. | PReMVOS [134], TMANet [135], Accel [136], and OSVOS[137]. |
| [86] | 2022 | Evaluation of how brain activity changes over time. | GSP, SVM, and multiscale entropy. | – |
| [87] | 2022 | Brain Activity Classification. | End-to-end GCN structure with three convolutional layers. | NetMF [138], RandNE [139], Node2Vec [138], and Walklets [140]. |
| [99] | 2022 | Detection of metabolic diseases. | GCN to infer potential metabolite–disease association, named MDAGCN. | Traditional methods based on biological experiments. |
| [98] | 2022 | Study on the contagion dynamics of COVID-19. | Wavelet transform of spectral graph to process data in dynamic graph for spatio-temporal pattern detection. | – |
| [101] | 2022 | Prediction of circRNA association with diseases. | Two GCN-based prediction models: Node Classification and Link Prediction. | Other baseline models. |
| [104] | 2022 | Early diagnosis and detection of gastrointestinal polyps. | Semi-supervised segmentation called SemiSegPolyp, based on GSP. It is divided into instance segmentation, construction of graphs based on nearest neighbors, and semi-supervised semantic segmentation. | Mean-Teacher, generative adversarial networks (GANs), Cross-Consistency Training, and Wu [141]. |
| [93] | 2022 | Understanding what are the most useful graph frequencies to decode fMRI signals. | Spectral ResNet, in which the frequencies of the graphs define the convolutions. | MLP pattern, where the input domain is the frequency domain of the graph. |
| [76] | 2023 | Detection of mild cognitive impairment (MCI). | Multiscale enhanced GCN. | SVM, two-layer GCNs, and multi-scale GCN with the same normalized adjacency matrix. |
| [92] | 2023 | Clinical follow-up to assist in the diagnosis of inflammatory bowel diseases. | GFT, GSP, and classical SVM are used to classify the features. | Graph theory analysis method. |
| [24] | 2023 | Emotion analysis in EEG. | Coding of relative temporal transformation and attention to the channel. | GCNN, SVM, CNN + recurrent neural networks (RNNs). |
| [94] | 2023 | Classification of sleep stages. | Adaptive GCN, named ProductGraphSleepNet, which exploits GSP and product graph learning (PGL). | SVM, RF, MLP+LSTM, DeepSleepNet, CNN, RF+ Hidden Markov Model (HMM), U-Sleep, SeqSleepNet, SleepECL, fractional Fourier transform (FRFT), catBoost, LR, second-order blind source separation (SOBI)-wavelet Transform (WT), ProductGraphSleepNet, SSL-ECG, SimCLR, TS-TCC, time–frequency features, multitaper spectral + CNN, intra-/inter-epoch BiLSTM, FRFT, NAS, Cascaded CNN+LSTM. |
| [106] | 2023 | Discover how default mode network (DMN) alignment is related to symptoms of depression and rumination. | Graph signal processing-based analyses in a transdiagnostic cohort. | - |
| [107] | 2023 | Evaluation of the quality of the photoplethysmography (PPG) signal. | Analysis of graph signals using six machine learning classifiers: RF, DT, SVM, MLP, CNN, and Naive Bayes (NB). | Comparison of the six classification techniques mentioned. |
| [108] | 2023 | Identification of liver organs and segmentation of liver tumors. | Simple Linear Iterative Clustering (SLIC) algorithm for clustering liver computed tomography (CT) images and convolutional graph networks with four Chebyshev graph convolution layers and one fully connected layer to detect liver organs and segment liver tumors. | Modified U-Net and Shortcut CNN. |
| Ref. | Dataset Used | Dataset Description | Evaluated Metrics |
|---|---|---|---|
| [66] | GrabCut, MNIST, OPTDIGITS, and PENDIGITS. | MNIST, OPTDIGITS, and PENDIGITS datasets are composed of handwritten digits. | Error measures and classification rates. |
| [79] | PIB-PET dataset and ADNI. | PIB-PET dataset is composed of PET neuroimages and consists of 30 patients with Alzheimer’s disease (AD) and 40 healthy control (HC) subjects; ADNI dataset is public and consists of resting-state fMRI, containing images from 30 individuals with early MCI and 20 NC subjects. | Accuracy, sensitivity, specificity, and area under the curve (AUC). |
| [82] | Real MEG datasets. | MEG signals collected by 306 sensors were considered. Brain activity was captured by the participants’ reaction to seeing 322 images of human faces and 197 images of objects that were shown randomly. | Accuracy. |
| [105] | Electronic Health Record (EHR) data. | The data consist of the medical records of 3048 patients with congestive heart failure; 18,451 with diabetes; 3948 with chronic kidney disease; 7700 patients with chronic obstructive pulmonary disease. | Precision, recall, and F1-score. |
| [67] | ABIDE; ADNI. | ABIDE is a public dataset of functional NMR and phenotypic data. It considered 403 individuals with spectrum disorder and 468 HC; in ADNI, 1675 samples were available, with 289 individuals (843 samples) diagnosed with AD. | AUC. |
| [78] | ADNI. | It considered 100 subjects with MCI and 100 HC subjects. | Accuracy. |
| [69] | One synthetic dataset and one real dataset [142]. | The real dataset has only one epilepsy patient and 76 time series. | Correlation coefficient, percentage of recovery errors, F1-score, precision, and recall. |
| [80] | TADPOLE. | 779 subjects, 296 MCI converters, and 483 MCI non-converters. | AUC. |
| [89] | Collected for the paper. | MEG recordings were obtained in 54 patients with MCI aged 65-80 years. They were divided into two groups according to their clinical outcome: (1) the “progressive” MCI group () was composed of the individuals who met the criteria for probable AD; (2) the “stable” MCI group () was composed of the participants who still met the criteria for a diagnosis of MCI. | Classification performance, sensitivity, and specificity. |
| [83] | Online dataset. | Public dataset with EEG signals from normal and ADHD children aged 7–12 years. | Accuracy. |
| [77] | Collected for the paper. | Task-based resting-state fMRI images. The participants were divided into two categories: young adults, aged 18–22 (119 women, 79 men); children, aged 8–12 (108 women, 83 men). | F1-score, recall, and precision. |
| [22] | ADNI. | Public, over 800 participants, including HC individuals with MCI and individuals with AD. The dataset included several classes of imaging: structural MRI, functional MRI, and PET scans, as well as clinical and cognitive assessments. | Operator dissimilarity index and cut index. |
| [74] | TDAH-200. | The resting state fMRI (rs-fMRI) data used to investigate the binary classification performance between ADHD and HC subjects. | Accuracy. |
| [73] | ABIDE. | fMRI images of 871 subjects were considered, 403 subjects with autism spectrum disorder (ASD) and 468 HC. | Accuracy, sensitivity, and specificity. |
| [68] | UKB; HCP. | fMRI data from the UK Biobank (UKB), which consists of 13,301 individuals; HCP of 1003 HC. | Accuracy/correlation. |
| [100] | HMDD; LncRNADisease. | HMDD is a public dataset on miRNA diseases. A miRNA–disease network with 208 miRNAs, 250 diseases, and 3644 links was considered; LncRNADisease dataset is public and provides information on lncRNAs and diseases with over 200,000 lncRNA–disease associations across 529 diseases and 19,166 lncRNAs. | AUC and prediction results. |
| [96] | An example on aortic valve. | Human torso CT samples are considered for studying the aortic root. | Accuracy. |
| [102] | Three datasets [143]. | Public genetic datasets. In the prostate cancer dataset, there are 50 normal prostate samples and 52 prostate tumor samples, each sample with 10,509 different genes. The gastric cancer dataset contains 40 samples, 20 of which are from normal patients and another 20 from gastric cancer patients, each sample with 10,519 genes. In the brain dataset, two classes are considered, both brain tumors, glioblastoma with 20 samples and oligodendroglioma with 30 samples, each sample with 10,367 genes. | Accuracy. |
| [81] | DEAP. | EEG of 32 subjects, each having rated 40 music videos of a one-minute duration. | Accuracy. |
| [23] | ABIDE I. | Dataset includes eyes open rs-fMRI. It considered 251 HC and 201 ASD, all adolescents. Adults, 67 HC and 63 ASD, were also included. | Accuracy. |
| [84] | ABIDE I. | Dataset in which patients with eyes open during the fMRI session were considered; less than 18 years old; resulting in 251 HC subjects and 201 subjects with ASD. | Accuracy. |
| [103] | STRING (version 11.0). | Ten proteins were considered to build the protein–protein interaction (PPI) network, which was generated and visualized from the STRING database. | Root-mean-squared error (RMSE). |
| [71] | HCP. | Task-MRI and rs-MRI acquired from 1200 HC, corresponding to the response to different cognitive tasks. | Accuracy, precision, and recall. |
| [97] | USC-TIMIT. | rtMRI videos of the upper airway in the mid-sagittal plane and the corresponding speech waveforms of 5 female and 5 male subjects. | Accuracy, precision, false positive, and false negative. |
| [88] | BCI Competition II; Dataset 1 from BCI Competition IV. | 2003 BCI competition dataset EEGs were collected from 1 HC. BCI Competition IV dataset. Continuous EEGs were obtained from 6 HC. | Accuracy and AUC. |
| [90] | DEAP and synthetic dataset. | Public, peripheral EEG and physiological signal data from 32 participants. Participants watched 40 videos and rated them according to the levels of valence, arousal, liking/disliking, dominance, and familiarity. | Classification accuracy and similarity between the learned graph and the ground truth. |
| [91] | AMIGOS; ASCERTAIN; DEAP. | The AMIGOS dataset consists of data collected from 40 participants and stores EEG, ECG, and GSR signal data; the ASCERTAIN dataset contains experimentally sourced data from 58 users viewing affective videos, along with EEG, ECG, GSR, and facial activity data; the DEAP dataset has data from 32 participants, and 40 1-min clips of music videos were used as stimuli for the participants. | Accuracy and F1-score. |
| [25] | iBCIC2020 Competition. | EEG signals from 15 individuals (5 females). The mean age was 31 years, and all subjects were healthy and right-handed. | Accuracy. |
| [75] | HCP. | 100 HC HCP unrelated subjects from the HCP U100 dataset, fMRI acquired with 8 different task conditions (resting state and 7 tasks: emotion, play, language, motor, relationship, social, working memory). | Accuracy. |
| [85] | Epileptic EEG Data; TSP speech dataset. | For the EEG database, 50 tests of pre-ictal/epileptic ictal EEG signals were carried out. TSP speech is a public dataset, and an utterance of about 2 s duration uttered by a male and a female speaker was considered. | Interference-to-source ratio (ISR), relative graph estimation error (RGEe), AUC, F1, and MD |
| [95] | Econet-Dynamic; CAMUS. | EchoNet-Dynamic Dataset with 10,030 echocardiography videos; CAMUS dataset contains the medical exams of 500 patients. | Dice coefficient (DC) or F1-score. |
| [86] | HCP1200 release. | Consists of functional magnetic resonance imaging (fMRI) recordings from 20 HC adult participants. The dataset includes four rs-fMRI recordings, seven task-based fMRI recordings, and one diffusion fMRI recording. | Two measures of temporal complexity: the Hurst exponent and multiscale entropy. |
| [87] | HCP 1200 Subject Release (S1200). | fMRI data for 302 participants, consisting of 164 females and 138 males (22–35 years, mean = 28.7 ± 3.6). The fMRI data were collected while the participants performed 7 different tasks: emotion, game, working memory, language, relational, social, and motor. | Accuracy, balanced accuracy, F1-scores (macro, micro, and weighted), Matthews correlation coefficient (MCC), precision, and recall. |
| [99] | HMDB 4.0; CTD; DisGeNET. | The HMDB dataset has 1478 metabolites, 237 diseases, and 3460 known metabolite–disease associations, removing missing and duplicate data. For information on disease-related genes, obtained 3102 genes from the comparative toxicogenomics dataset (CTD) and DisGeNET. | AUC, area under precision–recall (AUPR), F1-score, accuracy, recall, specificity, and precision. |
| [98] | [144]. | It includes data on COVID contamination in the population of the city of Massachusetts from 6 December 2020 to 25 September 2021, for 41 weeks in total, which is collected from the official website. | Anomaly score (a-score). |
| [101] | circR2Disease. | It considered 431 circRNA-disease associations, which included 365 circRNAs related to 100 diseases from circR2Disease. | Accuracy, precision, recall, F1-score, and AUC. |
| [104] | Kvasir-SEG; CVC-ClinicDB. | Kvasir-SEG is an open-access dataset of gastrointestinal polyp images, which contains 1000 polyp images; the public and open-access CVC-ClinicDB is composed of 612 image frames extracted from 31 different colonoscopy. | Mean intersection-over-union (mIOU). |
| [93] | Neurovault; HCP. | Functional MRI signals consisting of 13 subjects with many task experiments and 788 HCP subjects. | Accuracy. |
| [76] | ADNI. | Total number of 184 subjects in this study. 40 late MCI (LMCI) patients, 77 early MCI (EMCI) patients, and 67 HC. | Accuracy, sensitivity, specificity, F1-score, and AUC. |
| [92] | Collected for the paper. | It includes 30 patients with inflammatory bowel disease, 13 men and 17 women, mean age (35.3 ± 5.2) years, all right-handed. At the same time, there were 30 HC patients, including 16 males and 14 females, mean age (31.5 ± 2.9) years, all right-handed. | Accuracy, sensitivity, specificity, and F1-score. |
| [24] | DEAP. | Public dataset with EEG signals from 32 participants when watching 40 60-s video clips. Subjects (50% men and 50% women) were between 19 and 37 years old. | Accuracy. |
| [94] | Montreal Archive of Sleep Studies (MASS) SS3; SleepEDF. | Full-night polysomnographic recordings. In MASS-SS3, 62 and in SleepEDF 20 healthy individuals were considered | Accuracy, F1-score, and Kappa. |
| [106] | Collected for the paper. | A total of 79 participants with complete data, with 19 HCs and 60 patients, of which 31 in the cognitive behavioral therapy (CBT) group and 29 in the selective serotonin reuptake inhibitor (SSRI) group. | The statistics are Pearson’s r and p values. |
| [107] | MIT-BIH; Medical Information Mart for Intensive Care (MIMIC); Beth Israel Deaconess Medical Center (BIDMC) PPG and Respiration Dataset; Wrist PPG During Exercise dataset; CAPNOBASE—TBME RR benchmark dataset; Complex System Laboratory (CSL) Pulse Oximetry Artifact Labels. | Datasets with different types of normal and abnormal PPG signal patterns, as well as noisy PPG signals in real time. | Accuracy, processing time, and model size. |
| [108] | Liver Tumor Segmentation 2017 (LiTS17). | The dataset contains images of 130 patients with a maximum number of CT slices of 623 for each patient. For this study, CT volumes of 10 patients were considered. | Accuracy, Dice coefficient, mean intersection-over-union (IoU), sensitivity, precision, and recall. |
Disclaimer/Publisher’s Note: The statements, opinions and data contained in all publications are solely those of the individual author(s) and contributor(s) and not of MDPI and/or the editor(s). MDPI and/or the editor(s) disclaim responsibility for any injury to people or property resulting from any ideas, methods, instructions or products referred to in the content. |
© 2024 by the authors. Licensee MDPI, Basel, Switzerland. This article is an open access article distributed under the terms and conditions of the Creative Commons Attribution (CC BY) license (https://creativecommons.org/licenses/by/4.0/).
Share and Cite
Calazans, M.A.A.; Ferreira, F.A.B.S.; Santos, F.A.N.; Madeiro, F.; Lima, J.B. Machine Learning and Graph Signal Processing Applied to Healthcare: A Review. Bioengineering 2024, 11, 671. https://doi.org/10.3390/bioengineering11070671
Calazans MAA, Ferreira FABS, Santos FAN, Madeiro F, Lima JB. Machine Learning and Graph Signal Processing Applied to Healthcare: A Review. Bioengineering. 2024; 11(7):671. https://doi.org/10.3390/bioengineering11070671
Chicago/Turabian StyleCalazans, Maria Alice Andrade, Felipe A. B. S. Ferreira, Fernando A. N. Santos, Francisco Madeiro, and Juliano B. Lima. 2024. "Machine Learning and Graph Signal Processing Applied to Healthcare: A Review" Bioengineering 11, no. 7: 671. https://doi.org/10.3390/bioengineering11070671