

HGTMDA: A Hypergraph Learning Approach with Improved GCN-Transformer for miRNA–Disease Association Prediction
Abstract
1. Introduction
- An enhanced GCN-Transformer framework is adopted to effectively integrate local structural information and global dependencies, capturing complex interactions and hierarchical relationships between nodes through multi-scale aggregation and update operations within each encoder layer.
- A novel restart-based random walk association masking strategy is introduced and integrated with an attention-enhanced GCN, effectively reducing data noise while strengthening information extraction.
- Introducing the DCE loss function, which addresses class imbalance issues and probability distribution differences, improving the model’s generalization ability and convergence speed, thereby optimizing model performance more comprehensively.
- Conducting experimental validations on multiple benchmark datasets. The analysis reveals that HGTMDA outperforms existing methods, demonstrating its efficacy and superiority in predicting miRNA–disease associations.
2. Materials and Methods
2.1. Datasets
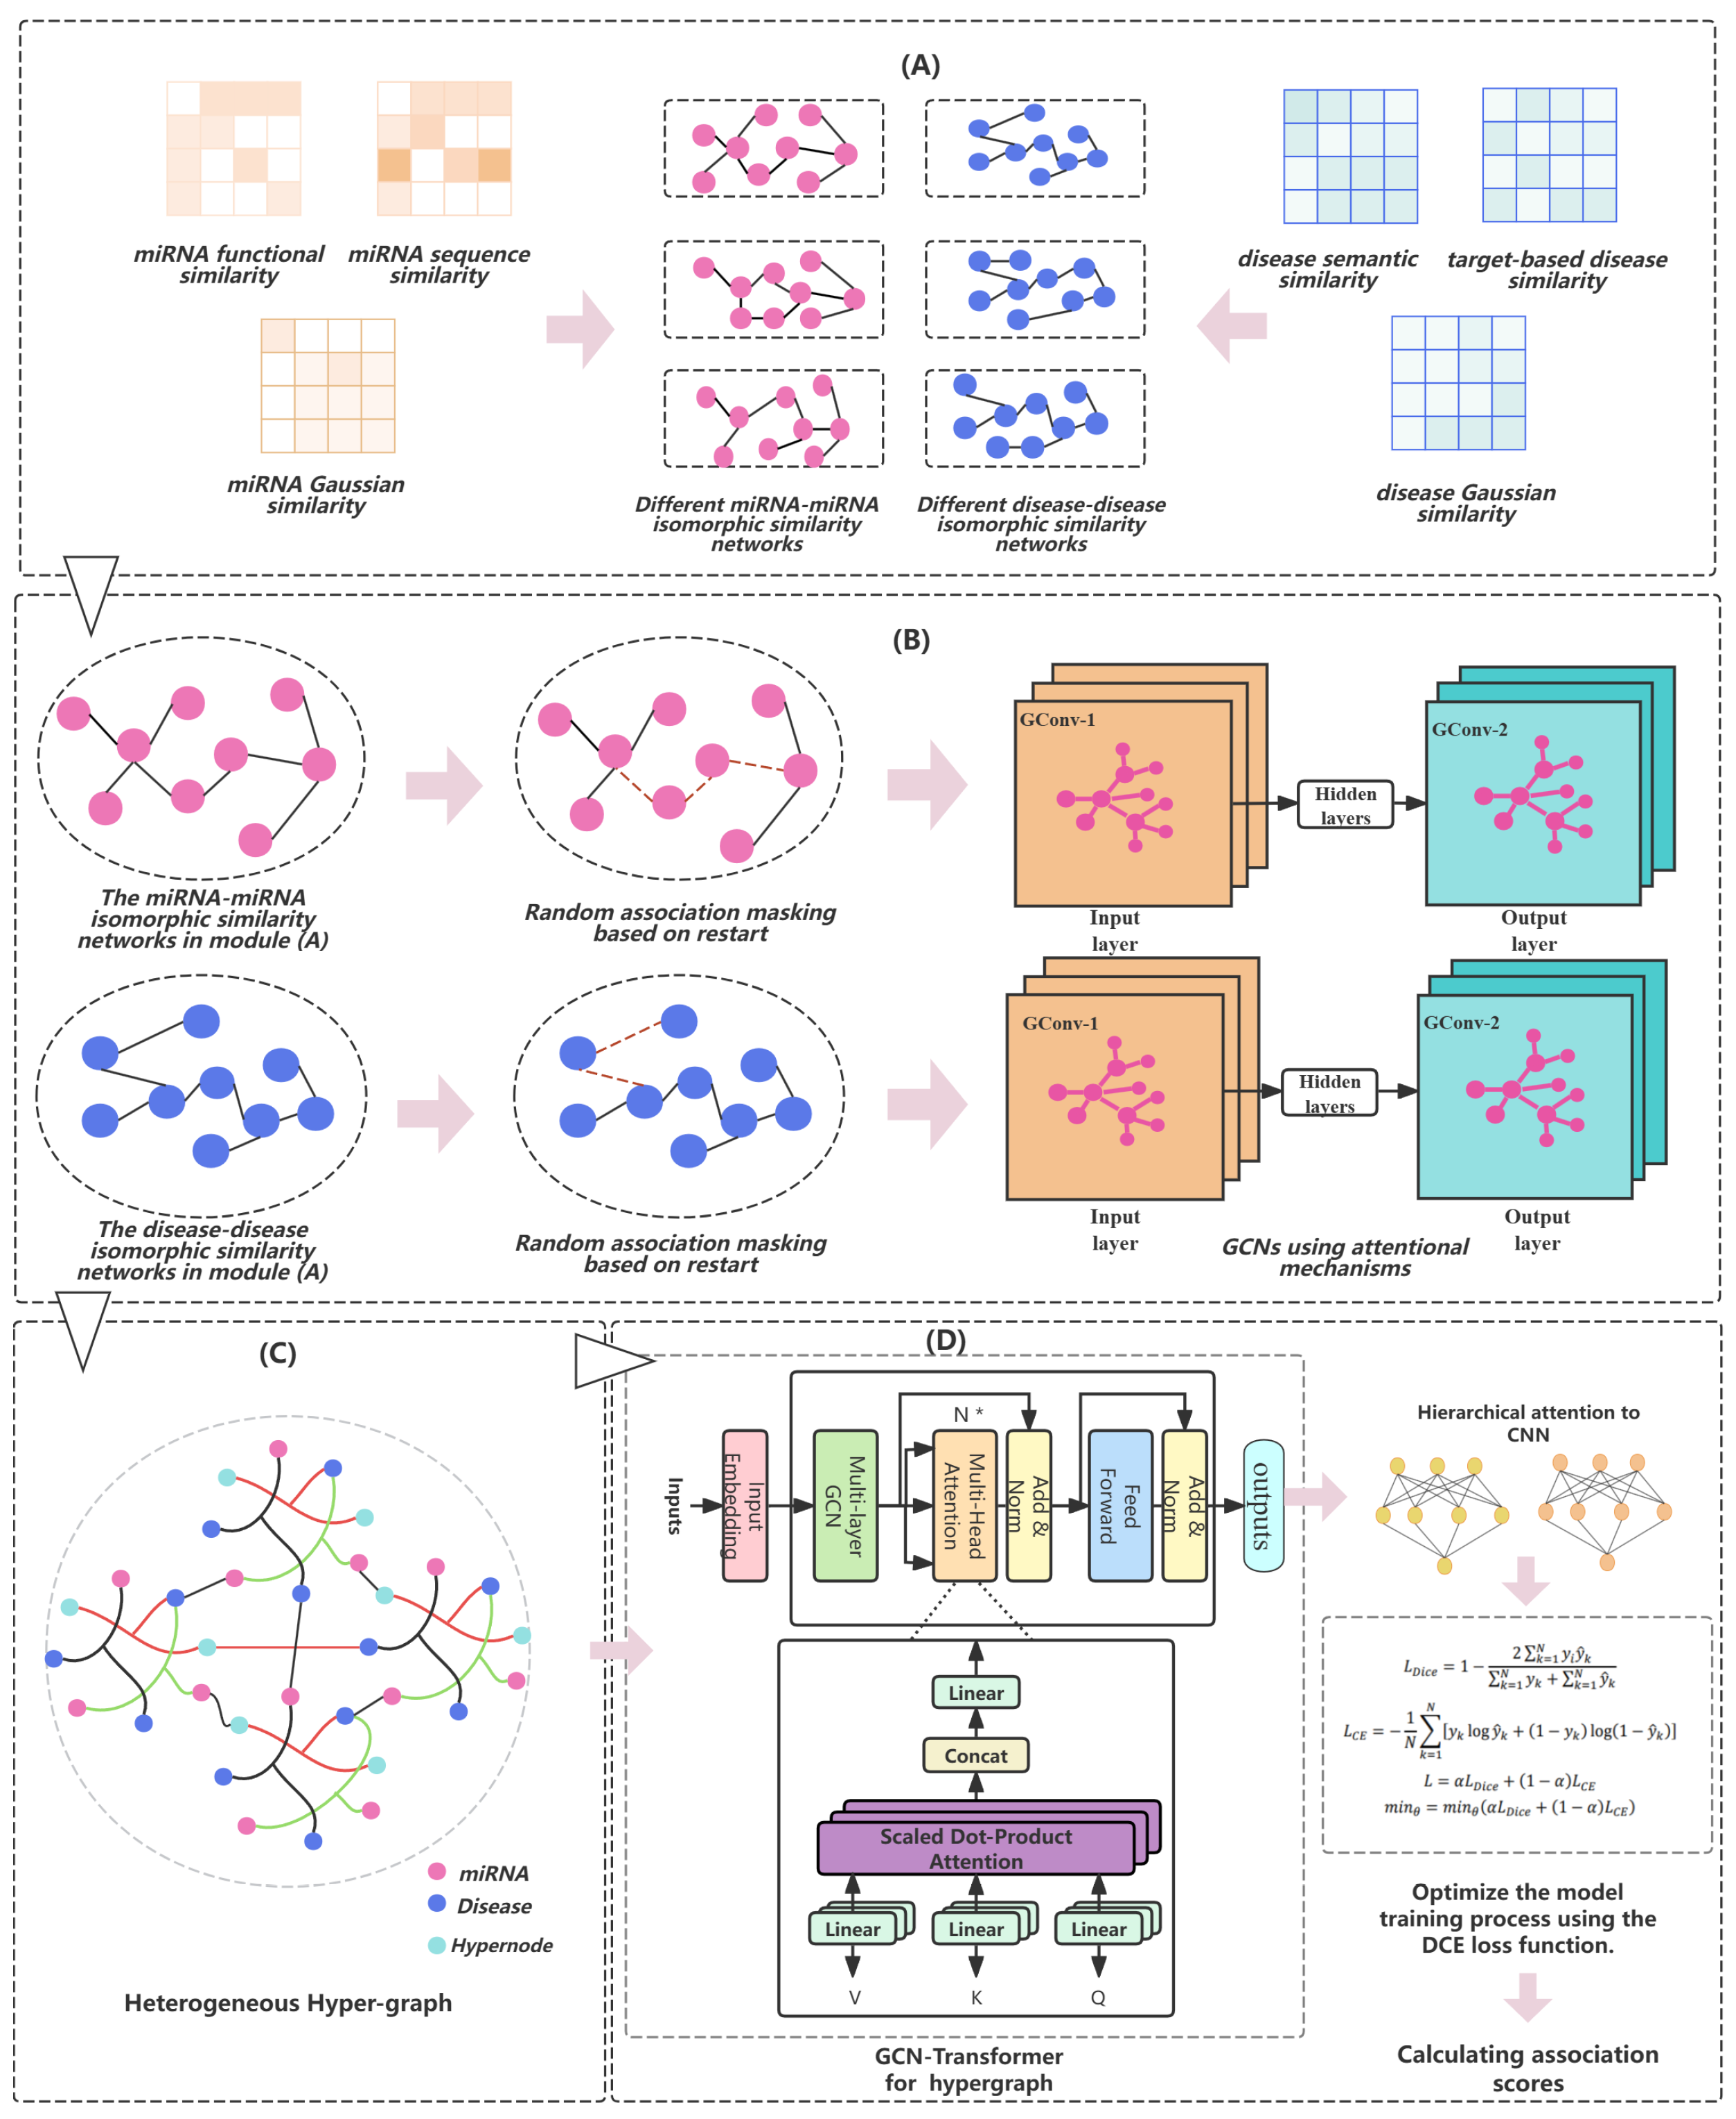
- (A)
- An isomorphic similarity network is generated by leveraging the collected miRNA and disease similarity data.
- (B)
- For both miRNA and disease isomorphic networks, association masking is performed based on random walks with restart, randomly masking some network connections. Subsequently, feature extraction on the masked networks is carried out using graph convolutional networks (GCNs) with an introduced attention mechanism.
- (C)
- By introducing the concept of supernodes, we construct an miRNA–disease association (MDA) heterogeneous hypergraph. Then, GCN-Transformer is utilized to aggregate and integrate information within the heterogeneous hypergraph.
- (D)
- The graph neural networks’ aggregated output is combined, and the model’s loss is computed using the DCE loss function, which guides the model’s optimization and parameter learning process.
2.2. Constructing Homogeneous Similarity Networks
2.3. Random Association Masking and Information Extraction
2.4. Construction of Heterogeneous Hypergraphs
2.5. Calculating the Loss
3. Results and Discussion
3.1. Comparative Analysis with State-of-the-Art Methods
- NIMCGCN [23]: This approach utilizes graph convolutional networks (GCNs) to acquire node embeddings from similarity networks. The obtained node representations are then input into a matrix completion model (NIMC). By optimizing the objective function, a complete association matrix is generated.
- AGAEMD [24]: In the study of constructing miRNA–disease association networks, this approach integrates information by applying an encoder that focuses on node importance, thereby reconstructing and optimizing the interaction network between miRNAs and diseases.
- MINIMDA [25]: This technique comprehensively fuses the high-order adjacency information from multiple data type networks by creating network structures. Through this process, it learns the intrinsic representations between miRNAs and diseases.
- MAGCN [26]: By leveraging the interactions between lncRNAs and miRNAs, this method employs a hybrid approach that combines an attention mechanism-infused graph convolutional network and convolutional neural network to predict undiscovered miRNA–disease interplay.
- AMHMDA [18]: This approach creates an miRNA–disease heterogeneous hypergraph through a virtual hypernode and utilizes graph convolutional networks (GCNs) to aggregate information, thereby inferring the miRNA–disease relationships.
3.2. Ablation Experiments
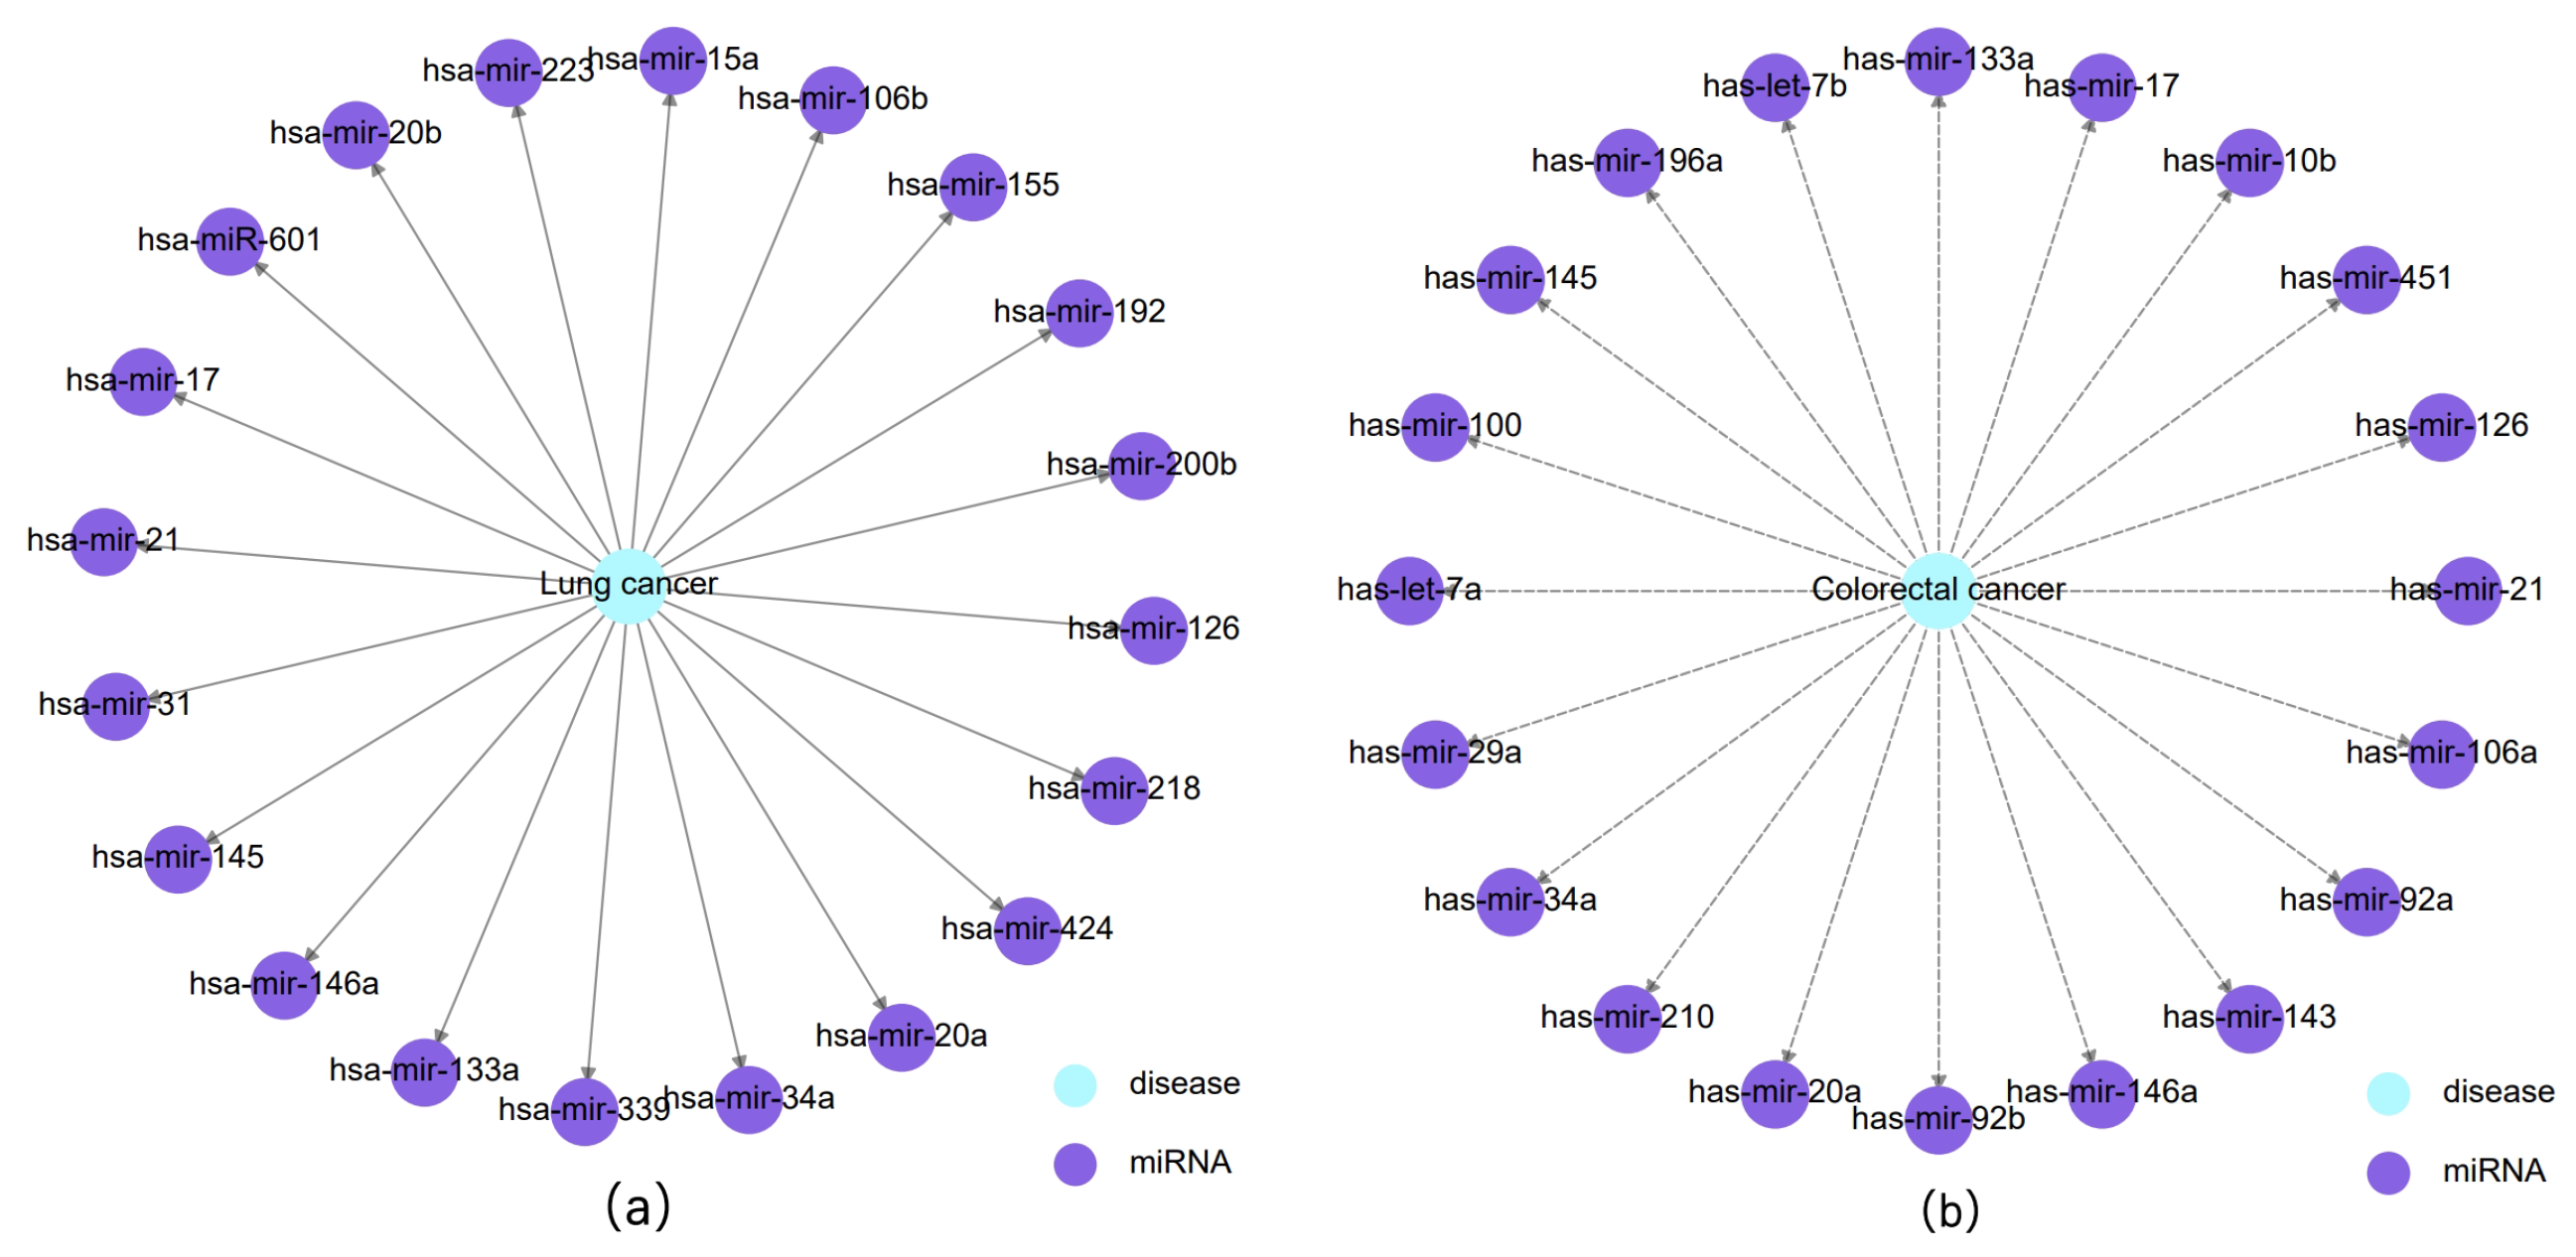
3.3. Case Study
4. Parameter Discussion
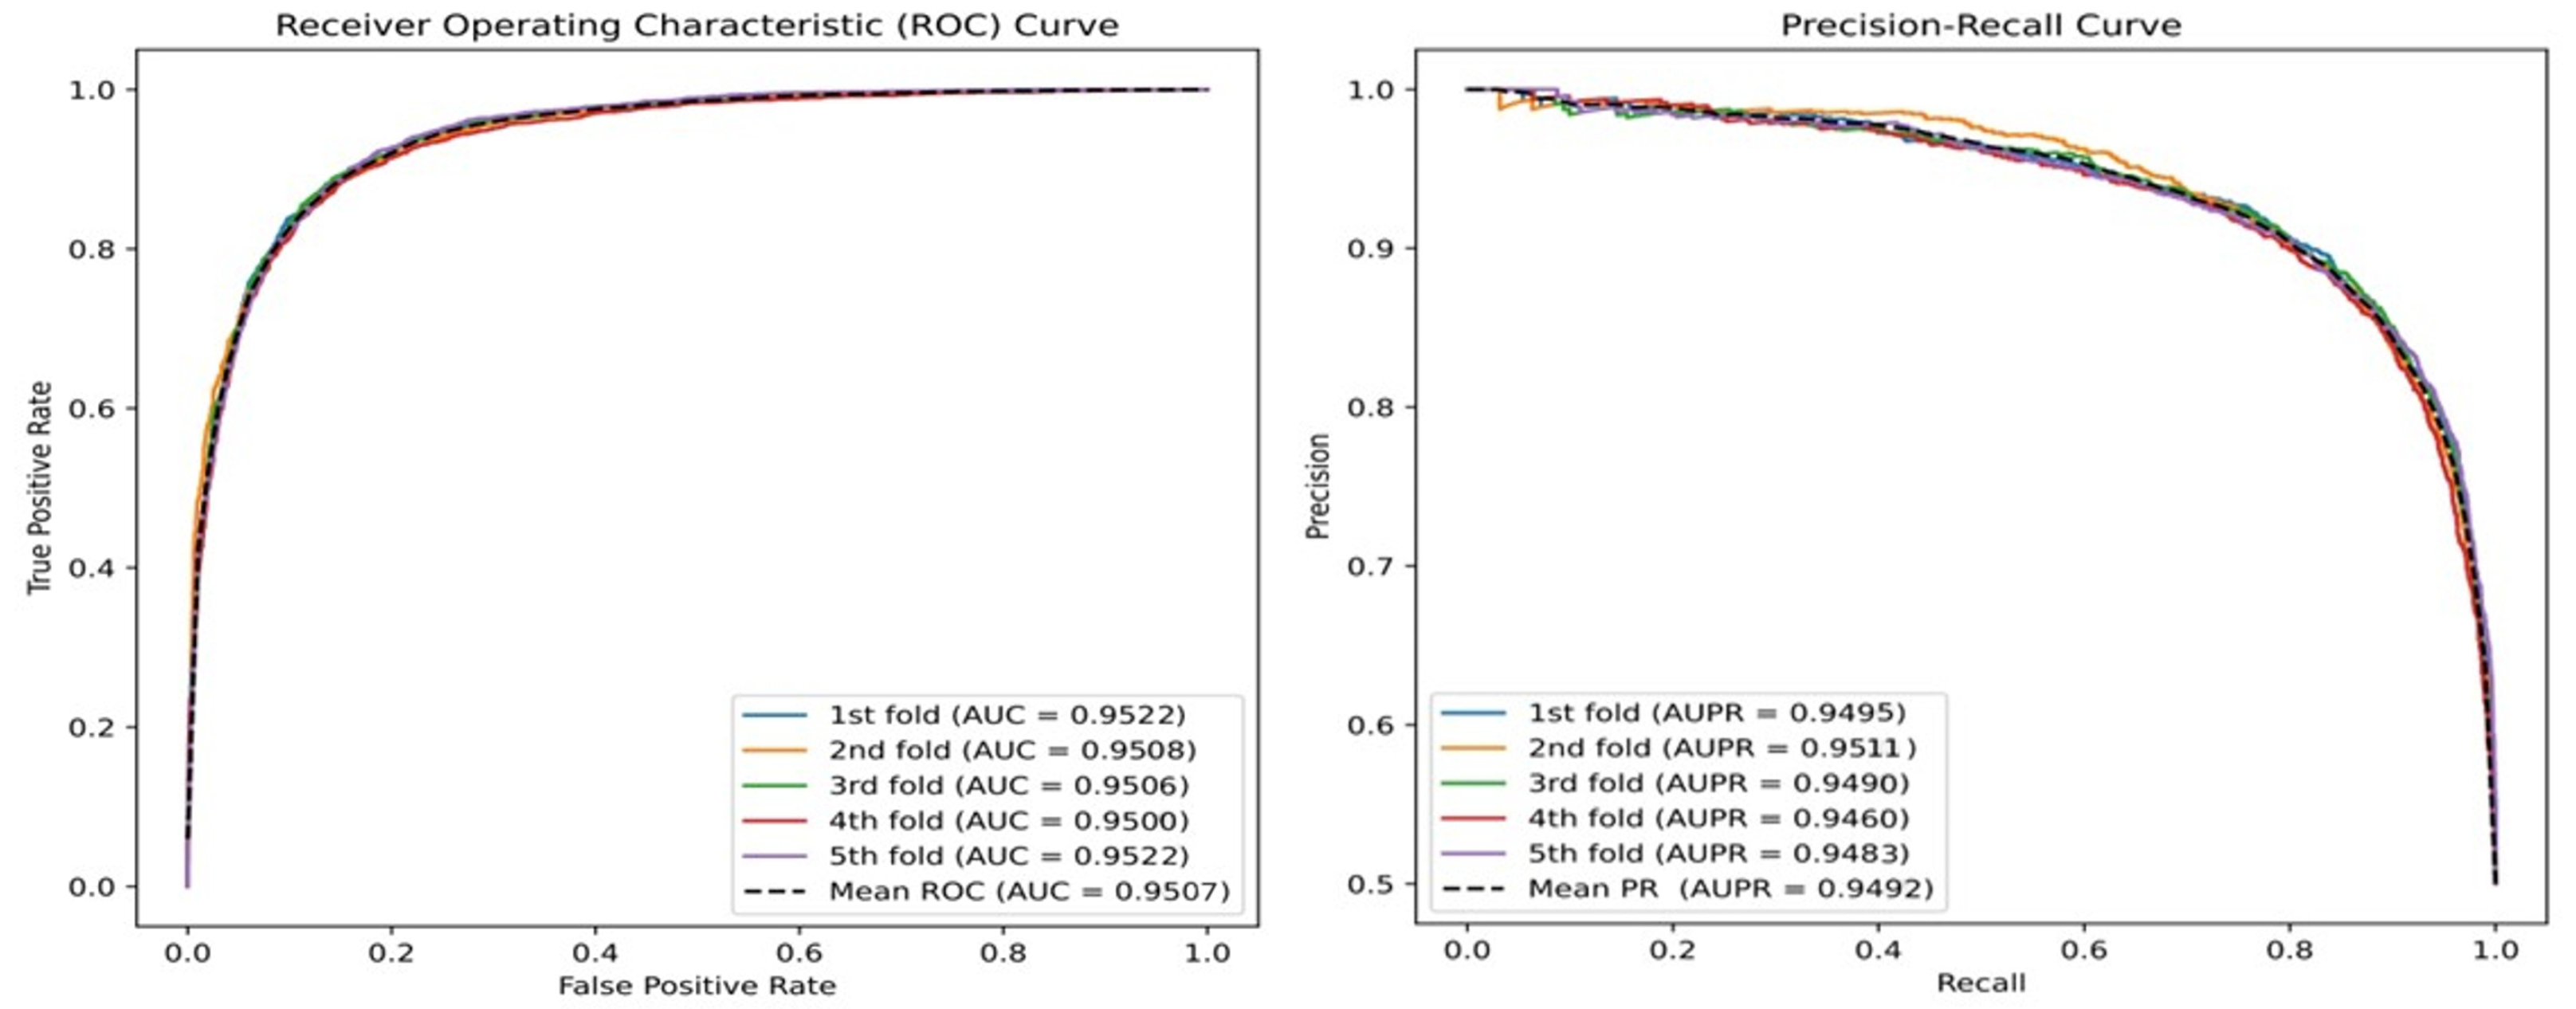
4.1. Evaluation Metrics
4.2. Parametric Analysis
4.2.1. The Impact of the Restart Probability (c)
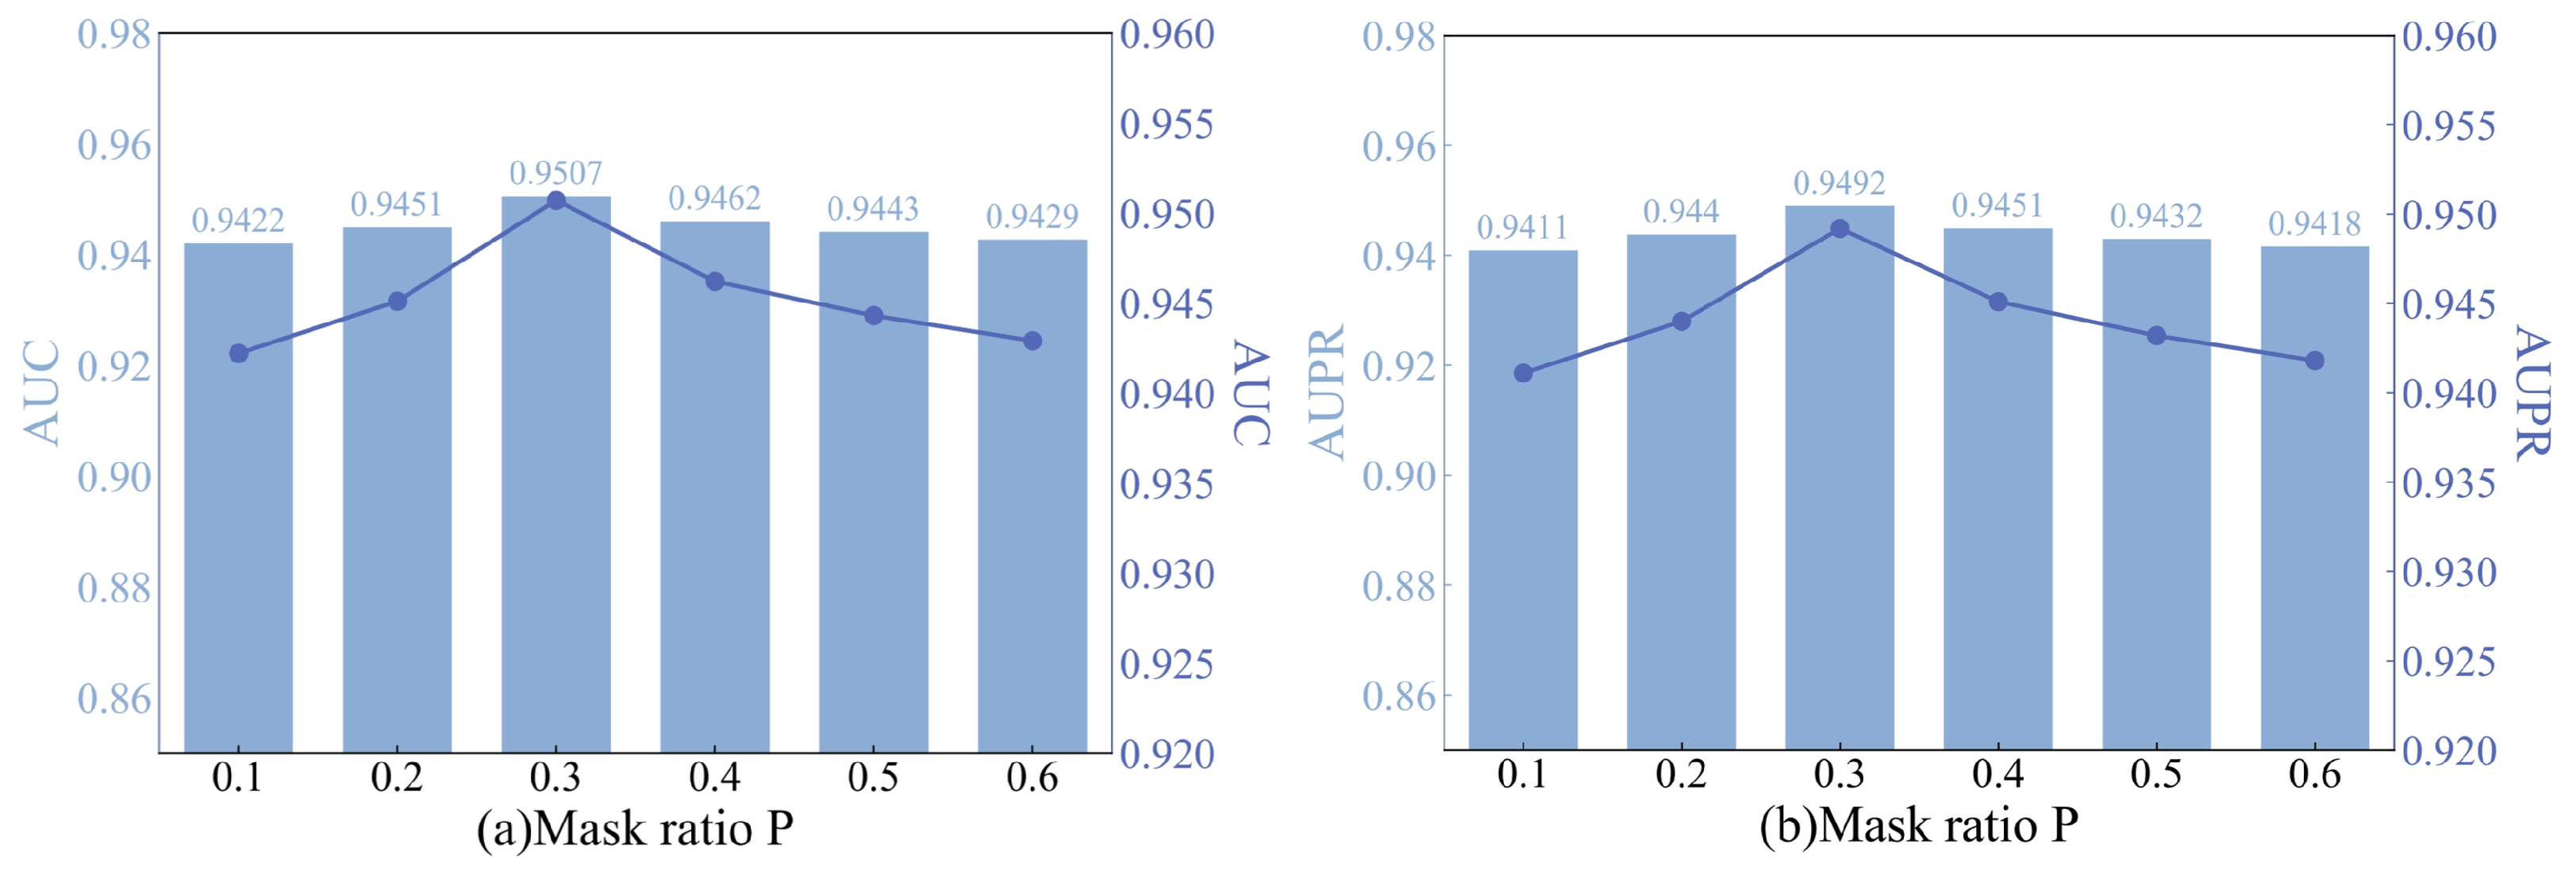
4.2.2. The Impact of the Strategy Mask Ratio (p)
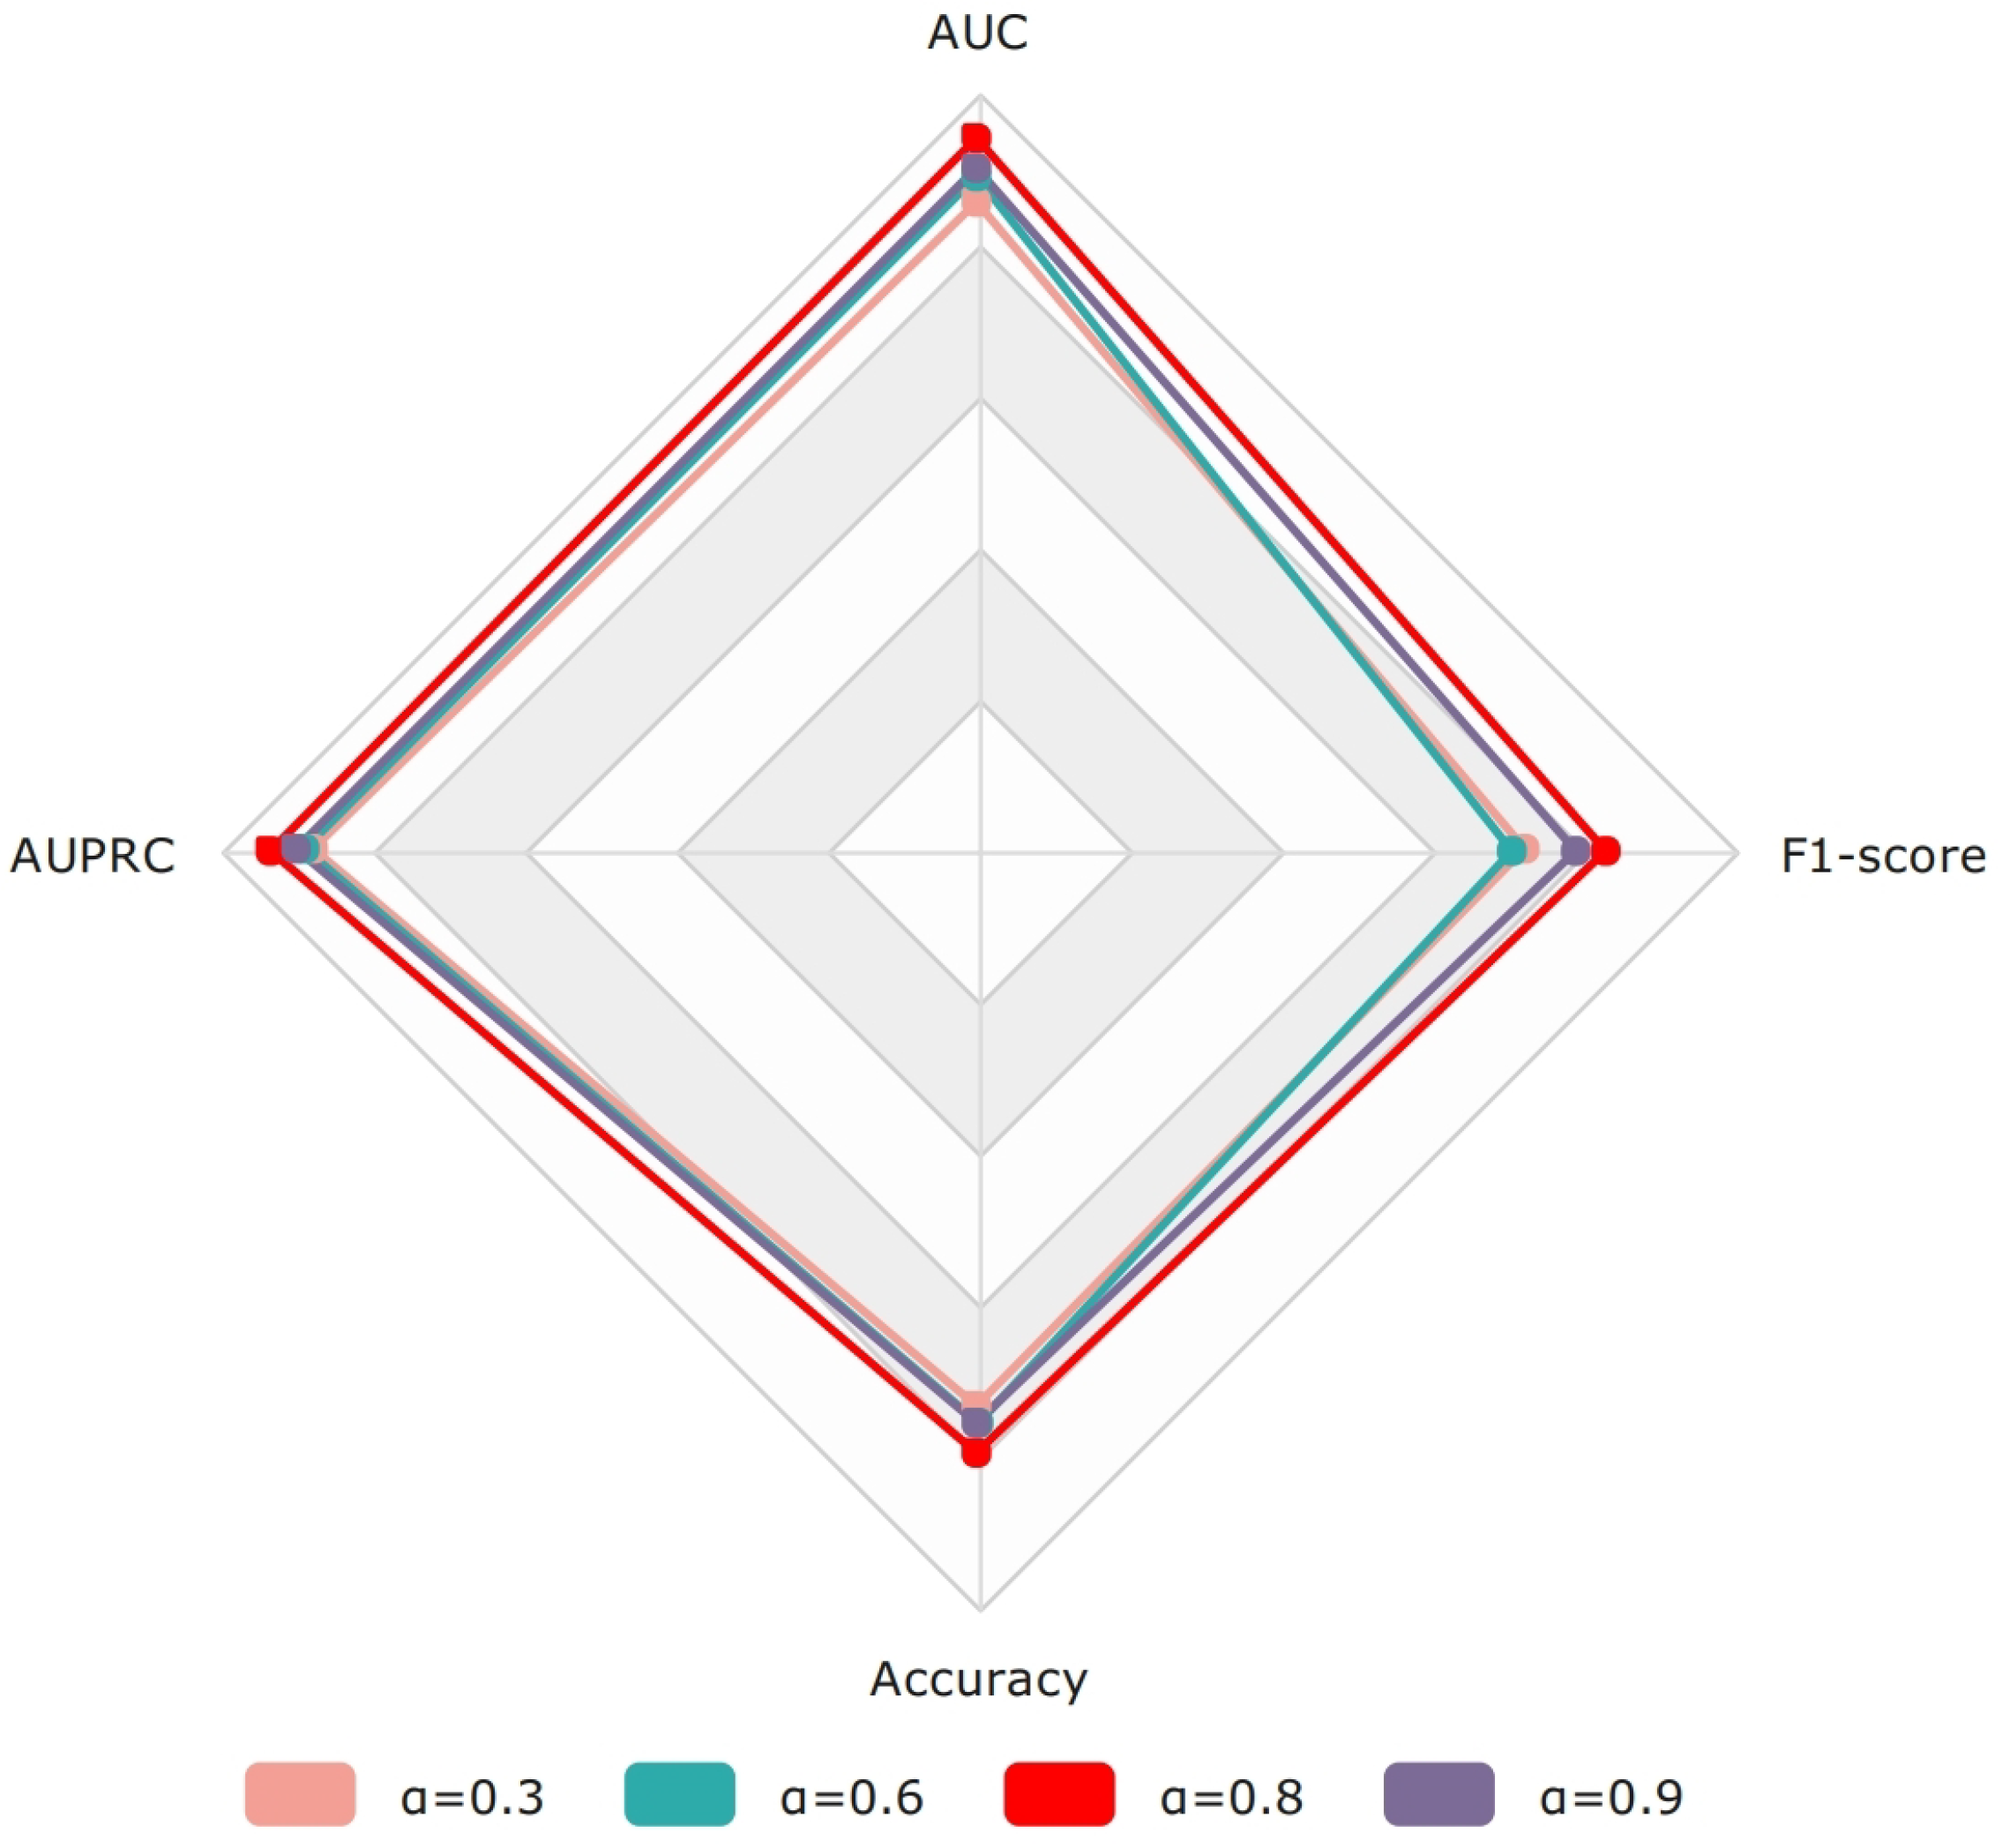
4.2.3. The Impact of the DCE Loss Parameter (a)
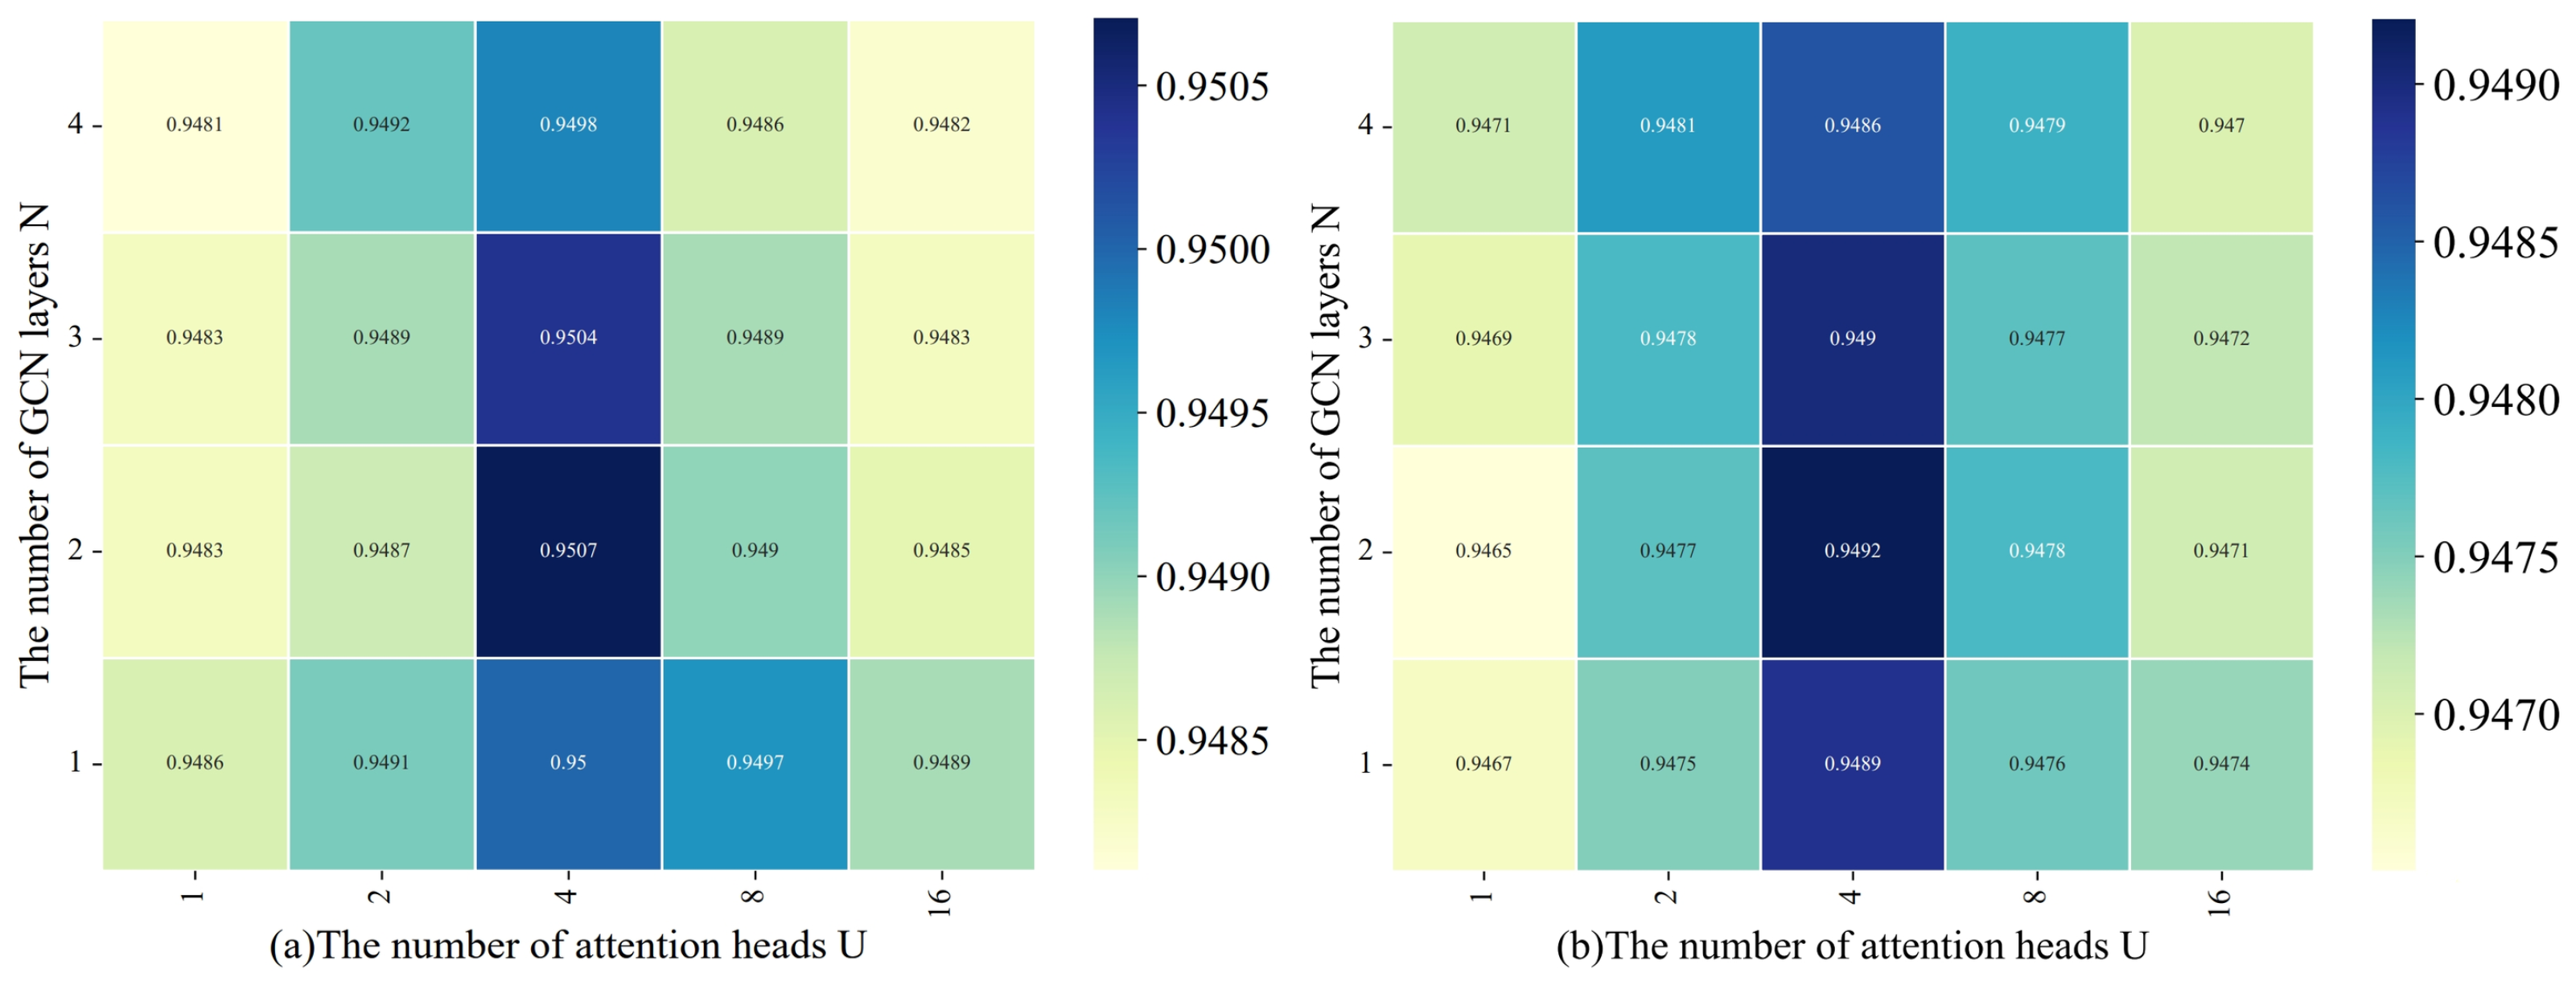
4.2.4. The Impact of the Number of Attention Heads and GCN Layers
5. Conclusions
Supplementary Materials
Author Contributions
Funding
Institutional Review Board Statement
Informed Consent Statement
Data Availability Statement
Conflicts of Interest
References
- Saliminejad, K.; Khorram Khorshid, H.R.; Soleymani Fard, S.; Ghaffari, S.H. An overview of microRNAs: Biology, functions, therapeutics, and analysis methods. J. Cell. Physiol. 2019, 234, 5451–5465. [Google Scholar] [CrossRef]
- Reinhart, B.J.; Slack, F.J.; Basson, M.; Pasquinelli, A.E.; Bettinger, J.C.; Rougvie, A.E.; Horvitz, H.R.; Ruvkun, G. The 21-nucleotide let-7 RNA regulates developmental timing in Caenorhabditis elegans. Nature 2000, 403, 901–906. [Google Scholar] [CrossRef]
- Zhou, S.s.; Jin, J.p.; Wang, J.q.; Zhang, Z.g.; Freedman, J.H.; Zheng, Y.; Cai, L. miRNAS in cardiovascular diseases: Potential biomarkers, therapeutic targets and challenges. Acta Pharmacol. Sin. 2018, 39, 1073–1084. [Google Scholar] [CrossRef]
- Hayes, J.; Peruzzi, P.P.; Lawler, S. MicroRNAs in cancer: Biomarkers, functions and therapy. Trends Mol. Med. 2014, 20, 460–469. [Google Scholar] [CrossRef]
- Vishnoi, A.; Rani, S. MiRNA biogenesis and regulation of diseases: An overview. In MicroRNA Profiling: Methods and Protocols; Humana: New York, NY, USA, 2017; pp. 1–10. [Google Scholar]
- Liang, X.; Guo, M.; Jiang, L.; Fu, Y.; Zhang, P.; Chen, Y. Predicting miRNA-disease Associations by Combining Graph and Hypergraph Convolutional Network. In Interdisciplinary Sciences: Computational Life Sciences; Springer: Berlin/Heidelberg, Germany, 2024; pp. 1–15. [Google Scholar]
- Chen, X.; Liu, M.X.; Yan, G.Y. RWRMDA: Predicting novel human microRNA-disease associations. Mol. Biosyst. 2012, 8, 2792–2798. [Google Scholar] [CrossRef]
- Xuan, P.; Han, K.; Guo, M.; Guo, Y.; Li, J.; Ding, J.; Liu, Y.; Dai, Q.; Li, J.; Teng, Z.; et al. Prediction of microRNAs associated with human diseases based on weighted k most similar neighbors. PLoS ONE 2013, 8, e70204. [Google Scholar] [CrossRef]
- Jiang, Q.; Hao, Y.; Wang, G.; Juan, L.; Zhang, T.; Teng, M.; Liu, Y.; Wang, Y. Prioritization of disease microRNAs through a human phenome-microRNAome network. BMC Syst. Biol. 2010, 4, S2. [Google Scholar] [CrossRef]
- Wang, L.; Wong, L.; You, Z.H.; Huang, D.S. AMDECDA: Attention mechanism combined with data ensemble strategy for predicting CircRNA-disease association. IEEE Trans. Big Data 2023, 9, 1–11. [Google Scholar] [CrossRef]
- Fu, L.; Peng, Q. A deep ensemble model to predict miRNA-disease association. Sci. Rep. 2017, 7, 14482. [Google Scholar] [CrossRef]
- Chen, X.; Wang, C.C.; Yin, J.; You, Z.H. Novel human miRNA-disease association inference based on random forest. Mol. Ther.-Nucleic Acids 2018, 13, 568–579. [Google Scholar] [CrossRef]
- Peng, J.; Hui, W.; Li, Q.; Chen, B.; Hao, J.; Jiang, Q.; Shang, X.; Wei, Z. A learning-based framework for miRNA-disease association identification using neural networks. Bioinformatics 2019, 35, 4364–4371. [Google Scholar] [CrossRef]
- Li, J.Q.; Rong, Z.H.; Chen, X.; Yan, G.Y.; You, Z.H. MCMDA: Matrix completion for MiRNA-disease association prediction. Oncotarget 2017, 8, 21187. [Google Scholar] [CrossRef]
- Scarselli, F.; Gori, M.; Tsoi, A.C.; Hagenbuchner, M.; Monfardini, G. The graph neural network model. IEEE Trans. Neural Netw. 2008, 20, 61–80. [Google Scholar] [CrossRef]
- Li, Z.; Li, J.; Nie, R.; You, Z.H.; Bao, W. A graph auto-encoder model for miRNA-disease associations prediction. Brief. Bioinform. 2021, 22, bbaa240. [Google Scholar] [CrossRef]
- Li, L.; Wang, Y.T.; Ji, C.M.; Zheng, C.H.; Ni, J.C.; Su, Y.S. GCAEMDA: Predicting miRNA-disease associations via graph convolutional autoencoder. PLoS Comput. Biol. 2021, 17, e1009655. [Google Scholar] [CrossRef]
- Ning, Q.; Zhao, Y.; Gao, J.; Chen, C.; Li, X.; Li, T.; Yin, M. AMHMDA: Attention aware multi-view similarity networks and hypergraph learning for miRNA-disease associations identification. Brief. Bioinform. 2023, 24, bbad094. [Google Scholar] [CrossRef]
- Huang, Z.; Shi, J.; Gao, Y.; Cui, C.; Zhang, S.; Li, J.; Zhou, Y.; Cui, Q. HMDD v3. 0: A database for experimentally supported human microRNA-disease associations. Nucleic Acids Res. 2019, 47, D1013–D1017. [Google Scholar] [CrossRef]
- Xiao, Q.; Luo, J.; Liang, C.; Cai, J.; Ding, P. A graph regularized non-negative matrix factorization method for identifying microRNA-disease associations. Bioinformatics 2018, 34, 239–248. [Google Scholar] [CrossRef]
- Lee, I.; Blom, U.M.; Wang, P.I.; Shim, J.E.; Marcotte, E.M. Prioritizing candidate disease genes by network-based boosting of genome-wide association data. Genome Res. 2011, 21, 1109–1121. [Google Scholar] [CrossRef]
- Torres, L.H.; Ribeiro, B.; Arrais, J.P. Few-shot learning with transformers via graph embeddings for molecular property prediction. Expert Syst. Appl. 2023, 225, 120005. [Google Scholar] [CrossRef]
- Li, J.; Zhang, S.; Liu, T.; Ning, C.; Zhang, Z.; Zhou, W. Neural inductive matrix completion with graph convolutional networks for miRNA-disease association prediction. Bioinformatics 2020, 36, 2538–2546. [Google Scholar] [CrossRef]
- Zhang, H.; Fang, J.; Sun, Y.; Xie, G.; Lin, Z.; Gu, G. Predicting miRNA-disease associations via node-level attention graph auto-encoder. IEEE/ACM Trans. Comput. Biol. Bioinform. 2022, 20, 1308–1318. [Google Scholar] [CrossRef]
- Lou, Z.; Cheng, Z.; Li, H.; Teng, Z.; Liu, Y.; Tian, Z. Predicting miRNA-disease associations via learning multimodal networks and fusing mixed neighborhood information. Brief. Bioinform. 2022, 23, bbac159. [Google Scholar] [CrossRef]
- Wang, W.; Chen, H. Predicting miRNA-disease associations based on lncRNA–miRNA interactions and graph convolution networks. Brief. Bioinform. 2023, 24, bbac495. [Google Scholar] [CrossRef]
- Axelsson, G.T.; Putman, R.K.; Aspelund, T.; Gudmundsson, E.F.; Hida, T.; Araki, T.; Nishino, M.; Hatabu, H.; Gudnason, V.; Hunninghake, G.M.; et al. The associations of interstitial lung abnormalities with cancer diagnoses and mortality. Eur. Respir. J. 2020, 56, 1902154. [Google Scholar] [CrossRef]
- Yu, F.; Xiao, R.; Li, X.; Hu, Z.; Cai, L.; He, F. Combined effects of lung disease history, environmental exposures, and family history of lung cancer to susceptibility of lung cancer in Chinese non-smokers. Respir. Res. 2021, 22, 210. [Google Scholar] [CrossRef]
- Sadat-Ebrahimi, S.R.; Rezabakhsh, A.; Aslanabadi, N.; Asadi, M.; Zafari, V.; Shanebandi, D.; Zarredar, H.; Enamzadeh, E.; Taghizadeh, H.; Badalzadeh, R. Novel diagnostic potential of miR-1 in patients with acute heart failure. PLoS ONE 2022, 17, e0275019. [Google Scholar] [CrossRef]
- Liou, J.M.; Lin, J.T.; Huang, S.P.; Chiu, H.M.; Wang, H.P.; Lee, Y.C.; Lin, J.W.; Shun, C.T.; Liang, J.T.; Wu, M.S. Screening for colorectal cancer in average-risk Chinese population using a mixed strategy with sigmoidoscopy and colonoscopy. Dis. Colon Rectum 2007, 50, 630–640. [Google Scholar] [CrossRef]
- Akao, Y.; Nakagawa, Y.; Naoe, T. let-7 microRNA functions as a potential growth suppressor in human colon cancer cells. Biol. Pharm. Bull. 2006, 29, 903–906. [Google Scholar] [CrossRef]
- Lu, Z.; Liu, M.; Stribinskis, V.; Klinge, C.; Ramos, K.; Colburn, N.; Li, Y. MicroRNA-21 promotes cell transformation by targeting the programmed cell death 4 gene. Oncogene 2008, 27, 4373–4379. [Google Scholar] [CrossRef]
- Xu, F.; Wang, Y.; Ling, Y.; Zhou, C.; Wang, H.; Teschendorff, A.E.; Zhao, Y.; Zhao, H.; He, Y.; Zhang, G.; et al. dbDEMC 3.0: Functional exploration of differentially expressed miRNAs in cancers of human and model organisms. Genom. Proteom. Bioinform. 2022, 20, 446–454. [Google Scholar] [CrossRef]
- Hwang, S.; Kim, C.Y.; Yang, S.; Kim, E.; Hart, T.; Marcotte, E.M.; Lee, I. HumanNet v2: Human gene networks for disease research. Nucleic Acids Res. 2019, 47, D573–D580. [Google Scholar] [CrossRef]
- Needleman, S.B.; Wunsch, C.D. A general method applicable to the search for similarities in the amino acid sequence of two proteins. J. Mol. Biol. 1970, 48, 443–453. [Google Scholar] [CrossRef]
- Wang, D.; Wang, J.; Lu, M.; Song, F.; Cui, Q. Inferring the human microRNA functional similarity and functional network based on microRNA-associated diseases. Bioinformatics 2010, 26, 1644–1650. [Google Scholar] [CrossRef]
- Van Laarhoven, T.; Nabuurs, S.B.; Marchiori, E. Gaussian interaction profile kernels for predicting drug–target interaction. Bioinformatics 2011, 27, 3036–3043. [Google Scholar]


| Method | ACC | F1 Score | Recall | Precision | AUC | AUPRC |
|---|---|---|---|---|---|---|
| NIMCGCN | 0.8131 | 0.8148 | 0.8220 | 0.8076 | 0.8945 | 0.8926 |
| AGAEMD | 0.8502 | 0.8507 | 0.8544 | 0.8481 | 0.9270 | 0.9286 |
| MINIMDA | 0.8481 | 0.8482 | 0.8529 | 0.8505 | 0.9304 | 0.9350 |
| MAGCN | 0.8483 | 0.8473 | 0.8425 | 0.8533 | 0.9245 | 0.9268 |
| AMHMDA | 0.8669 | 0.8653 | 0.8549 | 0.8763 | 0.9422 | 0.9411 |
| HGTMDA | 0.8895 | 0.8920 | 0.8950 | 0.8890 | 0.9507 | 0.9492 |
| Method | HGT-A | HGT-B | HGT-C | HGT-D | HGTMDA |
|---|---|---|---|---|---|
| AUC | 0.9411 | 0.9398 | 0.9392 | 0.9482 | 0.9507 |
| AUPR | 0.9402 | 0.9384 | 0.9383 | 0.9467 | 0.9492 |
| Cancer | Top 20 Prediction | |||||
|---|---|---|---|---|---|---|
| Rank | miRNA | Evidence | Rank | miRNA | Evidence | |
| Lung cancer | 1 | hsa-mir-155 | dbDEMC | 11 | hsa-mir-218 | dbDEMC |
| 2 | hsa-mir-21 | dbDEMC | 12 | hsa-mir-20b | dbDEMC | |
| 3 | hsa-mir-17 | dbDEMC | 13 | hsa-mir-192 | dbDEMC | |
| 4 | hsa-mir-126 | dbDEMC | 14 | hsa-mir-34a | dbDEMC | |
| 5 | hsa-mir-20a | dbDEMC | 15 | hsa-mir-133a | dbDEMC | |
| 6 | hsa-mir-145 | dbDEMC | 16 | hsa-mir-146a | dbDEMC | |
| 7 | hsa-mir-601 | dbDEMC | 17 | hsa-mir-15a | dbDEMC | |
| 8 | hsa-mir-223 | dbDEMC | 18 | hsa-mir-200b | dbDEMC | |
| 9 | hsa-mir-424 | dbDEMC | 19 | hsa-mir-339 | dbDEMC | |
| 10 | hsa-mir-106b | dbDEMC | 20 | hsa-mir-31 | dbDEMC | |
| Colorectal cancer | 1 | hsa-mir-21 | dbDEMC | 11 | hsa-mir-10b | dbDEMC |
| 2 | hsa-mir-146a | dbDEMC | 12 | hsa-mir-126 | dbDEMC | |
| 3 | hsa-mir-34a | dbDEMC | 13 | hsa-mir-29a | dbDEMC | |
| 4 | hsa-mir-143 | dbDEMC | 14 | hsa-mir-210 | dbDEMC | |
| 5 | hsa-mir-145 | dbDEMC | 15 | hsa-mir-100 | dbDEMC | |
| 6 | hsa-let-7b | dbDEMC | 16 | hsa-mir-106a | dbDEMC | |
| 7 | hsa-mir-133a | dbDEMC | 17 | hsa-mir-451 | dbDEMC | |
| 8 | hsa-mir-92b | dbDEMC | 18 | hsa-mir-196a | dbDEMC | |
| 9 | hsa-mir-17 | dbDEMC | 19 | hsa-let-7a | dbDEMC | |
| 10 | hsa-mir-92a | dbDEMC | 20 | hsa-mir-20a | dbDEMC | |
Disclaimer/Publisher’s Note: The statements, opinions and data contained in all publications are solely those of the individual author(s) and contributor(s) and not of MDPI and/or the editor(s). MDPI and/or the editor(s) disclaim responsibility for any injury to people or property resulting from any ideas, methods, instructions or products referred to in the content. |
© 2024 by the authors. Licensee MDPI, Basel, Switzerland. This article is an open access article distributed under the terms and conditions of the Creative Commons Attribution (CC BY) license (https://creativecommons.org/licenses/by/4.0/).
Share and Cite
Lu, D.; Li, J.; Zheng, C.; Liu, J.; Zhang, Q. HGTMDA: A Hypergraph Learning Approach with Improved GCN-Transformer for miRNA–Disease Association Prediction. Bioengineering 2024, 11, 680. https://doi.org/10.3390/bioengineering11070680
Lu D, Li J, Zheng C, Liu J, Zhang Q. HGTMDA: A Hypergraph Learning Approach with Improved GCN-Transformer for miRNA–Disease Association Prediction. Bioengineering. 2024; 11(7):680. https://doi.org/10.3390/bioengineering11070680
Chicago/Turabian StyleLu, Daying, Jian Li, Chunhou Zheng, Jinxing Liu, and Qi Zhang. 2024. "HGTMDA: A Hypergraph Learning Approach with Improved GCN-Transformer for miRNA–Disease Association Prediction" Bioengineering 11, no. 7: 680. https://doi.org/10.3390/bioengineering11070680
APA StyleLu, D., Li, J., Zheng, C., Liu, J., & Zhang, Q. (2024). HGTMDA: A Hypergraph Learning Approach with Improved GCN-Transformer for miRNA–Disease Association Prediction. Bioengineering, 11(7), 680. https://doi.org/10.3390/bioengineering11070680