

Assessment of Albumin-Incorporating Scores at Hepatocellular Carcinoma Diagnosis Using Machine Learning Techniques: An Evaluation of Prognostic Relevance

 , , , and
Abstract
:1. Introduction
2. Materials and Methods
2.1. Population
2.2. Data Variables
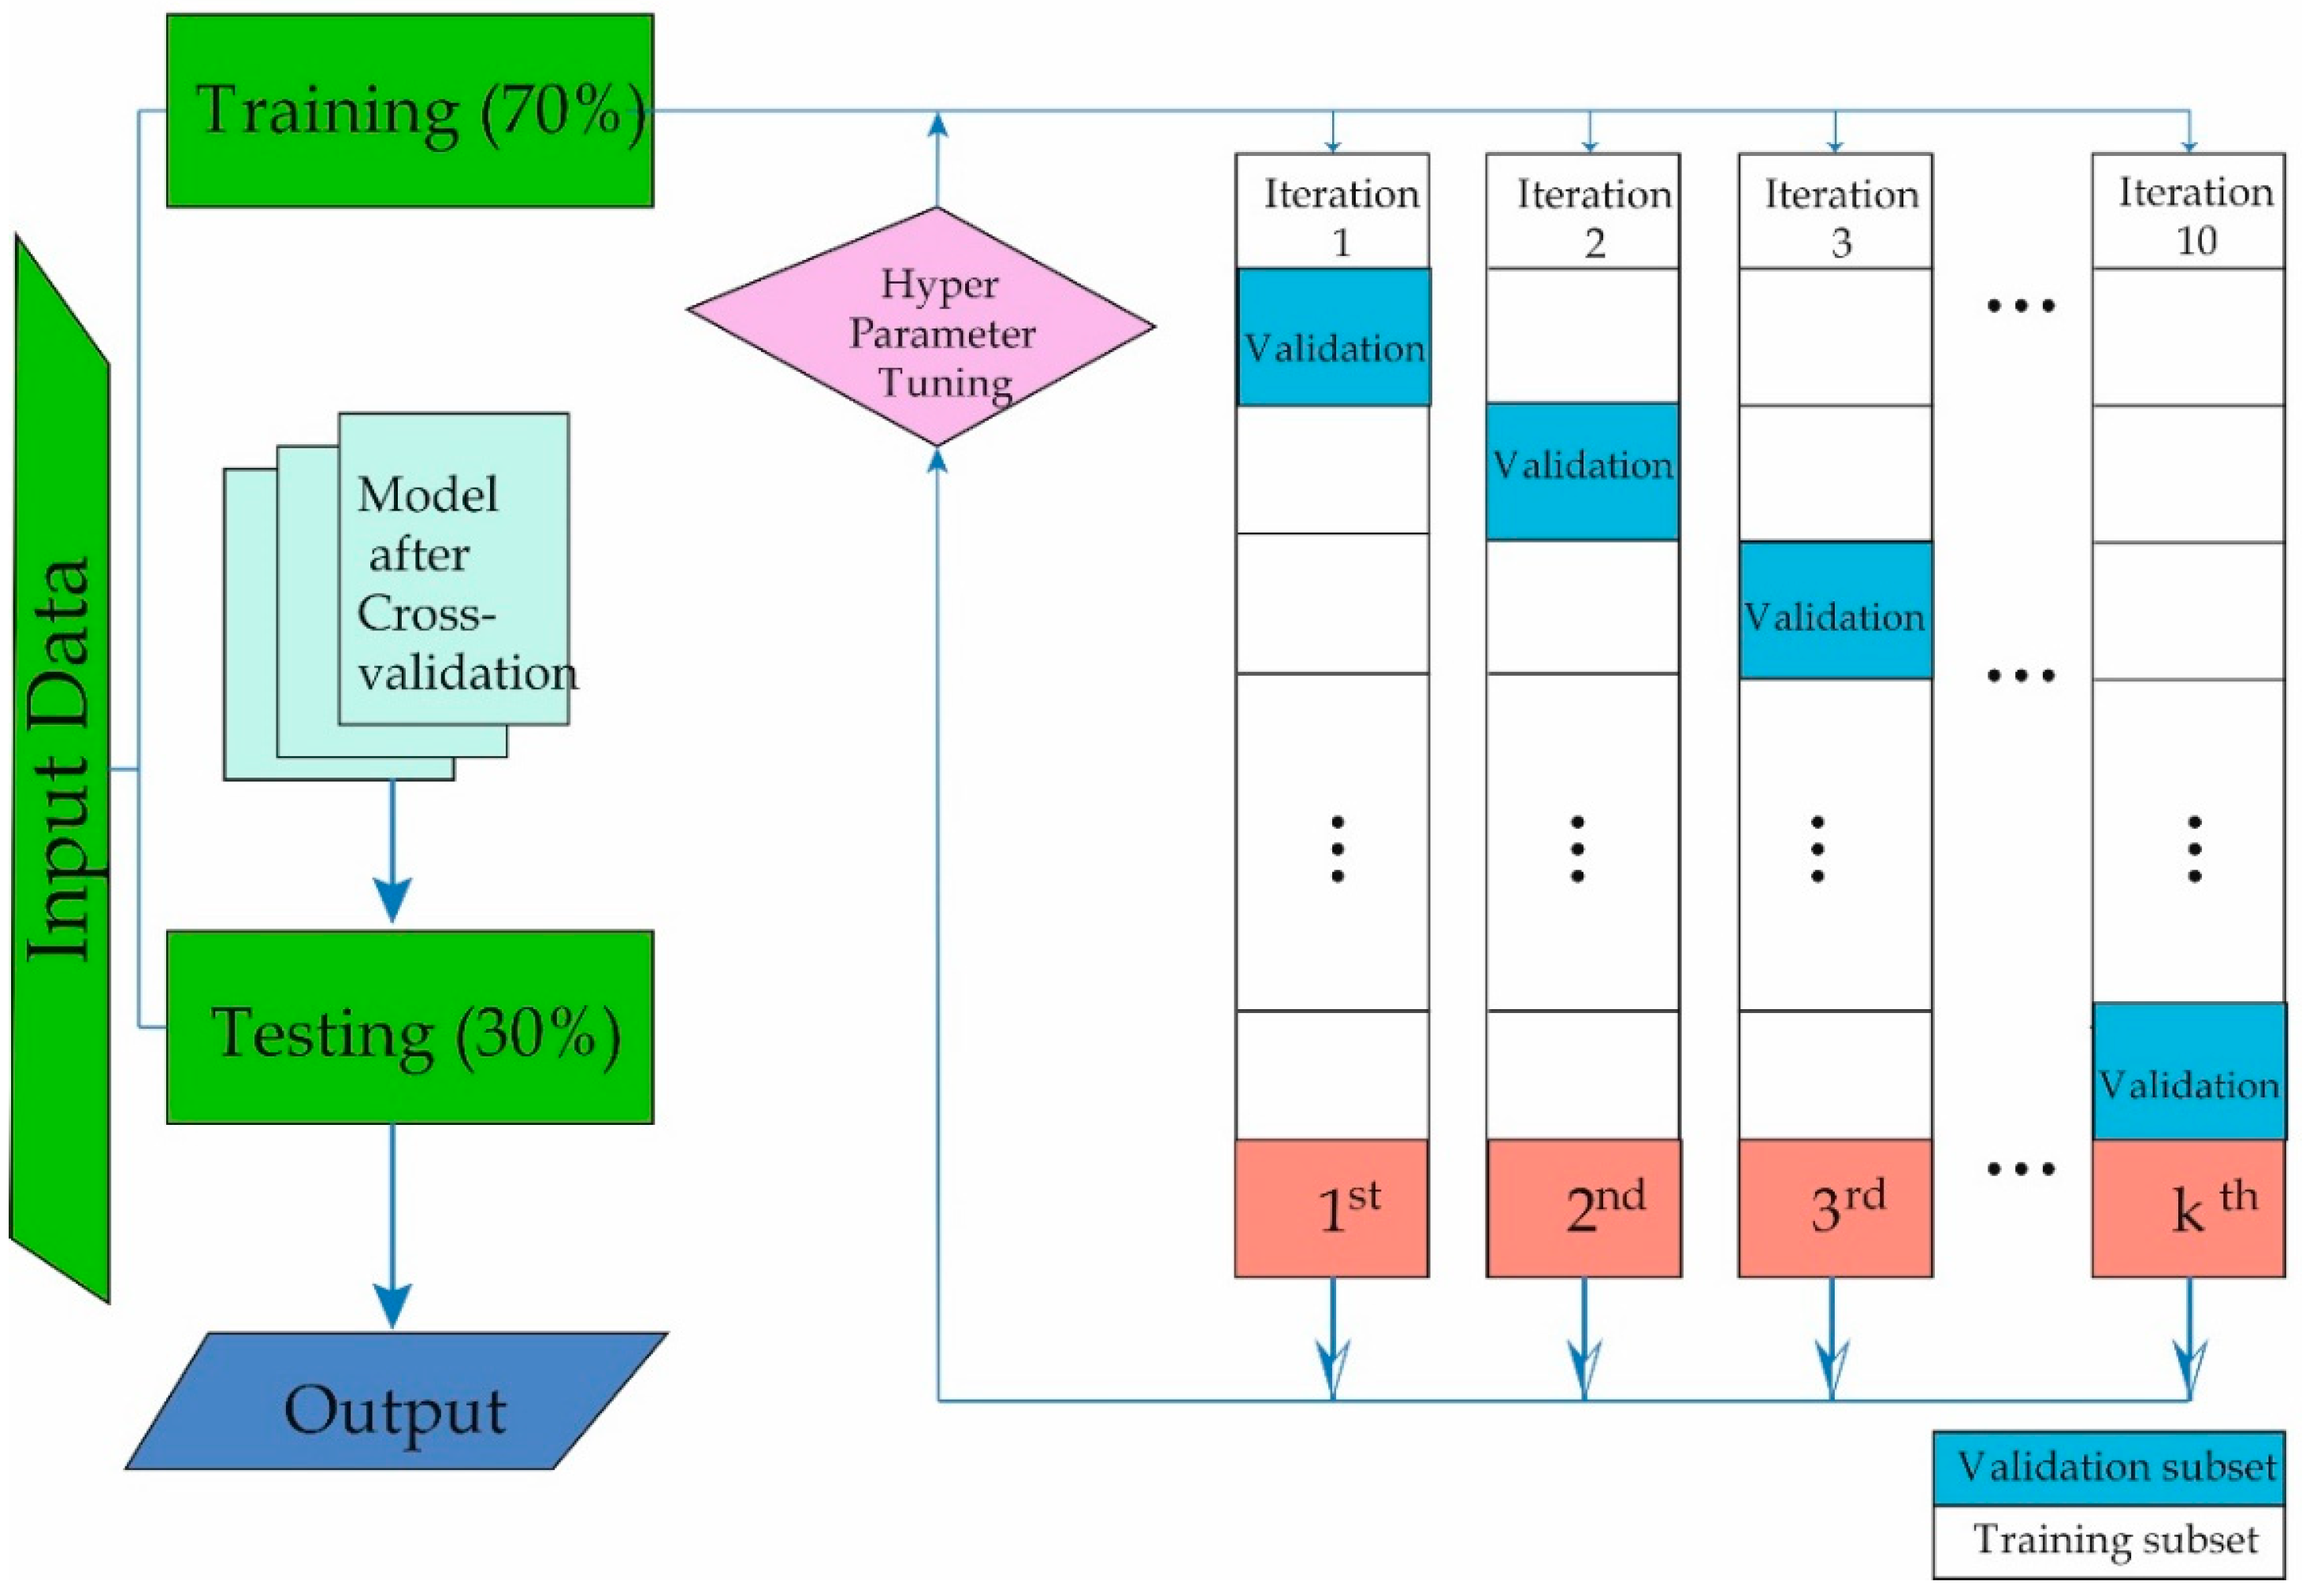
2.3. Machine Learning
3. Results
4. Discussion
5. Conclusions
Author Contributions
Funding
Institutional Review Board Statement
Informed Consent Statement
Data Availability Statement
Acknowledgments
Conflicts of Interest
References
- Rumgay, H.; Ferlay, J.; de Martel, C.; Georges, D.; Ibrahim, A.S.; Zheng, R.; Wei, W.; Lemmens, V.E.; Soerjomataram, I. Global, regional and national burden of primary liver cancer by subtype. Eur. J. Cancer 2022, 161, 108–118. [Google Scholar] [CrossRef] [PubMed]
- Sung, H.; Ferlay, J.; Siegel, R.L.; Laversanne, M.; Soerjomataram, I.; Jemal, A.; Bray, F. Global cancer statistics 2020: GLOBOCAN estimates of incidence and mortality worldwide for 36 cancers in 185 countries. CA Cancer J. Clin. 2021, 71, 209–249. [Google Scholar] [CrossRef] [PubMed]
- Zhang, C.H.; Cheng, Y.; Zhang, S.; Fan, J.; Gao, Q. Changing epidemiology of hepatocellular carcinoma in Asia. Liver Int. 2022, 42, 2029–2041. [Google Scholar] [CrossRef] [PubMed]
- Amini, M.; Looha, M.A.; Zarean, E.; Pourhoseingholi, M.A. Global pattern of trends in incidence, mortality, and mortality-to-incidence ratio rates related to liver cancer, 1990–2019: A longitudinal analysis based on the global burden of disease study. BMC Public Health 2022, 22, 604. [Google Scholar] [CrossRef] [PubMed]
- Rinella, M.E.; Lazarus, J.V.; Ratziu, V.; Francque, S.M.; Sanyal, A.J.; Kanwal, F.; Romero, D.; Abdelmalek, M.F.; Anstee, Q.M.; Arab, J.P. A multi-society Delphi consensus statement on new fatty liver disease nomenclature. Ann. Hepatol. 2023, 79, 101133. [Google Scholar]
- Singal, A.G.; Kanwal, F.; Llovet, J.M. Global trends in hepatocellular carcinoma epidemiology: Implications for screening, prevention and therapy. Nat. Rev. Clin. Oncol. 2023, 20, 864–884. [Google Scholar] [CrossRef] [PubMed]
- Toh, M.R.; Wong, E.Y.T.; Wong, S.H.; Ng, A.W.T.; Loo, L.-H.; Chow, P.K.-H.; Ngeow, J. Global epidemiology and genetics of hepatocellular carcinoma. Gastroenterology 2023, 164, 766–782. [Google Scholar] [CrossRef] [PubMed]
- Singal, A.G.; Llovet, J.M.; Yarchoan, M.; Mehta, N.; Heimbach, J.K.; Dawson, L.A.; Jou, J.H.; Kulik, L.M.; Agopian, V.G.; Marrero, J.A. AASLD practice guidance on prevention, diagnosis, and treatment of hepatocellular carcinoma. Hepatology 2023, 78, 1922–1965. [Google Scholar] [CrossRef] [PubMed]
- European Association for the Study of the Liver. EASL clinical practice guidelines: Management of hepatocellular carcinoma. J. Hepatol. 2018, 69, 182–236. [Google Scholar]
- Omata, M.; Cheng, A.-L.; Kokudo, N.; Kudo, M.; Lee, J.M.; Jia, J.; Tateishi, R.; Han, K.-H.; Chawla, Y.K.; Shiina, S. Asia–Pacific clinical practice guidelines on the management of hepatocellular carcinoma: A 2017 update. Hepatol. Int. 2017, 11, 317–370. [Google Scholar] [CrossRef]
- Ganesan, P.; Kulik, L.M. Hepatocellular carcinoma: New developments. Clin. Liver Dis. 2023, 27, 85–102. [Google Scholar] [CrossRef] [PubMed]
- Child, C.G. Surgery and portal hypertension. Major Probl. Clin. Surg. 1964, 1, 1–85. [Google Scholar]
- Bernardi, M.; Angeli, P.; Claria, J.; Moreau, R.; Gines, P.; Jalan, R.; Caraceni, P.; Fernandez, J.; Gerbes, A.L.; O’Brien, A.J. Albumin in decompensated cirrhosis: New concepts and perspectives. Gut 2020, 69, 1127–1138. [Google Scholar] [CrossRef] [PubMed]
- Garcia-Martinez, R.; Caraceni, P.; Bernardi, M.; Gines, P.; Arroyo, V.; Jalan, R. Albumin: Pathophysiologic basis of its role in the treatment of cirrhosis and its complications. Hepatology 2013, 58, 1836–1846. [Google Scholar] [CrossRef]
- De Mattos, Â.Z.; Simonetto, D.A.; Terra, C.; Farias, A.Q.; Bittencourt, P.L.; Pase, T.H.S.; Toazza, M.R.; de Mattos, A.A. Albumin administration in patients with cirrhosis: Current role and novel perspectives. World J. Gastroenterol. 2022, 28, 4773. [Google Scholar] [CrossRef]
- Cabibbo, G.; Aghemo, A.; Lai, Q.; Masarone, M.; Montagnese, S.; Ponziani, F.R.; Italian Association for the Study of the Liver. Optimizing systemic therapy for advanced hepatocellular carcinoma: The key role of liver function. Dig. Liver Dis. 2022, 54, 452–460. [Google Scholar] [CrossRef]
- Reig, M.; Forner, A.; Rimola, J.; Ferrer-Fàbrega, J.; Burrel, M.; Garcia-Criado, Á.; Kelley, R.K.; Galle, P.R.; Mazzaferro, V.; Salem, R. BCLC strategy for prognosis prediction and treatment recommendation: The 2022 update. J. Hepatol. 2022, 76, 681–693. [Google Scholar] [CrossRef]
- Ngiam, K.Y.; Khor, W. Big data and machine learning algorithms for health-care delivery. Lancet Oncol. 2019, 20, e262–e273. [Google Scholar] [CrossRef] [PubMed]
- Khan, R.A.; Luo, Y.; Wu, F.-X. Machine learning based liver disease diagnosis: A systematic review. Neurocomputing 2022, 468, 492–509. [Google Scholar] [CrossRef]
- Suárez, M.; Martínez, R.; Torres, A.M.; Torres, B.; Mateo, J. A Machine Learning Method to Identify the Risk Factors for Liver Fibrosis Progression in Nonalcoholic Steatohepatitis. Dig. Dis. Sci. 2023, 68, 3801–3809. [Google Scholar] [CrossRef]
- Khan, F.N.; Yousef, M.; Raza, K. Machine Learning-Based Models in the Diagnosis, Prognosis and Effective Cancer Therapeutics: Current State-of-the-Art. In Computational Intelligence in Oncology: Applications in Diagnosis, Prognosis and Therapeutics of Cancers; Raza, K., Ed.; Springer: Singapore, 2022; pp. 19–54. [Google Scholar] [CrossRef]
- Johnson, K.W.; Torres Soto, J.; Glicksberg, B.S.; Shameer, K.; Miotto, R.; Ali, M.; Ashley, E.; Dudley, J.T. Artificial intelligence in cardiology. J. Am. Coll. Cardiol. 2018, 71, 2668–2679. [Google Scholar] [CrossRef] [PubMed]
- Mirijello, A.; Fontana, A.; Greco, A.P.; Tosoni, A.; D’Agruma, A.; Labonia, M.; Copetti, M.; Piscitelli, P.; De Cosmo, S.; the Internal Medicine Sepsis Study Group. Identifying predictors associated with risk of death or admission to intensive care unit in internal medicine patients with sepsis: A comparison of statistical models and machine learning algorithms. Antibiotics 2023, 12, 925. [Google Scholar] [CrossRef] [PubMed]
- Sagi, O.; Rokach, L. Approximating XGBoost with an interpretable decision tree. Inf. Sci. 2021, 572, 522–542. [Google Scholar] [CrossRef]
- Zhang, X.; Yan, C.; Gao, C.; Malin, B.A.; Chen, Y. Predicting missing values in medical data via XGBoost regression. J. Healthc. Inform. Res. 2020, 4, 383–394. [Google Scholar] [CrossRef]
- Gabulova, R.; Marzà-Florensa, A.; Rahimov, U.; Isayeva, M.; Alasgarli, S.; Musayeva, A.; Gahramanova, S.; Ibrahimov, F.; Aliyev, F.; Imanov, G. Risk factors in cardiovascular patients: Challenges and opportunities to improve secondary prevention. World J. Cardiol. 2023, 15, 342. [Google Scholar] [CrossRef] [PubMed]
- Singal, A.K.; Bataller, R.; Ahn, J.; Kamath, P.S.; Shah, V.H. ACG clinical guideline: Alcoholic liver disease. Am. J. Gastroenterol. 2018, 113, 175. [Google Scholar] [CrossRef]
- Engin, A. The definition and prevalence of obesity and metabolic syndrome. Obes. Lipotoxicity 2017, 960, 1–17. [Google Scholar]
- Blonde, L.; Umpierrez, G.E.; Reddy, S.S.; McGill, J.B.; Berga, S.L.; Bush, M.; Chandrasekaran, S.; DeFronzo, R.A.; Einhorn, D.; Galindo, R.J. American Association of Clinical Endocrinology clinical practice guideline: Developing a diabetes mellitus comprehensive care plan—2022 Update. Endocr. Pract. 2022, 28, 923–1049. [Google Scholar] [PubMed]
- O’Malley, P.G.; Arnold, M.J.; Kelley, C.; Spacek, L.; Buelt, A.; Natarajan, S.; Donahue, M.P.; Vagichev, E.; Ballard-Hernandez, J.; Logan, A. Management of dyslipidemia for cardiovascular disease risk reduction: Synopsis of the 2020 updated US Department of Veterans Affairs and US Department of Defense clinical practice guideline. Ann. Intern. Med. 2020, 173, 822–829. [Google Scholar] [CrossRef] [PubMed]
- Rose, C.F.; Amodio, P.; Bajaj, J.S.; Dhiman, R.K.; Montagnese, S.; Taylor-Robinson, S.D.; Vilstrup, H.; Jalan, R. Hepatic encephalopathy: Novel insights into classification, pathophysiology and therapy. J. Hepatol. 2020, 73, 1526–1547. [Google Scholar] [CrossRef]
- Aithal, G.P.; Palaniyappan, N.; China, L.; Härmälä, S.; Macken, L.; Ryan, J.M.; Wilkes, E.A.; Moore, K.; Leithead, J.A.; Hayes, P.C. Guidelines on the management of ascites in cirrhosis. Gut 2021, 70, 9–29. [Google Scholar] [CrossRef] [PubMed]
- Azam, F.; Latif, M.F.; Farooq, A.; Tirmazy, S.H.; AlShahrani, S.; Bashir, S.; Bukhari, N. Performance status assessment by using ECOG (Eastern Cooperative Oncology Group) score for cancer patients by oncology healthcare professionals. Case Rep. Oncol. 2020, 12, 728–736. [Google Scholar] [CrossRef] [PubMed]
- Johnson, P.J.; Berhane, S.; Kagebayashi, C.; Satomura, S.; Teng, M.; Reeves, H.L.; O’Beirne, J.; Fox, R.; Skowronska, A.; Palmer, D. Assessment of liver function in patients with hepatocellular carcinoma: A new evidence-based approach—The ALBI grade. J. Clin. Oncol. 2015, 33, 550. [Google Scholar] [CrossRef] [PubMed]
- Faisal, M.S.; Singh, T.; Amin, H.; Esfeh, J.M. Role of platelet-albumin-bilirubin score in predicting re-bleeding after band ligation for acute variceal hemorrhage. World J. Hepatol. 2020, 12, 880. [Google Scholar] [CrossRef] [PubMed]
- Kinoshita, A.; Onoda, H.; Imai, N.; Iwaku, A.; Oishi, M.; Tanaka, K.; Fushiya, N.; Koike, K.; Nishino, H.; Matsushima, M. The C-reactive protein/albumin ratio, a novel inflammation-based prognostic score, predicts outcomes in patients with hepatocellular carcinoma. Ann. Surg. Oncol. 2015, 22, 803–810. [Google Scholar] [CrossRef] [PubMed]
- Suárez, M.; Martínez, R.; Torres, A.M.; Ramón, A.; Blasco, P.; Mateo, J. Personalized Risk Assessment of Hepatic Fibrosis after Cholecystectomy in Metabolic-Associated Steatotic Liver Disease: A Machine Learning Approach. J. Clin. Med. 2023, 12, 6489. [Google Scholar] [CrossRef] [PubMed]
- Jabeur, S.B.; Mefteh-Wali, S.; Viviani, J.-L. Forecasting gold price with the XGBoost algorithm and SHAP interaction values. Ann. Oper. Res. 2024, 334, 679–699. [Google Scholar] [CrossRef]
- Zhang, D.; Gong, Y. The comparison of LightGBM and XGBoost coupling factor analysis and prediagnosis of acute liver failure. IEEE Access 2020, 8, 220990–221003. [Google Scholar] [CrossRef]
- Nistal-Nuño, B. Developing machine learning models for prediction of mortality in the medical intensive care unit. Comput. Methods Programs Biomed. 2022, 216, 106663. [Google Scholar] [CrossRef]
- Dong, J.; Chen, Y.; Yao, B.; Zhang, X.; Zeng, N. A neural network boosting regression model based on XGBoost. Appl. Soft Comput. 2022, 125, 109067. [Google Scholar] [CrossRef]
- Budholiya, K.; Shrivastava, S.K.; Sharma, V. An optimized XGBoost based diagnostic system for effective prediction of heart disease. J. King Saud Univ.-Comput. Inf. Sci. 2022, 34, 4514–4523. [Google Scholar] [CrossRef]
- Azar, A.T.; El-Metwally, S.M. Decision tree classifiers for automated medical diagnosis. Neural Comput. Appl. 2013, 23, 2387–2403. [Google Scholar] [CrossRef]
- Kamel, H.; Abdulah, D.; Al-Tuwaijari, J.M. Cancer classification using gaussian naive bayes algorithm. In Proceedings of the 2019 International Engineering Conference (IEC), Erbil, Iraq, 23–25 June 2019; pp. 165–170. [Google Scholar]
- Campbell, E.; Phinyomark, A.; Scheme, E. Linear discriminant analysis with bayesian risk parameters for myoelectric control. In Proceedings of the 2019 IEEE Global Conference on Signal and Information Processing (GlobalSIP), Ottawa, ON, Canada, 11–14 November 2019; pp. 1–5. [Google Scholar]
- Xing, W.; Bei, Y. Medical health big data classification based on KNN classification algorithm. IEEE Access 2019, 8, 28808–28819. [Google Scholar] [CrossRef]
- Shen, Y.; Wu, C.; Liu, C.; Wu, Y.; Xiong, N. Oriented feature selection SVM applied to cancer prediction in precision medicine. IEEE Access 2018, 6, 48510–48521. [Google Scholar] [CrossRef]
- Suárez, M.; Gil-Rojas, S.; Martínez-Blanco, P.; Torres, A.M.; Ramón, A.; Blasco-Segura, P.; Torralba, M.; Mateo, J. Machine Learning-Based Assessment of Survival and Risk Factors in Non-Alcoholic Fatty Liver Disease-Related Hepatocellular Carcinoma for Optimized Patient Management. Cancers 2024, 16, 1114. [Google Scholar] [CrossRef]
- Alpaydin, E. Introduction to Machine Learning; MIT Press: Cambridge, MA, USA, 2020. [Google Scholar]
- Wang, S.; Li, D.; Petrick, N.; Sahiner, B.; Linguraru, M.G.; Summers, R.M. Optimizing area under the ROC curve using semi-supervised learning. Pattern Recognit. 2015, 48, 276–287. [Google Scholar] [CrossRef] [PubMed]
- Yacouby, R.; Axman, D. Probabilistic extension of precision, recall, and f1 score for more thorough evaluation of classification models. In Proceedings of the First Workshop on Evaluation And Comparison of NLP Systems, Online, 20 November 2020; pp. 79–91. [Google Scholar]
- Chicco, D.; Jurman, G. The advantages of the Matthews correlation coefficient (MCC) over F1 score and accuracy in binary classification evaluation. BMC Genom. 2020, 21, 1–13. [Google Scholar] [CrossRef] [PubMed]
- Aznar-Gimeno, R.; Esteban, L.M.; Sanz, G.; del-Hoyo-Alonso, R. Comparing the Min–Max–Median/IQR Approach with the Min–Max Approach, Logistic Regression and XGBoost, Maximising the Youden Index. Symmetry 2023, 15, 756. [Google Scholar] [CrossRef]
- Araújo, F.H.; Santana, A.M.; Neto, P.d.A.S. Using machine learning to support healthcare professionals in making preauthorisation decisions. Int. J. Med. Inform. 2016, 94, 1–7. [Google Scholar] [CrossRef]
- Heydarian, M.; Doyle, T.E.; Samavi, R. MLCM: Multi-label confusion matrix. IEEE Access 2022, 10, 19083–19095. [Google Scholar] [CrossRef]
- Shah, N.H.; Milstein, A.; Bagley, S.C. Making machine learning models clinically useful. JAMA 2019, 322, 1351–1352. [Google Scholar] [CrossRef] [PubMed]
- Moman, R.N.; Gupta, N.; Varacallo, M. Physiology, Albumin; StatPearls Publishing: Treasure Island, FL, USA, 2017. [Google Scholar]
- Carvalho, J.R.; Machado, M.V. New insights about albumin and liver disease. Ann. Hepatol. 2018, 17, 547–560. [Google Scholar] [CrossRef] [PubMed]
- Garcia-Tsao, G.; Abraldes, J.G.; Rich, N.E.; Wong, V.W.-S. AGA Clinical Practice Update on the Use of Vasoactive Drugs and Intravenous Albumin in Cirrhosis: Expert Review. Gastroenterology 2024, 166, 202–210. [Google Scholar] [CrossRef] [PubMed]
- Di Pascoli, M.; Fasolato, S.; Piano, S.; Bolognesi, M.; Angeli, P. Long-term administration of human albumin improves survival in patients with cirrhosis and refractory ascites. Liver Int. 2019, 39, 98–105. [Google Scholar] [CrossRef] [PubMed]
- Oikonomou, T.; Goulis, I.; Doumtsis, P.; Tzoumari, T.; Akriviadis, E.; Cholongitas, E. ALBI and PALBI grades are associated with the outcome of patients with stable decompensated cirrhosis. Ann. Hepatol. 2019, 18, 126–136. [Google Scholar] [CrossRef] [PubMed]
- Elshaarawy, O.; Allam, N.; Abdelsameea, E.; Gomaa, A.; Waked, I. Platelet-albumin-bilirubin score-a predictor of outcome of acute variceal bleeding in patients with cirrhosis. World J. Hepatol. 2020, 12, 99. [Google Scholar] [CrossRef] [PubMed]
- Ieda, S.; Miyamoto, T.; Hosomi, K.; Takegami, M.; Kawabata, A. Identification of remaining life expectancy less than two weeks by C-reactive protein/albumin ratio, Prognostic Nutritional Index, Fibrosis-4 Index, and Albumin-Bilirubin Score in terminal cancer patients. J. Palliat. Med. 2022, 25, 570–576. [Google Scholar] [CrossRef]
- Nguyen-Khac, E.; Thiele, M.; Voican, C.; Nahon, P.; Moreno, C.; Boursier, J.; Mueller, S.; De Ledinghen, V.; Stärkel, P.; Kim, S.G. Non-invasive diagnosis of liver fibrosis in patients with alcohol-related liver disease by transient elastography: An individual patient data meta-analysis. Lancet Gastroenterol. Hepatol. 2018, 3, 614–625. [Google Scholar] [CrossRef] [PubMed]
- Lurie, Y.; Webb, M.; Cytter-Kuint, R.; Shteingart, S.; Lederkremer, G.Z. Non-invasive diagnosis of liver fibrosis and cirrhosis. World J. Gastroenterol. 2015, 21, 11567. [Google Scholar] [CrossRef]
- Schütte, K.; Tippelt, B.; Schulz, C.; Röhl, F.-W.; Feneberg, A.; Seidensticker, R.; Arend, J.; Malfertheiner, P. Malnutrition is a prognostic factor in patients with hepatocellular carcinoma (HCC). Clin. Nutr. 2015, 34, 1122–1127. [Google Scholar] [CrossRef]
- Woodman, R.J.; Mangoni, A.A. A comprehensive review of machine learning algorithms and their application in geriatric medicine: Present and future. Aging Clin. Exp. Res. 2023, 35, 2363–2397. [Google Scholar] [CrossRef] [PubMed]
- Bottrighi, A.; Pennisi, M. Exploring the State of Machine Learning and Deep Learning in Medicine: A Survey of the Italian Research Community. Information 2023, 14, 513. [Google Scholar] [CrossRef]
- Zou, Y.; Yue, M.; Jia, L.; Wang, Y.; Chen, H.; Zhang, A.; Xia, X.; Liu, W.; Yu, R.; Yang, S. Accurate prediction of HCC risk after SVR in patients with hepatitis C cirrhosis based on longitudinal data. BMC Cancer 2023, 23, 1147. [Google Scholar] [CrossRef] [PubMed]
- Minami, T.; Sato, M.; Toyoda, H.; Yasuda, S.; Yamada, T.; Nakatsuka, T.; Enooku, K.; Nakagawa, H.; Fujinaga, H.; Izumiya, M. Machine learning for individualized prediction of hepatocellular carcinoma development after the eradication of hepatitis C virus with antivirals. J. Hepatol. 2023, 79, 1006–1014. [Google Scholar] [CrossRef]
- Brehar, R.; Mitrea, D.-A.; Vancea, F.; Marita, T.; Nedevschi, S.; Lupsor-Platon, M.; Rotaru, M.; Badea, R.I. Comparison of deep-learning and conventional machine-learning methods for the automatic recognition of the hepatocellular carcinoma areas from ultrasound images. Sensors 2020, 20, 3085. [Google Scholar] [CrossRef]
- Singal, A.G.; Mukherjee, A.; Elmunzer, J.B.; Higgins, P.D.; Lok, A.S.; Zhu, J.; Marrero, J.A.; Waljee, A.K. Machine learning algorithms outperform conventional regression models in predicting development of hepatocellular carcinoma. Off. J. Am. Coll. Gastroenterol. ACG 2013, 108, 1723–1730. [Google Scholar] [CrossRef]
- Zou, Z.-M.; Chang, D.-H.; Liu, H.; Xiao, Y.-D. Current updates in machine learning in the prediction of therapeutic outcome of hepatocellular carcinoma: What should we know? Insights Imaging 2021, 12, 31. [Google Scholar] [CrossRef] [PubMed]
- Liu, P.H.; Hsu, C.Y.; Hsia, C.Y.; Lee, Y.H.; Chiou, Y.Y.; Huang, Y.H.; Lee, F.Y.; Lin, H.C.; Hou, M.C.; Huo, T.I. ALBI and PALBI grade predict survival for HCC across treatment modalities and BCLC stages in the MELD Era. J. Gastroenterol. Hepatol. 2017, 32, 879–886. [Google Scholar] [CrossRef]
- Lee, S.K.; Song, M.J.; Kim, S.H.; Park, M. Comparing various scoring system for predicting overall survival according to treatment modalities in hepatocellular carcinoma focused on Platelet-albumin-bilirubin (PALBI) and albumin-bilirubin (ALBI) grade: A nationwide cohort study. PLoS ONE 2019, 14, e0216173. [Google Scholar] [CrossRef]
- Liu, R.; Li, R.; Zhang, M.; Liu, W.; Li, H.; Li, D. Prognostic value of platelet-albumin-bilirubin grade in Child-Pugh A and B patients with hepatocellular carcinoma: A meta-analysis. Front. Oncol. 2022, 12, 914997. [Google Scholar] [CrossRef]
- Lu, L.-H.; Zhang, Y.-F.; Mu-Yan, C.; Kan, A.; Zhong, X.-P.; Mei, J.; Ling, Y.-H.; Li, S.-H.; Shi, M.; Wei, W. Platelet-albumin-bilirubin grade: Risk stratification of liver failure, prognosis after resection for hepatocellular carcinoma. Dig. Liver Dis. 2019, 51, 1430–1437. [Google Scholar] [CrossRef] [PubMed]
- Jaruvongvanich, V.; Sempokuya, T.; Wong, L. Is there an optimal staging system or liver reserve model that can predict outcome in hepatocellular carcinoma? J. Gastrointest. Oncol. 2018, 9, 750. [Google Scholar] [CrossRef] [PubMed]
- Zhang, C.; Liu, C.; Zhang, X.; Almpanidis, G. An up-to-date comparison of state-of-the-art classification algorithms. Expert Syst. Appl. 2017, 82, 128–150. [Google Scholar] [CrossRef]
- Han, J.; Pei, J.; Tong, H. Data Mining: Concepts and Techniques; Morgan Kaufmann: San Francisco, CA, USA, 2022. [Google Scholar]
Disclaimer/Publisher’s Note: The statements. opinions and data contained in all publications are solely those of the individual author(s) and contributor(s) and not of MDPI and/or the editor(s). MDPI and/or the editor(s) disclaim responsibility for any injury to people or property resulting from any ideas. methods. instructions or products referred to in the content. |


| Method | Parameters |
|---|---|
| SVM | Kernel function: Gaussian Sigma = 0.5 C = 1.0 Numerical tolerance = 0.001 Iteration limit = 100 |
| BLDA | Kernel: Bayesian |
| GNB | Usekernel: False fL = 0 Adjust = 0 |
| KNN | Number of neighbours = 20 Distance metric: Euclidean Weight: Uniform |
| XGB | Base estimator: tree Maximum number of splits = 20 Learning rate = 0.1 Number of learners = 50 |
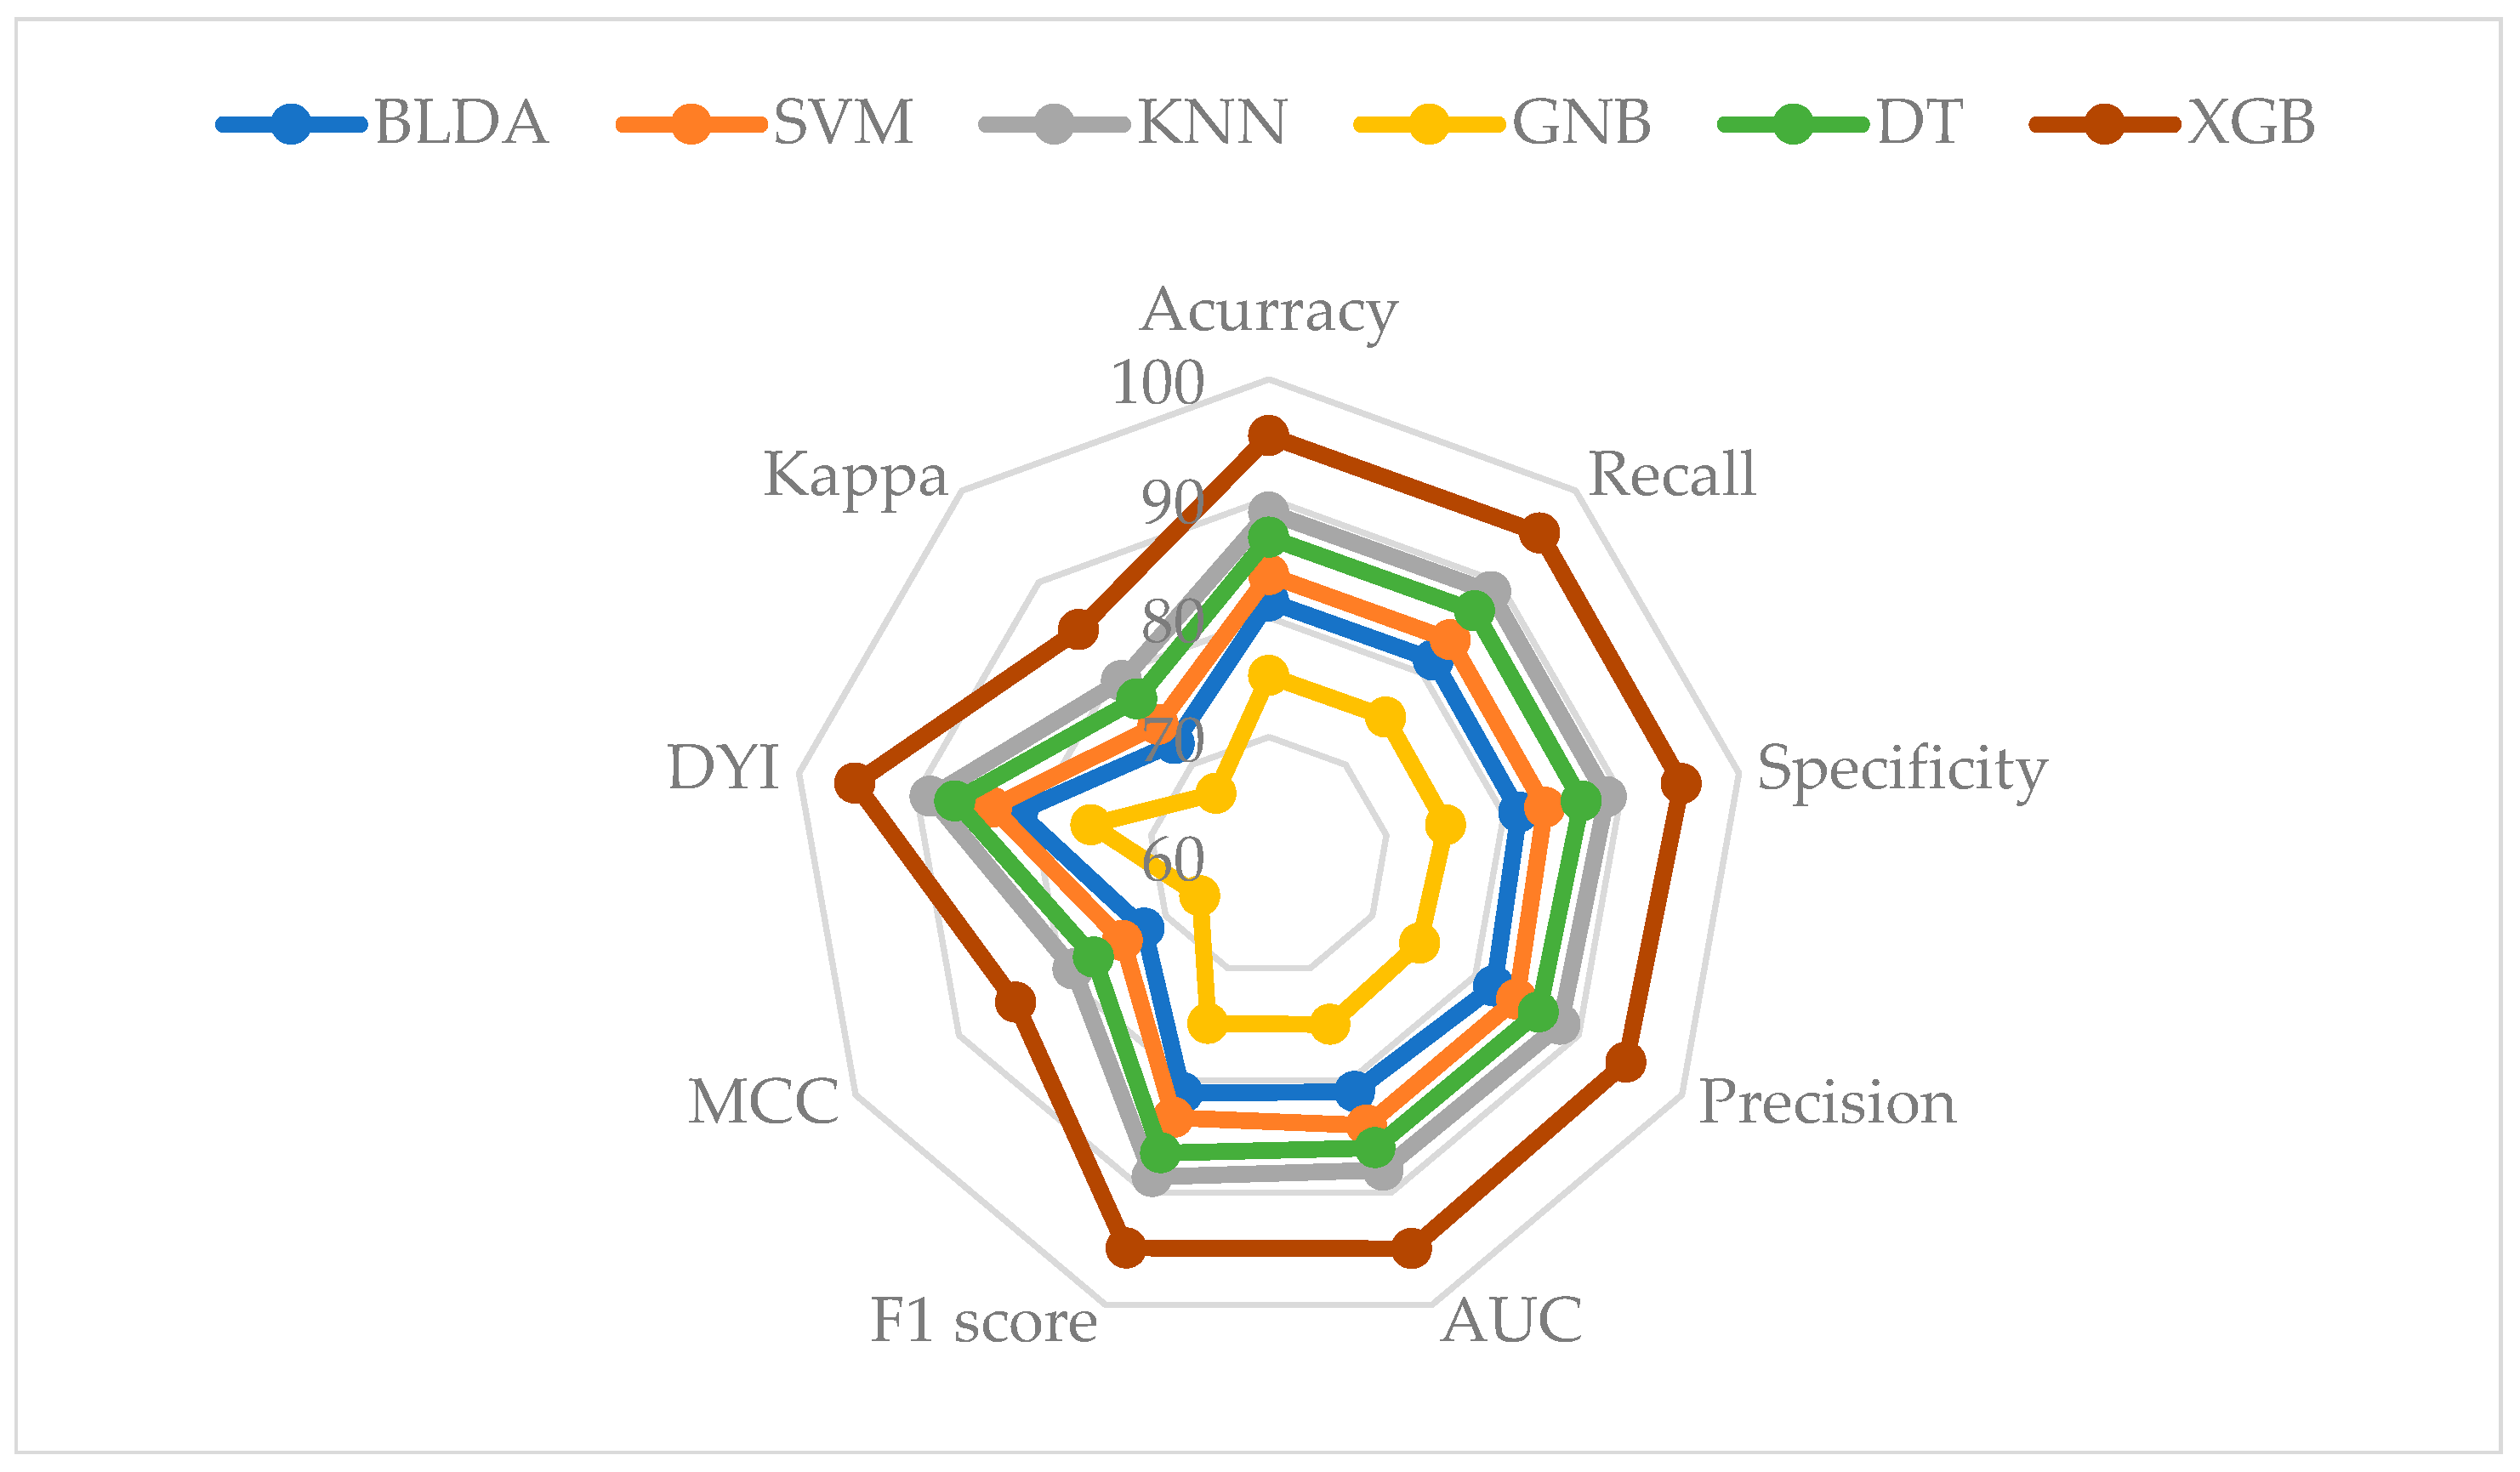
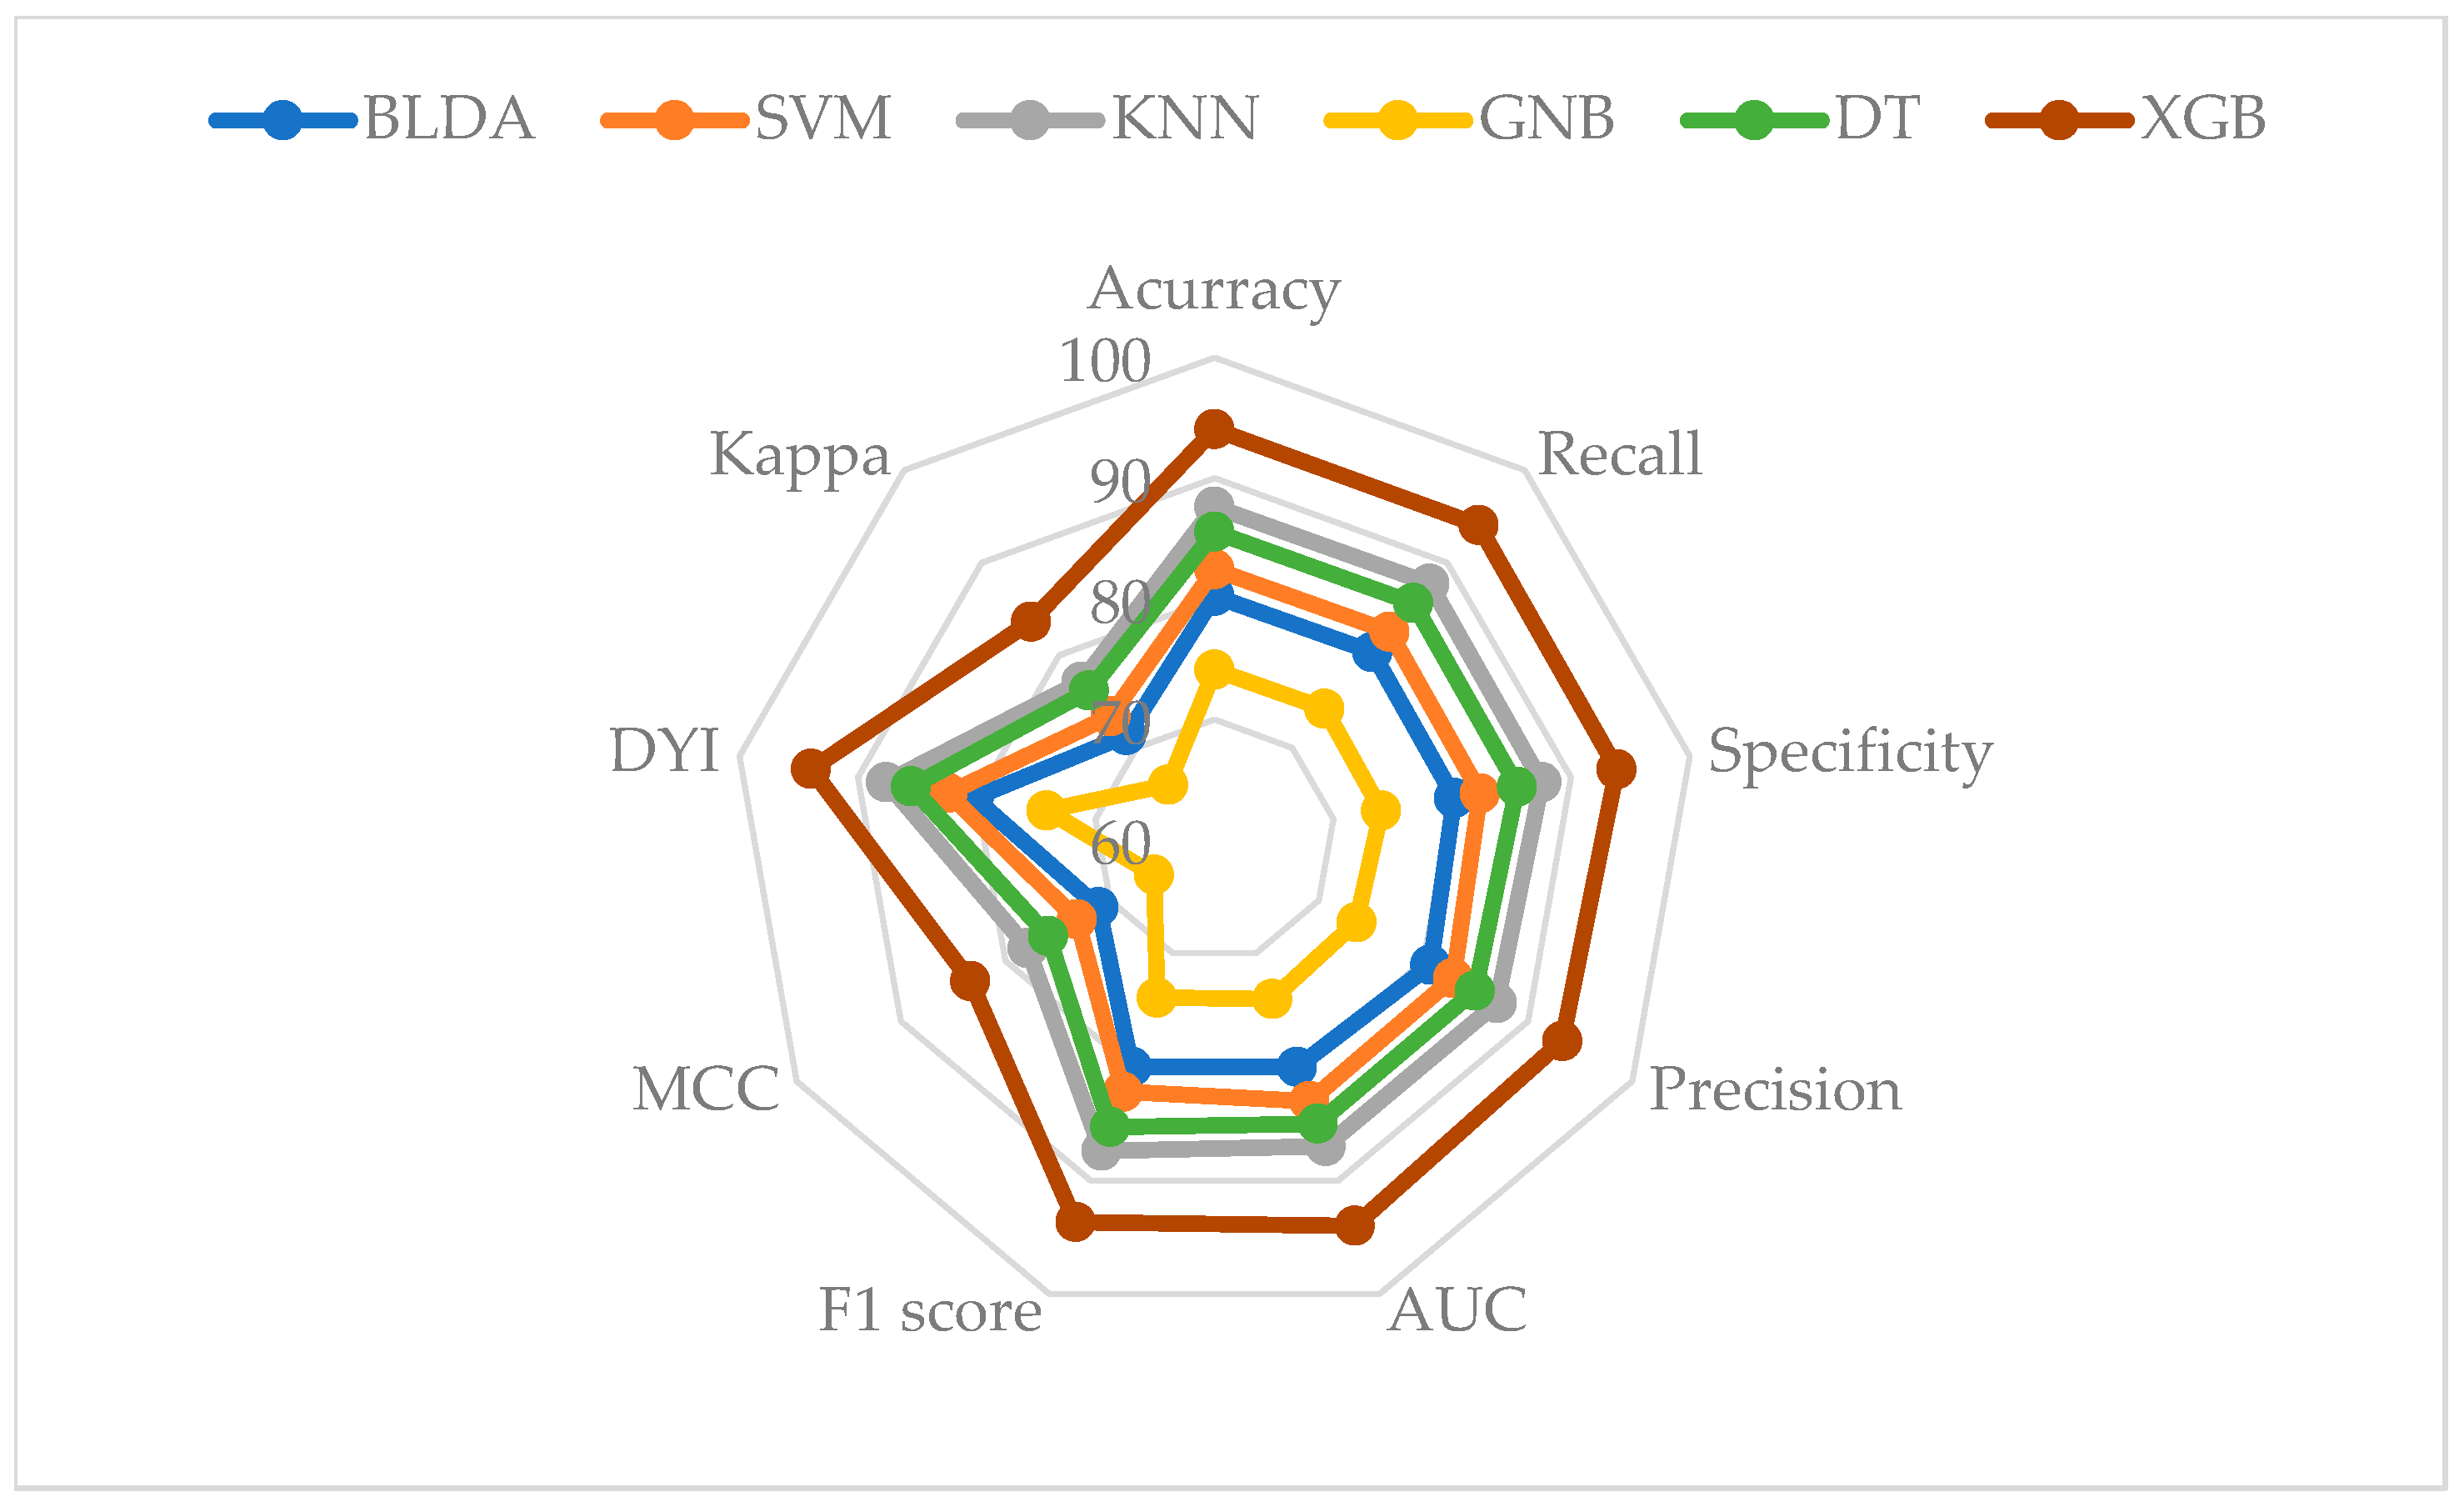
| Methods | Accuracy | Recall | Specificity | Precision |
|---|---|---|---|---|
| BLDA | 80.25 | 80.35 | 80.16 | 80.67 |
| SVM | 82.45 | 82.54 | 82.35 | 82.86 |
| KNN | 87.64 | 87.75 | 87.54 | 87.03 |
| GNB | 74.12 | 74.21 | 74.03 | 73.59 |
| DT | 85.55 | 85.65 | 85.45 | 84.94 |
| XGB | 94.05 | 94.07 | 93.84 | 93.28 |
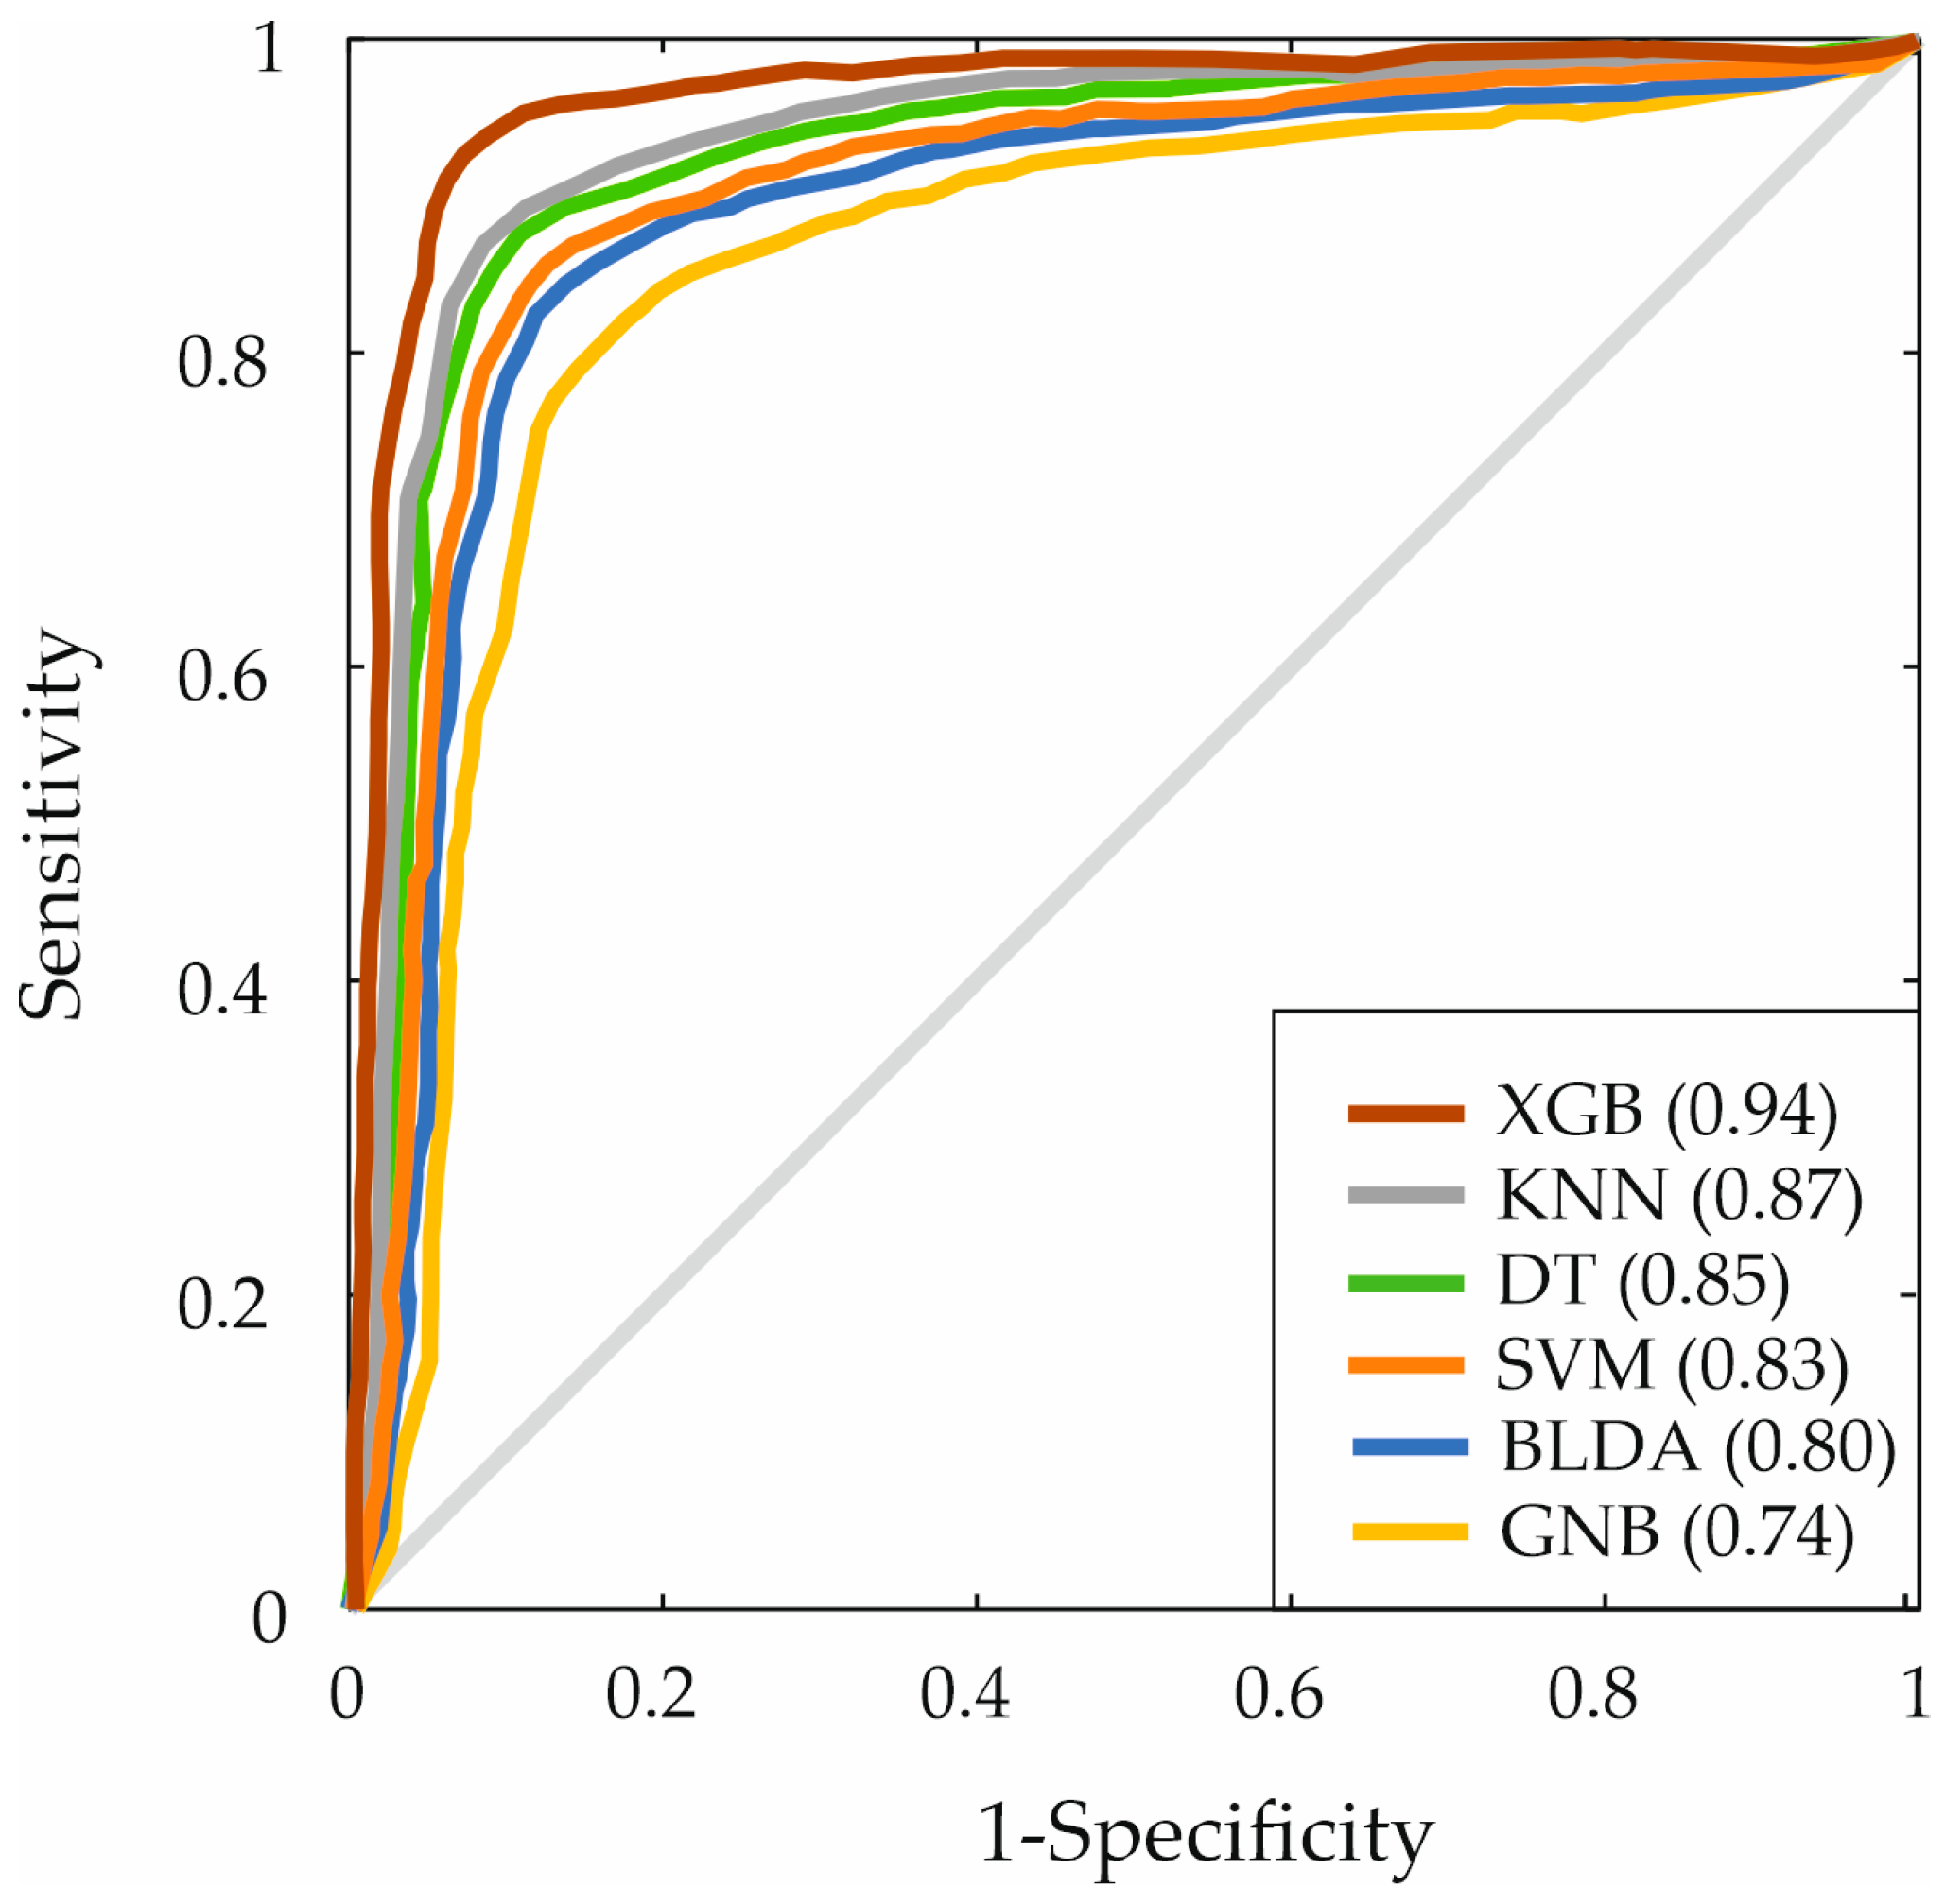
| Methods | AUC | F1 Score | MCC | DYI | Kappa |
|---|---|---|---|---|---|
| BLDA | 0.80 | 80.01 | 71.10 | 80.25 | 71.34 |
| SVM | 0.83 | 82.20 | 73.16 | 82.45 | 73.40 |
| KNN | 0.87 | 87.38 | 77.88 | 87.64 | 77.14 |
| GNB | 0.74 | 73.90 | 65.77 | 74.12 | 65.99 |
| DT | 0.85 | 85.29 | 75.91 | 85.55 | 76.16 |
| XGB | 0.94 | 93.67 | 83.37 | 93.95 | 83.64 |
Disclaimer/Publisher’s Note: The statements, opinions and data contained in all publications are solely those of the individual author(s) and contributor(s) and not of MDPI and/or the editor(s). MDPI and/or the editor(s) disclaim responsibility for any injury to people or property resulting from any ideas, methods, instructions or products referred to in the content. |
© 2024 by the authors. Licensee MDPI, Basel, Switzerland. This article is an open access article distributed under the terms and conditions of the Creative Commons Attribution (CC BY) license (https://creativecommons.org/licenses/by/4.0/).
Share and Cite
Suárez, M.; Martínez-Blanco, P.; Gil-Rojas, S.; Torres, A.M.; Torralba-González, M.; Mateo, J. Assessment of Albumin-Incorporating Scores at Hepatocellular Carcinoma Diagnosis Using Machine Learning Techniques: An Evaluation of Prognostic Relevance. Bioengineering 2024, 11, 762. https://doi.org/10.3390/bioengineering11080762
Suárez M, Martínez-Blanco P, Gil-Rojas S, Torres AM, Torralba-González M, Mateo J. Assessment of Albumin-Incorporating Scores at Hepatocellular Carcinoma Diagnosis Using Machine Learning Techniques: An Evaluation of Prognostic Relevance. Bioengineering. 2024; 11(8):762. https://doi.org/10.3390/bioengineering11080762
Chicago/Turabian StyleSuárez, Miguel, Pablo Martínez-Blanco, Sergio Gil-Rojas, Ana M. Torres, Miguel Torralba-González, and Jorge Mateo. 2024. "Assessment of Albumin-Incorporating Scores at Hepatocellular Carcinoma Diagnosis Using Machine Learning Techniques: An Evaluation of Prognostic Relevance" Bioengineering 11, no. 8: 762. https://doi.org/10.3390/bioengineering11080762