
Plaque Characteristics Derived from Intravascular Optical Coherence Tomography That Predict Cardiovascular Death

 , , ,
, , ,  , , and
Abstract
1. Introduction
2. Materials and Methods
2.1. Study Population
2.2. IVOCT Imaging and Plaque Characterization
2.3. IVOCT Feature Selection
2.4. Clinical Endpoint
2.5. Statistical Analysis
3. Results
4. Discussion
Author Contributions
Funding
Institutional Review Board Statement
Informed Consent Statement
Data Availability Statement
Acknowledgments
Conflicts of Interest
References
- Timmis, A.; Townsend, N.; Gale, C.; Grobbee, R.; Maniadakis, N.; Flather, M.; Wilkins, E.; Wright, L.; Vos, R.; Bax, J.; et al. European Society of Cardiology: Cardiovascular Disease Statistics 2017. Eur. Heart J. 2018, 39, 508–579. [Google Scholar] [CrossRef] [PubMed]
- Tuzcu, E.M.; Kapadia, S.R.; Tutar, E.; Ziada, K.M.; Hobbs, R.E.; McCarthy, P.M.; Young, J.B.; Nissen, S.E. High Prevalence of Coronary Atherosclerosis in Asymptomatic Teenagers and Young Adults. Circulation 2001, 103, 2705–2710. [Google Scholar] [CrossRef]
- Williams, M.C.; Kwiecinski, J.; Doris, M.; McElhinney, P.; D’Souza, M.S.; Cadet, S.; Adamson, P.D.; Moss, A.J.; Alam, S.; Hunter, A.; et al. Low-Attenuation Noncalcified Plaque on Coronary Computed Tomography Angiography Predicts Myocardial Infarction. Circulation 2020, 141, 1452–1462. [Google Scholar] [CrossRef]
- Ferencik, M.; Mayrhofer, T.; Bittner, D.O.; Emami, H.; Puchner, S.B.; Lu, M.T.; Meyersohn, N.M.; Ivanov, A.V.; Adami, E.C.; Patel, M.R.; et al. Use of High-Risk Coronary Atherosclerotic Plaque Detection for Risk Stratification of Patients With Stable Chest Pain: A Secondary Analysis of the PROMISE Randomized Clinical Trial. JAMA Cardiol. 2018, 3, 144–152. [Google Scholar] [CrossRef]
- Kolossváry, M.; Park, J.; Bang, J.-I.; Zhang, J.; Lee, J.M.; Paeng, J.C.; Merkely, B.; Narula, J.; Kubo, T.; Akasaka, T.; et al. Identification of Invasive and Radionuclide Imaging Markers of Coronary Plaque Vulnerability Using Radiomic Analysis of Coronary Computed Tomography Angiography. Eur. Heart J. Cardiovasc. Imaging 2019, 20, 1250–1258. [Google Scholar] [CrossRef]
- Han, D.; Kolli, K.K.; Al’Aref, S.J.; Baskaran, L.; van Rosendael, A.R.; Gransar, H.; Andreini, D.; Budoff, M.J.; Cademartiri, F.; Chinnaiyan, K.; et al. Machine Learning Framework to Identify Individuals at Risk of Rapid Progression of Coronary Atherosclerosis: From the PARADIGM Registry. J. Am. Heart Assoc. 2020, 9, e013958. [Google Scholar] [CrossRef] [PubMed]
- Kolossváry, M.; Gerstenblith, G.; Bluemke, D.A.; Fishman, E.K.; Mandler, R.N.; Kickler, T.S.; Chen, S.; Bhatia, S.; Lai, S.; Lai, H. Contribution of Risk Factors to the Development of Coronary Atherosclerosis as Confirmed via Coronary CT Angiography: A Longitudinal Radiomics-Based Study. Radiology 2021, 299, 97–106. [Google Scholar] [CrossRef]
- Lin, A.; Kolossváry, M.; Yuvaraj, J.; Cadet, S.; McElhinney, P.A.; Jiang, C.; Nerlekar, N.; Nicholls, S.J.; Slomka, P.J.; Maurovich-Horvat, P.; et al. Myocardial Infarction Associates With a Distinct Pericoronary Adipose Tissue Radiomic Phenotype. JACC Cardiovasc. Imaging 2020, 13, 2371–2383. [Google Scholar] [CrossRef]
- Oikonomou, E.K.; Williams, M.C.; Kotanidis, C.P.; Desai, M.Y.; Marwan, M.; Antonopoulos, A.S.; Thomas, K.E.; Thomas, S.; Akoumianakis, I.; Fan, L.M.; et al. A Novel Machine Learning-Derived Radiotranscriptomic Signature of Perivascular Fat Improves Cardiac Risk Prediction Using Coronary CT Angiography. Eur. Heart J. 2019, 40, 3529–3543. [Google Scholar] [CrossRef] [PubMed]
- Shang, J.; Ma, S.; Guo, Y.; Yang, L.; Zhang, Q.; Xie, F.; Ma, Y.; Ma, Q.; Dang, Y.; Zhou, K.; et al. Prediction of Acute Coronary Syndrome within 3 Years Using Radiomics Signature of Pericoronary Adipose Tissue Based on Coronary Computed Tomography Angiography. Eur. Radiol. 2022, 32, 1256–1266. [Google Scholar] [CrossRef] [PubMed]
- Kolossváry, M.; Karády, J.; Szilveszter, B.; Kitslaar, P.; Hoffmann, U.; Merkely, B.; Maurovich-Horvat, P. Radiomic Features Are Superior to Conventional Quantitative Computed Tomographic Metrics to Identify Coronary Plaques With Napkin-Ring Sign. Circ. Cardiovasc. Imaging 2017, 10, e006843. [Google Scholar] [CrossRef] [PubMed]
- Li, L.; Hu, X.; Tao, X.; Shi, X.; Zhou, W.; Hu, H.; Hu, X. Radiomic Features of Plaques Derived from Coronary CT Angiography to Identify Hemodynamically Significant Coronary Stenosis, Using Invasive FFR as the Reference Standard. Eur. J. Radiol. 2021, 140, 109769. [Google Scholar] [CrossRef]
- Hou, Z.; Lu, B.; Gao, Y.; Jiang, S.; Wang, Y.; Li, W.; Budoff, M.J. Prognostic Value of Coronary CT Angiography and Calcium Score for Major Adverse Cardiac Events in Outpatients. JACC Cardiovasc. Imaging 2012, 5, 990–999. [Google Scholar] [CrossRef]
- Lo-Kioeng-Shioe, M.S.; Vavere, A.L.; Arbab-Zadeh, A.; Schuijf, J.D.; Rochitte, C.E.; Chen, M.Y.; Rief, M.; Kofoed, K.F.; Clouse, M.E.; Scholte, A.J.; et al. Coronary Calcium Characteristics as Predictors of Major Adverse Cardiac Events in Symptomatic Patients: Insights From the CORE320 Multinational Study. J. Am. Heart Assoc. 2019, 8, e007201. [Google Scholar] [CrossRef] [PubMed]
- Kim, S.Y.; Suh, Y.J.; Lee, H.-J.; Kim, Y.J. Prognostic Value of Coronary Artery Calcium Scores from 1.5 Mm Slice Reconstructions of Electrocardiogram-Gated Computed Tomography Scans in Asymptomatic Individuals. Sci. Rep. 2022, 12, 7198. [Google Scholar] [CrossRef]
- Bezerra, H.G.; Costa, M.A.; Guagliumi, G.; Rollins, A.M.; Simon, D.I. Intracoronary Optical Coherence Tomography: A Comprehensive Review Clinical and Research Applications. JACC Cardiovasc. Interv. 2009, 2, 1035–1046. [Google Scholar] [CrossRef]
- Prati, F.; Guagliumi, G.; Mintz, G.S.; Costa, M.; Regar, E.; Akasaka, T.; Barlis, P.; Tearney, G.J.; Jang, I.-K.; Arbustini, E.; et al. Expert Review Document Part 2: Methodology, Terminology and Clinical Applications of Optical Coherence Tomography for the Assessment of Interventional Procedures. Eur. Heart J. 2012, 33, 2513–2520. [Google Scholar] [CrossRef] [PubMed]
- Yabushita, H.; Bouma, B.E.; Houser, S.L.; Aretz, H.T.; Jang, I.-K.; Schlendorf, K.H.; Kauffman, C.R.; Shishkov, M.; Kang, D.H.; Halpern, E.F.; et al. Characterization of Human Atherosclerosis by Optical Coherence Tomography. Circulation 2002, 106, 1640–1645. [Google Scholar] [CrossRef] [PubMed]
- Kume, T.; Akasaka, T.; Kawamoto, T.; Watanabe, N.; Toyota, E.; Neishi, Y.; Sukmawan, R.; Sadahira, Y.; Yoshida, K. Assessment of Coronary Arterial Plaque by Optical Coherence Tomography. Am. J. Cardiol. 2006, 97, 1172–1175. [Google Scholar] [CrossRef]
- Mehanna, E.; Bezerra, H.G.; Prabhu, D.; Brandt, E.; Chamié, D.; Yamamoto, H.; Attizzani, G.F.; Tahara, S.; Van Ditzhuijzen, N.; Fujino, Y.; et al. Volumetric Characterization of Human Coronary Calcification by Frequency-Domain Optical Coherence Tomography. Circ. J. 2013, 77, 2334–2340. [Google Scholar] [CrossRef]
- Kolodgie, F.D.; Virmani, R.; Burke, A.P.; Farb, A.; Weber, D.K.; Kutys, R.; Finn, A.V.; Gold, H.K. Pathologic Assessment of the Vulnerable Human Coronary Plaque. Heart 2004, 90, 1385–1391. [Google Scholar] [CrossRef]
- Narula, J.; Garg, P.; Achenbach, S.; Motoyama, S.; Virmani, R.; Strauss, H.W. Arithmetic of Vulnerable Plaques for Noninvasive Imaging. Nat. Rev. Cardiol. 2008, 5, S2–S10. [Google Scholar] [CrossRef] [PubMed]
- Kato, K.; Yonetsu, T.; Kim, S.-J.; Xing, L.; Lee, H.; McNulty, I.; Yeh, R.W.; Sakhuja, R.; Zhang, S.; Uemura, S.; et al. Nonculprit Plaques in Patients with Acute Coronary Syndromes Have More Vulnerable Features Compared with Those with Non-Acute Coronary Syndromes a 3-Vessel Optical Coherence Tomography Study. Circ. Cardiovasc. Imaging 2012, 5, 433–440. [Google Scholar] [CrossRef]
- Cheruvu, P.K.; Finn, A.V.; Gardner, C.; Caplan, J.; Goldstein, J.; Stone, G.W.; Virmani, R.; Muller, J.E. Frequency and Distribution of Thin-Cap Fibroatheroma and Ruptured Plaques in Human Coronary Arteries: A Pathologic Study. J. Am. Coll. Cardiol. 2007, 50, 940–949. [Google Scholar] [CrossRef] [PubMed]
- Fujii, K.; Hao, H.; Shibuya, M.; Imanaka, T.; Fukunaga, M.; Miki, K.; Tamaru, H.; Sawada, H.; Naito, Y.; Ohyanagi, M.; et al. Accuracy of OCT, Grayscale IVUS, and Their Combination for the Diagnosis of Coronary TCFA: An Ex Vivo Validation Study. JACC Cardiovasc. Imaging 2015, 8, 451–460. [Google Scholar] [CrossRef] [PubMed]
- Nakano, M.; Vorpahl, M.; Otsuka, F.; Taniwaki, M.; Yazdani, S.K.; Finn, A.V.; Ladich, E.R.; Kolodgie, F.D.; Virmani, R. Ex Vivo Assessment of Vascular Response to Coronary Stents by Optical Frequency Domain Imaging. JACC Cardiovasc. Imaging 2012, 5, 71–82. [Google Scholar] [CrossRef]
- Katayama, Y.; Tanaka, A.; Taruya, A.; Kashiwagi, M.; Nishiguchi, T.; Ozaki, Y.; Matsuo, Y.; Kitabata, H.; Kubo, T.; Shimada, E.; et al. Feasibility and Clinical Significance of In Vivo Cholesterol Crystal Detection Using Optical Coherence Tomography. Arterioscler. Thromb. Vasc. Biol. 2020, 40, 220–229. [Google Scholar] [CrossRef] [PubMed]
- Jinnouchi, H.; Sato, Y.; Torii, S.; Sakamoto, A.; Cornelissen, A.; Bhoite, R.R.; Kuntz, S.; Guo, L.; Paek, K.H.; Fernandez, R.; et al. Detection of Cholesterol Crystals by Optical Coherence Tomography. EuroIntervention 2020, 16, 395–403. [Google Scholar] [CrossRef] [PubMed]
- Kitabata, H.; Tanaka, A.; Kubo, T.; Takarada, S.; Kashiwagi, M.; Tsujioka, H.; Ikejima, H.; Kuroi, A.; Kataiwa, H.; Ishibashi, K.; et al. Relation of Microchannel Structure Identified by Optical Coherence Tomography to Plaque Vulnerability in Patients With Coronary Artery Disease. Am. J. Cardiol. 2010, 105, 1673–1678. [Google Scholar] [CrossRef]
- Dong, L.; Maehara, A.; Nazif, T.M.; Pollack, A.T.; Saito, S.; Rabbani, L.E.; Apfelbaum, M.A.; Dalton, K.; Moses, J.W.; Jorde, U.P.; et al. Optical Coherence Tomographic Evaluation of Transplant Coronary Artery Vasculopathy With Correlation to Cellular Rejection. Circ. Cardiovasc. Interv. 2014, 7, 199–206. [Google Scholar] [CrossRef]
- Kume, T.; Akasaka, T.; Kawamoto, T.; Ogasawara, Y.; Watanabe, N.; Toyota, E.; Neishi, Y.; Sukmawan, R.; Sadahira, Y.; Yoshida, K. Assessment of Coronary Arterial Thrombus by Optical Coherence Tomography. Am. J. Cardiol. 2006, 97, 1713–1717. [Google Scholar] [CrossRef]
- Kang, S.-J.; Nakano, M.; Virmani, R.; Song, H.-G.; Ahn, J.-M.; Kim, W.-J.; Lee, J.-Y.; Park, D.-W.; Lee, S.-W.; Kim, Y.-H.; et al. OCT Findings in Patients With Recanalization of Organized Thrombi in Coronary Arteries. JACC Cardiovasc. Imaging 2012, 5, 725–732. [Google Scholar] [CrossRef]
- Souteyrand, G.; Valladier, M.; Amabile, N.; Derimay, F.; Harbaoui, B.; Leddet, P.; Barnay, P.; Malcles, G.; Mulliez, A.; Berry, C.; et al. Diagnosis and Management of Spontaneously Recanalized Coronary Thrombus Guided by Optical Coherence Tomography—Lessons From the French “Lotus Root” Registry. Circ. J. 2018, 82, 783–790. [Google Scholar] [CrossRef]
- Antuña, P.; Cuesta, J.; Bastante, T.; Montes, A.; Rivero, F.; Alfonso, F. Diagnosis of Intraplaque Hemorrhage by High-Definition Intravascular Ultrasound and Optical Coherence Tomography. JACC Cardiovasc. Interv. 2020, 13, 1960–1962. [Google Scholar] [CrossRef] [PubMed]
- Hoshino, M.; Yonetsu, T.; Yuki, Y.; Inoue, K.; Kanaji, Y.; Usui, E.; Lee, T.; Kakuta, T. Optical Coherence Tomographic Features of Unstable Coronary Lesions Corresponding to Histopathological Intraplaque Hemorrhage Evaluated by Directional Coronary Atherectomy Specimens. JACC Cardiovasc. Interv. 2018, 11, 1414–1415. [Google Scholar] [CrossRef] [PubMed]
- Alfonso, F.; Paulo, M.; Gonzalo, N.; Dutary, J.; Jimenez-Quevedo, P.; Lennie, V.; Escaned, J.; Bañuelos, C.; Hernandez, R.; Macaya, C. Diagnosis of Spontaneous Coronary Artery Dissection by Optical Coherence Tomography. J. Am. Coll. Cardiol. 2012, 59, 1073–1079. [Google Scholar] [CrossRef] [PubMed]
- Virmani, R.; Kolodgie, F.D.; Burke, A.P.; Farb, A.; Schwartz, S.M. Lessons from Sudden Coronary Death: A Comprehensive Morphological Classification Scheme for Atherosclerotic Lesions. Arter. Thromb. Vasc. Biol. 2000, 20, 1262–1275. [Google Scholar] [CrossRef] [PubMed]
- Virmani, R.; Burke, A.P.; Kolodgie, F.D.; Farb, A. Vulnerable Plaque: The Pathology of Unstable Coronary Lesions. J. Interv. Cardiol. 2002, 15, 439–446. [Google Scholar] [CrossRef] [PubMed]
- Stone, G.W.; Maehara, A.; Lansky, A.J.; de Bruyne, B.; Cristea, E.; Mintz, G.S.; Mehran, R.; McPherson, J.; Farhat, N.; Marso, S.P.; et al. A Prospective Natural-History Study of Coronary Atherosclerosis. N. Engl. J. Med. 2011, 364, 226–235. [Google Scholar] [CrossRef]
- Libby, P.; Ridker, P.M.; Maseri, A. Inflammation and Atherosclerosis. Circulation 2002, 105, 1135–1143. [Google Scholar] [CrossRef]
- Burke, A.P.; Farb, A.; Malcom, G.T.; Liang, Y.-H.; Smialek, J.; Virmani, R. Coronary Risk Factors and Plaque Morphology in Men with Coronary Disease Who Died Suddenly. N. Engl. J. Med. 1997, 336, 1276–1282. [Google Scholar] [CrossRef]
- Libby, P.; Geng, Y.J.; Aikawa, M.; Schoenbeck, U.; Mach, F.; Clinton, S.K.; Sukhova, G.K.; Lee, R.T. Macrophages and Atherosclerotic Plaque Stability. Curr. Opin. Lipidol. 1996, 7, 330–335. [Google Scholar] [CrossRef] [PubMed]
- Narula, J.; Finn, A.V.; Demaria, A.N. Picking Plaques That Pop. J. Am. Coll. Cardiol. 2005, 45, 1970–1973. [Google Scholar] [CrossRef] [PubMed]
- Xing, L.; Higuma, T.; Wang, Z.; Aguirre, A.D.; Mizuno, K.; Takano, M.; Dauerman, H.L.; Park, S.-J.; Jang, Y.; Kim, C.-J.; et al. Clinical Significance of Lipid-Rich Plaque Detected by Optical Coherence Tomography: A 4-Year Follow-Up Study. J. Am. Coll. Cardiol. 2017, 69, 2502–2513. [Google Scholar] [CrossRef]
- Prati, F.; Romagnoli, E.; Gatto, L.; La Manna, A.; Burzotta, F.; Ozaki, Y.; Marco, V.; Boi, A.; Fineschi, M.; Fabbiocchi, F.; et al. Relationship between Coronary Plaque Morphology of the Left Anterior Descending Artery and 12 Months Clinical Outcome: The CLIMA Study. Eur. Heart J. 2020, 41, 383–391. [Google Scholar] [CrossRef] [PubMed]
- Montone, R.A.; Vetrugno, V.; Camilli, M.; Russo, M.; Fracassi, F.; Khan, S.Q.; Doshi, S.N.; Townend, J.N.; Ludman, P.F.; Trani, C.; et al. Macrophage Infiltrates in Coronary Plaque Erosion and Cardiovascular Outcome in Patients with Acute Coronary Syndrome. Atherosclerosis 2020, 311, 158–166. [Google Scholar] [CrossRef]
- Zhao, X.; Wang, Y.; Chen, R.; Li, J.; Zhou, J.; Liu, C.; Zhou, P.; Sheng, Z.; Chen, Y.; Song, L.; et al. Prognostic Value of Characteristics of Plaque Combined with Residual Syntax Score among Patients with STEMI Undergoing Primary PCI: An Intravascular Optical Coherence Tomography Study. Thromb. J. 2021, 19, 85. [Google Scholar] [CrossRef]
- Kim, B.G.; Kachel, M.; Kim, J.-S.; Guagliumi, G.; Kim, C.; Kim, I.-S.; Lee, Y.-J.; Lee, O.-H.; Byun, Y.S.; Kim, B.O.; et al. Clinical Implications of Poststent Optical Coherence Tomographic Findings: Severe Malapposition and Cardiac Events. JACC: Cardiovasc. Imaging 2022, 15, 126–137. [Google Scholar] [CrossRef]
- Kim, J.N.; Gomez-Perez, L.; Zimin, V.N.; Makhlouf, M.H.E.; Al-Kindi, S.; Wilson, D.L.; Lee, J. Pericoronary Adipose Tissue Radiomics from Coronary Computed Tomography Angiography Identifies Vulnerable Plaques. Bioengineering 2023, 10, 360. [Google Scholar] [CrossRef]
- Lee, J.; Kim, J.N.; Gharaibeh, Y.; Zimin, V.N.; Dallan, L.A.P.; Pereira, G.T.R.; Vergara-Martel, A.; Kolluru, C.; Hoori, A.; Bezerra, H.G.; et al. OCTOPUS—Optical Coherence Tomography Plaque and Stent Analysis Software. Heliyon 2023, 9, e13396. [Google Scholar] [CrossRef]
- Gharaibeh, Y.; Lee, J.; Zimin, V.N.; Kolluru, C.; Dallan, L.A.P.; Pereira, G.T.R.; Vergara-Martel, A.; Kim, J.N.; Hoori, A.; Dong, P.; et al. Prediction of Stent Under-Expansion in Calcified Coronary Arteries Using Machine Learning on Intravascular Optical Coherence Tomography Images. Sci. Rep. 2023, 13, 18110. [Google Scholar] [CrossRef]
- Chen, L.-C.; Zhu, Y.; Papandreou, G.; Schroff, F.; Adam, H. Encoder-Decoder with Atrous Separable Convolution for Semantic Image Segmentation. In Computer Vision—ECCV 2018, Proceedings of the 15th European Conference, Munich, Germany, 8–14 September 2018; Ferrari, V., Hebert, M., Sminchisescu, C., Weiss, Y., Eds.; Springer International Publishing: Cham, Switerzland, 2018; pp. 833–851. [Google Scholar]
- Wang, Z.; Chamie, D.; Bezerra, H.G.; Yamamoto, H.; Kanovsky, J.; Wilson, D.L.; Costa, M.A.; Rollins, A.M. Volumetric Quantification of Fibrous Caps Using Intravascular Optical Coherence Tomography. Biomed. Opt. Express 2012, 3, 1413–1426. [Google Scholar] [CrossRef]
- Tearney, G.J.; Regar, E.; Akasaka, T.; Adriaenssens, T.; Barlis, P.; Bezerra, H.G.; Bouma, B.; Bruining, N.; Cho, J.; Chowdhary, S.; et al. Consensus Standards for Acquisition, Measurement, and Reporting of Intravascular Optical Coherence Tomography Studies: A Report From the International Working Group for Intravascular Optical Coherence Tomography Standardization and Validation. J. Am. Coll. Cardiol. 2012, 59, 1058–1072. [Google Scholar] [CrossRef]
- Gharaibeh, Y.; Prabhu, D.S.; Kolluru, C.; Lee, J.; Zimin, V.; Bezerra, H.G.; Wilson, D.L. Coronary Calcification Segmentation in Intravascular OCT Images Using Deep Learning: Application to Calcification Scoring. J. Med. Imaging 2019, 6, 045002. [Google Scholar] [CrossRef] [PubMed]
- Lee, J.; Prabhu, D.; Kolluru, C.; Gharaibeh, Y.; Zimin, V.N.; Bezerra, H.G.; Wilson, D.L.; Wilson, D.L. Automated Plaque Characterization Using Deep Learning on Coronary Intravascular Optical Coherence Tomographic Images. Biomed. Opt. Express 2019, 10, 6497–6515. [Google Scholar] [CrossRef] [PubMed]
- Lee, J.; Gharaibeh, Y.; Kolluru, C.; Zimin, V.N.; Dallan, L.A.P.; Kim, J.N.; Bezerra, H.G.; Wilson, D.L. Segmentation of Coronary Calcified Plaque in Intravascular OCT Images Using a Two-Step Deep Learning Approach. IEEE Access 2020, 8, 225581–225593. [Google Scholar] [CrossRef]
- Lee, J.; Pereira, G.T.R.; Gharaibeh, Y.; Kolluru, C.; Zimin, V.N.; Dallan, L.A.P.; Kim, J.N.; Hoori, A.; Al-Kindi, S.G.; Guagliumi, G.; et al. Automated Analysis of Fibrous Cap in Intravascular Optical Coherence Tomography Images of Coronary Arteries. Sci. Rep. 2022, 12, 21454. [Google Scholar] [CrossRef] [PubMed]
- Lee, J.; Kim, J.N.; Gomez-Perez, L.; Gharaibeh, Y.; Motairek, I.; Pereira, G.T.R.; Zimin, V.N.; Dallan, L.A.P.; Hoori, A.; Al-Kindi, S.; et al. Automated Segmentation of Microvessels in Intravascular OCT Images Using Deep Learning. Bioengineering 2022, 9, 648. [Google Scholar] [CrossRef]
- Schaar, J. Terminology for High-Risk and Vulnerable Coronary Artery Plaques. Eur. Heart J. 2004, 25, 1077–1082. [Google Scholar] [CrossRef]
- Farb, A.; Burke, A.P.; Tang, A.L.; Liang, Y.; Mannan, P.; Smialek, J.; Virmani, R. Coronary Plaque Erosion Without Rupture Into a Lipid Core: A Frequent Cause of Coronary Thrombosis in Sudden Coronary Death. Circulation 1996, 93, 1354–1363. [Google Scholar] [CrossRef]
- van Veelen, A.; van der Sangen, N.M.R.; Delewi, R.; Beijk, M.A.M.; Henriques, J.P.S.; Claessen, B.E.P.M. Detection of Vulnerable Coronary Plaques Using Invasive and Non-Invasive Imaging Modalities. J. Clin. Med. 2022, 11, 1361. [Google Scholar] [CrossRef] [PubMed]
- Lee, J.; Pereira, G.T.R.; Motairek, I.; Kim, J.N.; Zimin, V.N.; Dallan, L.A.P.; Hoori, A.; Al-Kindi, S.; Guagliumi, G.; Wilson, D.L. Neoatherosclerosis Prediction Using Plaque Markers in Intravascular Optical Coherence Tomography Images. Front. Cardiovasc. Med. 2022, 9, 1079046. [Google Scholar] [CrossRef] [PubMed]
- Maurovich-Horvat, P.; Hoffmann, U.; Vorpahl, M.; Nakano, M.; Virmani, R.; Alkadhi, H. The Napkin-Ring Sign: CT Signature of High-Risk Coronary Plaques? JACC Cardiovasc. Imaging 2010, 3, 440–444. [Google Scholar] [CrossRef] [PubMed]
- Motoyama, S.; Kondo, T.; Sarai, M.; Sugiura, A.; Harigaya, H.; Sato, T.; Inoue, K.; Okumura, M.; Ishii, J.; Anno, H.; et al. Multislice Computed Tomographic Characteristics of Coronary Lesions in Acute Coronary Syndromes. J. Am. Coll. Cardiol. 2007, 50, 319–326. [Google Scholar] [CrossRef]
- Budoff, M.J.; Bhatt, D.L.; Kinninger, A.; Lakshmanan, S.; Muhlestein, J.B.; Le, V.T.; May, H.T.; Shaikh, K.; Shekar, C.; Roy, S.K.; et al. Effect of Icosapent Ethyl on Progression of Coronary Atherosclerosis in Patients with Elevated Triglycerides on Statin Therapy: Final Results of the EVAPORATE Trial. Eur. Heart J. 2020, 41, 3925–3932. [Google Scholar] [CrossRef]


| N | Features | |
|---|---|---|
| 1 | Lesion length (mm) | |
| 2 | Lumen | Minimum lumen area (mm2) |
| 3 | Average lumen area (mm2) | |
| 4 | Minimum lumen diameter (mm) | |
| 5 | Average lumen diameter (mm) | |
| 6 | Calcium | Maximum calcium angle (°) |
| 7 | Minimum calcium angle (°) | |
| 8 | Maximum calcium thickness (mm) | |
| 9 | Minimum calcium thickness (mm) | |
| 10 | Maximum calcium depth (mm) | |
| 11 | Minimum calcium depth (mm) | |
| 12 | FC | Maximum FC angle (°) |
| 13 | Minimum FC angle (°) | |
| 14 | Minimum FC thickness (mm) | |
| 15 | Maximum FC area-1 (mm2) | |
| 16 | Maximum FC area-2 (mm2) | |
| 17 | Maximum FC area-3 (mm2) | |
| 18 | Maximum FC area-T (mm2) | |
| 19 | FC Surface area-1 (mm2) | |
| 20 | FC Surface area-2 (mm2) | |
| 21 | FC Surface area-3 (mm2) | |
| 22 | FC Surface area-T (mm2) | |
| 23 | FC burden-1 | |
| 24 | FC burden-2 | |
| 25 | FC burden-3 | |
| 26 | FC burden-T | |
| 27 | VP | Microchannel |
| 28 | Macrophage Infiltration | |
| 29 | Cholesterol Crystal | |
| 30 | Layered Plaque | |
| 31 | Calcium Nodule | |
| Characteristics | All (n = 104) | CV Death (n = 24) | No-CV Death (n = 80) | p-Value |
|---|---|---|---|---|
| Age (years) | 67.1 ± 12.0 | 75.0 ± 8.5 | 72.0 ± 12.8 | 0.37 |
| Male | 74/104 (71.15%) | 19/24 (79.2%) | 52/80 (65.0%) | 0.19 |
| Physical Measurement | ||||
| Height (cm) | 171.8 ± 9.8 | 173.6 ± 5.6 | 172.3 ± 12.3 | 0.67 |
| Weight (kg) | 93.7 ± 25.3 | 102.1 ± 36.4 | 91.1 ± 20.0 | 0.17 |
| BMI (kg/m2) | 31.73 ± 8.1 | 33.8 ± 12.0 | 30.8 ± 5.8 | 0.23 |
| Medical History | ||||
| Hypertension | 99/104 (95.2%) | 24/24 (100.0%) | 75/80 (93.8%) | 0.21 |
| Diabetes Mellitus | 56/104 (53.8%) | 13/24 (54.2%) | 43/80 (53.8%) | 0.97 |
| Hyperlipidemia | 90/104 (86.5%) | 20/24 (83.3%) | 70/80 (87.5%) | 0.60 |
| Previous PCI | 8/104 (7.7%) | 3/24 (12.5%) | 5/80 (6.3%) | 0.31 |
| Previous Myocardial Infarction | 60/104 (57.7%) | 17/24 (70.8%) | 43/80 (53.8%) | 0.14 |
| Heart Failure, LVEF < 30% | 58/104 (55.8%) | 16/24 (66.7%) | 42/80 (52.5%) | 0.22 |
| Previous CABG | 8/104 (7.7%) | 2/24 (8.3%) | 6/80 (7.5%) | 0.89 |
| Current Smoker (≤6 Months) | 53/104 (51.0%) | 15/24 (62.5%) | 38/80 (47.5%) | 0.20 |
| Renal Dysfunction (Serum Creatinine > 2.0) | 53/104 (51.0%) | 16/24 (66.7%) | 37/80 (46.3%) | 0.08 |
| Hemodialysis or Renal Transplant | 12/104 (11.5%) | 5/24 (20.8%) | 7/80 (8.8%) | 0.10 |
| Pre-procedure Presentation | ||||
| STEMI/Cardiogenic shock | 10/104 (9.6%) | 2/24 (8.3%) | 8/80 (10.0%) | 0.81 |
| NSTEMI/Unstable Angina | 35/104 (33.7%) | 5/24 (20.8%) | 30/80 (37.5%) | 0.13 |
| Stable Angina | 57/104 (54.8%) | 13/24 (54.2%) | 44/80 (55.0%) | 0.94 |
| Aortic stenosis | 1/104 (1.0%) | 1/24 (4.2%) | 0/80 (0%) | 0.07 |
| Features | CV Death (n = 24) | No-CV Death (n = 80) | p-Value |
|---|---|---|---|
| Lesion length (mm) | 37.15 ± 14.15 | 28.56 ± 11.51 | 0.02 |
| Maximum calcium angle (°) | 245.19 ± 83.08 | 162.60 ± 71.08 | 0.0004 |
| Minimum calcium angle (°) | 20.31 ± 12.22 | 15.86 ± 5.24 | 0.06 |
| Maximum calcium thickness (mm) | 1.52 ± 0.24 | 1.24 ± 0.29 | 0.0007 |
| Minimum calcium thickness (mm) | 0.30 ± 0.10 | 0.27 ± 0.06 | 0.28 |
| Maximum calcium depth (mm) | 0.52 ± 0.18 | 0.50 ± 0.19 | 0.81 |
| Minimum calcium depth (mm) | 0.008 ± 0.010 | 0.014 ± 0.014 | 0.22 |
| Minimum lumen area (mm2) | 2.03 ± 1.04 | 2.07 ± 1.25 | 0.91 |
| Average lumen area (mm2) | 5.60 ± 2.37 | 5.87 ± 2.60 | 0.72 |
| Minimum lumen diameter (mm) | 0.96 ± 0.28 | 1.00 ± 0.37 | 0.75 |
| Average lumen diameter (mm) | 2.57 ± 0.56 | 2.62 ± 0.56 | 0.75 |
| Maximum FC angle (°) | 142.00 ± 51.21 | 61.40 ± 53.63 | 0.000003 |
| Minimum FC angle (°) | 29.81 ± 11.75 | 28.29 ± 27.06 | 0.83 |
| Minimum FC thickness (mm) | 0.0228 ± 0.0095 | 0.0409 ± 0.0567 | 0.21 |
| Maximum FC area-1 (mm2) | 0.48 ± 0.29 | 0.14 ± 0.21 | 0.000006 |
| Maximum FC area-2 (mm2) | 1.73 ± 0.75 | 0.62 ± 0.67 | 0.000001 |
| Maximum FC area-3 (mm2) | 1.38 ± 0.64 | 0.60 ± 0.65 | 0.0001 |
| Maximum FC area-T (mm2) | 3.60 ± 1.30 | 1.35 ± 1.23 | 0.00000009 |
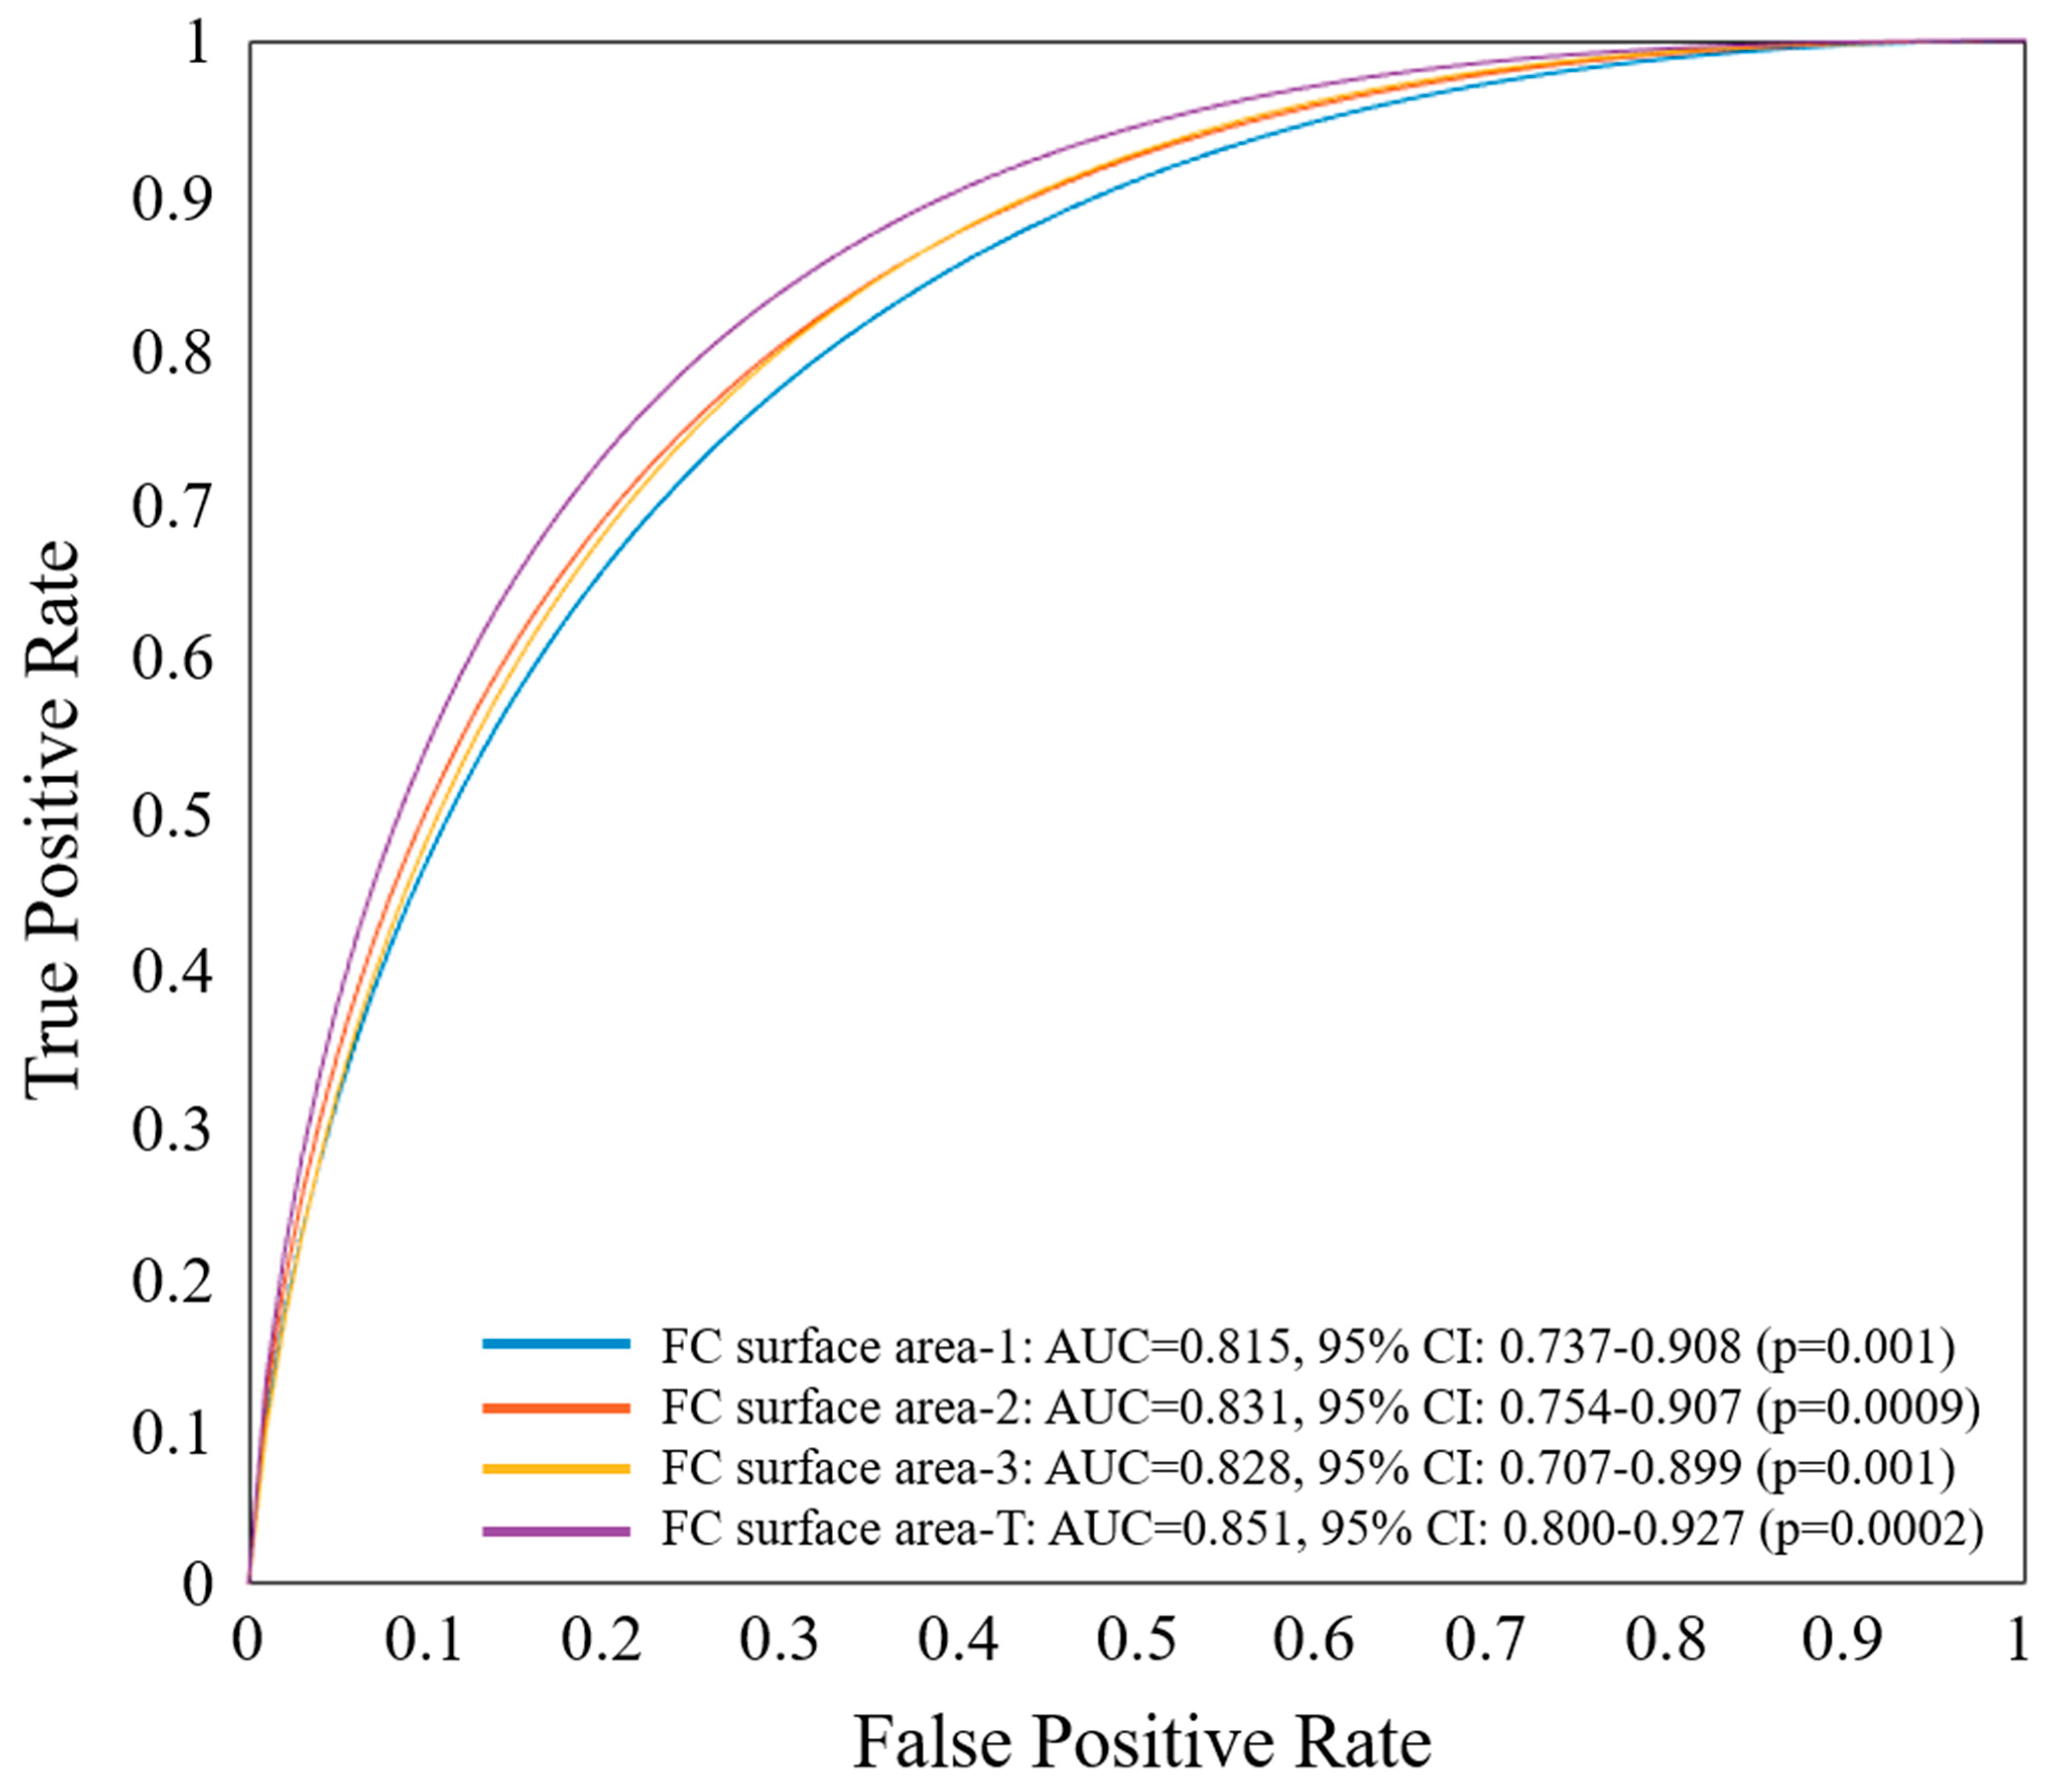
| FC Surface area-1 (mm2) | 0.51 ± 0.49 | 0.07 ± 0.13 | 0.000002 |
| FC Surface area-2 (mm2) | 5.36 ± 5.53 | 0.72 ± 1.08 | 0.000002 |
| FC Surface area-3 (mm2) | 3.77 ± 3.76 | 0.58 ± 1.09 | 0.000006 |
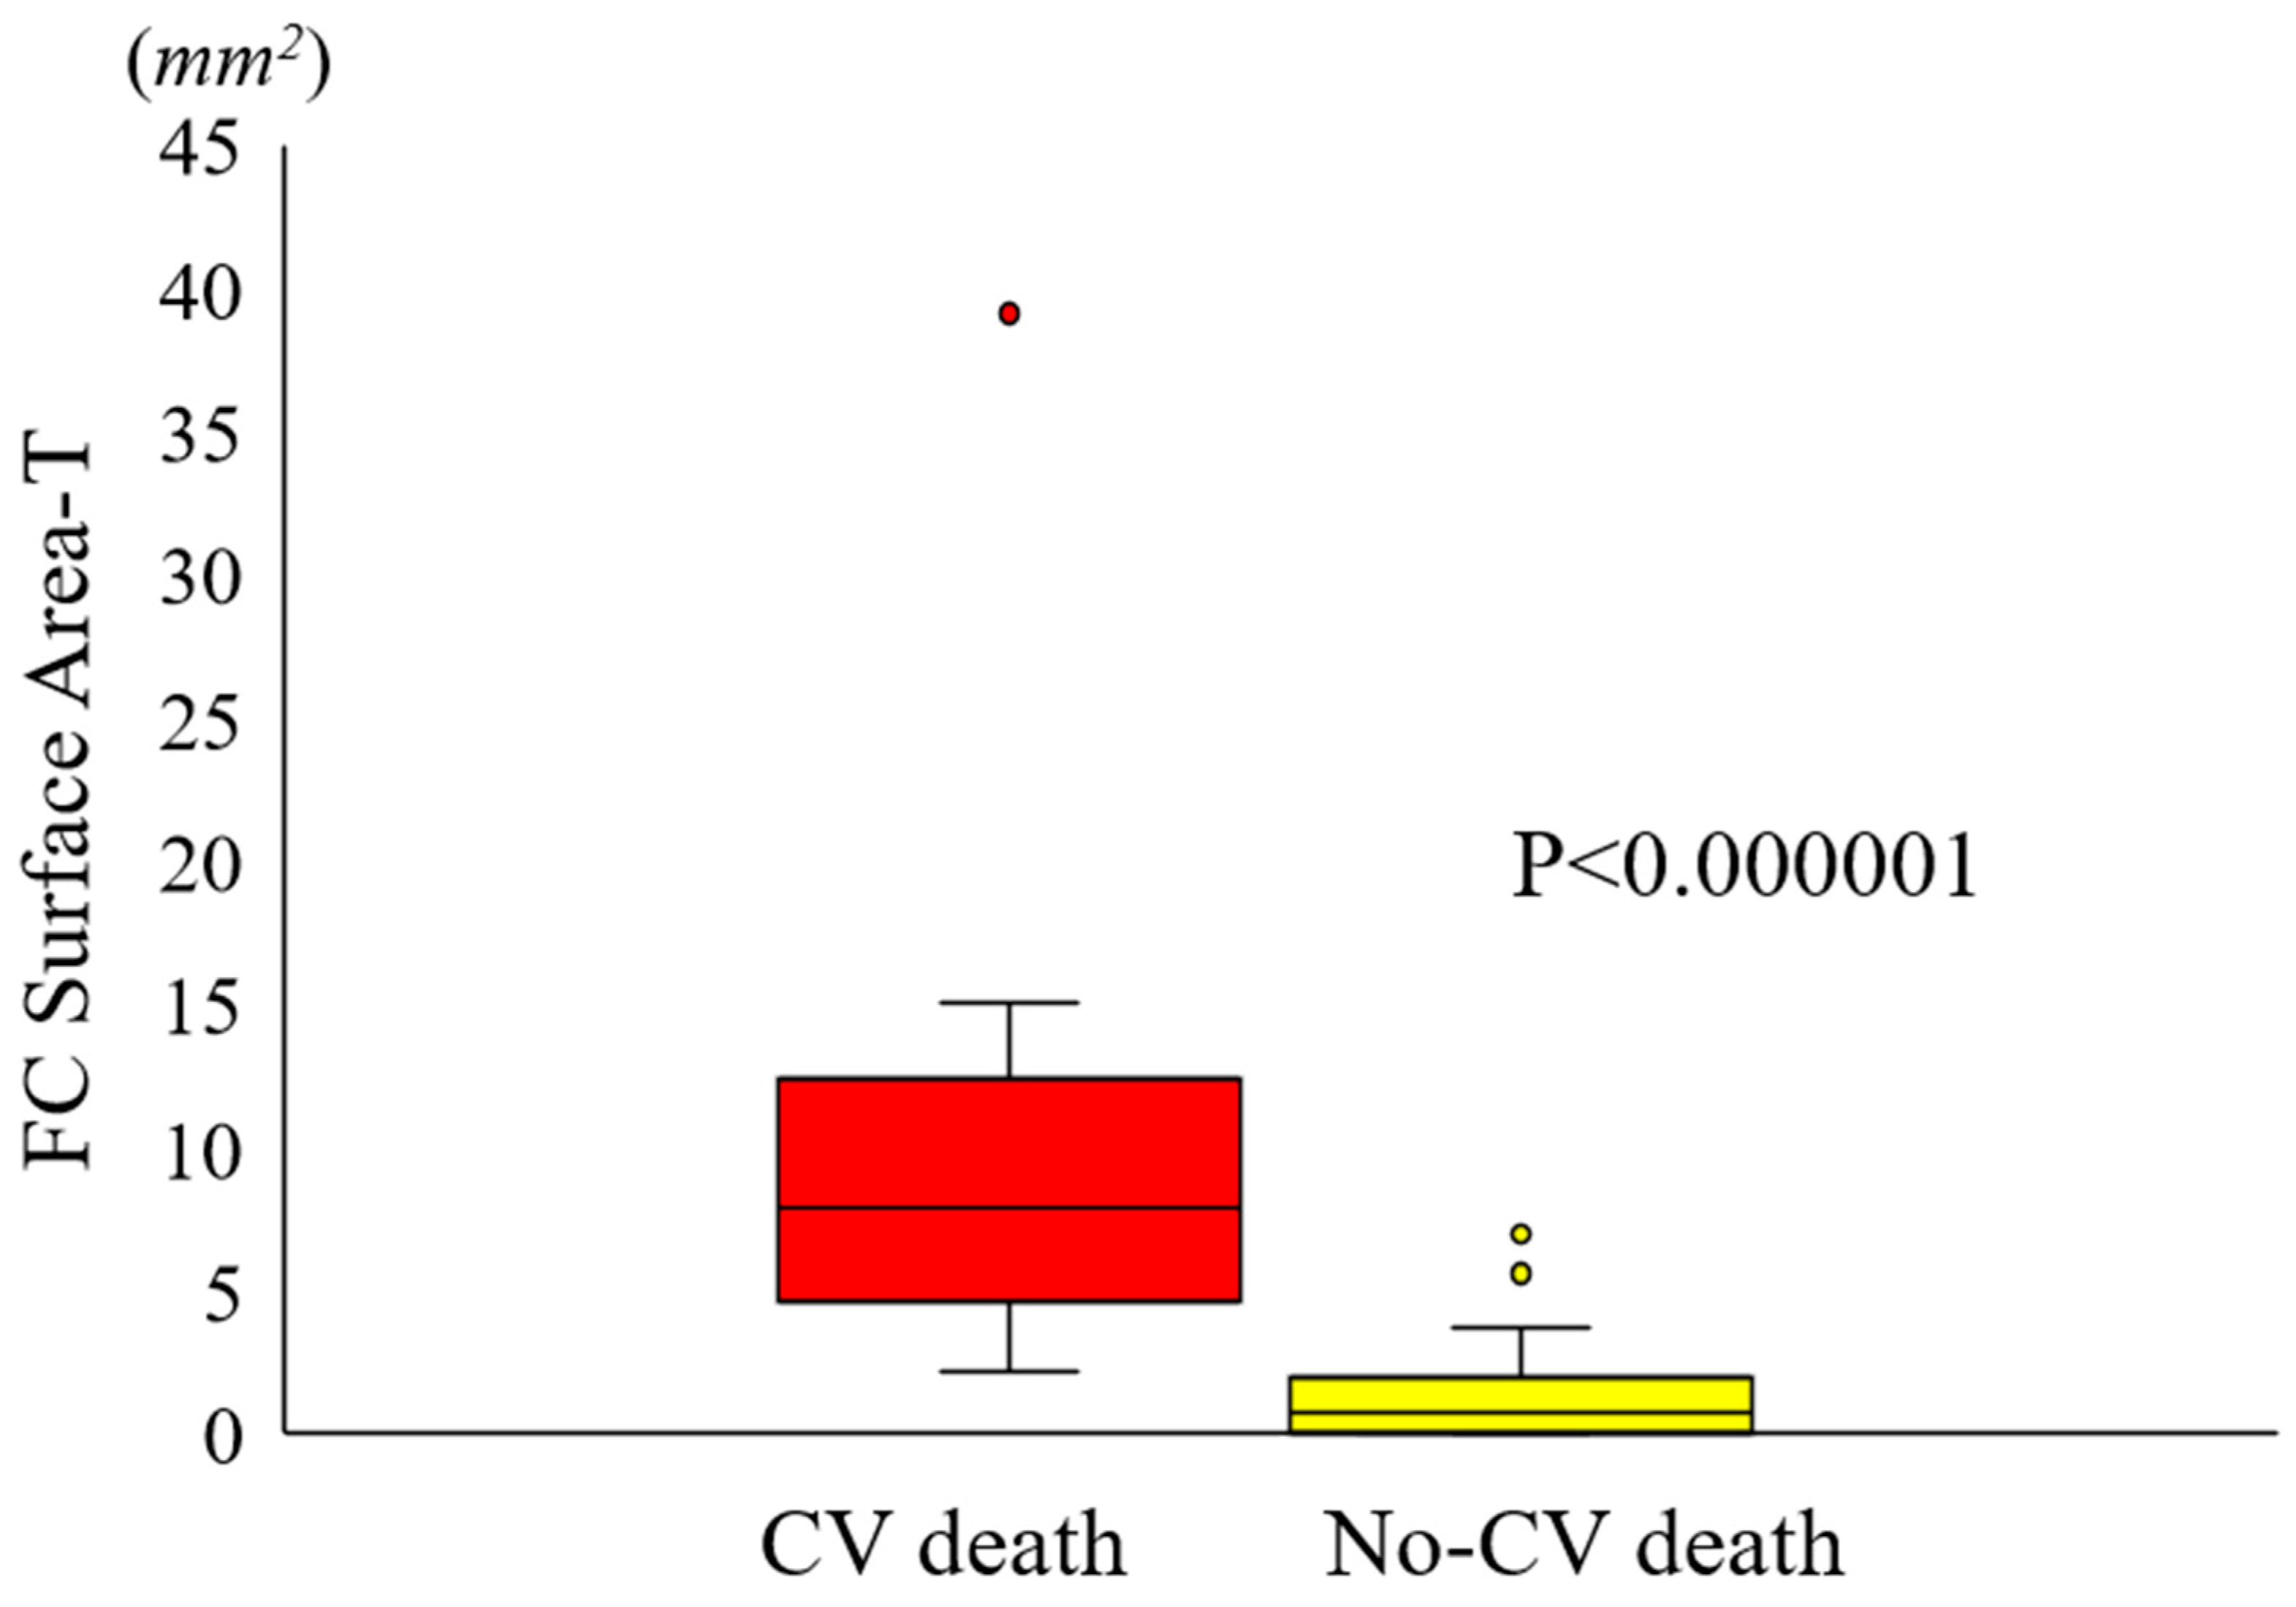
| FC Surface area-T (mm2) | 9.63 ± 8.73 | 1.37 ± 1.81 | 0.0000002 |
| FC burden-1 | 42.30 ± 42.10 | 5.56 ± 9.81 | 0.000002 |
| FC burden-2 | 496.35 ± 796.34 | 53.59 ± 78.55 | 0.0007 |
| FC burden-3 | 369.09 ± 570.24 | 40.31 ± 63.43 | 0.0004 |
| FC burden-T | 907.75 ± 1368.83 | 99.46 ± 121.49 | 0.0003 |
| Microchannel | 9 (37.5%) | 11 (13.8%) | 0.01 |
| Macrophage Infiltration | 21 (87.5%) | 50 (62.5%) | 0.02 |
| Cholesterol Crystal | 17 (70.8%) | 12 (15.0%) | 0.0000001 |
| Layered Plaque | 8 (33.3%) | 3 (3.8%) | 0.00004 |
| Calcium Nodule | 8 (33.3%) | 8 (10.0%) | 0.005 |
| Features | Univariate Logistic Regression | Multivariate Logistic Regression | ||||||
|---|---|---|---|---|---|---|---|---|
| p-Value | Odd Ratio | Lower 95% | Upper 95% | p-Value | Odd Ratio | Lower 95% | Upper 95% | |
| Lesion length (mm) | 0.03 | 1.05 | 1.01 | 1.11 | 0.90 | 0.99 | 0.89 | 1.11 |
| Maximum calcium angle (°) | 0.002 | 1.00 | 1.01 | 1.01 | 0.29 | 1.01 | 0.99 | 1.02 |
| Minimum calcium angle (°) | 0.09 | 1.07 | 0.99 | 1.16 | ||||
| Maximum calcium thickness (mm) | 0.003 | 48.48 | 3.82 | 614.87 | 0.06 | 190.55 | 0.73 | 4993.57 |
| Minimum calcium thickness (mm) | 0.29 | 62.40 | 0.03 | 1224.3 | ||||
| Maximum calcium depth (mm) | 0.81 | 1.46 | 0.07 | 31.17 | ||||
| Minimum calcium depth (mm) | 0.07 | 0.02 | 0.00 | 1.30 | ||||
| Minimum lumen area (mm2) | 0.90 | 0.97 | 0.59 | 1.59 | ||||
| Average lumen area (mm2) | 0.71 | 0.96 | 0.75 | 1.21 | ||||
| Maximum FC angle (°) | 0.002 | 1.03 | 1.01 | 1.05 | 0.10 | 1.05 | 0.99 | 1.12 |
| Minimum FC angle (°) | 0.83 | 1.00 | 0.98 | 1.03 | ||||
| Minimum FC thickness (mm) | 0.23 | 0.00 | 0.00 | 920.14 | ||||
| Maximum FC area-T (mm2) | 0.0009 | 5.65 | 2.03 | 15.69 | 0.16 | 0.14 | 0.01 | 2.13 |
| FC Surface area-T (mm2) | 0.0002 | 2.08 | 1.42 | 3.04 | 0.03 | 2.38 | 0.98 | 5.83 |
| Microchannel | 0.10 | 3.00 | 0.82 | 10.98 | ||||
| Macrophage infiltration | 0.44 | 1.91 | 0.36 | 9.99 | ||||
| Cholesterol crystal | 0.0008 | 9.35 | 2.53 | 34.58 | 0.42 | 3.22 | 0.19 | 54.85 |
| Layered plaque | 0.01 | 9.09 | 1.55 | 53.39 | 0.48 | 5.18 | 0.06 | 489.67 |
| Calcium nodule | 0.09 | 3.36 | 0.82 | 13.78 | ||||
Disclaimer/Publisher’s Note: The statements, opinions and data contained in all publications are solely those of the individual author(s) and contributor(s) and not of MDPI and/or the editor(s). MDPI and/or the editor(s) disclaim responsibility for any injury to people or property resulting from any ideas, methods, instructions or products referred to in the content. |
© 2024 by the authors. Licensee MDPI, Basel, Switzerland. This article is an open access article distributed under the terms and conditions of the Creative Commons Attribution (CC BY) license (https://creativecommons.org/licenses/by/4.0/).
Share and Cite
Lee, J.; Gharaibeh, Y.; Zimin, V.N.; Kim, J.N.; Hassani, N.S.; Dallan, L.A.P.; Pereira, G.T.R.; Makhlouf, M.H.E.; Hoori, A.; Wilson, D.L. Plaque Characteristics Derived from Intravascular Optical Coherence Tomography That Predict Cardiovascular Death. Bioengineering 2024, 11, 843. https://doi.org/10.3390/bioengineering11080843
Lee J, Gharaibeh Y, Zimin VN, Kim JN, Hassani NS, Dallan LAP, Pereira GTR, Makhlouf MHE, Hoori A, Wilson DL. Plaque Characteristics Derived from Intravascular Optical Coherence Tomography That Predict Cardiovascular Death. Bioengineering. 2024; 11(8):843. https://doi.org/10.3390/bioengineering11080843
Chicago/Turabian StyleLee, Juhwan, Yazan Gharaibeh, Vladislav N. Zimin, Justin N. Kim, Neda S. Hassani, Luis A. P. Dallan, Gabriel T. R. Pereira, Mohamed H. E. Makhlouf, Ammar Hoori, and David L. Wilson. 2024. "Plaque Characteristics Derived from Intravascular Optical Coherence Tomography That Predict Cardiovascular Death" Bioengineering 11, no. 8: 843. https://doi.org/10.3390/bioengineering11080843
APA StyleLee, J., Gharaibeh, Y., Zimin, V. N., Kim, J. N., Hassani, N. S., Dallan, L. A. P., Pereira, G. T. R., Makhlouf, M. H. E., Hoori, A., & Wilson, D. L. (2024). Plaque Characteristics Derived from Intravascular Optical Coherence Tomography That Predict Cardiovascular Death. Bioengineering, 11(8), 843. https://doi.org/10.3390/bioengineering11080843