
Experimental Study on Compatibility of Human Bronchial Epithelial Cells in Collagen–Alginate Bioink for 3D Printing

 , ,
, , 
Abstract

1. Introduction
2. Materials and Methods
2.1. Cell Culture
2.2. Preparation of Bioink
2.2.1. Preparation of Sodium Alginate Solution
2.2.2. Collagen Neutralization
2.2.3. Bioink Preparation
2.3. Preparation of Cell-Laden Hydrogel
2.4. Cell Viability Assessment
2.5. Statistical Analysis
3. Results and Discussion
4. Conclusions
Author Contributions
Funding
Institutional Review Board Statement
Informed Consent Statement
Data Availability Statement
Acknowledgments
Conflicts of Interest
References
- Ozbolat, I.T. 3D Bioprinting: Fundamentals, Principles and Applications; Academic Press: Cambridge, MA, USA, 2016. [Google Scholar] [CrossRef]
- da Rosa, N.N.; Appel, J.M.; Irioda, A.C.; Mogharbel, B.F.; de Oliveira, N.B.; Perussolo, M.C.; Stricker, P.E.F.; Rosa-Fernandes, L.; Marinho, C.R.F.; de Carvalho, K.A.T. Three-Dimensional Bioprinting of an In Vitro Lung Model. Int. J. Mol. Sci. 2023, 24, 5852. [Google Scholar] [CrossRef]
- Wang, X.; Zhang, X.; Dai, X.; Wang, X.; Li, X.; Diao, J.; Xu, T. Tumor-like lung cancer model based on 3D bioprinting. 3 Biotech 2018, 8, 501. [Google Scholar] [CrossRef] [PubMed]
- Ding, Z.; Tang, N.; Huang, J.; Cao, X.; Wu, S. Global hotspots and emerging trends in 3D bioprinting research. Front. Bioeng. Biotechnol. 2023, 11, 1169893. [Google Scholar] [CrossRef]
- Chen, X.; Anvari-Yazdi, A.F.; Duan, X.; Zimmerling, A.; Gharraei, R.; Sharma, N.; Sweilem, S.; Ning, L. Biomaterials/bioinks and extrusion bioprinting. Bioact. Mater. 2023, 28, 511–536. [Google Scholar] [CrossRef]
- Zimmerling, A.; Dahlan, N.A.; Zhou, Y.; Chen, X. Recent frontiers in biofabrication for respiratory tissue engineering. Bioprinting 2024, 40, e00342. [Google Scholar] [CrossRef]
- Riss, T.L.; Moravec, R.A.; Niles, A.L.; Duellman, S.; Benink, H.A.; Worzella, T.J.; Minor, L. Cell viability assays. In Assay Guidance Manual; Eli Lilly & Company and the National Center for Advancing Translational Sciences; National Library of Medicine: Bethesda, MD, USA, 2004. Available online: https://www.ncbi.nlm.nih.gov/books/NBK144065/ (accessed on 21 August 2024).
- Romar, G.A.; Kupper, T.S.; Divito, S.J. Research techniques made simple: Techniques to assess cell proliferation. J. Investig. Dermatol. 2016, 136, e1–e7. [Google Scholar] [CrossRef] [PubMed]
- Axpe, E.; Oyen, M.L. Applications of alginate-based bioinks in 3D bioprinting. Int. J. Mol. Sci. 2016, 17, 1976. [Google Scholar] [CrossRef]
- Khalil, S.; Sun, W. Bioprinting endothelial cells with alginate for 3D tissue constructs. J. Biomech. Eng. 2009, 131, 111002. [Google Scholar] [CrossRef]
- Amirrah, I.N.; Lokanathan, Y.; Zulkiflee, I.; Wee, M.M.R.; Motta, A.; Fauzi, M.B. A comprehensive review on collagen type I development of biomaterials for tissue engineering: From biosynthesis to bioscaffold. Biomedicines 2022, 10, 2307. [Google Scholar] [CrossRef]
- Zimmerling, A.; Zhou, Y.; Chen, X. Synthesis of Alginate/Collagen Bioink for Bioprinting Respiratory Tissue Models. J. Funct. Biomater. 2024, 15, 90. [Google Scholar] [CrossRef]
- Sorushanova, A.; Delgado, L.M.; Wu, Z.; Shologu, N.; Kshirsagar, A.; Raghunath, R.; Mullen, A.M.; Bayon, Y.; Pandit, A.; Raghunath, M. The collagen suprafamily: From biosynthesis to advanced biomaterial development. Adv. Mater. 2019, 31, 1801651. [Google Scholar] [CrossRef]
- Bhagwat, P.K.; Dandge, P.B. Isolation, characterization and valorizable applications of fish scale collagen in food and agriculture industries. Biocatal. Agric. Biotechnol. 2016, 7, 234–240. [Google Scholar] [CrossRef]
- Pati, F.; Adhikari, B.; Dhara, S. Isolation and characterization of fish scale collagen of higher thermal stability. Bioresour. Technol. 2010, 101, 3737–3742. [Google Scholar] [CrossRef]
- Stepanovska, J.; Supova, M.; Hanzalek, K.; Broz, A.; Matejka, R. Collagen Bioinks for Bioprinting: A Systematic Review of Hydrogel Properties, Bioprinting Parameters, Protocols, and Bioprinted Structure Characteristics. Biomedicines 2021, 9, 1137. [Google Scholar] [CrossRef] [PubMed]
- Ng, W.L.; Ayi, T.C.; Liu, Y.-C.; Sing, S.L.; Yeong, W.Y.; Tan, B.-H. Fabrication and characterization of 3D bioprinted triple-layered human alveolar lung models. Int. J. Bioprinting 2021, 7, 332. [Google Scholar] [CrossRef] [PubMed]
- Baruffaldi, D.; Pirri, C.F.; Frascella, F. 3D bioprinting of cell-laden carbopol bioinks. Bioprinting 2021, 22, e00135. [Google Scholar] [CrossRef]
- Berg, J.; Weber, Z.; Fechler-Bitteti, M.; Hocke, A.C.; Hippenstiel, S.; Elomaa, L.; Weinhart, M.; Kurreck, J. Bioprinted multi-cell type lung model for the study of viral inhibitors. Viruses 2021, 13, 1590. [Google Scholar] [CrossRef]
- Kang, D.; Park, J.A.; Kim, W.; Kim, S.; Lee, H.R.; Kim, W.J.; Yoo, J.Y.; Jung, S. All-inkjet-printed 3D alveolar barrier model with physiologically relevant microarchitecture. Adv. Sci. 2021, 8, 2004990. [Google Scholar] [CrossRef]
- Mondal, A.; Gebeyehu, A.; Miranda, M.; Bahadur, D.; Patel, N.; Ramakrishnan, S.; Rishi, A.K.; Singh, M. Characterization and printability of Sodium alginate-Gelatin hydrogel for bioprinting NSCLC co-culture. Sci. Rep. 2019, 9, 19914. [Google Scholar] [CrossRef]
- Berg, J.; Hiller, T.; Kissner, M.S.; Qazi, T.H.; Duda, G.N.; Hocke, A.C.; Hippenstiel, S.; Elomaa, L.; Weinhart, M.; Fahrenson, C. Optimization of cell-laden bioinks for 3D bioprinting and efficient infection with influenza A virus. Sci. Rep. 2018, 8, 13877. [Google Scholar] [CrossRef]
- Kim, J.S.; Hong, S.; Hwang, C. Bio-ink Materials for 3D Bio-printing. J. Int. Soc. Simul. Surg. 2016, 3, 49–59. [Google Scholar] [CrossRef]
- Rahman, T.T.; Wood, N.; Rahman, A.M.; Pei, Z.; Qin, H. Applying In Situ Ionic Crosslinking in Bioprinting Using Algae Cells. J. Manuf. Sci. Eng. 2024, 146, 034501. [Google Scholar] [CrossRef]
- Cambria, E.; Brunner, S.; Heusser, S.; Fisch, P.; Hitzl, W.; Ferguson, S.J.; Wuertz-Kozak, K. Cell-laden agarose-collagen composite hydrogels for mechanotransduction studies. Front. Bioeng. Biotechnol. 2020, 8, 346. [Google Scholar] [CrossRef]
- Gong, C.; Kong, Z.; Wang, X. The effect of agarose on 3D bioprinting. Polymers 2021, 13, 4028. [Google Scholar] [CrossRef]
- Ahmadi Soufivand, A.; Faber, J.; Hinrichsen, J.; Budday, S. Multilayer 3D bioprinting and complex mechanical properties of alginate-gelatin mesostructures. Sci. Rep. 2023, 13, 11253. [Google Scholar] [CrossRef]
- Ouyang, L.; Yao, R.; Zhao, Y.; Sun, W. Effect of bioink properties on printability and cell viability for 3D bioplotting of embryonic stem cells. Biofabrication 2016, 8, 035020. [Google Scholar] [CrossRef]
- Rastogi, P.; Kandasubramanian, B. Review of alginate-based hydrogel bioprinting for application in tissue engineering. Biofabrication 2019, 11, 042001. [Google Scholar] [CrossRef]
- Perez, R.A.; Kim, M.; Kim, T.H.; Kim, J.H.; Lee, J.H.; Park, J.H.; Knowles, J.C.; Kim, H.W. Utilizing core-shell fibrous collagen-alginate hydrogel cell delivery system for bone tissue engineering. Tissue Eng. Part A 2014, 20, 103–114. [Google Scholar] [CrossRef] [PubMed]
- Carlier, F.M.; de Fays, C.; Pilette, C. Epithelial barrier dysfunction in chronic respiratory diseases. Front. Physiol. 2021, 12, 691227. [Google Scholar] [CrossRef]
- Capes-Davis, A.; Freshney, R.I. Freshney’s Culture of Animal Cells: A Manual of Basic Technique and Specialized Applications; John Wiley & Sons: Hoboken, NJ, USA, 2021. [Google Scholar]
- Gopinathan, J.; Noh, I. Recent trends in bioinks for 3D printing. Biomater. Res. 2018, 22, 11. [Google Scholar] [CrossRef] [PubMed]
- Kim, J. Characterization of Biocompatibility of Functional Bioinks for 3D Bioprinting. Bioengineering 2023, 10, 457. [Google Scholar] [CrossRef]
- Galateanu, B.; Dimonie, D.; Vasile, E.; Nae, S.; Cimpean, A.; Costache, M. Layer-shaped alginate hydrogels enhance the biological performance of human adipose-derived stem cells. BMC Biotechnol. 2012, 12, 35. [Google Scholar] [CrossRef] [PubMed]
- Ouyang, L.; Armstrong, J.P.; Lin, Y.; Wojciechowski, J.P.; Lee-Reeves, C.; Hachim, D.; Zhou, K.; Burdick, J.A.; Stevens, M.M. Expanding and optimizing 3D bioprinting capabilities using complementary network bioinks. Sci. Adv. 2020, 6, eabc5529. [Google Scholar] [CrossRef] [PubMed]
- Johnson, D. How to Do Everything: Digital Camera; McGraw-Hill, Inc.: New York, NY, USA, 2008. [Google Scholar]
- Ray, S. Applied Photographic Optics; Routledge: London, UK, 2002. [Google Scholar] [CrossRef]
- Hu, T.; Lo, A.C. Collagen–alginate composite hydrogel: Application in tissue engineering and biomedical sciences. Polymers 2021, 13, 1852. [Google Scholar] [CrossRef]
- Ma, S.; Zhou, J.; Huang, T.; Zhang, Z.; Xing, Q.; Zhou, X.; Zhang, K.; Yao, M.; Cheng, T.; Wang, X. Sodium alginate/collagen/stromal cell-derived factor-1 neural scaffold loaded with BMSCs promotes neurological function recovery after traumatic brain injury. Acta Biomater. 2021, 131, 185–197. [Google Scholar] [CrossRef]
- Light, T.; Hamilton, T.; Pfeifer, S. Trends in Us Air Force Aircraft Mishap Rates (1950–2018); RAND: Santa Monica, CA, USA, 2020. [Google Scholar]
- Poisson, R.J.; Miller, M.E. Spatial disorientation mishap trends in the US Air Force 1993–2013. Aviat. Space Environ. Med. 2014, 85, 919–924. [Google Scholar] [CrossRef]
- Moura, J.A.; Meldrum, K.; Doak, S.H.; Clift, M.J. Alternative lung cell model systems for toxicology testing strategies: Current knowledge and future outlook. Semin. Cell Dev. Biol. 2023, 147, 70–82. [Google Scholar] [CrossRef] [PubMed]
- Xiao, M.-M.; Pan, C.-S.; Liu, Y.-Y.; Ma, L.-Q.; Yan, L.; Fan, J.-Y.; Wang, C.-S.; Huang, R.; Han, J.-Y. Post-treatment with Ma-Huang-Tang ameliorates cold-warm-cycles induced rat lung injury. Sci. Rep. 2017, 7, 312. [Google Scholar] [CrossRef]
- Habanjar, O.; Diab-Assaf, M.; Caldefie-Chezet, F.; Delort, L. 3D cell culture systems: Tumor application, advantages, and disadvantages. Int. J. Mol. Sci. 2021, 22, 12200. [Google Scholar] [CrossRef]
- Justice, B.A.; Badr, N.A.; Felder, R.A. 3D cell culture opens new dimensions in cell-based assays. Drug Discov. Today 2009, 14, 102–107. [Google Scholar] [CrossRef]
- Ravi, M.; Paramesh, V.; Kaviya, S.; Anuradha, E.; Solomon, F.P. 3D cell culture systems: Advantages and applications. J. Cell. Physiol. 2015, 230, 16–26. [Google Scholar] [CrossRef] [PubMed]


| Bioink | Cell Type | Reference |
|---|---|---|
| Alginate–collagen | Human pulmonary lung fibroblasts (HPFs) | [12] |
| Alginate–gelatin | Alveolar types I and II, ciliated, and secretory cells | [2] |
| Polyvinylpyrrolidone | Human lung epithelial cells(A549), endothelial cells (EA.hy926), and fibroblasts (MRC5) | [17] |
| Carbopol | Lung cancer epithelial (A549) and lung fibroblast (MRC-5) cells | [18] |
| Alginate, gelatin, and collagen | Normal human primary lung fibroblasts ((NHLFbs), human monocytic leukemia cells (THP-1), and human epithelial lung carcinoma cells (A549 cells) | [19] |
| Collagen | Type I and II alveolar cells (NCI-H1703 and NCI-H441), lung fibroblasts (MRC5), and lung microvascular endothelial cells (HULEC-5a) | [20] |
| Alginate–gelatin | Non-small cell lung cancer PDX cells and lung CAFs | [21] |
| Alginate–gelatin | Human lung cancer cells A549 and 95-D | [3] |
| Alginate, gelatin and matrigel | Human alveolar A549 cells | [22] |
| Alginate | Collagen–Alginate 1:4 | Collagen–Alginate 4:1 | ||||
|---|---|---|---|---|---|---|
| Mean | Standard Deviation | Mean | Standard Deviation | Mean | Standard Deviation | |
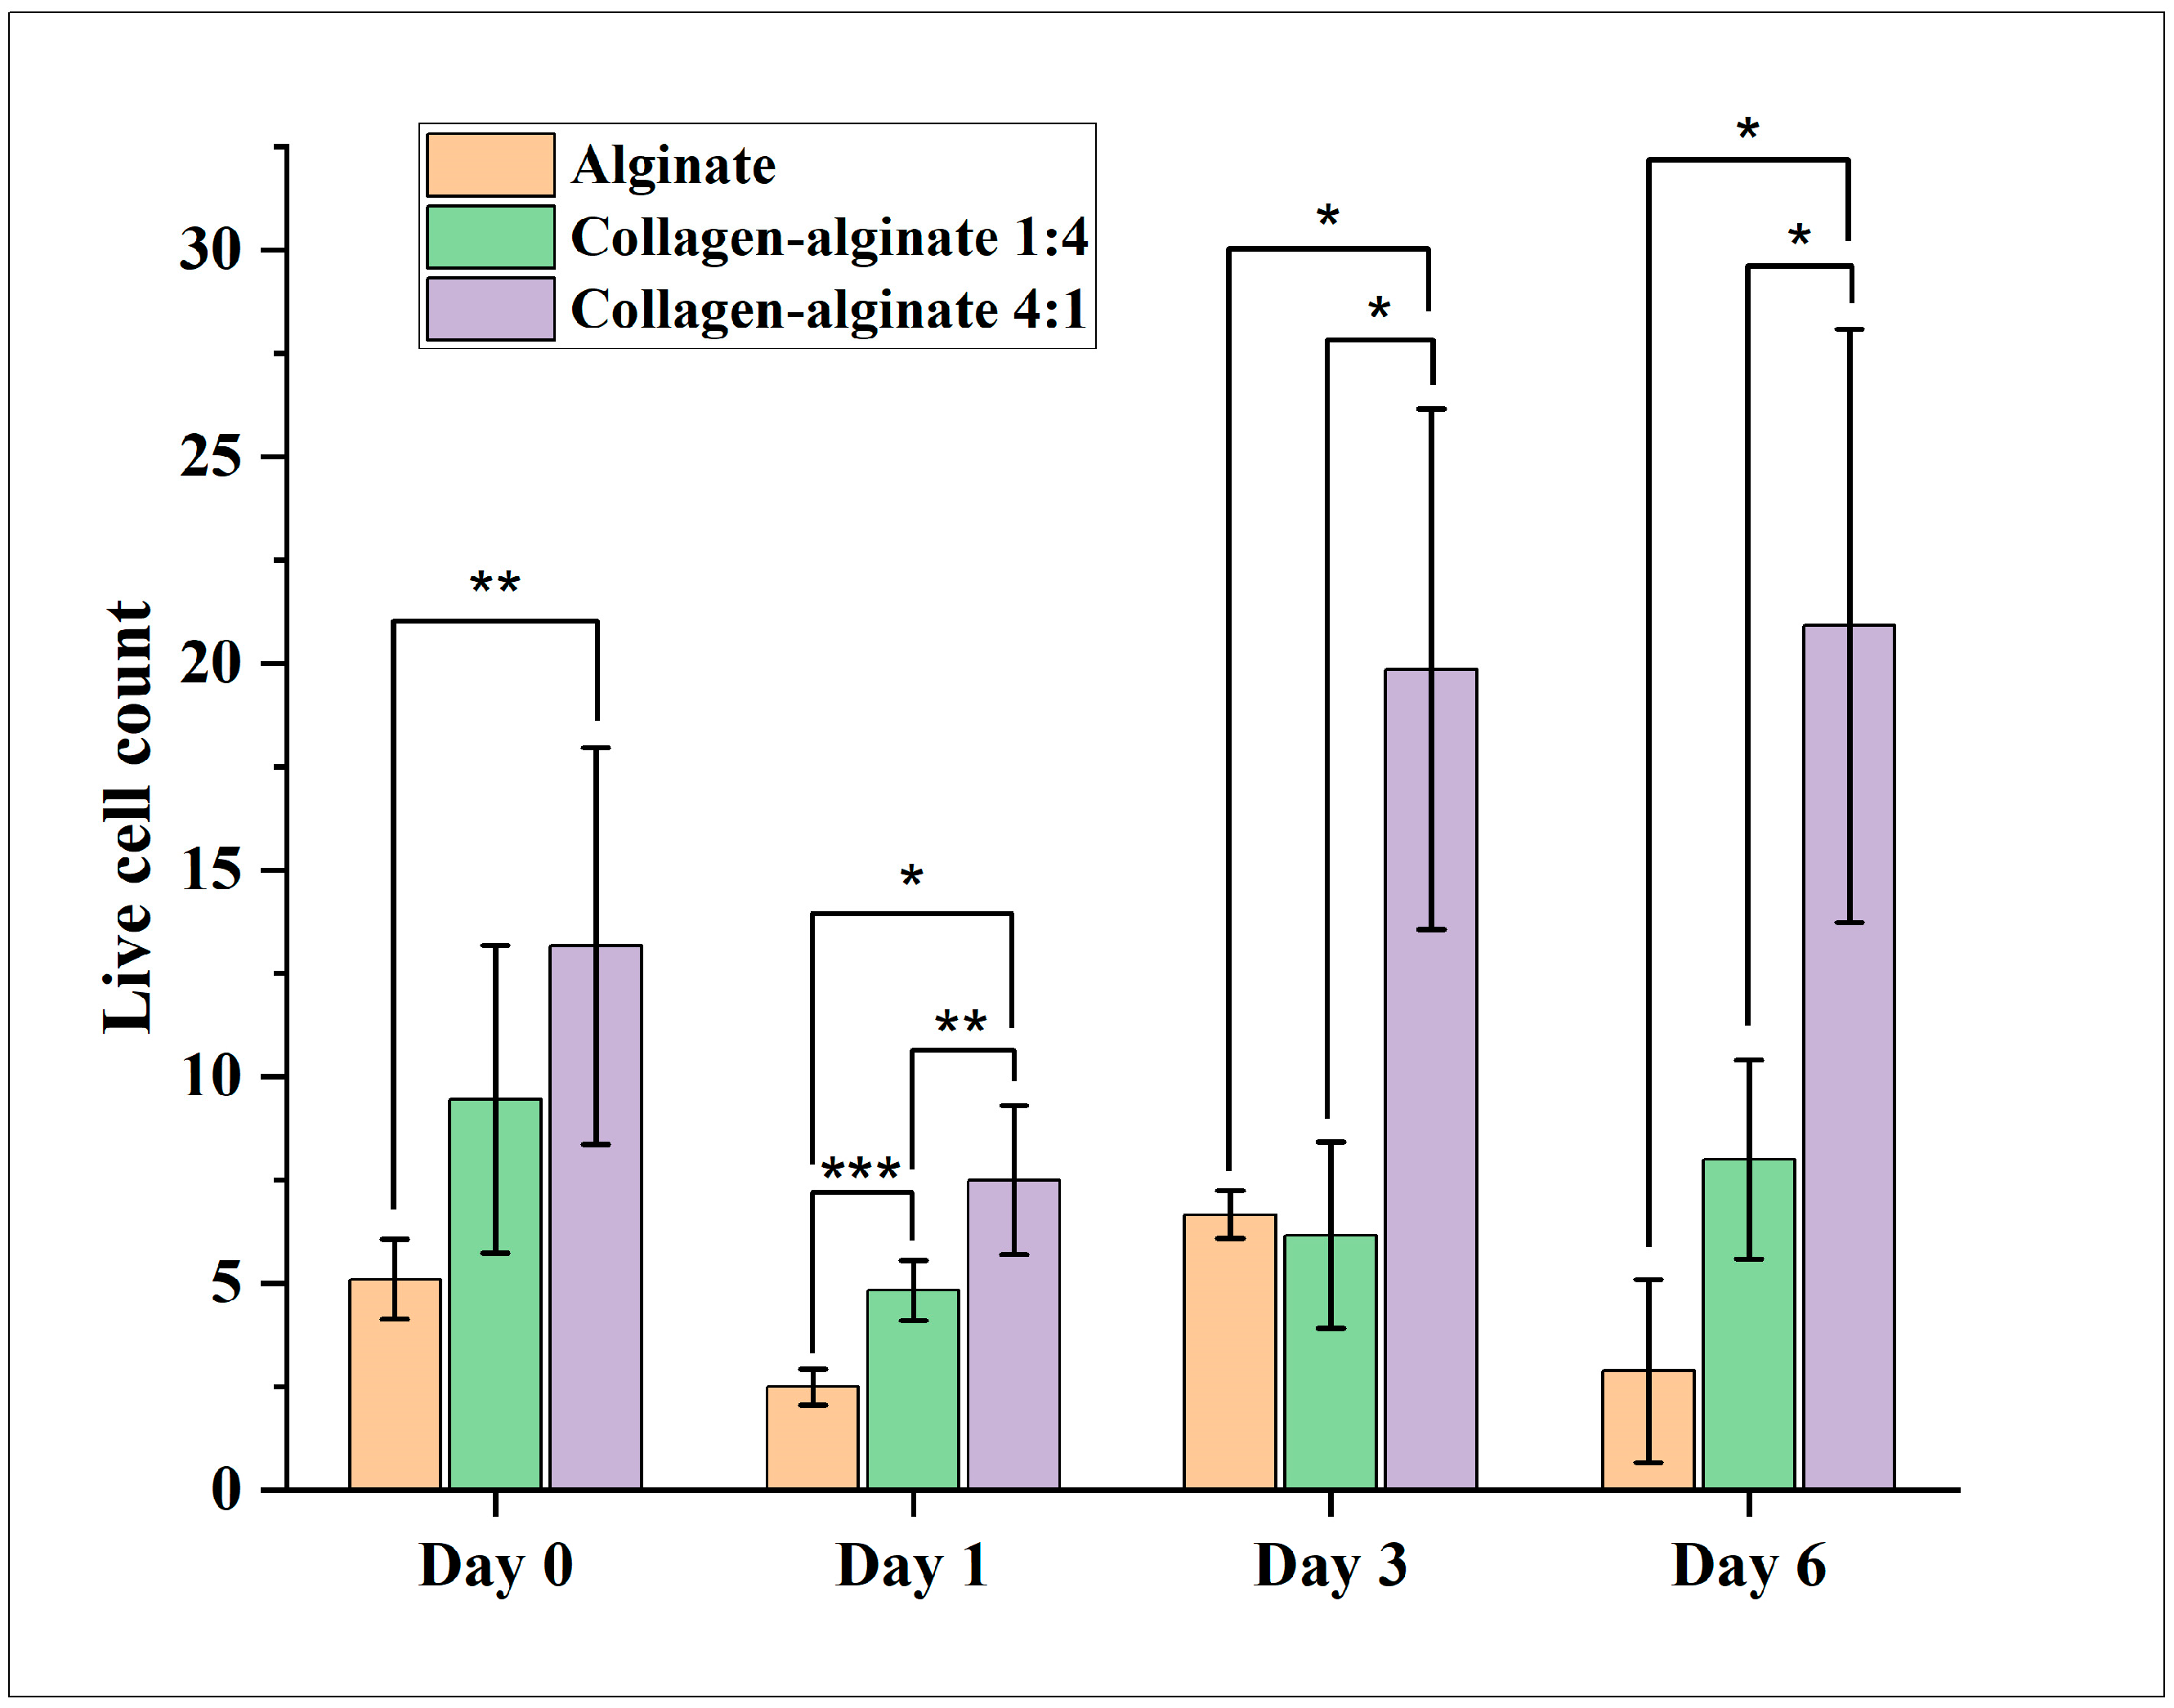
| Day 0 | 5.1 | 0.96 | 9.46 | 3.72 | 13.17 | 4.81 |
| Day 1 | 2.5 | 0.43 | 4.83 | 0.73 | 7.5 | 1.80 |
| Day 3 | 6.67 | 0.58 | 6.17 | 2.26 | 19.87 | 6.29 |
| Day 6 | 2.89 | 2.22 | 8 | 2.40 | 20.92 | 7.18 |
| Alginate | Collagen–Alginate 1:4 | Collagen–Alginate 4:1 | ||||
|---|---|---|---|---|---|---|
| Mean | Standard Deviation | Mean | Standard Deviation | Mean | Standard Deviation | |
| Day 0 | 71.39 | 4.49 | 81.23 | 3.38 | 95.76 | 5.23 |
| Day 1 | 49.13 | 3.19 | 70.43 | 5.45 | 85.77 | 6.20 |
| Day 3 | 68.39 | 5.90 | 71.48 | 12.13 | 84.83 | 8.75 |
| Day 6 | 44.97 | 13.65 | 74.96 | 11.18 | 85.10 | 10.01 |
| Live Cell Count | Cell Viability | |
|---|---|---|
| Day 0 | 0.0902 | 0.0017 |
| Day 1 | 0.0053 | 0.0004 |
| Day 3 | 0.0614 | 0.1492 |
| Day 6 | 0.0073 | 0.0137 |
| Day 0 | Day 1 | Day 3 | Day 6 | |
|---|---|---|---|---|
| Collagen–alginate 1:4, alginate | 0.2731 | 0.1040 | 0.9863 | 0.4100 |
| Collagen–alginate 4:1, alginate | 0.0811 | 0.0043 | 0.0138 | 0.0068 |
| Collagen–alginate 4:1; collagen–alginate 1:4 | 0.6259 | 0.0663 | 0.0117 | 0.0306 |
| Day 0 | Day 1 | Day 3 | Day 6 | |
|---|---|---|---|---|
| Collagen–alginate 1:4, alginate | 0.1066 | 0.0053 | 0.9138 | 0.0460 |
| Collagen–alginate 4:1, alginate | 0.0014 | 0.0003 | 0.1558 | 0.0135 |
| Collagen–alginate 4:1; collagen–alginate 1:4 | 0.0148 | 0.0241 | 0.2510 | 0.5695 |
Disclaimer/Publisher’s Note: The statements, opinions and data contained in all publications are solely those of the individual author(s) and contributor(s) and not of MDPI and/or the editor(s). MDPI and/or the editor(s) disclaim responsibility for any injury to people or property resulting from any ideas, methods, instructions or products referred to in the content. |
© 2024 by the authors. Licensee MDPI, Basel, Switzerland. This article is an open access article distributed under the terms and conditions of the Creative Commons Attribution (CC BY) license (https://creativecommons.org/licenses/by/4.0/).
Share and Cite
Rahman, T.T.; Wood, N.; Akib, Y.M.; Qin, H.; Pei, Z. Experimental Study on Compatibility of Human Bronchial Epithelial Cells in Collagen–Alginate Bioink for 3D Printing. Bioengineering 2024, 11, 862. https://doi.org/10.3390/bioengineering11090862
Rahman TT, Wood N, Akib YM, Qin H, Pei Z. Experimental Study on Compatibility of Human Bronchial Epithelial Cells in Collagen–Alginate Bioink for 3D Printing. Bioengineering. 2024; 11(9):862. https://doi.org/10.3390/bioengineering11090862
Chicago/Turabian StyleRahman, Taieba Tuba, Nathan Wood, Yeasir Mohammad Akib, Hongmin Qin, and Zhijian Pei. 2024. "Experimental Study on Compatibility of Human Bronchial Epithelial Cells in Collagen–Alginate Bioink for 3D Printing" Bioengineering 11, no. 9: 862. https://doi.org/10.3390/bioengineering11090862
APA StyleRahman, T. T., Wood, N., Akib, Y. M., Qin, H., & Pei, Z. (2024). Experimental Study on Compatibility of Human Bronchial Epithelial Cells in Collagen–Alginate Bioink for 3D Printing. Bioengineering, 11(9), 862. https://doi.org/10.3390/bioengineering11090862