

Achieving Real-Time Prediction of Paroxysmal Atrial Fibrillation Onset by Convolutional Neural Network and Sliding Window on R-R Interval Sequences


Abstract

1. Introduction
- (1)
- We propose a novel automated algorithm for real-time PAF onset prediction which uses a sliding window on raw R-R intervals of ECG segments. This mechanism allows the model to easily adjust the sliding step to meet different application scenarios. We set the sliding step to 1 in this study to meet real-time monitoring requirements.
- (2)
- We also introduce a CNN model for end-to-end PAF prediction and classification with only raw R-R interval segments as input samples, which allows the whole system to automatically emphasize important information in the input data and avoid the inevitable subjectivity of using machine learning methods.
- (3)
- By comparing the results produced with different input sizes of the model, we found that 100 R-R intervals resulted in an overall improvement in prediction performance, and 50 and 200 R-R intervals were relatively less efficient in terms of the testing time of each sample.
- (4)
- We carried out comprehensive and comparative experiments using public datasets to validate the effectiveness of our model. The results demonstrate that our approach performs exceptionally well in PAF prediction tasks and holds promise for real-time applications.
2. Materials and Methods
2.1. Databases
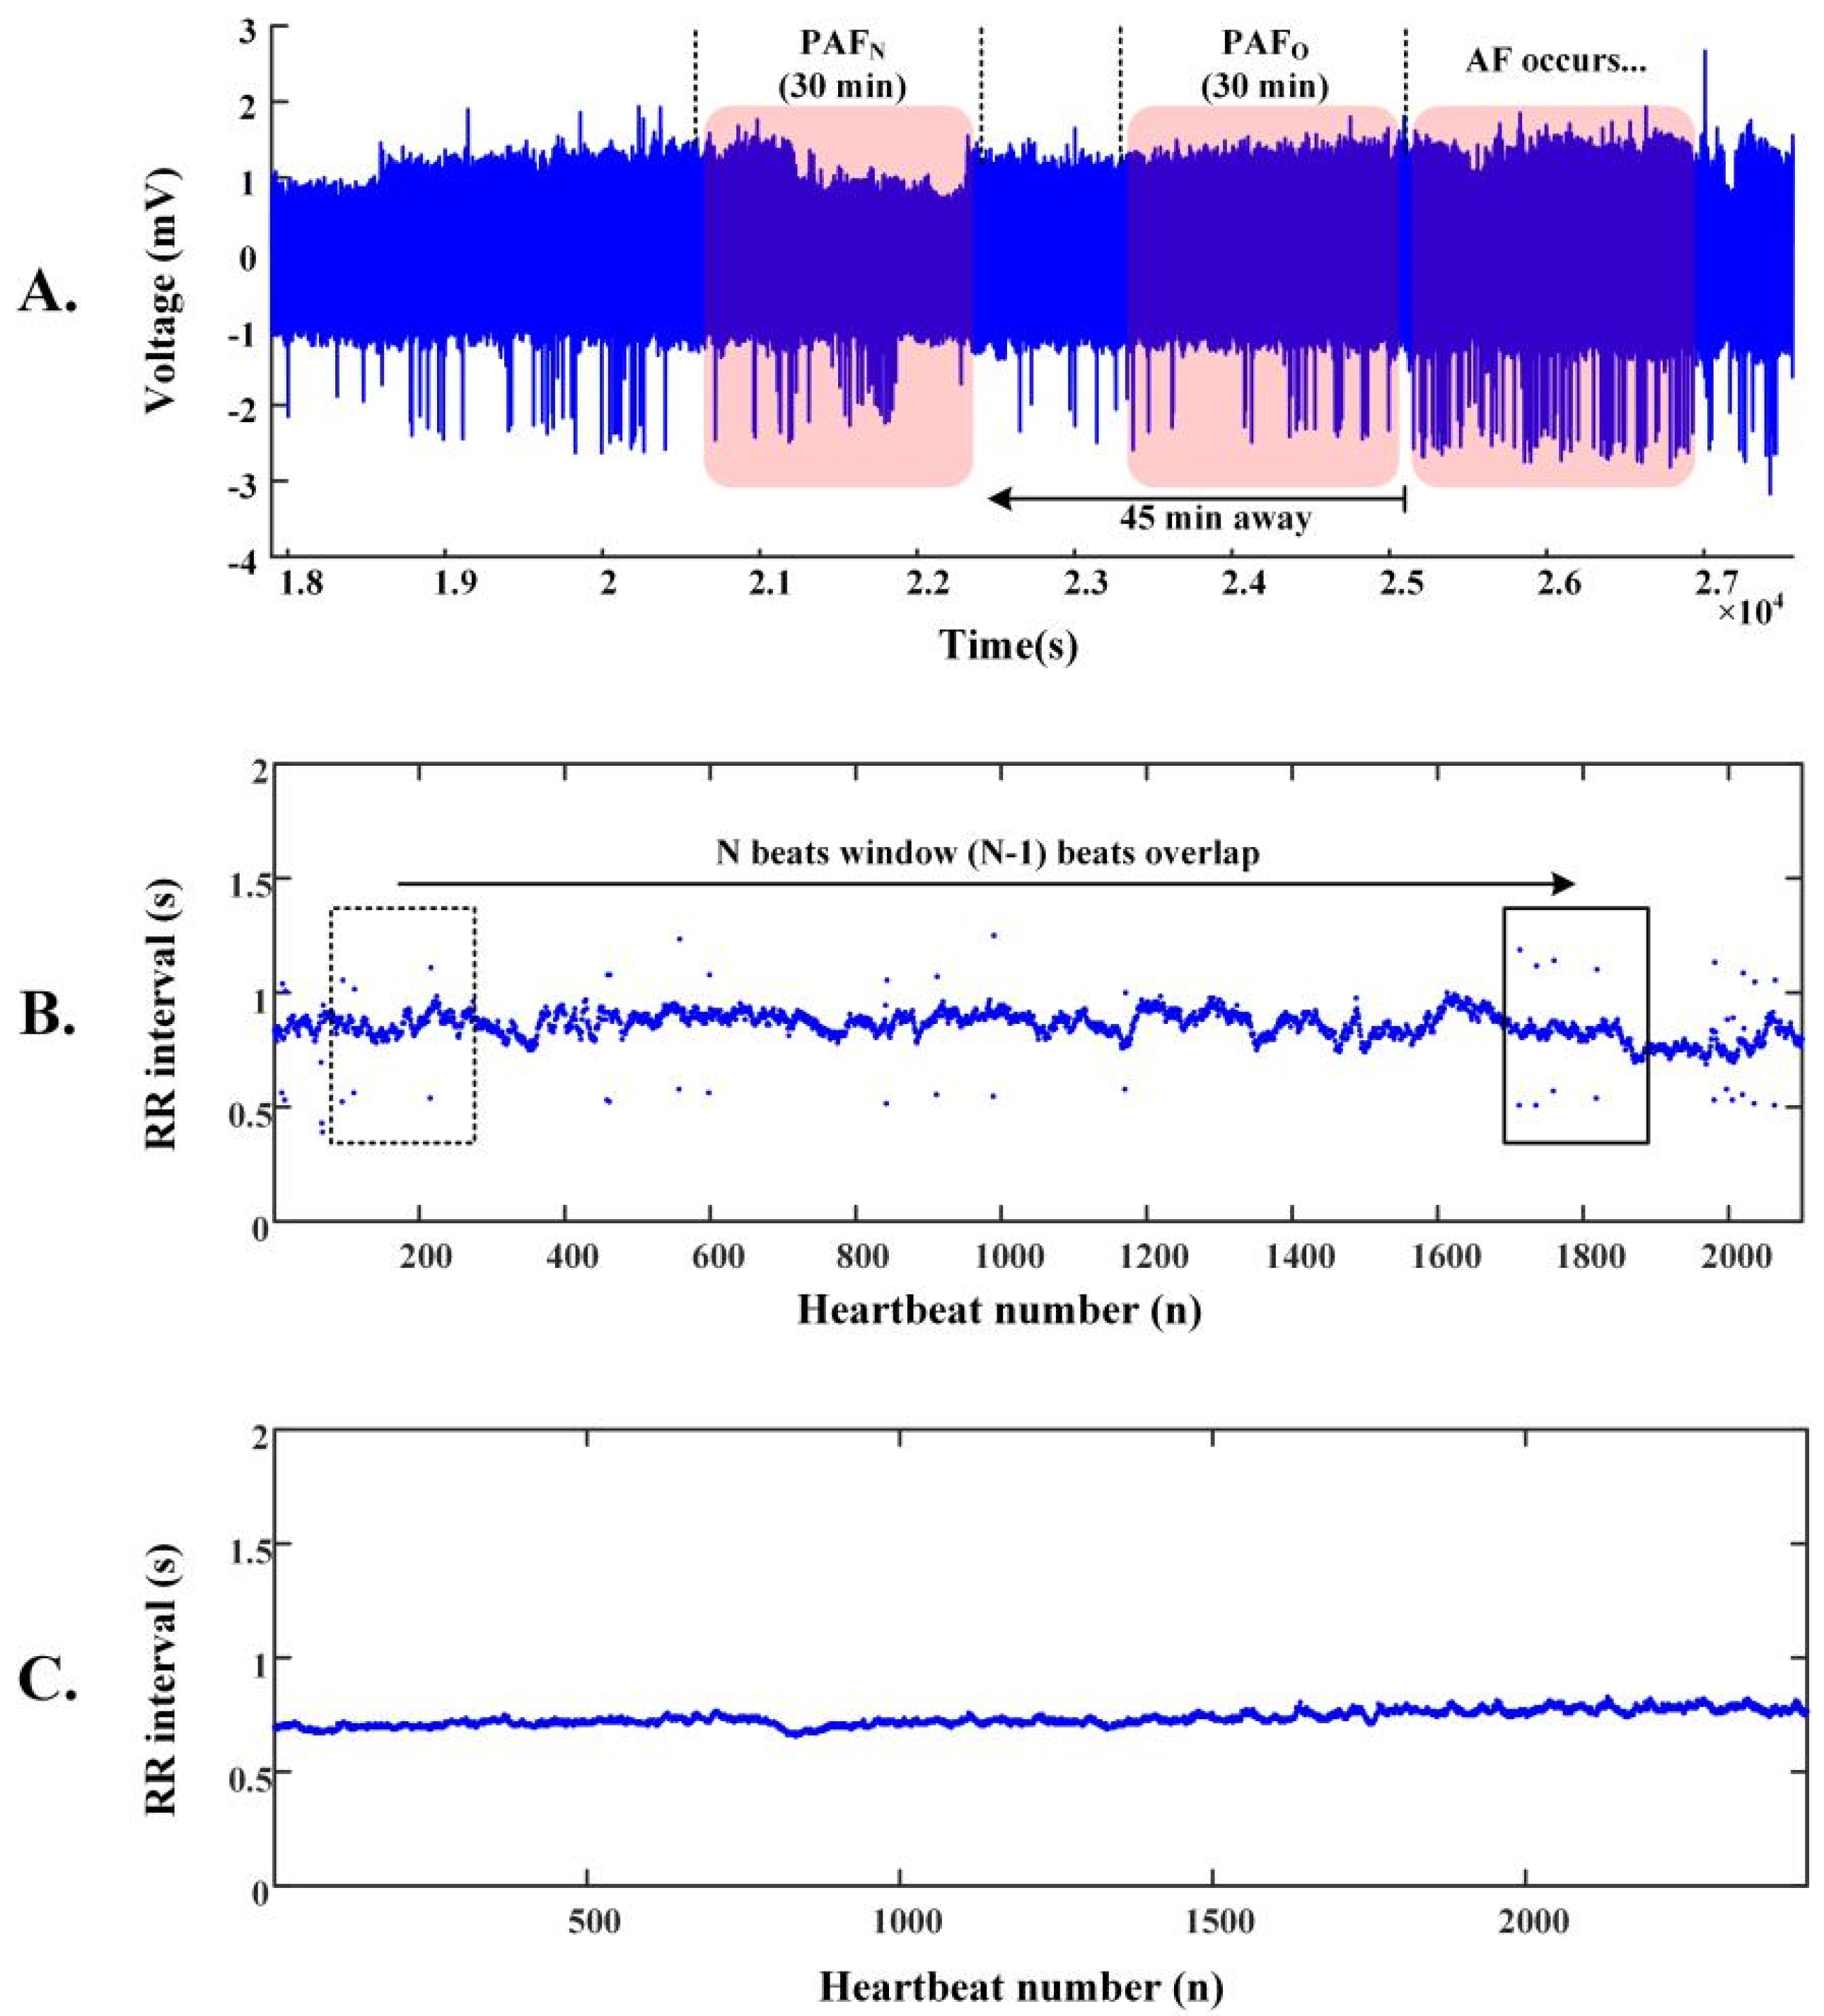
2.2. R-R Intervals of ECG Segments
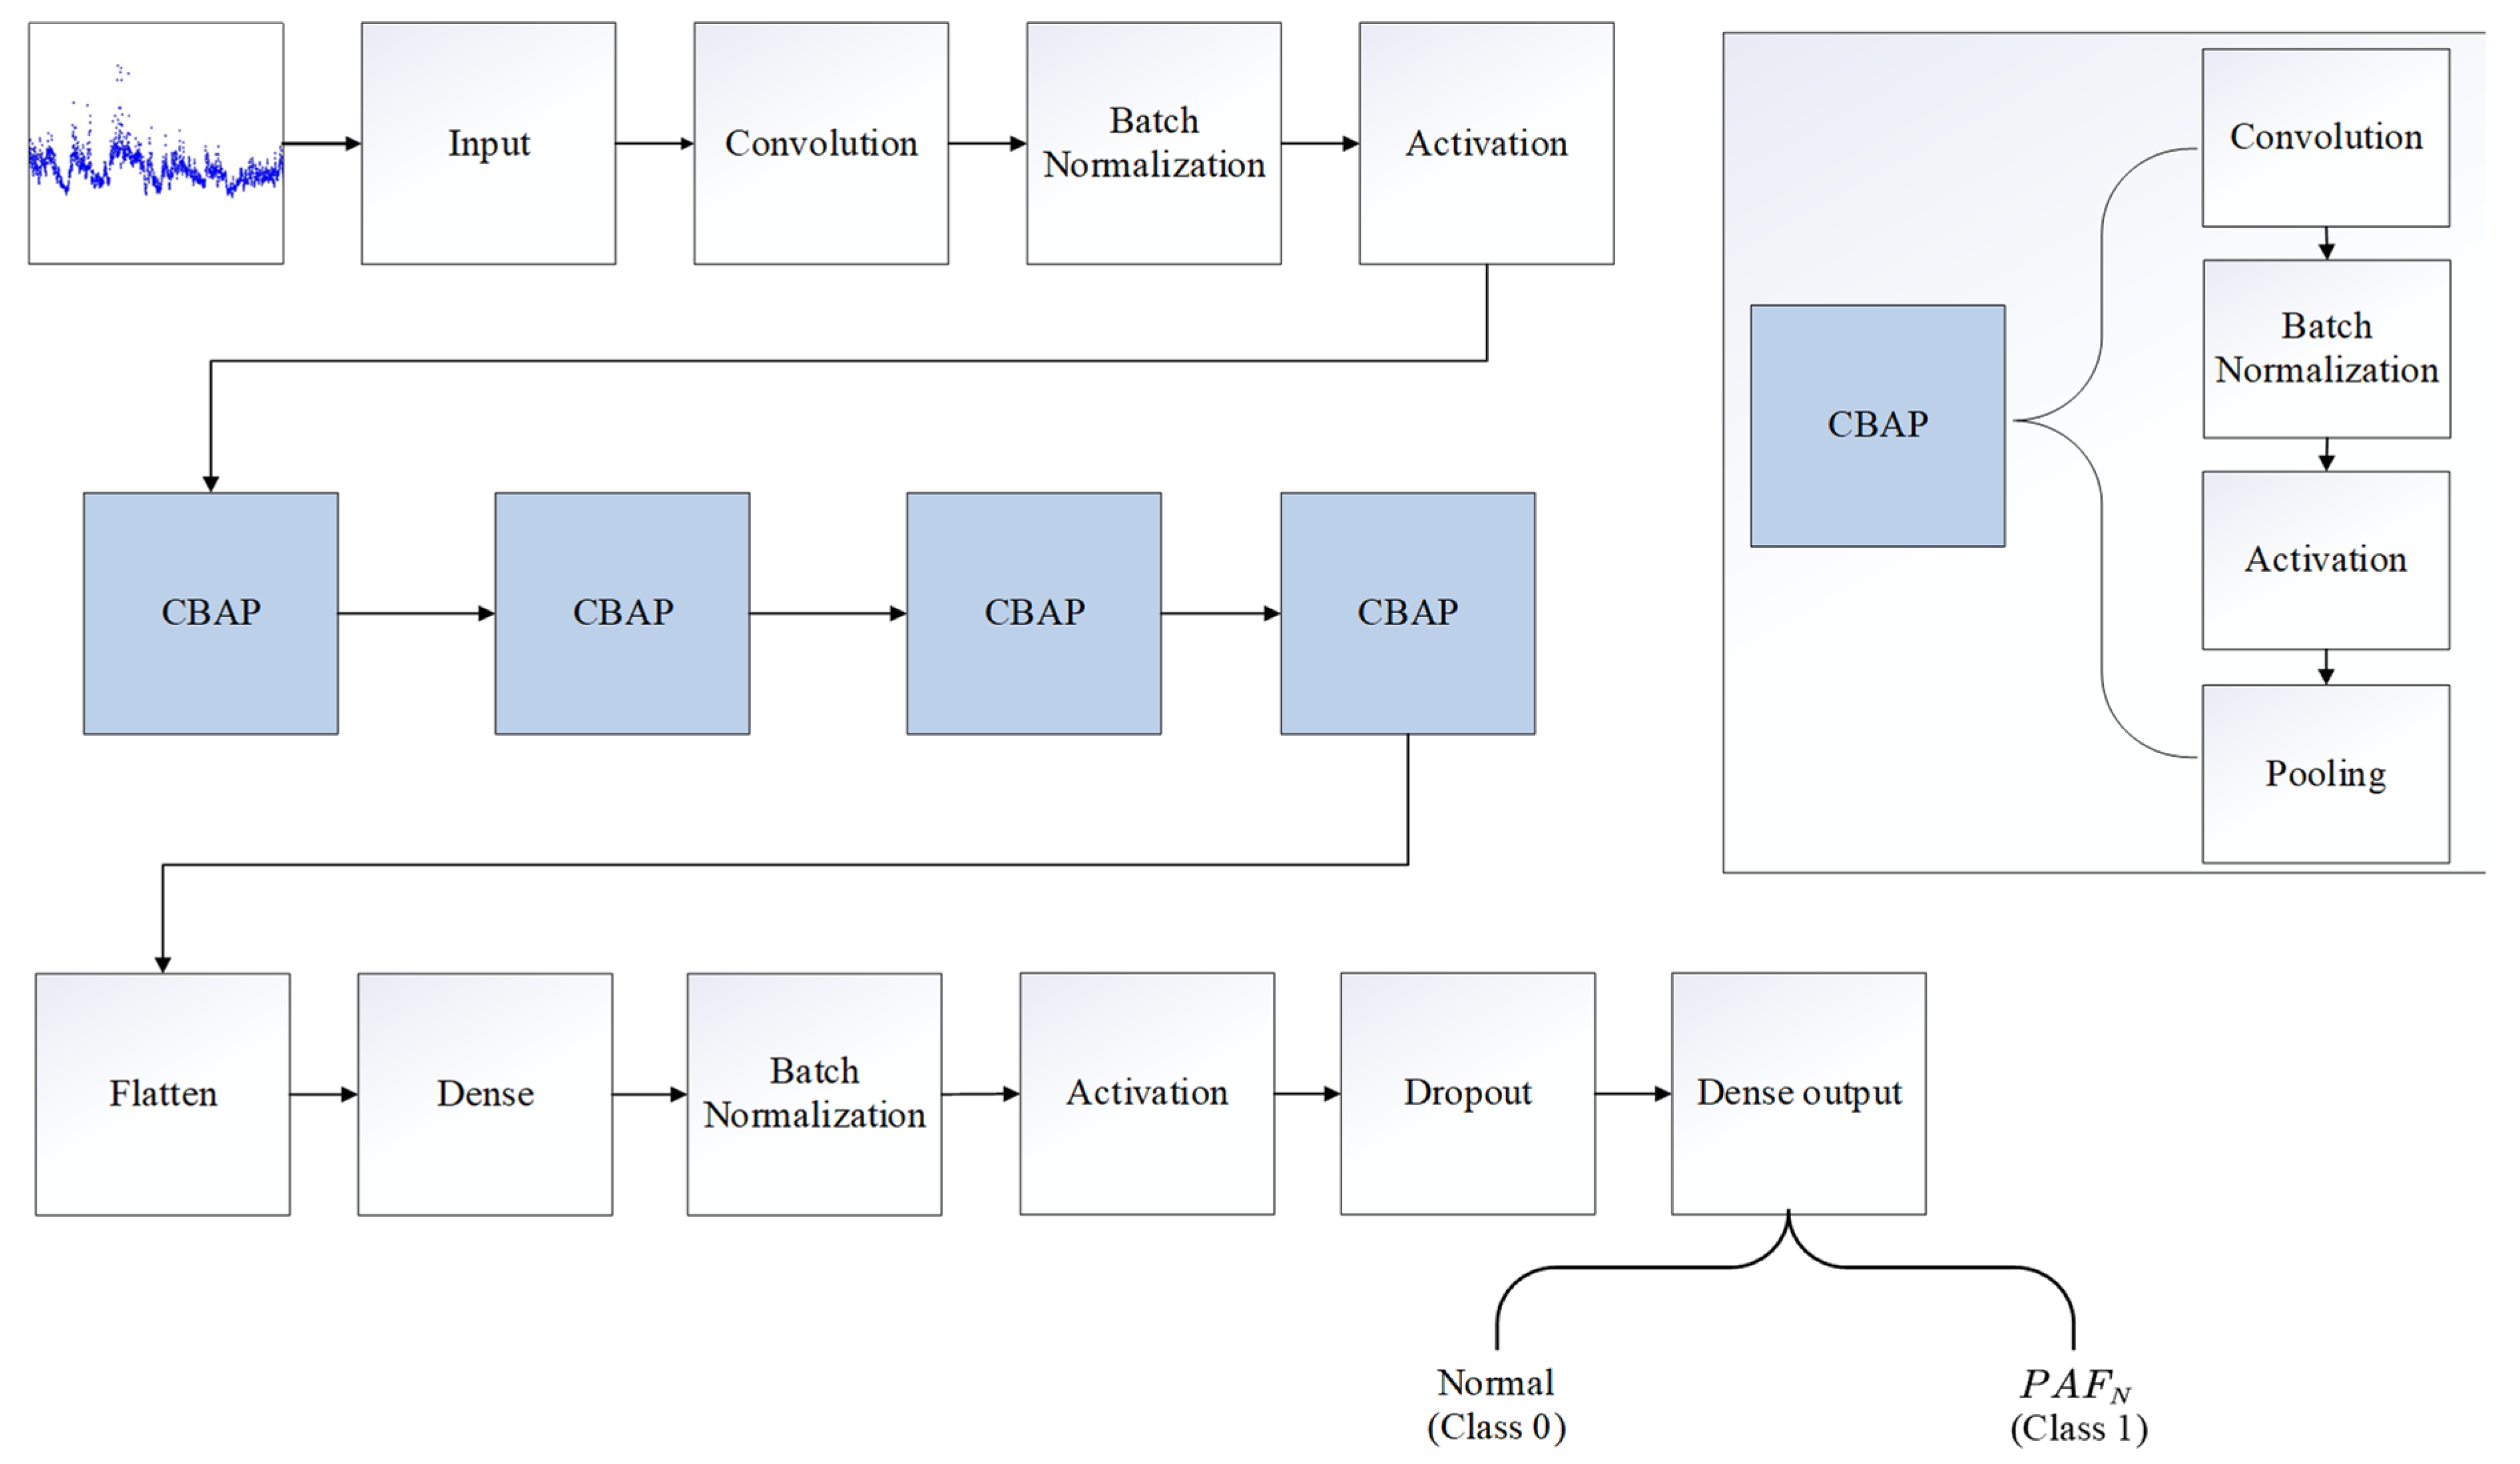
2.3. Architecture of the PAFNet Model
2.4. Training and Optimization of the PAFNet Model
2.5. Evaluation Protocols
3. Results
4. Discussions
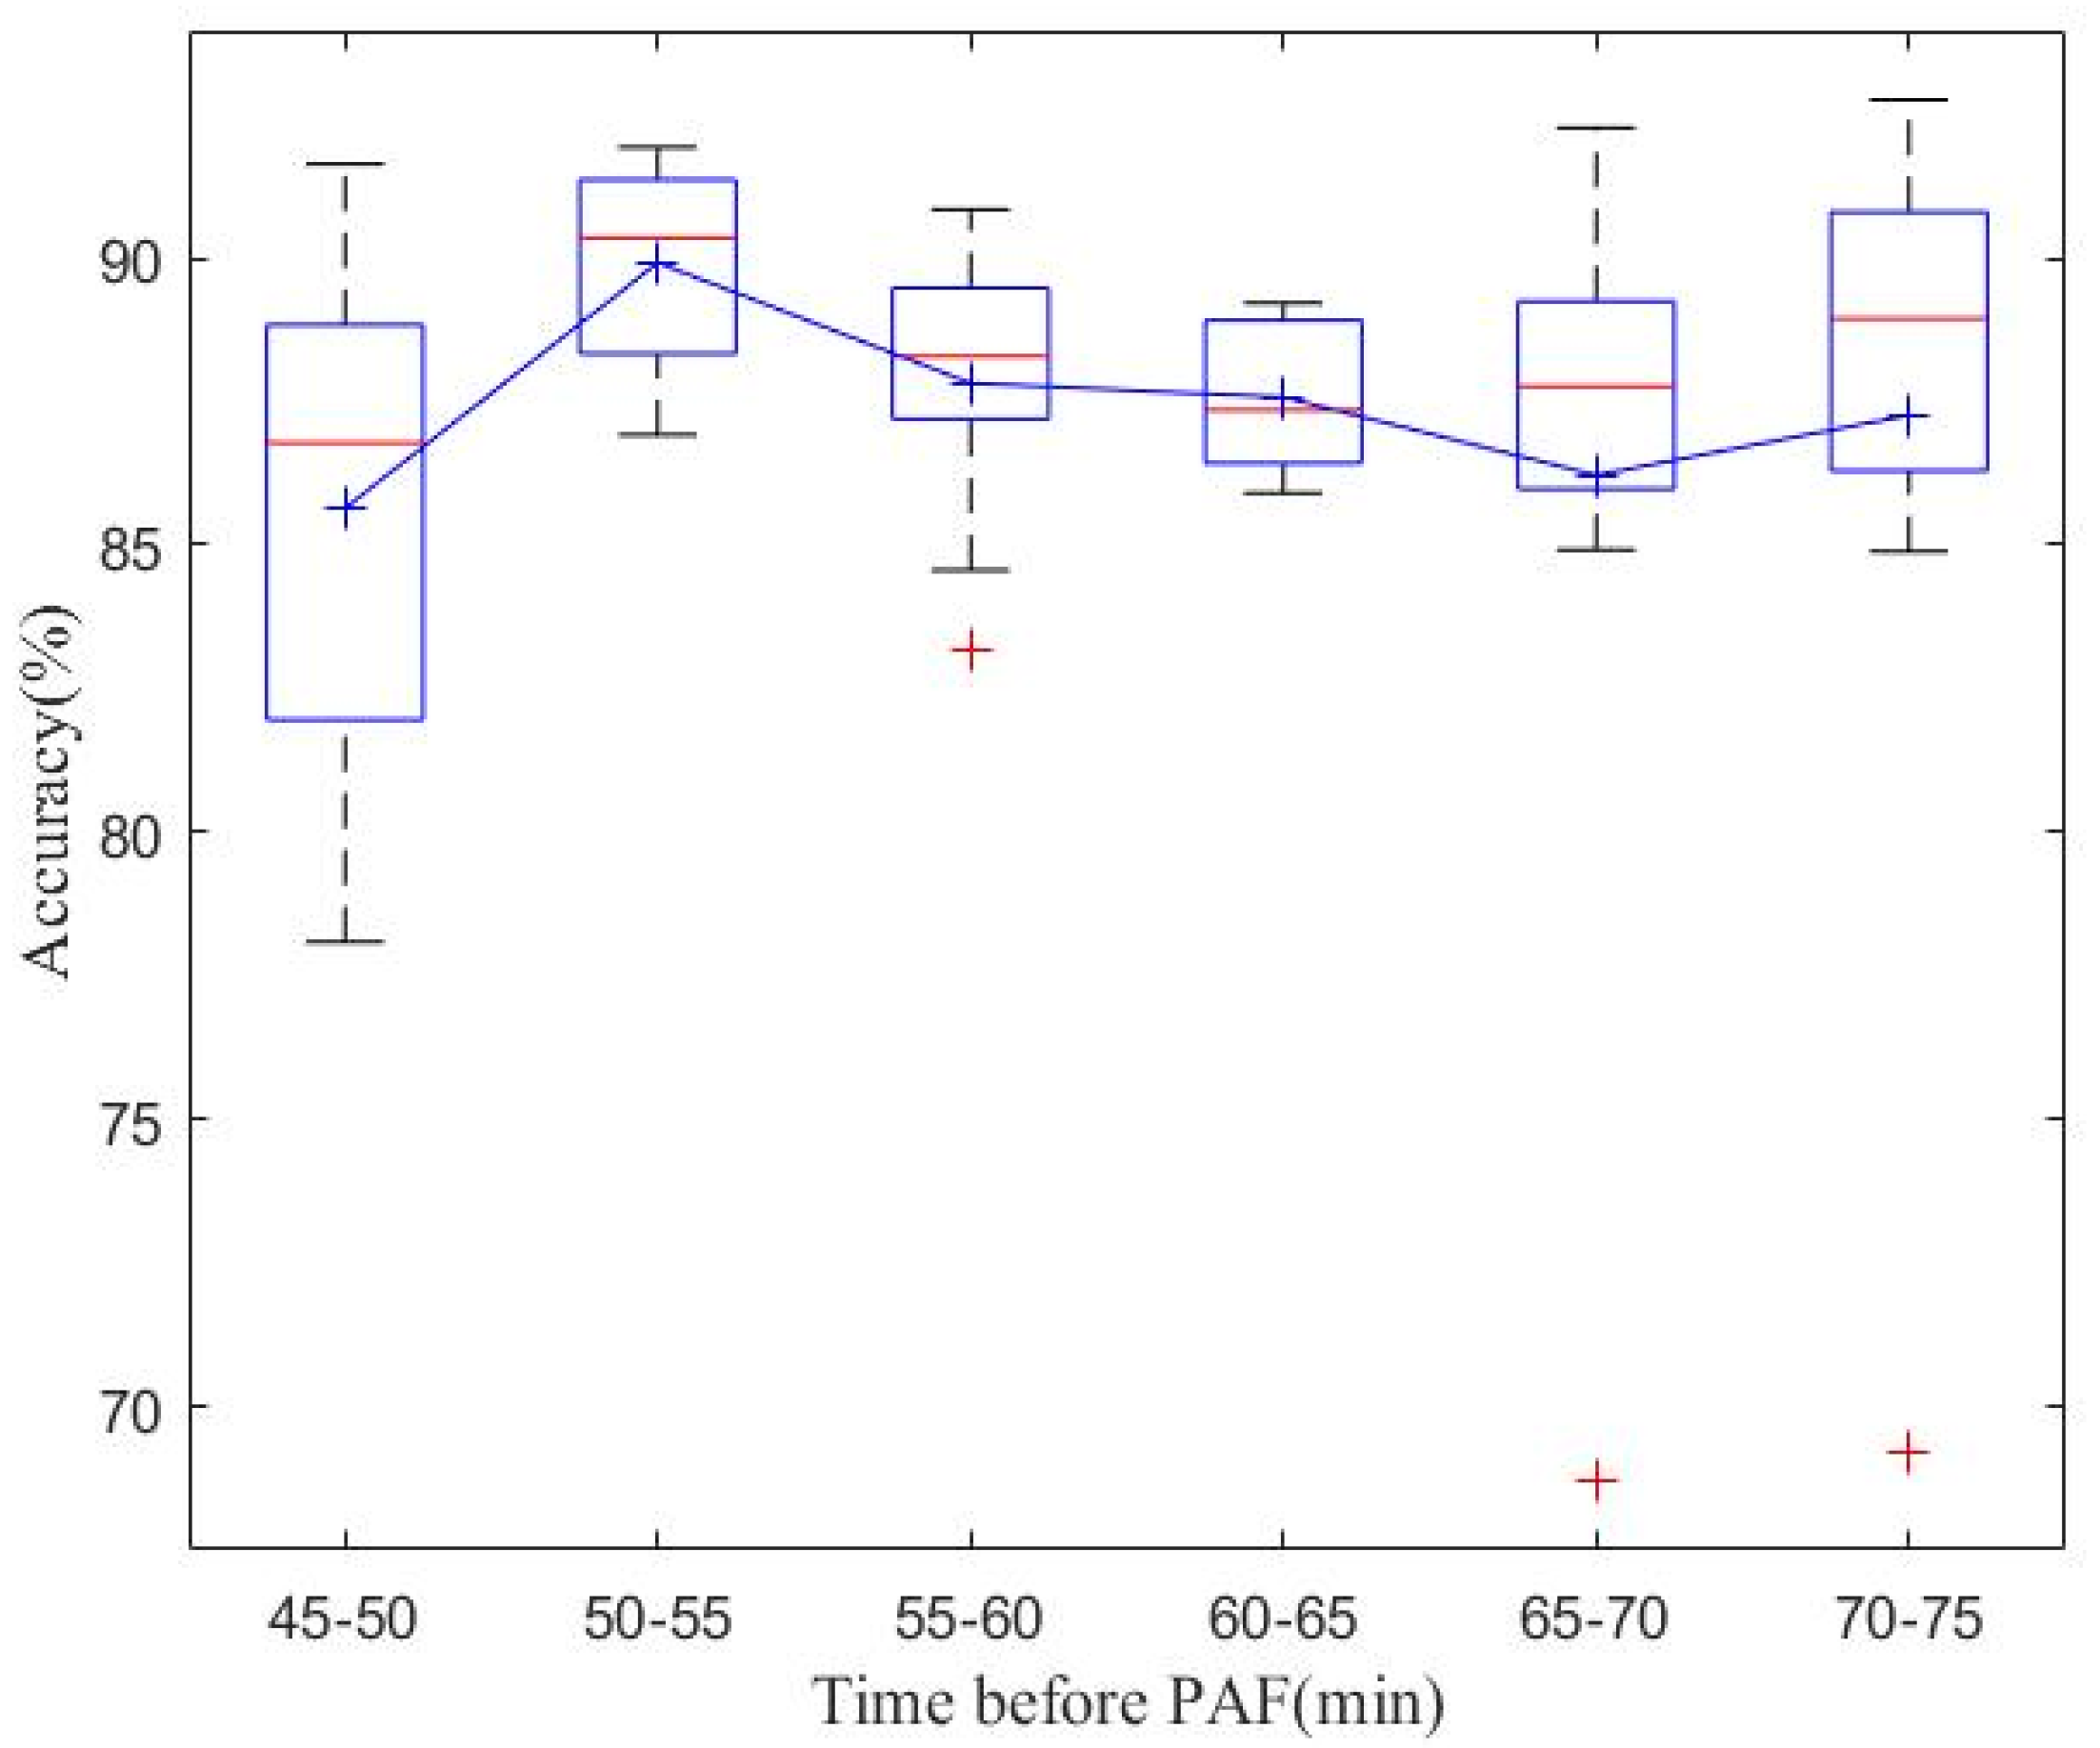
4.1. Real-Time PAF Onset Prediction
4.2. Performance Compared with Other Methods
4.3. Study Limitations and Future Works
5. Conclusions
Author Contributions
Funding
Institutional Review Board Statement
Informed Consent Statement
Data Availability Statement
Conflicts of Interest
References
- Calkins, H.; Hindricks, G.; Cappato, R.; Kim, Y.H.; Saad, E.B.; Aguinaga, L.; Akar, J.G.; Badhwar, V.; Brugada, J.; Camm, J.; et al. 2017 HRS/EHRA/ECAS/APHRS/SOLAECE expert consensus statement on catheter and surgical ablation of atrial fibrillation. Heart Rhythm 2017, 14, e275–e444. [Google Scholar] [CrossRef] [PubMed]
- Colilla, S.; Crow, A.; Petkun, W.; Singer, D.E.; Simon, T.; Liu, X.C. Estimates of Current and Future Incidence and Prevalence of Atrial Fibrillation in the US Adult Population. Am. J. Cardiol. 2013, 112, 1142–1147. [Google Scholar] [CrossRef]
- Boon, K.H.; Khalil-Hani, M.; Malarvili, M.B.; Sia, C.W. Paroxysmal atrial fibrillation prediction method with shorter HRV sequences. Comput. Methods Programs Biomed. 2016, 134, 187–196. [Google Scholar] [CrossRef] [PubMed]
- Chiang, C.E.; Okumura, K.; Zhang, S.; Chao, T.F.; Siu, C.; Wei, L.; Saxena, A.; Takahashi, Y.; Siong Teo, W. 2017 consensus of the Asia Pacific Heart Rhythm Society on stroke prevention in atrial fibrillation. J. Arrhythmia 2017, 33, 345–367. [Google Scholar] [CrossRef]
- Boon, K.H.; Khalil-Hani, M.; Malarvili, M.B. Paroxysmal atrial fibrillation prediction based on HRV analysis and non-dominated sorting genetic algorithm III. Comput. Methods Programs Biomed. 2017, 153, 171–184. [Google Scholar] [CrossRef]
- Narin, A.; Isler, Y.; Ozer, M.; Perc, M. Early prediction of paroxysmal atrial fibrillation based on short-term heart rate variability. Phys. A 2018, 509, 56–65. [Google Scholar] [CrossRef]
- Soliman, E.Z.; Safford, M.M.; Muntner, P.; Khodneva, Y.; Dawood, F.Z.; Zakai, N.A.; Thacker, E.L.; Judd, S.; Howard, V.J.; Howard, G.; et al. Atrial Fibrillation and the Risk of Myocardial Infarction. JAMA Intern. Med. 2014, 174, E107–E114. [Google Scholar] [CrossRef] [PubMed]
- Wang, L.H.; Yan, Z.H.; Yang, Y.T.; Chen, J.Y.; Yang, T.; Kuo, I.C.; Abu, P.A.R.; Huang, P.C.; Chen, C.A.; Chen, S.L. A Classification and Prediction Hybrid Model Construction with the IQPSO-SVM Algorithm for Atrial Fibrillation Arrhythmia. Sensors 2021, 21, 5222. [Google Scholar] [CrossRef]
- Hindricks, G.; Potpara, T.; Dagres, N.; Arbelo, E.; Bax, J.J.; Blomstrom-Lundqvist, C.; Boriani, G.; Castella, M.; Dan, G.A.; Dilaveris, P.E.; et al. 2020 ESC Guidelines for the diagnosis and management of atrial fibrillation developed in collaboration with the European Association for Cardio-Thoracic Surgery (EACTS). Eur. Heart J. 2021, 42, 373–498. [Google Scholar] [CrossRef]
- Chen, W.S.; Gao, B.R.; Chen, W.Q.; Li, Z.Z.; Xu, Z.Y.; Zhang, Y.H.; Yang, K.; Guan, X.Q. Comparison of pharmacological and electrical cardioversion in permanent atrial fibrillation after prosthetic cardiac valve replacement: A prospective randomized trial. J. Med. Internet Res. 2013, 41, 1067–1073. [Google Scholar] [CrossRef] [PubMed]
- Gitt, A.K.; Smolka, W.; Michailov, G.; Bernhardt, A.; Pittrow, D.; Lewalter, T. Types and outcomes of cardioversion in patients admitted to hospital for atrial fibrillation: Results of the German RHYTHM-AF Study. Clin. Res. Cardiol. 2013, 102, 713–723. [Google Scholar] [CrossRef] [PubMed]
- Moody, G.B.; Goldberger, A.L.; McClennen, S.; Swiryn, S.P. Predicting the onset of paroxysmal atrial fibrillation. Comput. Cardiol. 2001, 28, 113–116. [Google Scholar] [CrossRef]
- de Chazal, P.; Heneghan, C. Automated assessment of atrial fibrillation. Comput. Cardiol. 2001, 28, 117–120. [Google Scholar] [CrossRef]
- Lynn, K.S.; Chiang, H.D. A two-stage solution algorithm for paroxysmal atrial fibrillation prediction. Comput. Cardiol. 2001, 28, 405–407. [Google Scholar] [CrossRef]
- Krstacic, G.; Gamberger, D.; Smuc, T.; Krstacic, A. Some important R-R interval based paroxysmal atrial fibrillation predictors. Comput. Cardiol. 2001, 28, 409–412. [Google Scholar] [CrossRef]
- Maier, C.; Bauch, M.; Dickhaus, H. Screening and prediction of paroxysmal atrial fibrillation by analysis of heart rate variability parameters. Comput. Cardiol. 2001, 28, 129–132. [Google Scholar] [CrossRef]
- Yang, A.C.C.; Yin, H.W. Prediction of paroxysmal atrial fibrillation by footprint analysis. Comput. Cardiol. 2001, 28, 401–404. [Google Scholar] [CrossRef]
- Langley, P.; di Bernardo, D.; Allen, J.; Bowers, E.; Smith, F.E.; Vecchietti, S.; Murray, A. Can paroxysmal atrial fibrillation be predicted? Comput. Cardiol. 2001, 28, 121–124. [Google Scholar] [CrossRef]
- Zong, W.; Mukkamala, R.; Mark, R.G. A methodology for predicting paroxysmal atrial fibrillation based on ECG arrhythmia feature analysis. Comput. Cardiol. 2001, 28, 125–128. [Google Scholar] [CrossRef]
- Islam, M.S.; Ammour, N.; Alajlan, N.; Aboalsamh, H. Rhythm-based heartbeat duration normalization for atrial fibrillation detection. Comput. Biol. Med. 2016, 72, 160–169. [Google Scholar] [CrossRef]
- Schreier, G.; Kastner, P.; Marko, W. An automatic ECG processing algorithm to identify patients prone to paroxysmal atrial fibrillation. Comput. Cardiol. 2001, 28, 133–135. [Google Scholar] [CrossRef]
- Sutton, J.R.; Mahajan, R.; Akbilgic, O.; Kamaleswaran, R. PhysOnline: An Open Source Machine Learning Pipeline for Real-Time Analysis of Stream Physiological Waveform. IEEE J. Biomed. Health Inform. 2019, 23, 59–65. [Google Scholar] [CrossRef]
- Acharya, U.R.; Fujita, H.; Lih, O.S.; Hagiwara, Y.; Tan, J.H.; Adam, M. Automated detection of arrhythmias using different intervals of tachycardia ECG segments with convolutional neural network. Inf. Sci. 2017, 405, 81–90. [Google Scholar] [CrossRef]
- Fan, X.; Yao, Q.; Cai, Y.; Miao, F.; Sun, F.; Li, Y. Multiscaled Fusion of Deep Convolutional Neural Networks for Screening Atrial Fibrillation From Single Lead Short ECG Recordings. IEEE J. Biomed. Health Inform. 2018, 22, 1744–1753. [Google Scholar] [CrossRef]
- Hannun, A.Y.; Rajpurkar, P.; Haghpanahi, M.; Tison, G.H.; Bourn, C.; Turakhia, M.P.; Ng, A.Y. Cardiologist-level arrhythmia detection and classification in ambulatory electrocardiograms using a deep neural network. Nat. Med. 2019, 25, 65–72. [Google Scholar] [CrossRef] [PubMed]
- Kamaleswaran, R.; Mahajan, R.; Akbilgic, O. A robust deep convolutional neural network for the classification of abnormal cardiac rhythm using single lead electrocardiograms of variable length. Physiol. Meas. 2018, 39, 035006. [Google Scholar] [CrossRef]
- Rubin, J.; Parvaneh, S.; Rahman, A.; Conroy, B.; Babaeizadeh, S. Densely connected convolutional networks for detection of atrial fibrillation from short single-lead ECG recordings. J. Electrocardiol. 2018, 51, S18–S21. [Google Scholar] [CrossRef]
- Lian, J.; Wang, L.; Muessig, D. A Simple Method to Detect Atrial Fibrillation Using RR Intervals. Am. J. Cardiol. 2011, 107, 1494–1497. [Google Scholar] [CrossRef]
- Stridh, M.; Sornmo, L.; Meurling, C.J.; Olsson, S.B. Sequential characterization of atrial tachyarrhythmias based on ECG time-frequency analysis. IEEE Trans. Biomed. Eng. 2004, 51, 100–114. [Google Scholar] [CrossRef]
- Roonizi, E.K.; Sassi, R. An Extended Bayesian Framework for Atrial and Ventricular Activity Separation in Atrial Fibrillation. IEEE J. Biomed. Health Inform. 2017, 21, 1573–1580. [Google Scholar] [CrossRef]
- Mehta, S.; Lingayat, N.; Sanghvi, S. Detection and delineation of P and T waves in 12-lead electrocardiograms. Expert Syst. 2009, 26, 125–143. [Google Scholar] [CrossRef]
- Ladavich, S.; Ghoraani, B. Developing An Atrial Activity-Based Algorithm For Detection Of Atrial Fibrillation. In Proceedings of the IEEE 2014 36th Annual International Conference of the IEEE Engineering in Medicine and Biology Society, Chicago, IL, USA, 26–30 August 2014. [Google Scholar]
- Kennedy, A.; Finlay, D.D.; Guldenring, D.; Bond, R.R.; Moran, K.; McLaughlin, J. Automated detection of atrial fibrillation using R-R intervals and multivariate-based classification. J. Electrocardiol. 2016, 49, 871–876. [Google Scholar] [CrossRef]
- Goldberger, A.L.; Amaral, L.A.N.; Glass, L.; Hausdorff, J.M.; Ivanov, P.C.; Mark, R.G.; Mietus, J.E.; Moody, G.B.; Peng, C.K.; Stanley, H.E. PhysioBank, PhysioToolkit, and PhysioNet-Components of a new research resource for complex physiologic signals. Circulation 2000, 101, E215–E220. [Google Scholar] [CrossRef] [PubMed]
- LeCun, Y.; Bengio, Y.; Hinton, G. Deep learning. Nature 2015, 521, 436–444. [Google Scholar] [CrossRef]
- Camm, A.J.; Malik, M.; Bigger, J.T.; Briethardt, G.; Cerutti, S.; Cohen, R.J.; Coumel, P.; Fallen, E.L.; Kennedy, H.L.; Kleiger, R.E.; et al. Heart rate variability-Standards of measurement, physiological interpretation, and clinical use. Eur. Heart J. 1996, 93, 354–381. [Google Scholar] [CrossRef]
- Huang, J.; Chen, H.; Zhang, Q.; Yang, R.; Peng, S.; Wu, Z.; Liu, N.; Tang, L.; Liu, Z.; Zhou, S. Development and Validation of a Novel Prognostic Tool to Predict Recurrence of Paroxysmal Atrial Fibrillation after the First-Time Catheter Ablation: A Retrospective Cohort Study. Diagnostics 2023, 13, 1207. [Google Scholar] [CrossRef]
- Lee, J.-D.; Kuo, Y.-W.; Lee, C.-P.; Huang, Y.-C.; Lee, M.; Lee, T.-H. Development and Validation of a Novel Score for Predicting Paroxysmal Atrial Fibrillation in Acute Ischemic Stroke. Int. J. Environ. Res. Public Health 2022, 19, 7277. [Google Scholar] [CrossRef] [PubMed]

| Database | Number of Records (n) | Number of R-R Intervals (n) | |
|---|---|---|---|
| Training and validation | AFPDB (PAFN) | 25 | 56,381 |
| AFPDB (N) | 25 | 56,900 | |
| Testing | AFDB (PAFN) | 12 | 27,836 |
| NSRDB (N) | 18 | 44,087 | |
| Number | Layer Type | Number of Feature Maps or Nodes | Parameters | Number | Layer Type | Number of Feature Maps or Nodes | Parameters |
|---|---|---|---|---|---|---|---|
| 1 | input | changing with the size of the sliding window | N | 14 | BN * | - | - |
| 2 | convolutional | 16 | size: N, kernel: 8, padding = “same” | 15 | activation | - | ReLU |
| 3 | BN | - | - | 16 | pooling | - | size: 2 |
| 4 | activation | - | ReLU | 17 | convolutional | 256 | size: N/16, kernel: 8, padding = “same” |
| 5 | convolutional | 32 | size: N/2, kernel: 8, padding = “same” | 18 | BN | - | - |
| 6 | BN | - | - | 19 | activation | - | ReLU |
| 7 | activation | - | ReLU | 20 | pooling | - | size: 2 |
| 8 | pooling | - | size: 2 | 21 | Flatten | - | - |
| 9 | convolutional | 64 | size: N/4, kernel: 8, padding = “same” | 22 | Dense | 512 | - |
| 10 | BN | - | - | 23 | BN | - | - |
| 11 | activation | - | ReLU | 24 | activation | - | ReLU |
| 12 | pooling | - | size: 2 | 25 | dropout | - | 0.25 |
| 13 | convolutional | 128 | size: N/8, kernel: 8, padding = “same” | 26 | Dense output | 1 | activation function: Sigmoid |
| Model | Input Size (n) | Sen (%) | Spe (%) | Acc (%) | Testing Time (ms/batch) | Total Params |
|---|---|---|---|---|---|---|
| M1 | 50 | 85.44 | 92.45 | 89.74 | 13.8 | 878,017 |
| M2 | 100 | 89.92 | 93.24 | 91.96 | 23.1 | 1,271,233 |
| M3 | 200 | 88.17 | 93.47 | 91.42 | 43.0 | 2,057,665 |
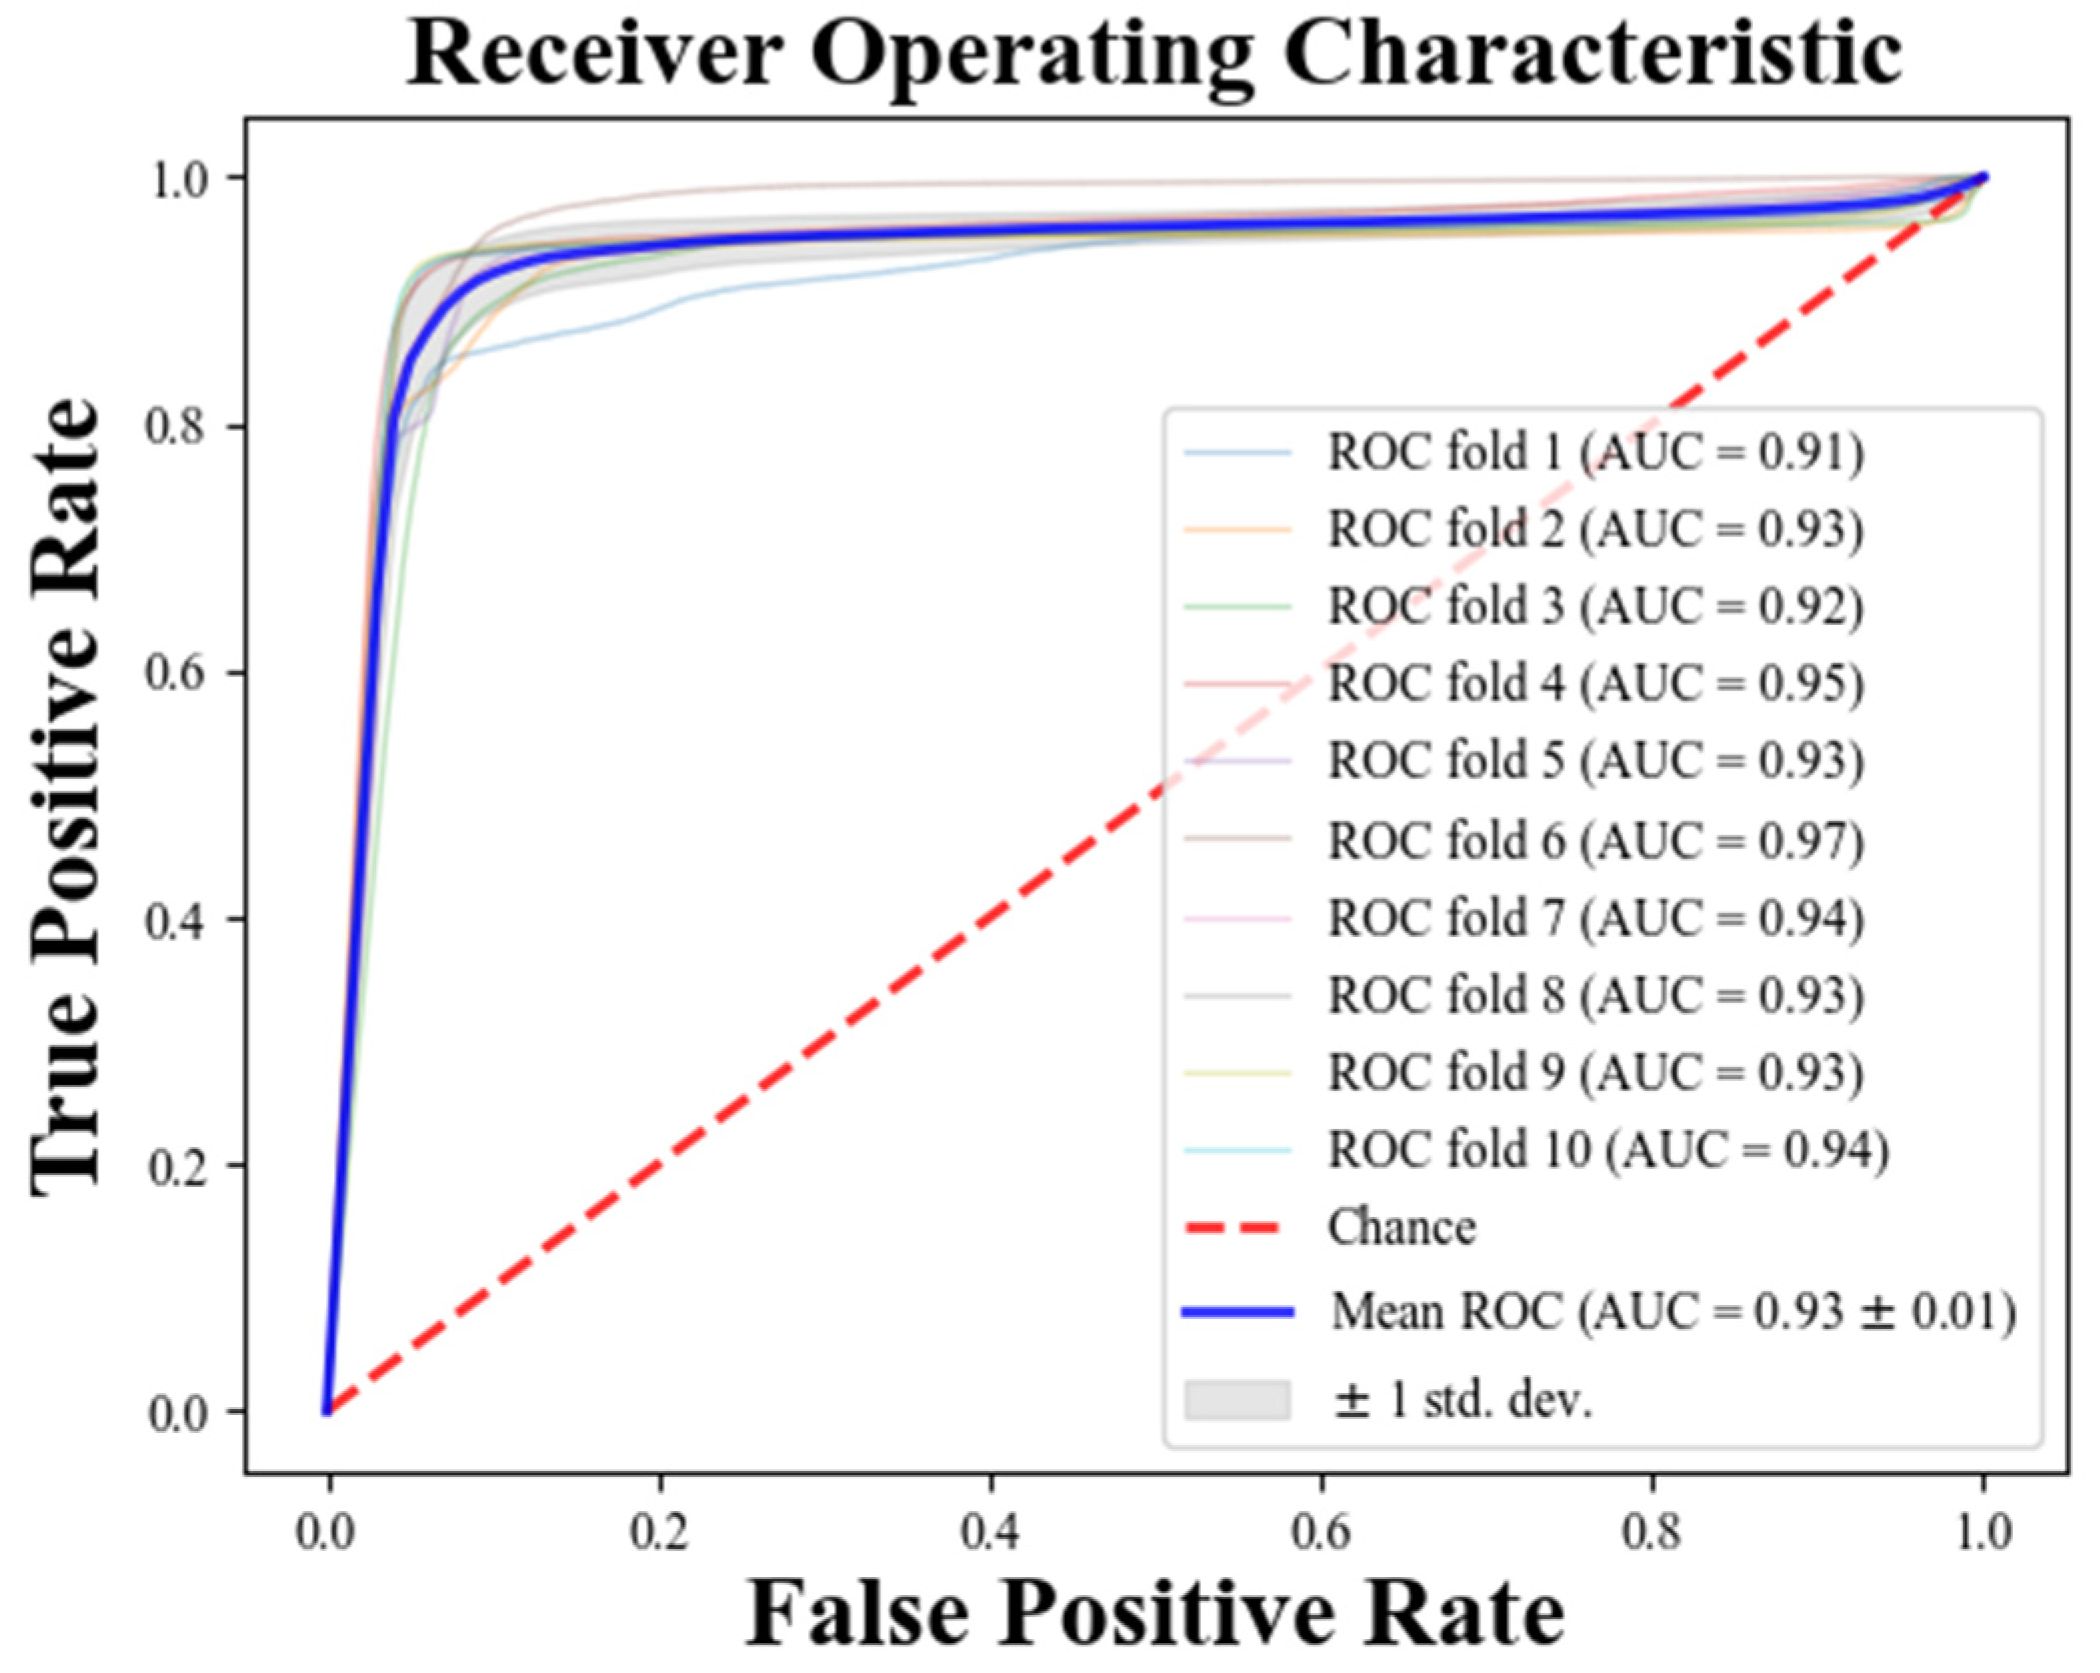
| Fold | Training Data (Rows) | Validation Data (Rows) | Sen (%) | Spe (%) | Acc (%) |
|---|---|---|---|---|---|
| 1 | 11,329–113,281 | 1–11,328 | 82.11 | 92.09 | 87.16 |
| 2 | 1–11,328, 22,656–113,281 | 11,328–22,656 | 95.34 | 87.84 | 91.63 |
| 3 | 1–22,656, 33,984–113,281 | 22,656–33,984 | 98.74 | 98.86 | 98.80 |
| 4 | 1–33,984, 45,312–113,281 | 33,984–45,312 | 99.39 | 99.39 | 99.39 |
| 5 | 1–45,312, 56,640–113,281 | 45,312–56,640 | 100.00 | 100.00 | 100.00 |
| 6 | 1–56,640, 67,968–113,281 | 56,640–67,968 | 98.76 | 99.95 | 99.35 |
| 7 | 1–67,968, 79,296–113,281 | 67,968–79,296 | 100.00 | 100.00 | 100.00 |
| 8 | 1–79,296, 90,624–113,281 | 79,296–90,624 | 98.47 | 100.00 | 99.21 |
| 9 | 1–90,624, 101,952–113,281 | 90,624–101,952 | 98.43 | 99.54 | 98.98 |
| 10 | 1–101,952 | 101,952–113,281 | 100.00 | 100.00 | 100.00 |
| Mean | - | - | 97.12 | 97.77 | 97.45 |
| Var * | 0.0030 | 0.0018 | 0.0019 |
Disclaimer/Publisher’s Note: The statements, opinions and data contained in all publications are solely those of the individual author(s) and contributor(s) and not of MDPI and/or the editor(s). MDPI and/or the editor(s) disclaim responsibility for any injury to people or property resulting from any ideas, methods, instructions or products referred to in the content. |
© 2024 by the authors. Licensee MDPI, Basel, Switzerland. This article is an open access article distributed under the terms and conditions of the Creative Commons Attribution (CC BY) license (https://creativecommons.org/licenses/by/4.0/).
Share and Cite
Chen, W.; Zheng, P.; Bu, Y.; Xu, Y.; Lai, D. Achieving Real-Time Prediction of Paroxysmal Atrial Fibrillation Onset by Convolutional Neural Network and Sliding Window on R-R Interval Sequences. Bioengineering 2024, 11, 903. https://doi.org/10.3390/bioengineering11090903
Chen W, Zheng P, Bu Y, Xu Y, Lai D. Achieving Real-Time Prediction of Paroxysmal Atrial Fibrillation Onset by Convolutional Neural Network and Sliding Window on R-R Interval Sequences. Bioengineering. 2024; 11(9):903. https://doi.org/10.3390/bioengineering11090903
Chicago/Turabian StyleChen, Wenjing, Peirong Zheng, Yuxiang Bu, Yuanning Xu, and Dakun Lai. 2024. "Achieving Real-Time Prediction of Paroxysmal Atrial Fibrillation Onset by Convolutional Neural Network and Sliding Window on R-R Interval Sequences" Bioengineering 11, no. 9: 903. https://doi.org/10.3390/bioengineering11090903
APA StyleChen, W., Zheng, P., Bu, Y., Xu, Y., & Lai, D. (2024). Achieving Real-Time Prediction of Paroxysmal Atrial Fibrillation Onset by Convolutional Neural Network and Sliding Window on R-R Interval Sequences. Bioengineering, 11(9), 903. https://doi.org/10.3390/bioengineering11090903