
Characterization of Normal and Degenerative Discovertebral Complexes Using Qualitative and Quantitative Magnetic Resonance Imaging at 4.7T: Longitudinal Evaluation of Immature and Mature Rats

 , ,
, ,
Abstract
:1. Introduction
2. Materials and Methods
2.1. Animal Model
2.2. Imaging
Imaging Protocol
- -
- 3D-UTE acquisition: TR/TE: 11.863/0.031 ms, FOV 17 × 17 × 17 mm, matrix: 128 × 128 × 128, spatial resolution = 0.133 mm isotropic, number of excitations: 3, projections = 51,360, bandwidth = 100 kHz, flip angle = 10.0°, hard excitation pulse of 0.05 ms, fat saturation module: pulse (bandwidth 701.19 Hz, duration 7.6 ms, angle 90°), total acquisition time 30 min 28 s.
- -
- 2D-T2 mapping using a sagittal oriented multi-slice multi-echo spin-echo (MSME) sequence: 100 images acquired at minimum TE (3.8 ms) to 378.6 ms, TR: 8000 ms, FOV 20 × 15 mm, matrix: 128 × 96, spatial resolution = 0.156 mm isotropic, 20 slices of 0.6 mm thickness, number of excitations: 1, bandwidth = 71.4 kHz, 90° 2 ms pulse followed by a 180° 1.8 ms pulse, total acquisition time 12 min 48 s.
- -
- 3D-T1 mapping with the MP2RAGE sequence: TI1/TI2/MP2RAGETR = 800 ms/2200 ms/6250 ms; FOV = 22.5 × 22.5 ×11.25 mm; matrix = 128 × 128 × 64; spatial resolution: 0.176 × 0.176 × 0.176mm; hyperbolic secant inversion pulse (10 ms); flip angles = 7°/7° (0.6 ms sinc10H excitation pulses); 160 echoes per GRE readout; TR/TE = 6/2.16 ms; rBW = 50 kHz; number of excitations: 4; scan time: 21 min 15 s [24,25].
2.3. Image and Parametric Map Reconstruction
2.4. Image Analysis
2.5. DVC Pathology
2.6. Statistical Analysis
3. Results
3.1. Image Analysis
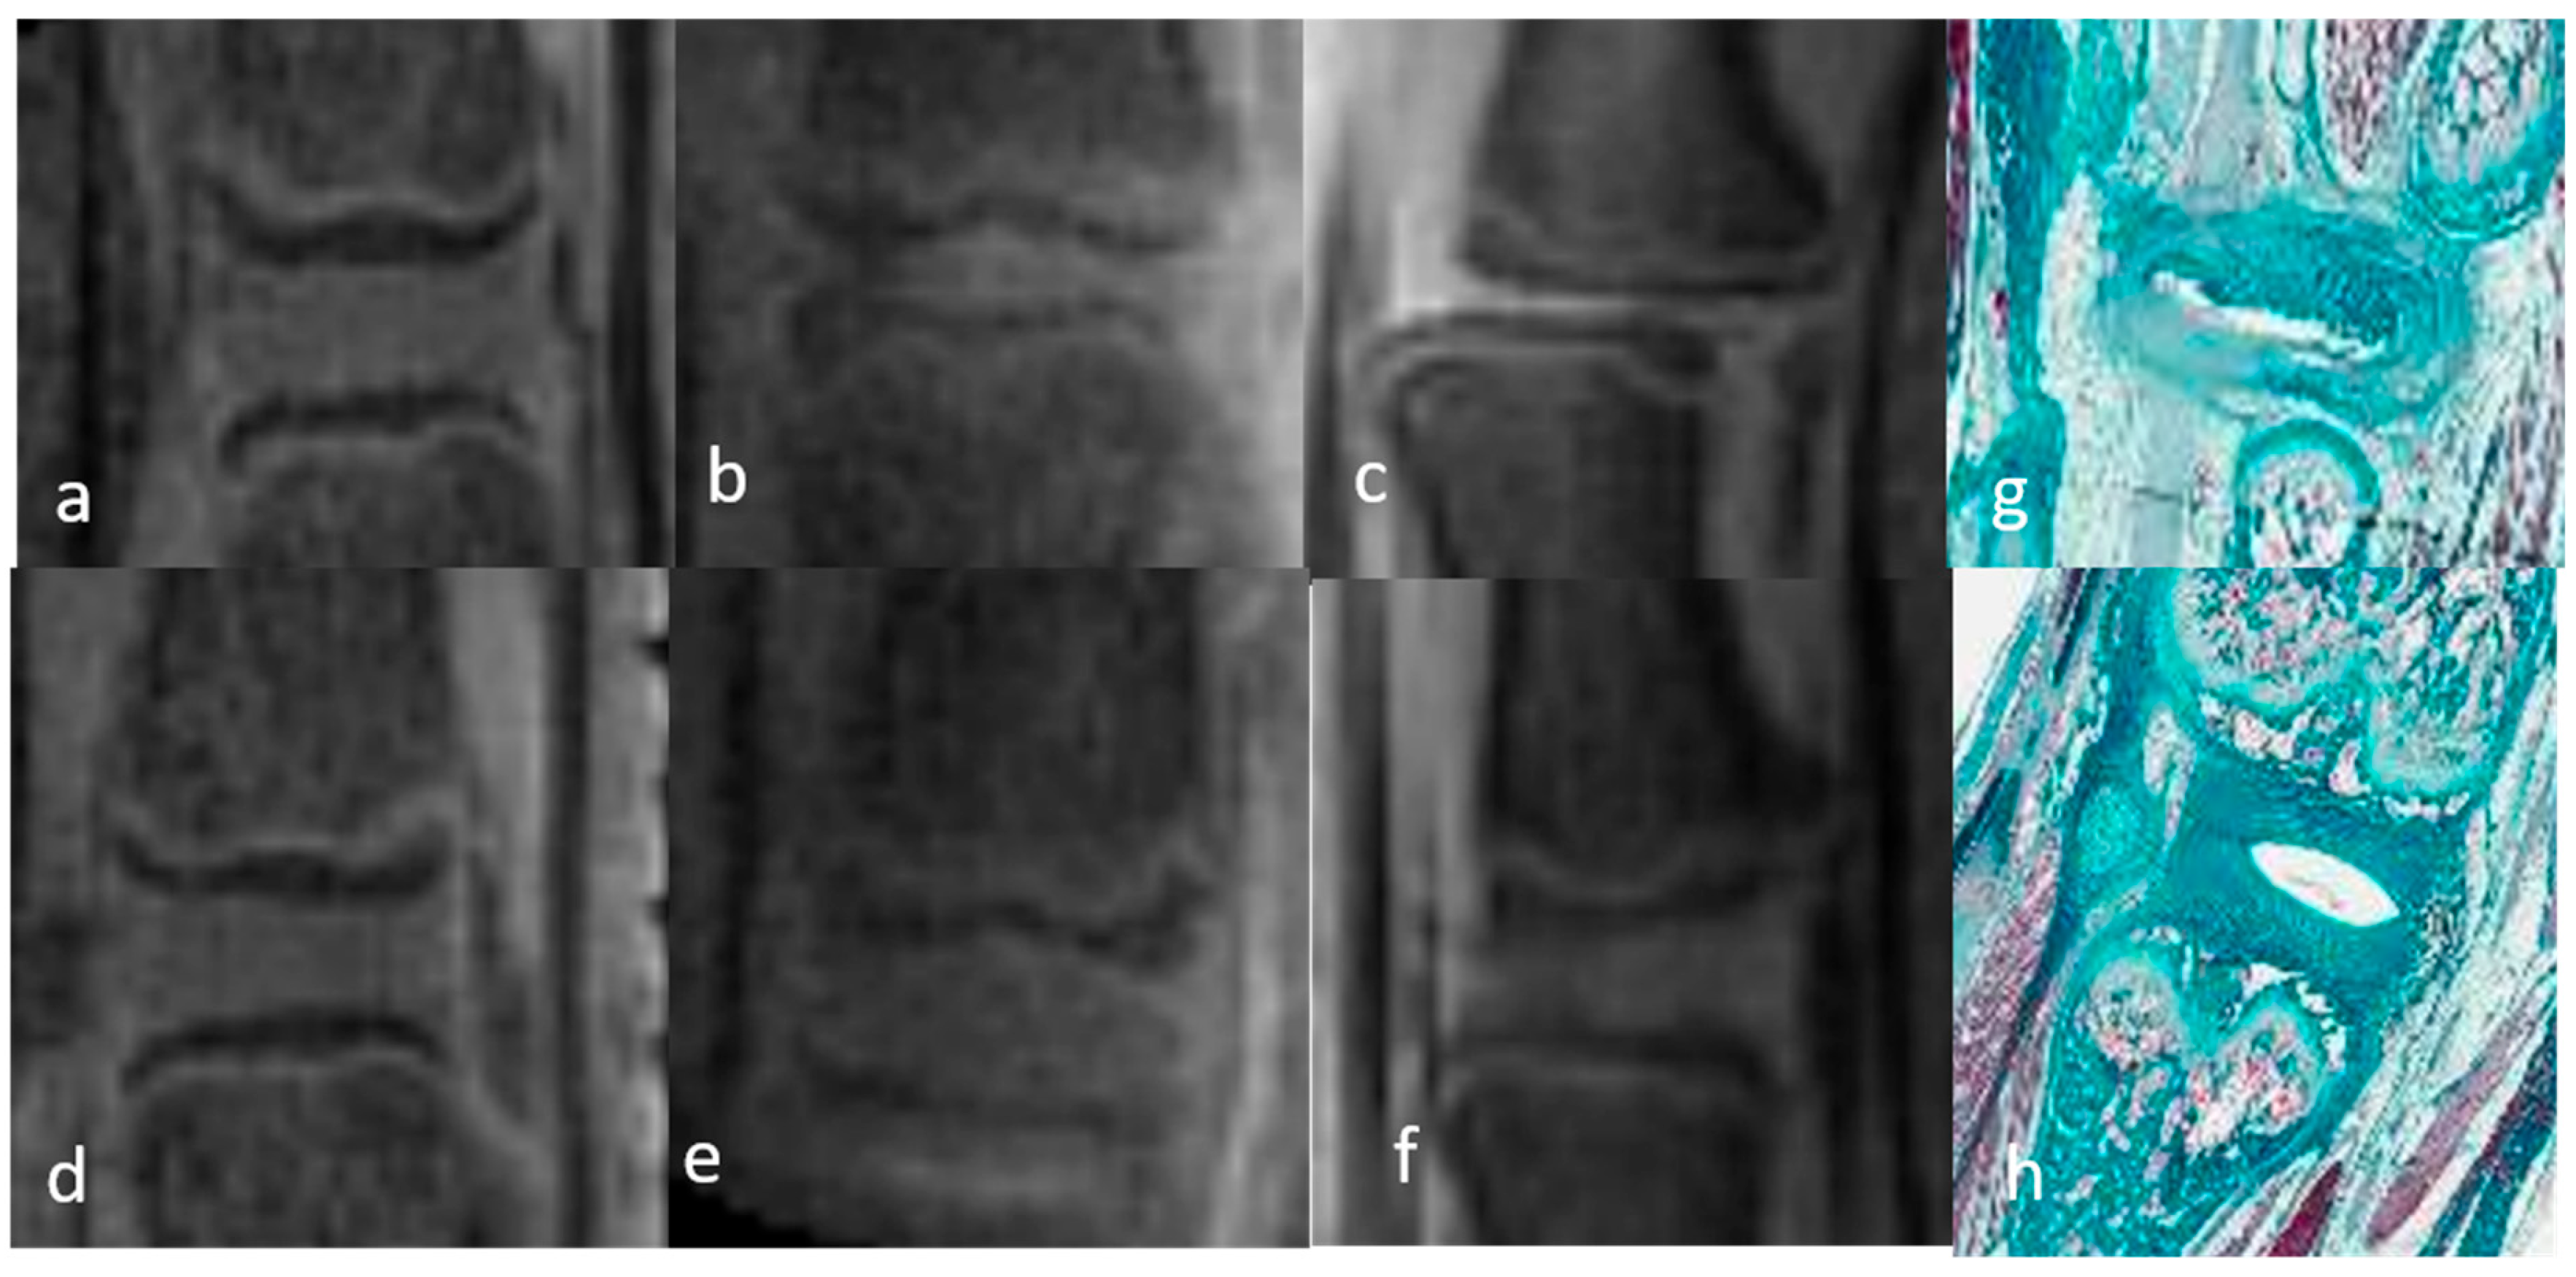
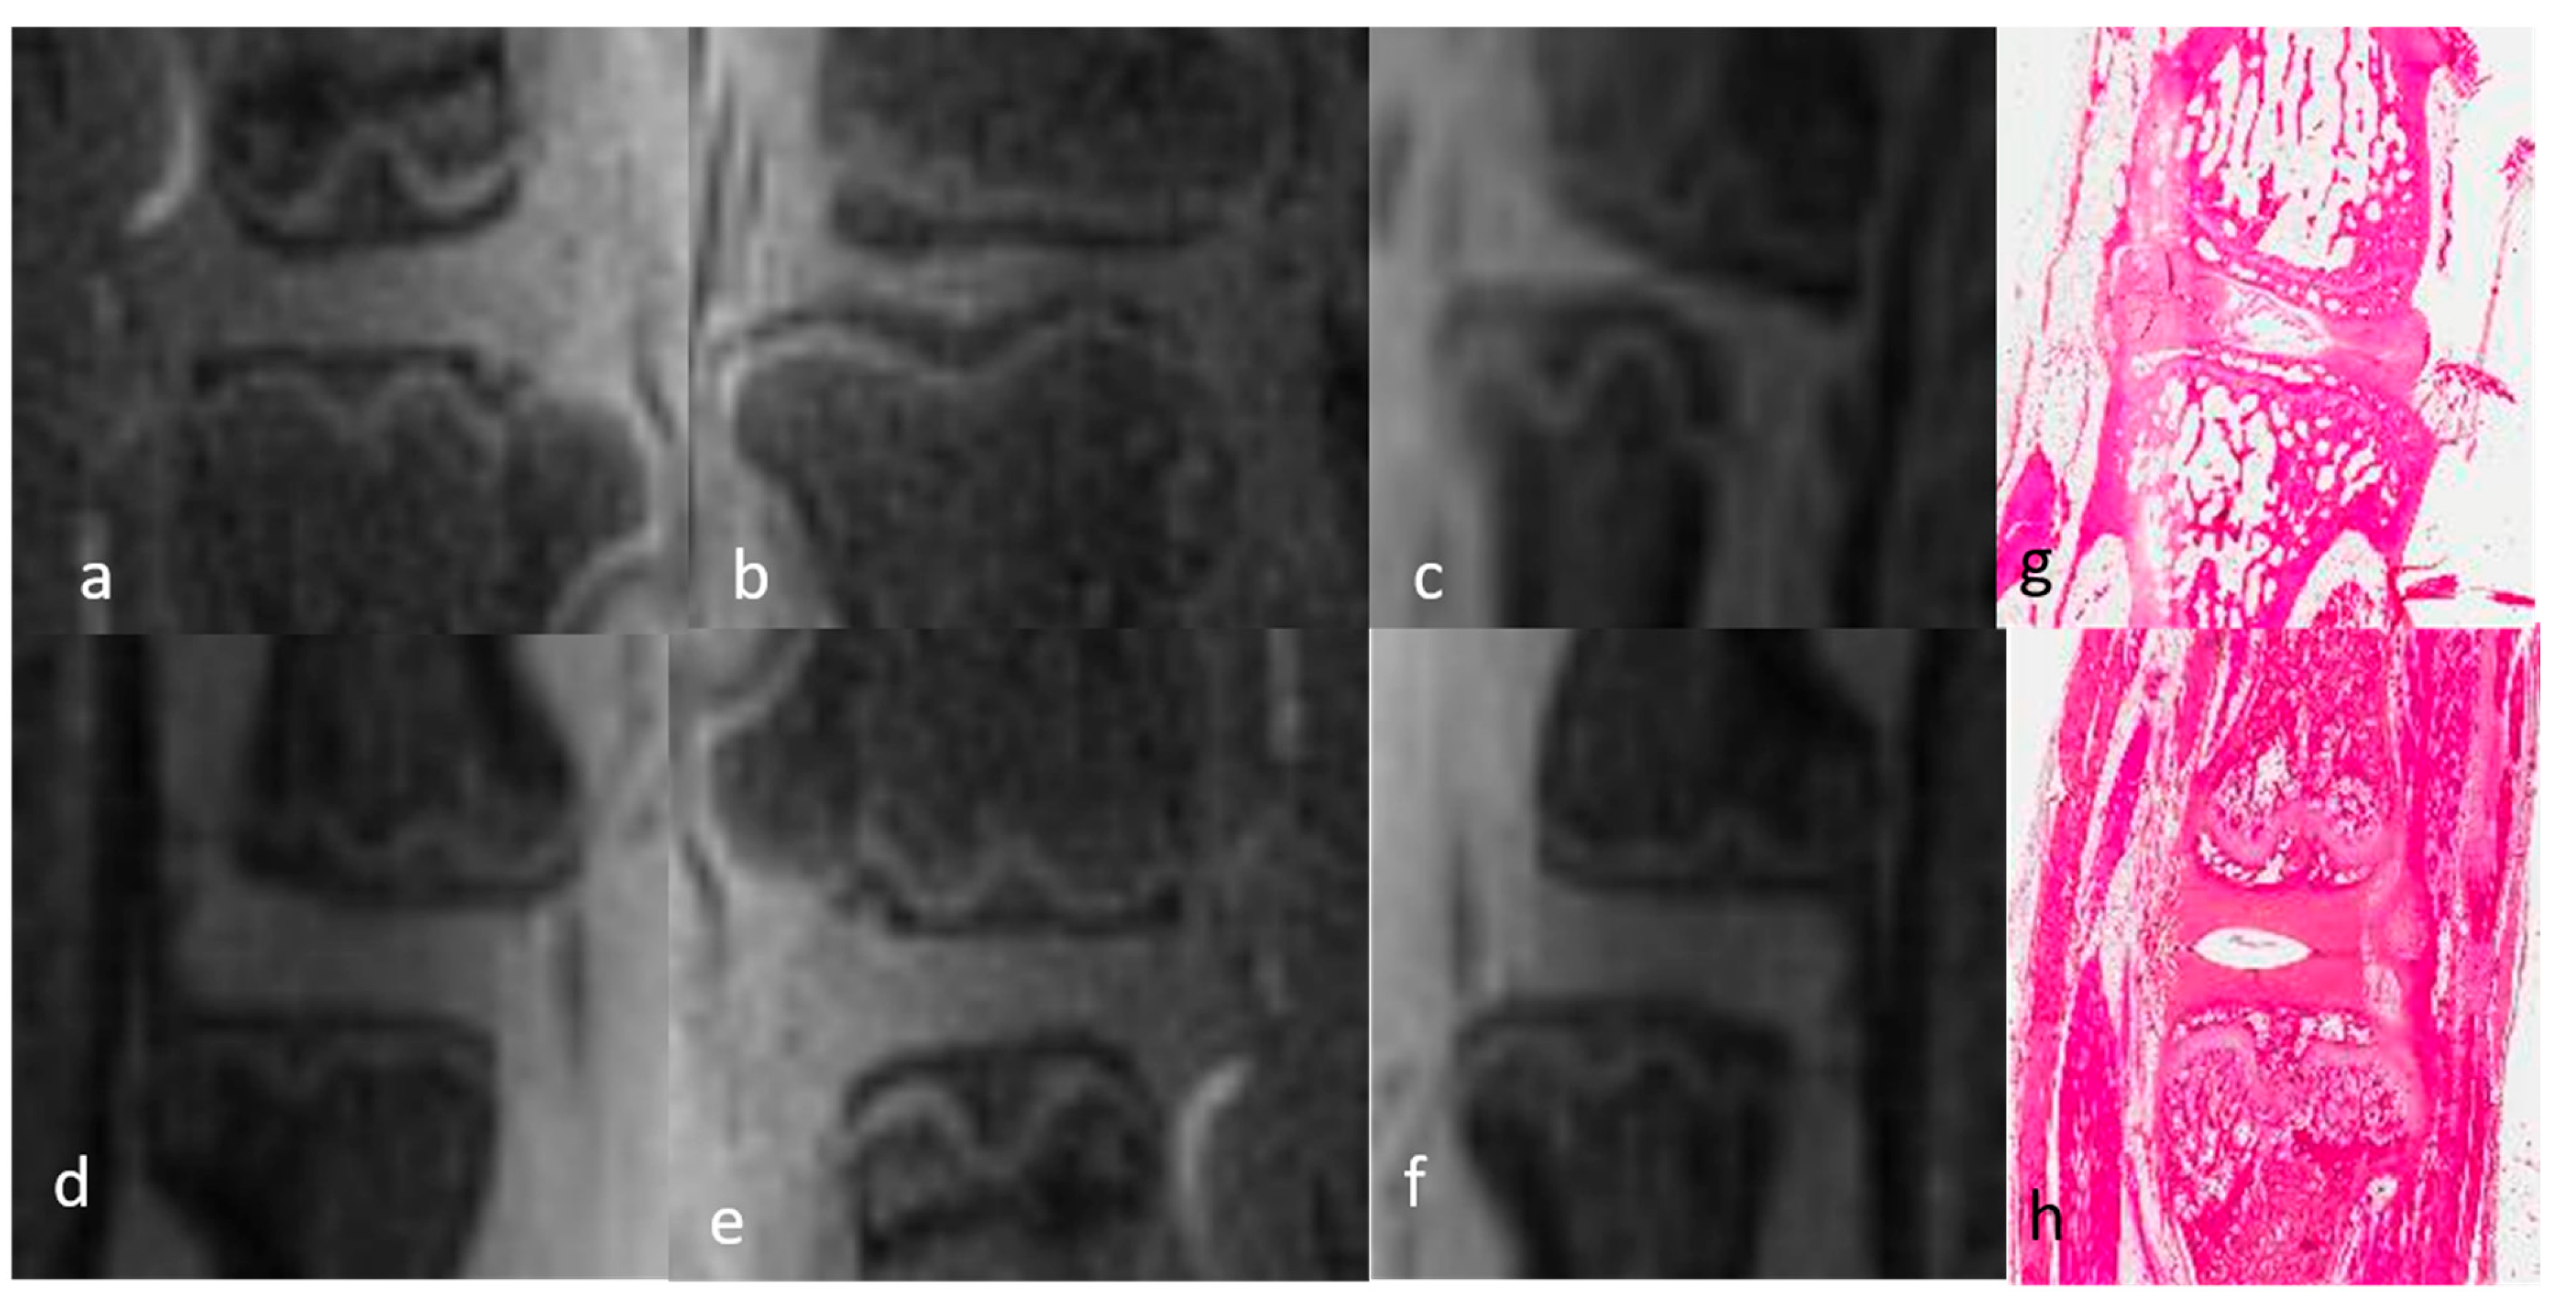
3.1.1. Qualitative Analysis of the Normal DVC (Table 1 and Table 2)

| Normal DVC | 3D UTE | |
|---|---|---|
| Mature | Immature | |
| NP | +++ | +++ |
| AF | +++ | +++ |
| CEP | +++ | +++ |
| GP | +++ | +++ |
| SB | ++ | ++ |
| 3D UTE Images | DO IR | DO MR |
|---|---|---|
| NP | Uniformly hyposignal | Uniformly hyposignal |
| AF | Uniformly hypersignal | Uniformly hypersignal |
| CEP | Uniformly thick asignal | Uniformly thin signal |
| GP | Uniformly thick hypersignal | Uniformly thin hypersignal |
| SB | Uniformly hyposignal | Uniformly hyposignal |
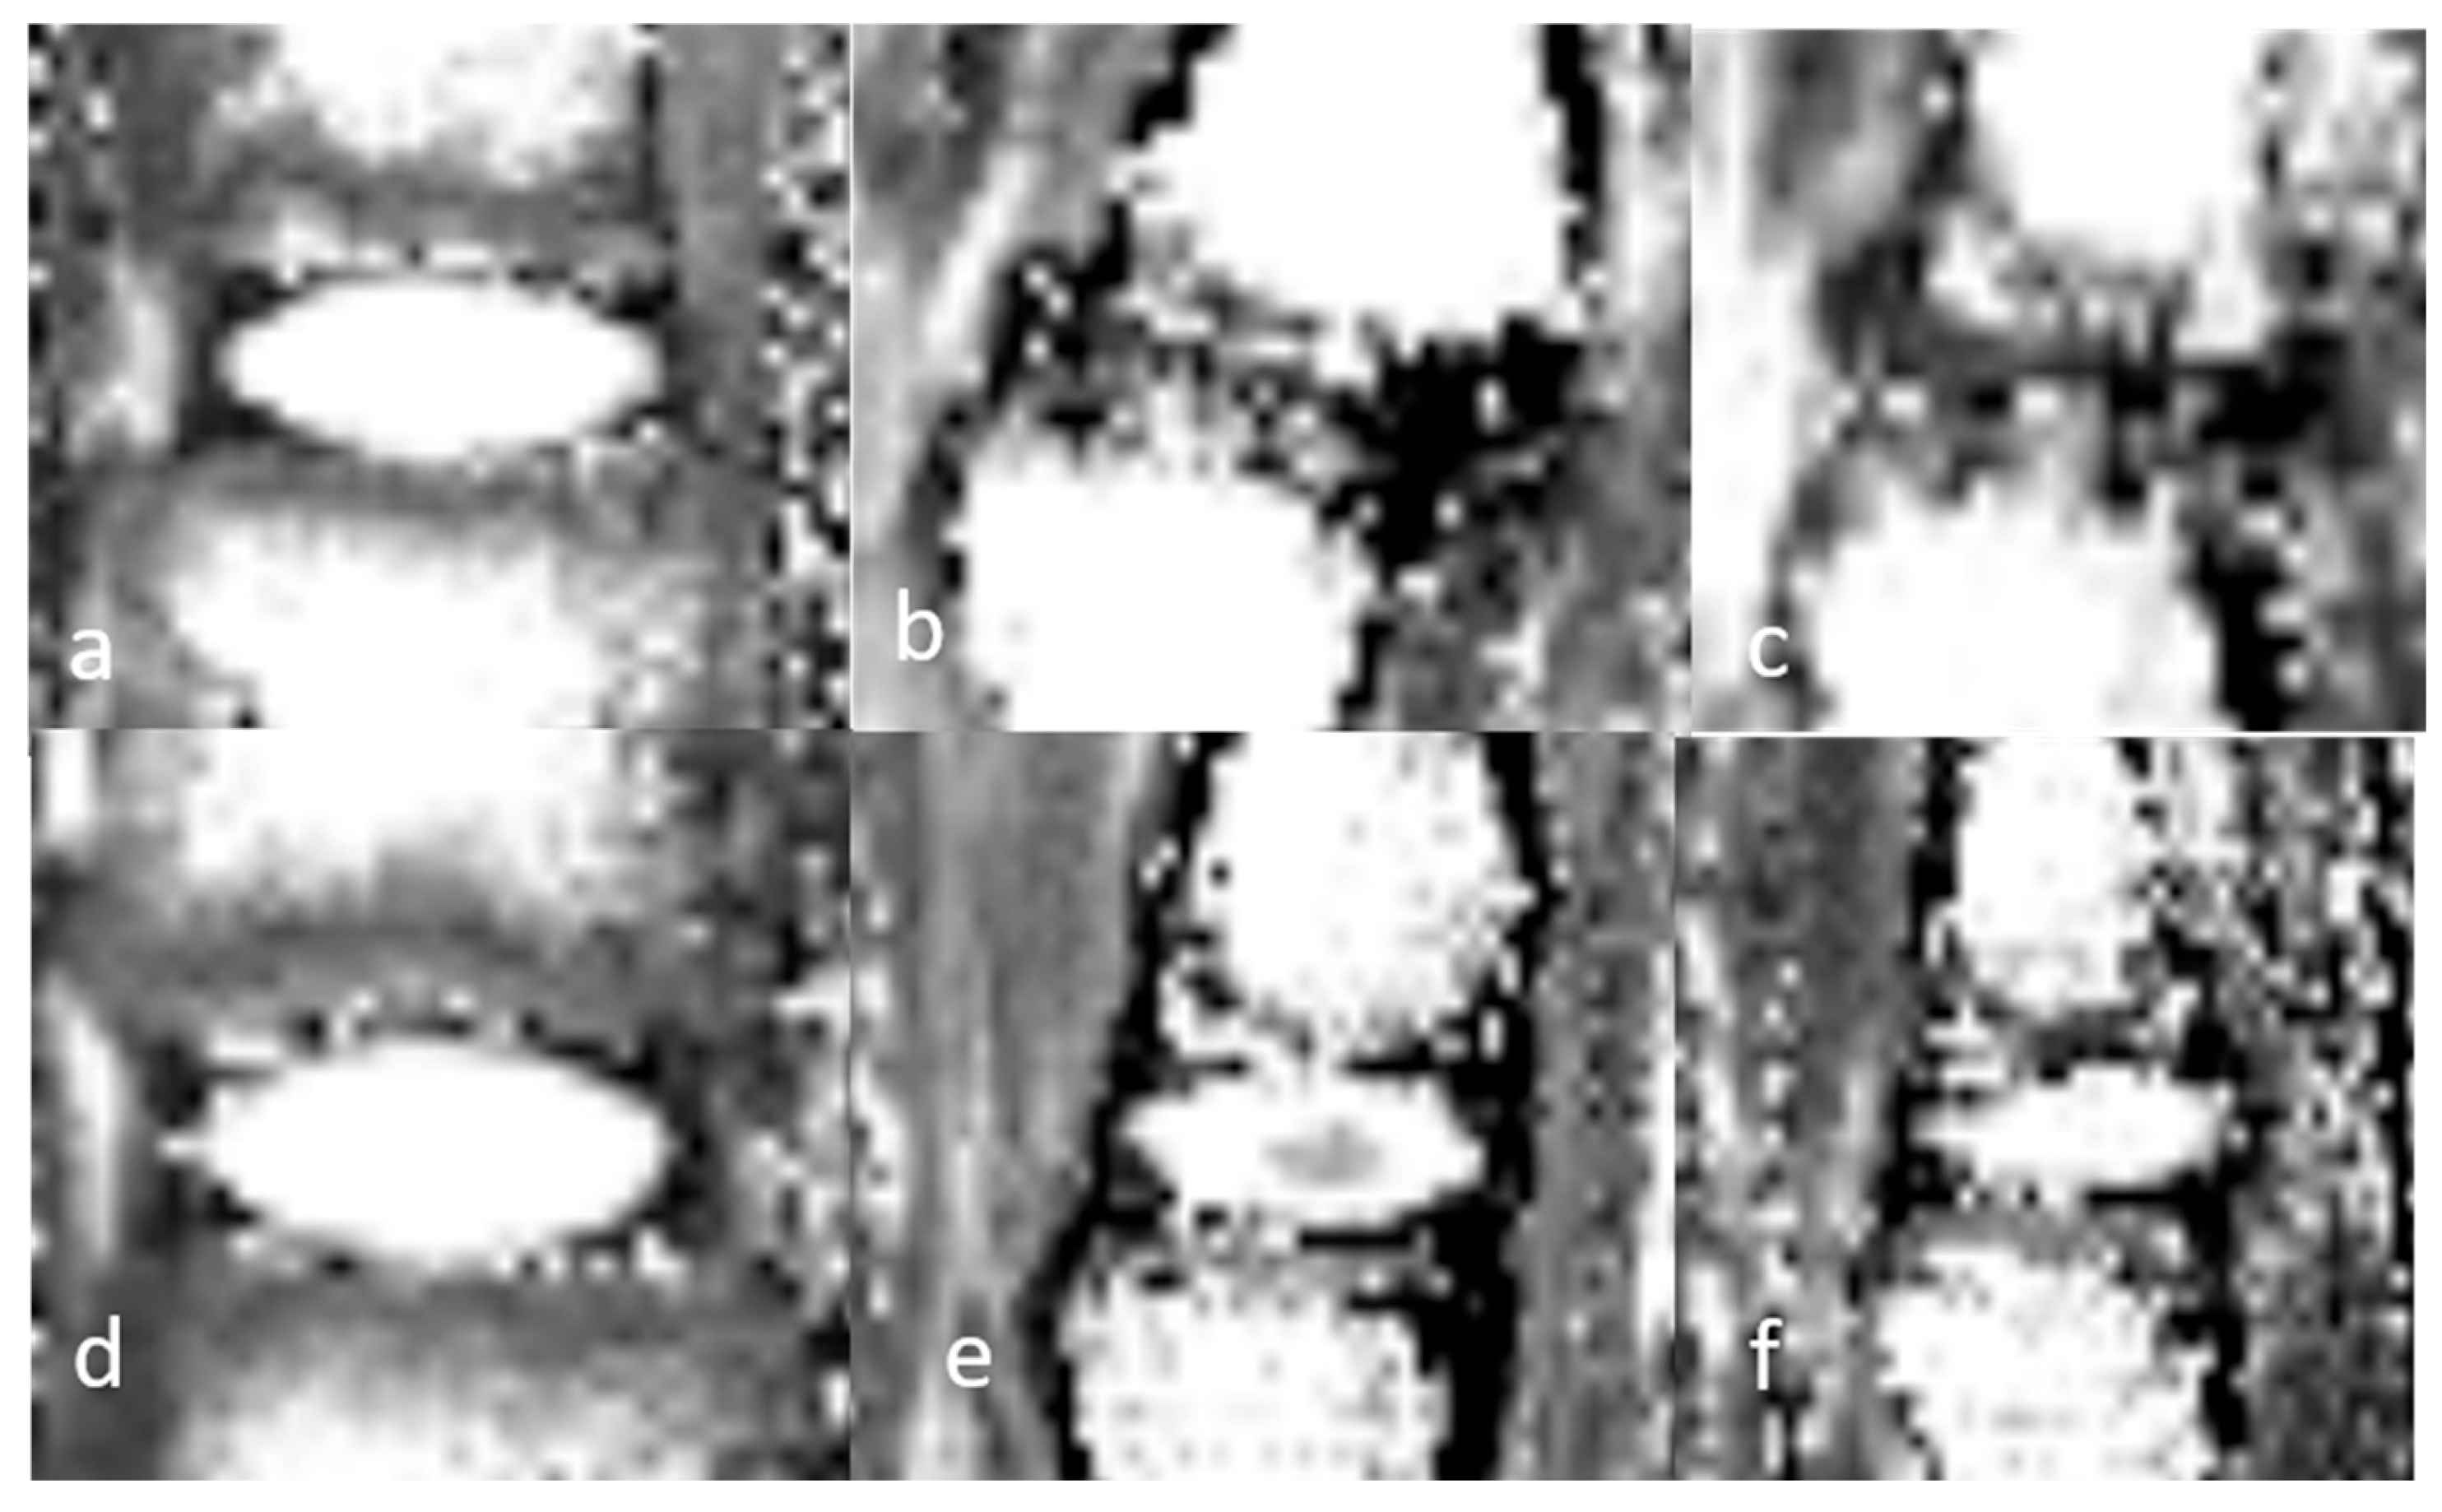
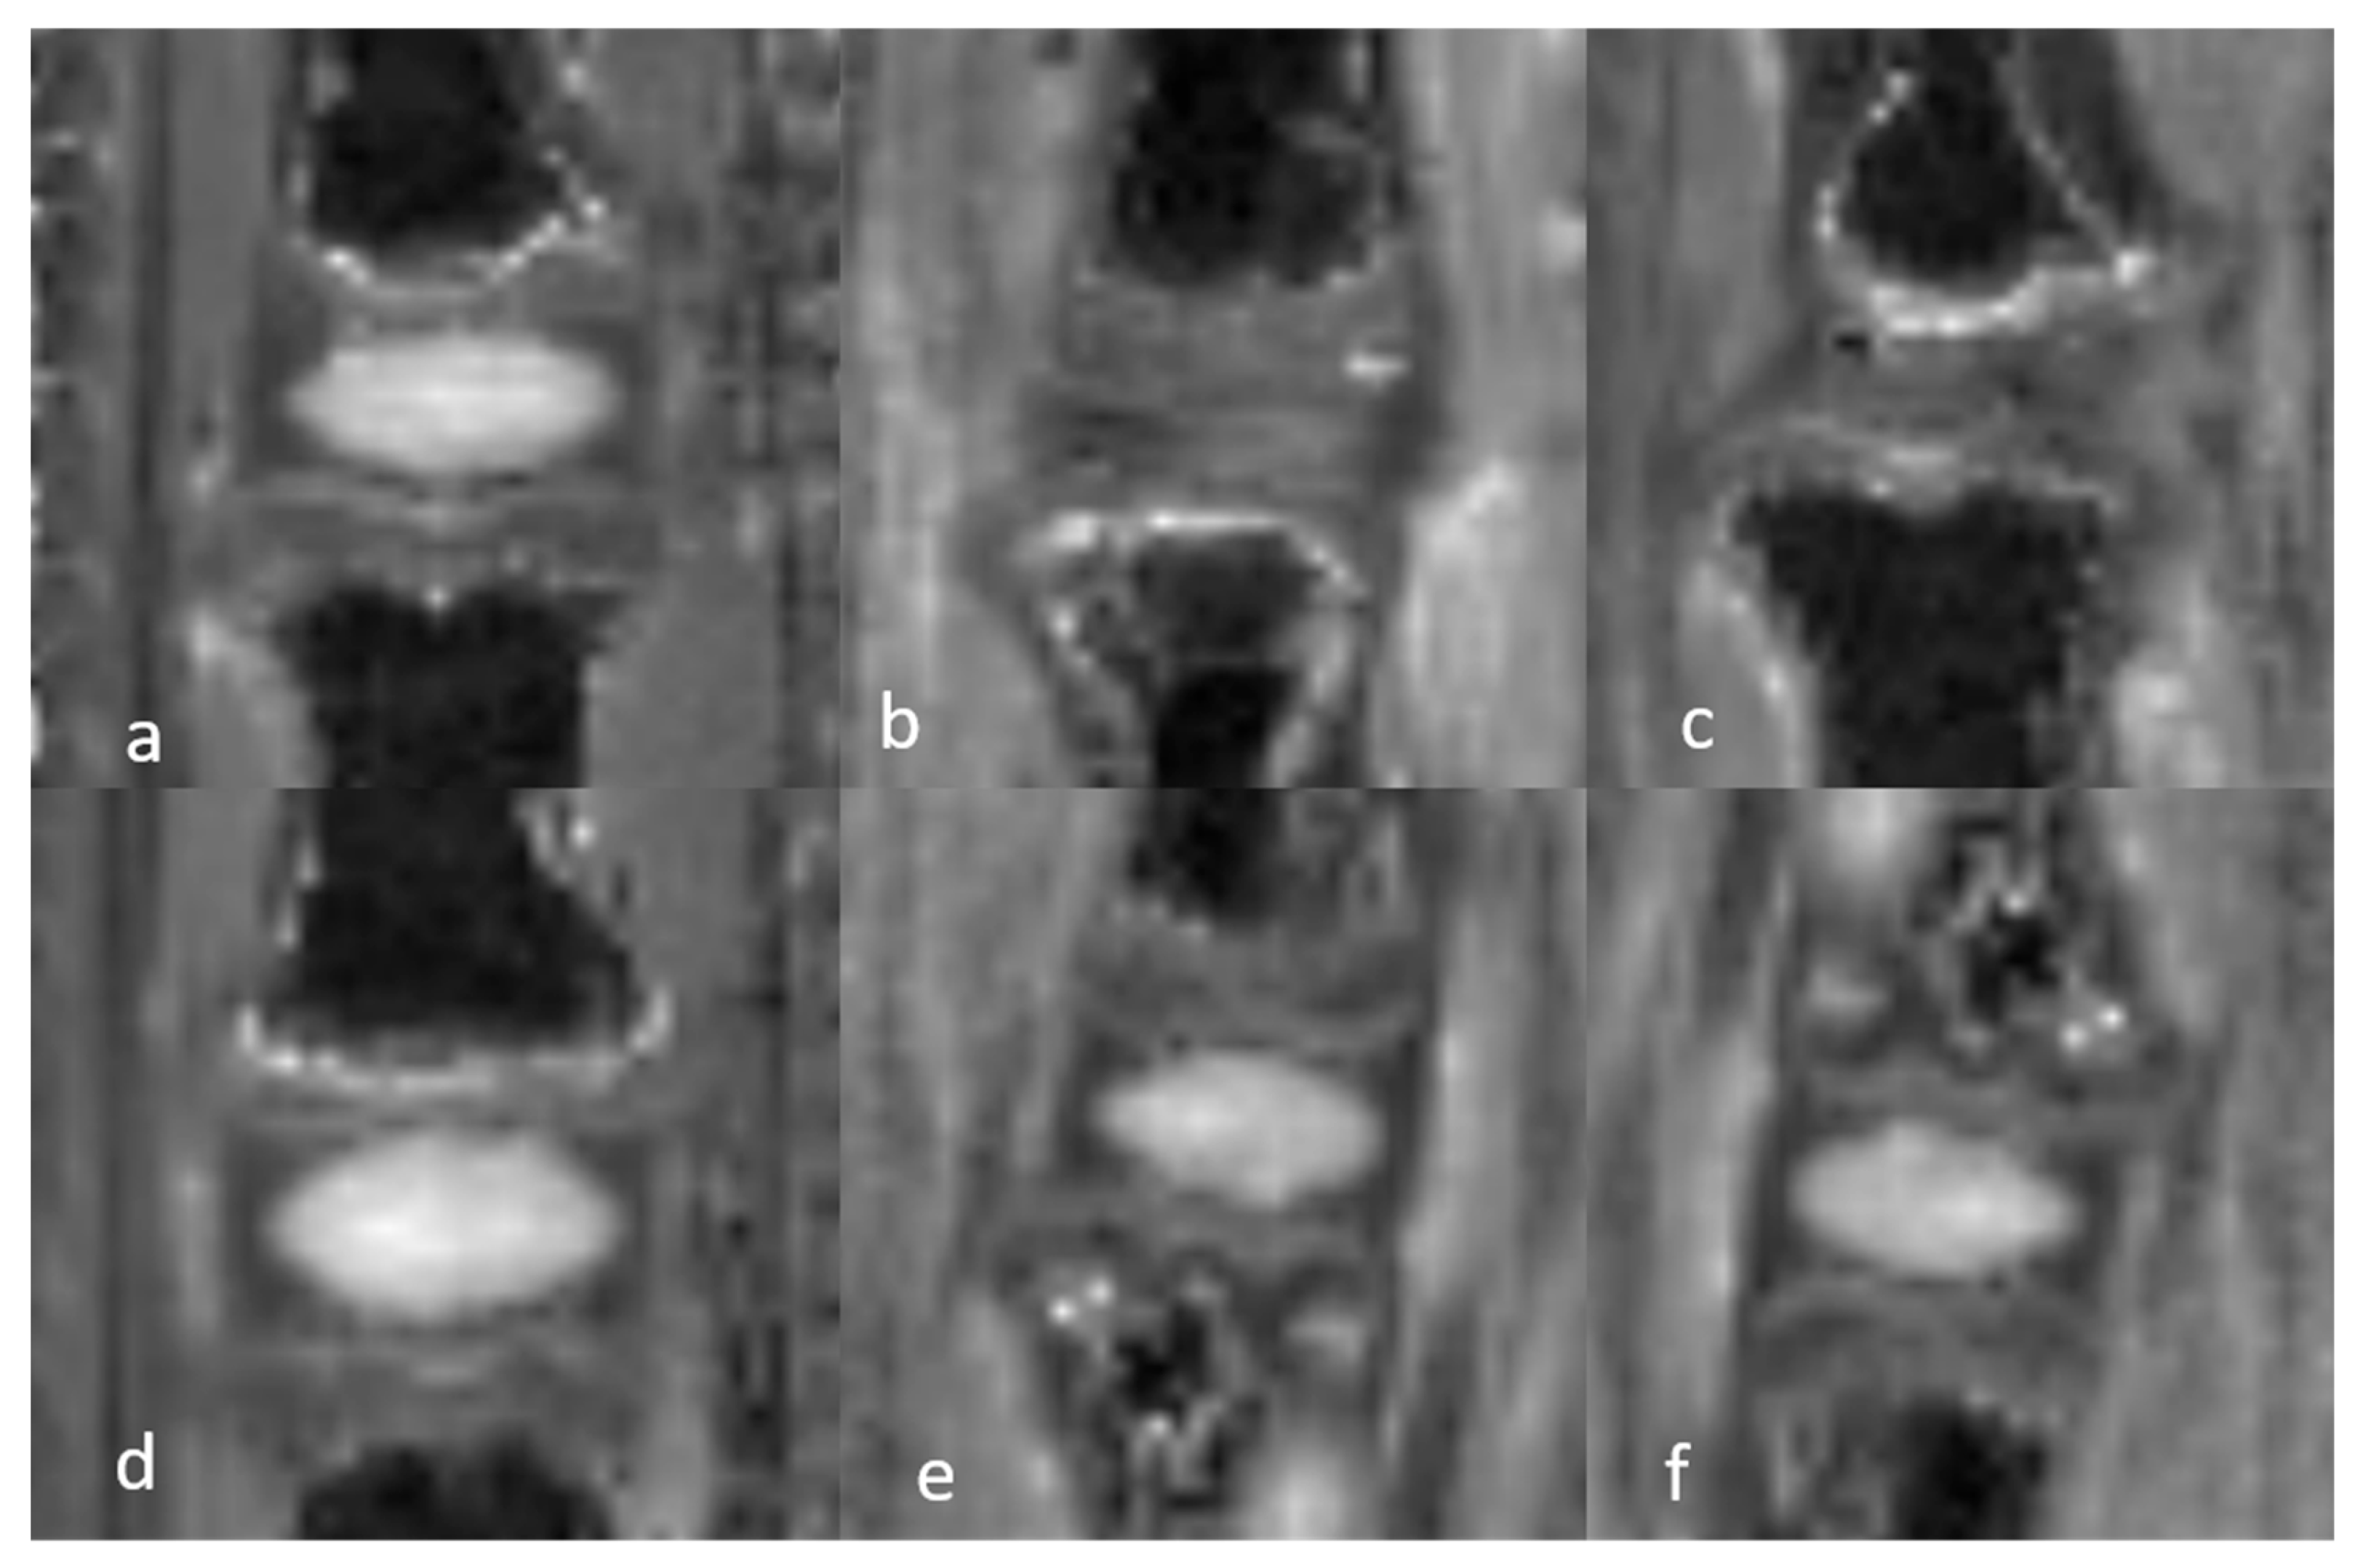
3.1.2. Qualitative Analysis of the DVC in DDD Rats (Table 3)
| DO IR | DO MR | W1 IR | W1 MR | W2 IR | W2 MR | ||
|---|---|---|---|---|---|---|---|
| 3D UTE | NP | Uniformly isosignal | Uniformly isosignal | Heterogeneity hypersignal | Heterogeneity hypersignal | Heterogeneity hypersignal | Heterogeneity hypersignal |
| AF | Uniformly hypersignal | Uniformly hypersignal | Heterogeneity hypersignal | Heterogeneity hypersignal | Heterogeneity hypersignal | Heterogeneity hypersignal |
3.1.3. Quantitative Analysis of the Normal DVC (Table 4)
| 3D UTE SNR | 3D UTE SNR | 3D UTE CNR | T2 (ms) | T2 (ms) | T1 (ms) | T1 (ms) | ||||||||
|---|---|---|---|---|---|---|---|---|---|---|---|---|---|---|
| AF | NP | AF vs. NP | AF | NP | AF | NP | ||||||||
| MR | IR | MR | IR | MR | IR | MR | IR | MR | IR | MR | IR | MR | IR | |
| DO | 16.8 ± 6 | 19.8 ± 4.3 | 11.5 ± 3 | 14.5 ± 3.5 | 5.3 ± 2.4 | 5.3 ± 2.5 | 6 ± 2.7 | 5.8 ± 2.2 | 104.9 ± 12.2 | 119 ± 15.1 | 803 ± 100 | 835 ± 96 | 1810 ± 242 | 1894 ± 187 |
| W1h | 25.7 ± 13.1 | 19.6 ± 4.3 | 20.5 ± 9.4 | 12.1 ± 2.7 | 5.2 ± 2.4 | 7.5 ± 4.4 | 3.6 ± 2.4 | 6.1 ± 2.6 | 107.6 ± 19.8 | 115.9 ± 26.1 | 804 ± 72 | 878 ± 102 | 1962 ± 149 | 2086 ± 294 |
| W1p | 45.6 ± 21.8 | 27.7 ± 6.1 | 35.7 ± 15.9 | 18 ± 1.8 | 9 ± 4.2 | 9.6 ± 4.6 | 20.7 ± 6.4 | 20.1 ± 5.2 | 51.8 ± 18 | 50.1 ± 7.5 | 797 ± 489 | 804 ± 219 | 1712 ± 136 | 1608 ± 257 |
| W2h | 37.9 ± 20 | 19.3 ± 4.7 | 30.7 ± 4.4 | 15.7 ± 3.9 | 7.2 ± 7.2 | 3.7 ± 4.4 | 4.3 ± 2.2 | 5.5 ± 2.7 | 102.8 ± 12.5 | 127.6 ± 21.5 | 837 ± 58 | 808 ± 62 | 2039 ± 55 | 1941 ± 72 |
| W2p | 57.1 ± 28.5 | 28.1 ± 8.2 | 52.7 ± 13.9 | 22 ± 4 | 4.3 ± 0.1 | 6.1 ± 4.7 | 14.7 ± 2.7 | 18.6 ± 6.3 | 48.5 ± 10 | 45.4 ± 16.5 | 827 ± 77 | 712 ± 164 | 1558 ± 122 | 1268 ± 278 |
3.1.4. Quantitative Analysis of the DVC in DDD Rats (Table 4)
3.1.5. Semiquantitative and Quantitative Values of the Healthy DVC (Table 5)
| 3D UTE SNR | 3D UTE SNR | 3D UTE SNR | T2 (ms) | T2 (ms) | T2 (ms) | T1 (ms) | T1 (ms) | T1 (ms) | ||||||||||
|---|---|---|---|---|---|---|---|---|---|---|---|---|---|---|---|---|---|---|
| CEP | GP | SB | CEP | GP | SB | CEP | GP | SB | ||||||||||
| MR | IR | MR | IR | MR | IR | MR | IR | MR | IR | MR | IR | MR | IR | MR | IR | MR | IR | |
| DO | 7.9 ± 0.9 | 10.6 ± 2.3 | 18.5 ± 2.6 | 23.5 ± 3.7 | 17.1 ± 27 | 12.9 ± 2.7 | 28.2 ± 5.6 | 25.7 ± 5 | XX | XX | 96.1 ± 17.4 | 84.8 ± 14.2 | XX | XX | XX | XX | 568 ± 49 | 574 ± 79 |
| W1h | 13 ± 6.3 | 10.9 ± 1.8 | 33.5 ± 18.1 | 20.2 ± 3.1 | 19.5 ± 11.6 | 10.4 ± 2.2 | 39.1 ± 9.6 | 29.9 ± 6.9 | XX | XX | 90.6 ± 11.4 | 87 ± 10.8 | XX | XX | XX | XX | 613 ± 93 | 578 ± 46 |
| W2h | 18.2 ± 5.6 | 11.5 ± 2.2 | 42.7 ± 7.6 | 24 ± 5.1 | 25.7 ± 7.1 | 12 ± 3 | 38.3 ± 4.9 | 28 ± 3.5 | XX | XX | 90.8 ± 13.1 | 85.3 ± 5.9 | XX | XX | XX | XX | 590 ± 28 | 579 ± 46 |
| W1p | 15.8 ± 5.7 | 10.8 ± 1.6 | 36.2 ± 12.6 | 19.4 ± 1.2 | 21.6 ± 9 | 12 ± 1.1 | 33 ± 10 | 27.1 ± 5.6 | XX | XX | 84.1 ± 6.9 | 89.4 ± 20.6 | XX | XX | XX | XX | 613 ± 74 | 579 ± 100 |
| W2p | 15.7 ± 6.5 | 11.4 ± 1.7 | 47.6 ± 6.1 | 23.9 ± 7.5 | 27.1 ± 6.7 | 13 ± 2.7 | 31 ± 6.5 | 32.5 ± 12.5 | XX | XX | 78.3 ± 18.9 | 86.3 ± 21.5 | XX | XX | XX | XX | 607 ± 42 | 555 ± 62 |
3.2. Interobserver Agreement
3.3. Histological Evaluation
4. Discussion
Author Contributions
Funding
Institutional Review Board Statement
Informed Consent Statement
Data Availability Statement
Conflicts of Interest
References
- Pfirrmann, C.W.; Metzdorf, A.; Zanetti, M.; Hodler, J.; Boos, N. Magnetic resonance classification of lumbar intervertebral disc degeneration. Spine 2001, 26, 1873–1878. [Google Scholar] [CrossRef] [PubMed]
- Moon, S.M.; Yoder, J.H.; Wright, A.C.; Smith, L.J.; Vresilovic, E.J.; Elliott, D.M. Evaluation of intervertebral disc cartilaginous endplate structure using magnetic resonance imaging. Eur. Spine J. 2013, 22, 1820–1828. [Google Scholar] [CrossRef] [PubMed]
- Cao, Y.; Liao, S.; Zeng, H.; Ni, S.; Tintani, F.; Hao, Y.; Wang, L.; Wu, T.; Lu, H.; Duan, C.; et al. 3D characterization of morphological changes in the intervertebral disc and endplate during aging: A propagation phase contrast synchrotron micro-tomography study. Sci. Rep. 2017, 7, 43094. [Google Scholar] [CrossRef] [PubMed]
- Gruber, H.E.; Ashraf, N.; Kilburn, J.; Williams, C.; Norton, H.J.; Gordon, B.E.; Hanley, E.N., Jr. Vertebral endplate architecture and vascularization: Application of micro-computerized tomography, a vascular tracer, and immunocytochemistry in analyses of disc degeneration in the aging sand rat. Spine 2005, 30, 2593–2600. [Google Scholar] [CrossRef]
- Henkelman, R.M.; Stanisz, G.J.; Graham, S.J. Magnetization transfer in MRI: A review. NMR Biomed. 2001, 14, 57–64. [Google Scholar] [CrossRef]
- Stelzeneder, D.; Welsch, G.H.; Kovács, B.K.; Goed, S.; Paternostro-Sluga, T.; Vlychou, M.; Friedrich, K.; Mamisch, T.C.; Trattnig, S. Quantitative T2 evaluation at 3.0T compared to morphological grading of the lumbar intervertebral disc: A standardized evaluation approach in patients with low back pain. Eur. J. Radiol. 2012, 81, 324–330. [Google Scholar] [CrossRef]
- Roberts, N.; Hogg, D.; Whitehouse, G.H.; Dangerfield, P. Quantitative analysis of diurnal variation in volume and water content of lumbar intervertebral discs. Clin. Anat. 1998, 11, 1–8. [Google Scholar] [CrossRef]
- Keshari, K.R.; Lotz, J.C.; Kurhanewicz, J.; Majumdar, S. Correlation of HR-MAS spectroscopy derived metabolite concentrations with collagen and proteoglycan levels and Thompson grade in the degenerative disc. Spine 2005, 30, 2683–2688. [Google Scholar] [CrossRef]
- Du, J.; Bydder, M.; Takahashi, A.M.; Chung, C.B. Two-dimensional ultrashort echo time imaging using a spiral trajectory. Magn. Reson. Imaging 2008, 26, 304–312. [Google Scholar] [CrossRef]
- Chen, K.C.; Tran, B.; Biswas, R.; Statum, S.; Masuda, K.; Chung, C.B.; Bae, W.C. Evaluation of the disco-vertebral junction using ultrashort time-to-echo magnetic resonance imaging: Inter-reader agreement and association with vertebral endplate lesions. Skeletal. Radiol. 2016, 45, 1249–1256. [Google Scholar] [CrossRef]
- Zhang, Z.; Chan, Q.; Anthony, M.P.; Samartzis, D.; Cheung, K.M.; Khong, P.L.; Kim, M. Age-related diffusion patterns in human lumbar intervertebral discs: A pilot study in asymptomatic subjects. Magn. Reson. Imaging 2012, 30, 181–188. [Google Scholar] [CrossRef] [PubMed]
- Niu, G.; Yang, J.; Wang, R.; Dang, S.; Wu, E.X.; Guo, Y. MR imaging assessment of lumbar intervertebral disk degeneration and age-related changes: Apparent diffusion coefficient versus T2 quantitation. AJNR Am. J. Neuroradiol. 2011, 32, 1617–1623. [Google Scholar] [CrossRef] [PubMed]
- Noebauer-Huhmann, I.M.; Juras, V.; Pfirrmann, C.W.; Szomolanyi, P.; Zbyn, S.; Messner, A.; Wimmer, J.; Weber, M.; Friedrich, K.M.; Stelzeneder, D.; et al. Sodium MR imaging of the lumbar intervertebral disk at 7 T: Correlation with T2 mapping and modified Pfirrmann score at 3 T—Preliminary results. Radiology 2012, 265, 555–564. [Google Scholar] [CrossRef] [PubMed]
- Iriondo, C.; Pedoia, V.; Majumdar, S. Lumbar intervertebral disc characterization through quantitative MRI analysis: An automatic voxel-based relaxometry approach. Magn. Reson. Med. 2020, 84, 1376–1390. [Google Scholar] [CrossRef]
- Michopoulou, S.K.; Costaridou, L.; Panagiotopoulos, E.; Speller, R.; Panayiotakis, G.; Todd-Pokropek, A. Atlas-based segmentation of degenerated lumbar intervertebral discs from MR images of the spine. IEEE Trans. Biomed Eng. 2009, 56, 2225–2231. [Google Scholar] [CrossRef]
- Clouet, J.; Pot-Vaucel, M.; Grimandi, G.; Masson, M.; Lesoeur, J.; Fellah, B.H.; Gauthier, O.; Fusellier, M.; Cherel, Y.; Maugars, Y.; et al. Characterization of the age-dependent intervertebral disc changes in rabbit by correlation between MRI, histology and gene expression. BMC Musculoskelet. Disord. 2011, 12, 147. [Google Scholar] [CrossRef]
- Sowa, G.; Vadalà, G.; Studer, R.; Kompel, J.; Iucu, C.; Georgescu, H.; Gilbertson, L.; Kang, J. Characterization of intervertebral disc aging: Longitudinal analysis of a rabbit model by magnetic resonance imaging, histology, and gene expression. Spine 2008, 33, 1821–1828. [Google Scholar] [CrossRef]
- Antoniou, J.; Demers, C.N.; Beaudoin, G.; Goswami, T.; Mwale, F.; Aebi, M.; Alini, M. Apparent diffusion coefficient of intervertebral discs related to matrix composition and integrity. Magn. Reson. Imaging 2004, 22, 963–972. [Google Scholar] [CrossRef]
- Dallaudière, B.; Ribot, E.J.; Trotier, A.J.; Loubrie, S.; Dallet, L.; Thibaudeau, O.; Miraux, S.; Hauger, O. Three-dimensional ultrashort echo time (3D UTE) magnetic resonance imaging (MRI) of the normal and degenerative disco-vertebral complex at 4.7 T: A feasibility study with longitudinal evaluation. Eur. Spine J. 2021, 30, 1144–1154. [Google Scholar] [CrossRef]
- Hirata, H.; Yurube, T.; Kakutani, K.; Maeno, K.; Takada, T.; Yamamoto, J.; Kurakawa, T.; Akisue, T.; Kuroda, R.; Kurosaka, M.; et al. A rat tail temporary static compression model reproduces different stages of intervertebral disc degeneration with decreased notochordal cell phenotype. J. Orthop. Res. 2014, 32, 455–463. [Google Scholar] [CrossRef]
- Fernández-Susavila, H.; Pardo-Seco, J.P.; Iglesias-Rey, R.; Sobrino, T.; Campos, F.; Díez-Ulloa, M.A. Model of Disc Degeneration in Rat Tail Induced Through a Vascular Isolation of Vertebral Endplates. J. Investig. Surg. 2018, 31, 265–274. [Google Scholar] [CrossRef] [PubMed]
- Georgy, M.; Stern, M.; Murphy, K. What Is the Role of the Bacterium Propionibacterium acnes in Type 1 Modic Changes? A review of the literature. Can. Assoc. Radiol. J. 2017, 68, 419–424. [Google Scholar] [CrossRef] [PubMed]
- Dallaudière, B.; Lempicki, M.; Pesquer, L.; Louedec, L.; Preux, P.M.; Meyer, P.; Hummel, V.; Larbi, A.; Deschamps, L.; Journe, C.; et al. Efficacy of intra-tendinous injection of platelet-rich plasma in treating tendinosis: Comprehensive assessment of a rat model. Eur. Radiol. 2013, 23, 2830–2837. [Google Scholar] [CrossRef] [PubMed]
- Miraux, S.; Massot, P.; Ribot, E.J.; Franconi, J.M.; Thiaudiere, E. 3D True FISP imaging of mouse brain at 4.7T and 9.4T. J. Magn. Reson. Imaging. 2008, 28, 497–503. [Google Scholar] [CrossRef]
- Trotier, A.J.; Rapacchi, S.; Faller, T.L.; Miraux, S.; Ribot, E.J. Compressed-Sensing MP2RAGE sequence: Application to the detection of brain metastases in mice at 7T. Magn. Reson. Med. 2019, 81, 551–559. [Google Scholar] [CrossRef]
- Marques, J.P.; Kober, T.; Krueger, G.; van der Zwaag, W.; Van de Moortele, P.F.; Gruetter, R. MP2RAGE, a self bias-field corrected sequence for improved segmentation and T1-mapping at high field. Neuroimage 2010, 49, 1271–1281. [Google Scholar] [CrossRef]
- Constantinides, D.; Atalar, E.; McVeigh, E.R. Signal-to-noise measurements in magnitude images from NMR phased arrays. Magn. Reson. Med. 1997, 38, 852–857. [Google Scholar] [CrossRef]
- Roberts, S.; Menage, J.; Urban, J.P.G. Biomechanical and structural properties of the catilage end-plate and its relation to the intervertebral disc. Spine 1989, 14, 166–174. [Google Scholar] [CrossRef]
- Roberts, S.; Evans, H.; Trivedi, J.; Menage, J. Histology and pathology of the human intervertebral disc. J. Bone Joint Surg. Am. 2006, 88 (Suppl. S2), 10–14. [Google Scholar]
- Berg-Johansen, B.; Han, M.; Fields, A.J.; Liebenberg, E.C.; Lim, B.J.; Larson, P.E.; Gunduz-Demir, C.; Kazakia, G.J.; Krug, R.; Lotz, J.C. Cartilage Endplate Thickness Variation Measured by Ultrashort Echo-Time MRI Is Associated with Adjacent Disc Degeneration. Spine 2018, 43, E592–E600. [Google Scholar] [CrossRef]
- Wang, Y.; Battie, M.C.; Boyd, S.K.; Videman, T. The osseous endplates in lumbar vertebrae: Thickness, bone mineral density and their associations with age and disk degeneration. Bone 2011, 48, 804–809. [Google Scholar] [CrossRef] [PubMed]
- Bae, W.C.; Statum, S.; Zhang, Z.; Yamaguchi, T.; Wolfson, T.; Gamst, A.C.; Du, J.; Bydder, G.M.; Masuda, K.; Chung, C.B. Morphology of the cartilaginous endplates in human intervertebral disks with ultrashort echo time MR imaging. Radiology 2013, 266, 564–574. [Google Scholar] [CrossRef]
- Crockett, M.T.; Kelly, B.S.; van Baarsel, S.; Kavanagh, E.C. Modic Type 1 Vertebral Endplate Changes: Injury, Inflammation, or Infection? AJR Am. J. Roentgenol. 2017, 209, 167–170. [Google Scholar] [CrossRef] [PubMed]
- Boos, N.; Dreier, D.; Hilfiker, E.; Schade, V.; Kreis, R.; Hora, J.; Aebi, M.; Boesch, C. Tissue characterization of symptomatic and asymptomatic disc herniations by quantitative magnetic resonance imaging. J. Orthop. Res. 1997, 15, 141–149. [Google Scholar] [CrossRef] [PubMed]
- Faure, P.; Doan, B.-T.; Beloeil, J.-C. In-vivo high-resolution three-dimensional MRI studies of rat joints at 7 T. NMR Biomed. 2003, 16, 484–493. [Google Scholar] [CrossRef]
- Watrin-Pinzano, A.; Ruaud, J.-P.; Cheli, Y.; Gonord, P.; Grossin, L.; Gillet, P.; Blum, A.; Payan, E.; Olivier, P.; Guillot, G.; et al. T2 mapping: An efficient MR quantitative technique to evaluate spontaneous cartilage repair in rat patella. Osteo Arthritis Cartil. 2004, 12, 191–200. [Google Scholar] [CrossRef]


Disclaimer/Publisher’s Note: The statements, opinions and data contained in all publications are solely those of the individual author(s) and contributor(s) and not of MDPI and/or the editor(s). MDPI and/or the editor(s) disclaim responsibility for any injury to people or property resulting from any ideas, methods, instructions or products referred to in the content. |
© 2025 by the authors. Licensee MDPI, Basel, Switzerland. This article is an open access article distributed under the terms and conditions of the Creative Commons Attribution (CC BY) license (https://creativecommons.org/licenses/by/4.0/).
Share and Cite
Dallaudière, B.; Ribot, E.J.; Trotier, A.J.; Dallet, L.; Thibaudeau, O.; Miraux, S.; Hauger, O. Characterization of Normal and Degenerative Discovertebral Complexes Using Qualitative and Quantitative Magnetic Resonance Imaging at 4.7T: Longitudinal Evaluation of Immature and Mature Rats. Bioengineering 2025, 12, 141. https://doi.org/10.3390/bioengineering12020141
Dallaudière B, Ribot EJ, Trotier AJ, Dallet L, Thibaudeau O, Miraux S, Hauger O. Characterization of Normal and Degenerative Discovertebral Complexes Using Qualitative and Quantitative Magnetic Resonance Imaging at 4.7T: Longitudinal Evaluation of Immature and Mature Rats. Bioengineering. 2025; 12(2):141. https://doi.org/10.3390/bioengineering12020141
Chicago/Turabian StyleDallaudière, Benjamin, Emeline J. Ribot, Aurélien J. Trotier, Laurence Dallet, Olivier Thibaudeau, Sylvain Miraux, and Olivier Hauger. 2025. "Characterization of Normal and Degenerative Discovertebral Complexes Using Qualitative and Quantitative Magnetic Resonance Imaging at 4.7T: Longitudinal Evaluation of Immature and Mature Rats" Bioengineering 12, no. 2: 141. https://doi.org/10.3390/bioengineering12020141
APA StyleDallaudière, B., Ribot, E. J., Trotier, A. J., Dallet, L., Thibaudeau, O., Miraux, S., & Hauger, O. (2025). Characterization of Normal and Degenerative Discovertebral Complexes Using Qualitative and Quantitative Magnetic Resonance Imaging at 4.7T: Longitudinal Evaluation of Immature and Mature Rats. Bioengineering, 12(2), 141. https://doi.org/10.3390/bioengineering12020141