
Plasticity of Expression of Stem Cell and EMT Markers in Breast Cancer Cells in 2D and 3D Culture Depend on the Spatial Parameters of Cell Growth; Mathematical Modeling of Mechanical Stress in Cell Culture in Relation to ECM Stiffness

 , , ,
, , ,  and
and 
Abstract
1. Introduction
2. Materials and Methods
2.1. Cell Lines
2.2. Spheroid Culture
2.3. Matrigel Culture
2.4. Immunofluorescence
2.5. qPCR
2.6. Western Blot
2.7. Biofabrication of 3D Breast Cancer Models
2.8. Mathematical Model
2.8.1. Methods
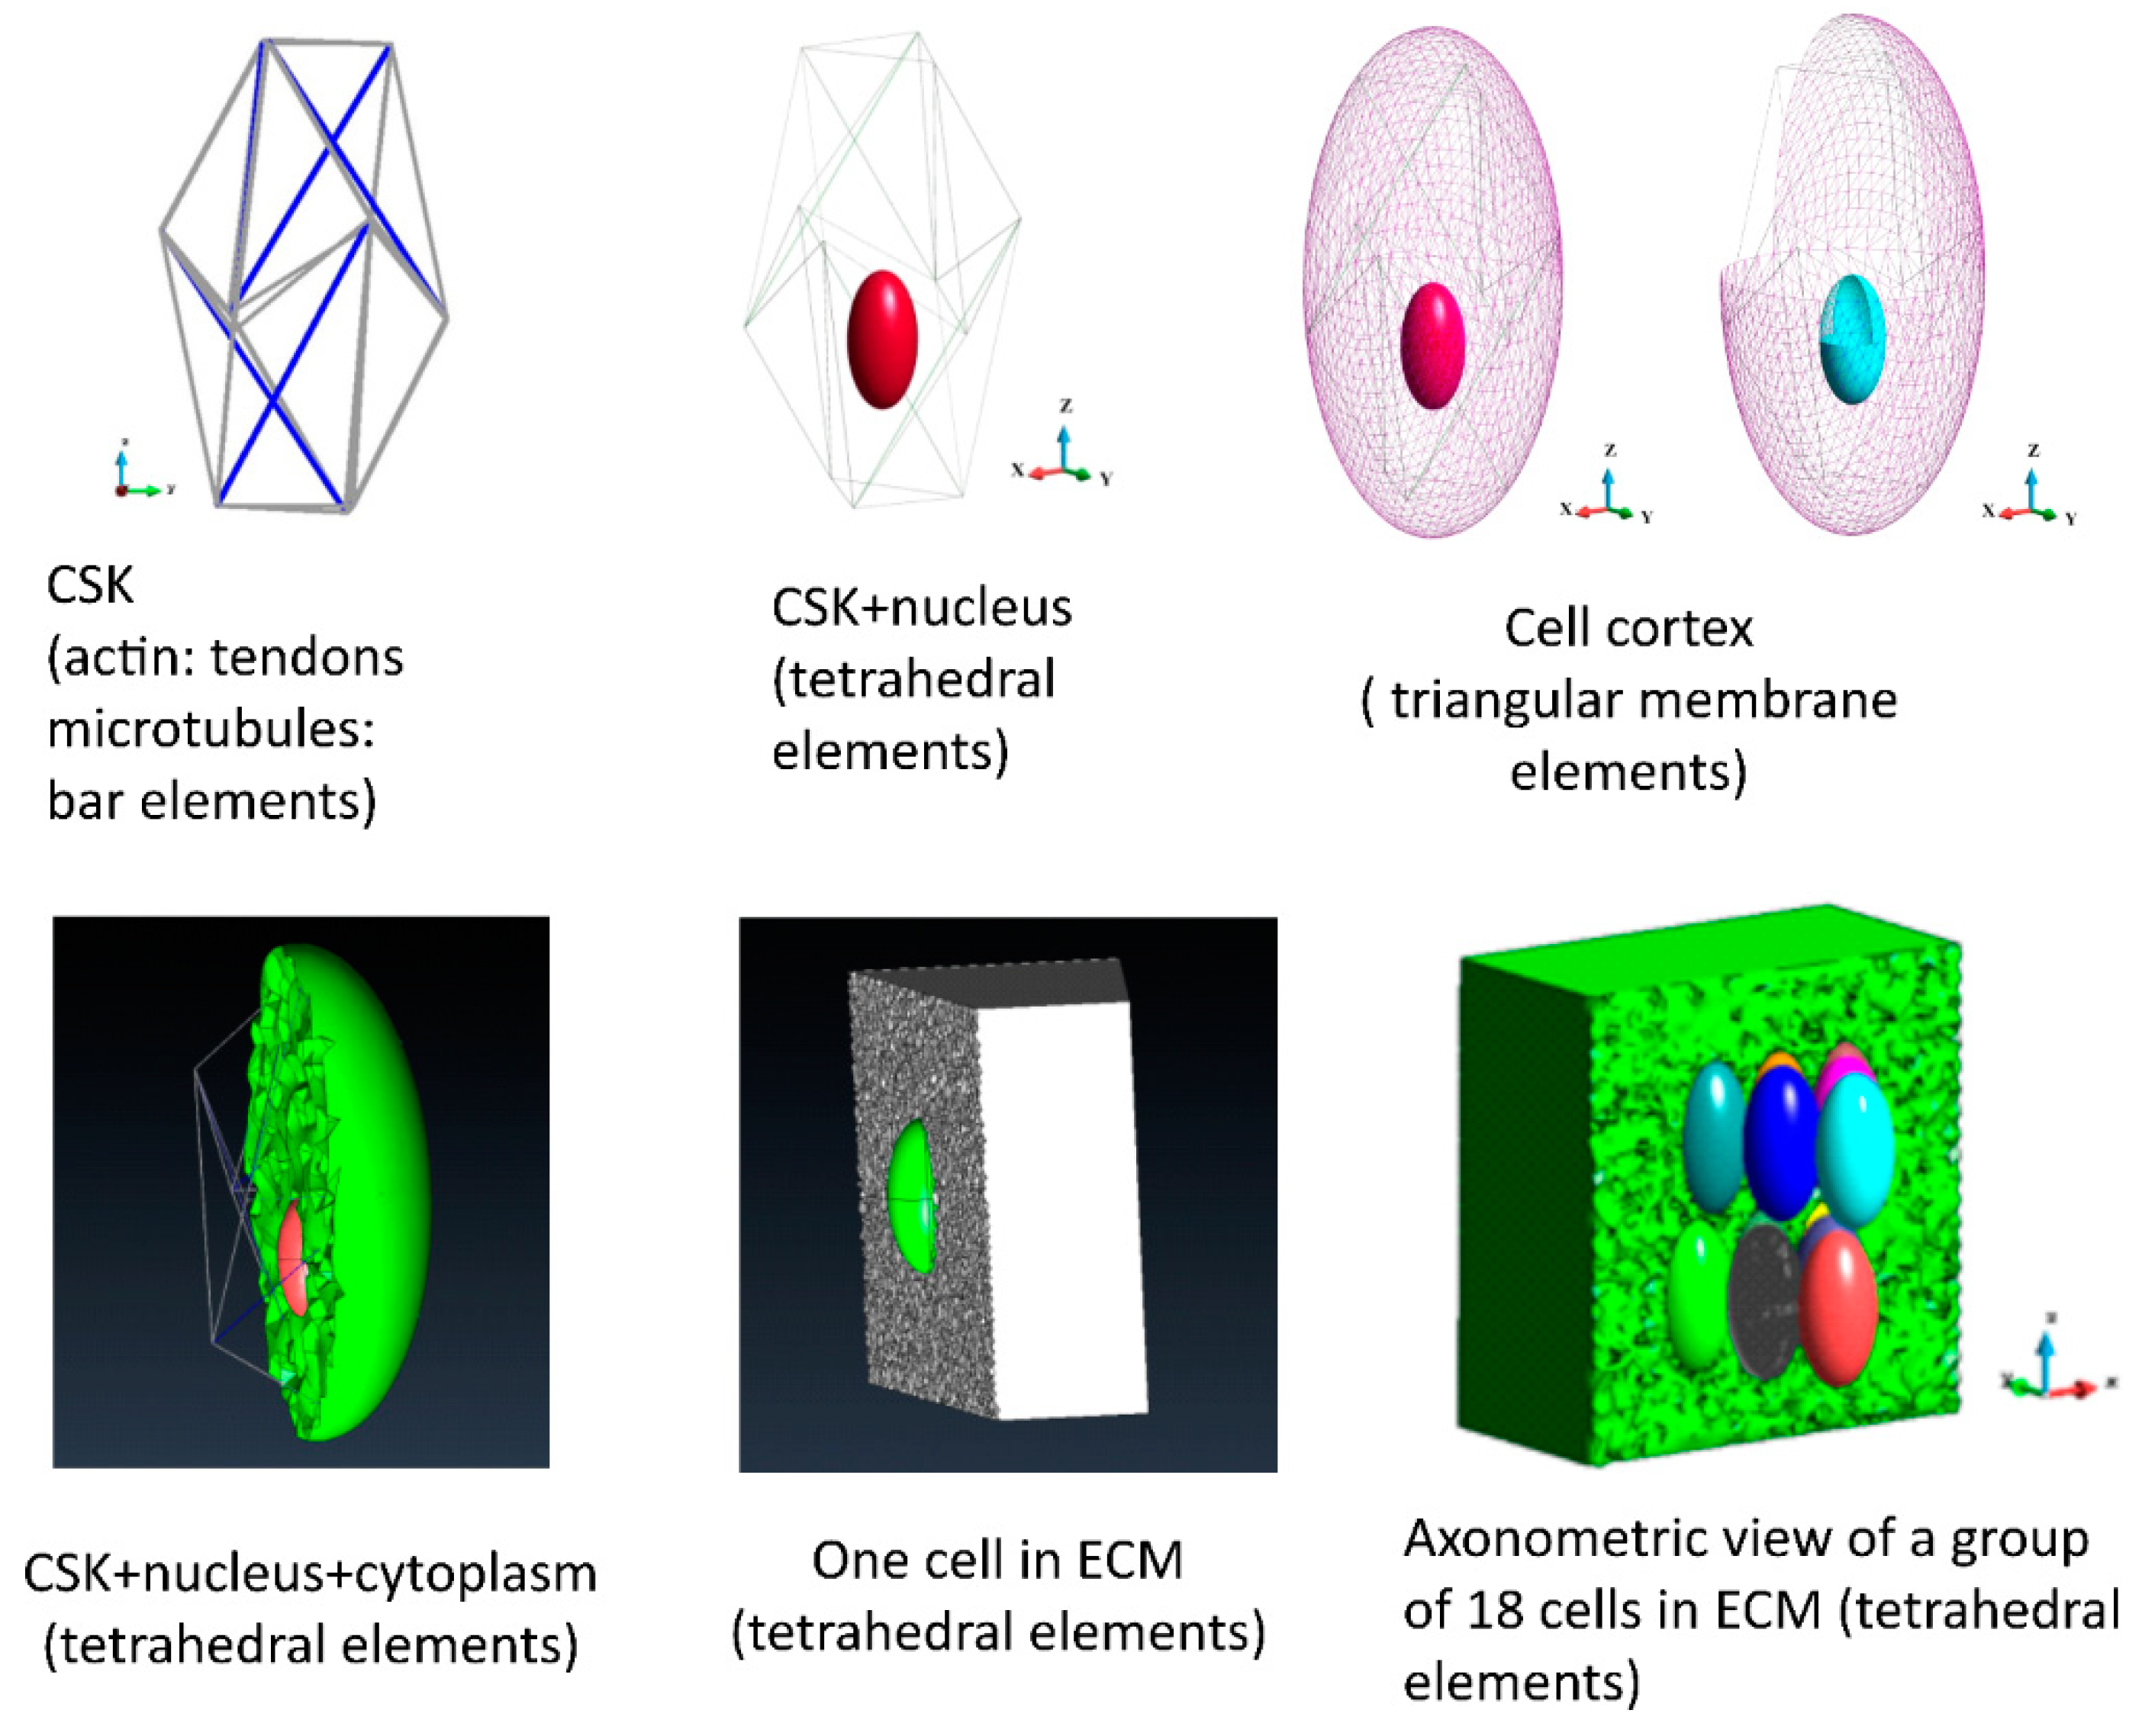
2.8.2. Geometry
3. Results
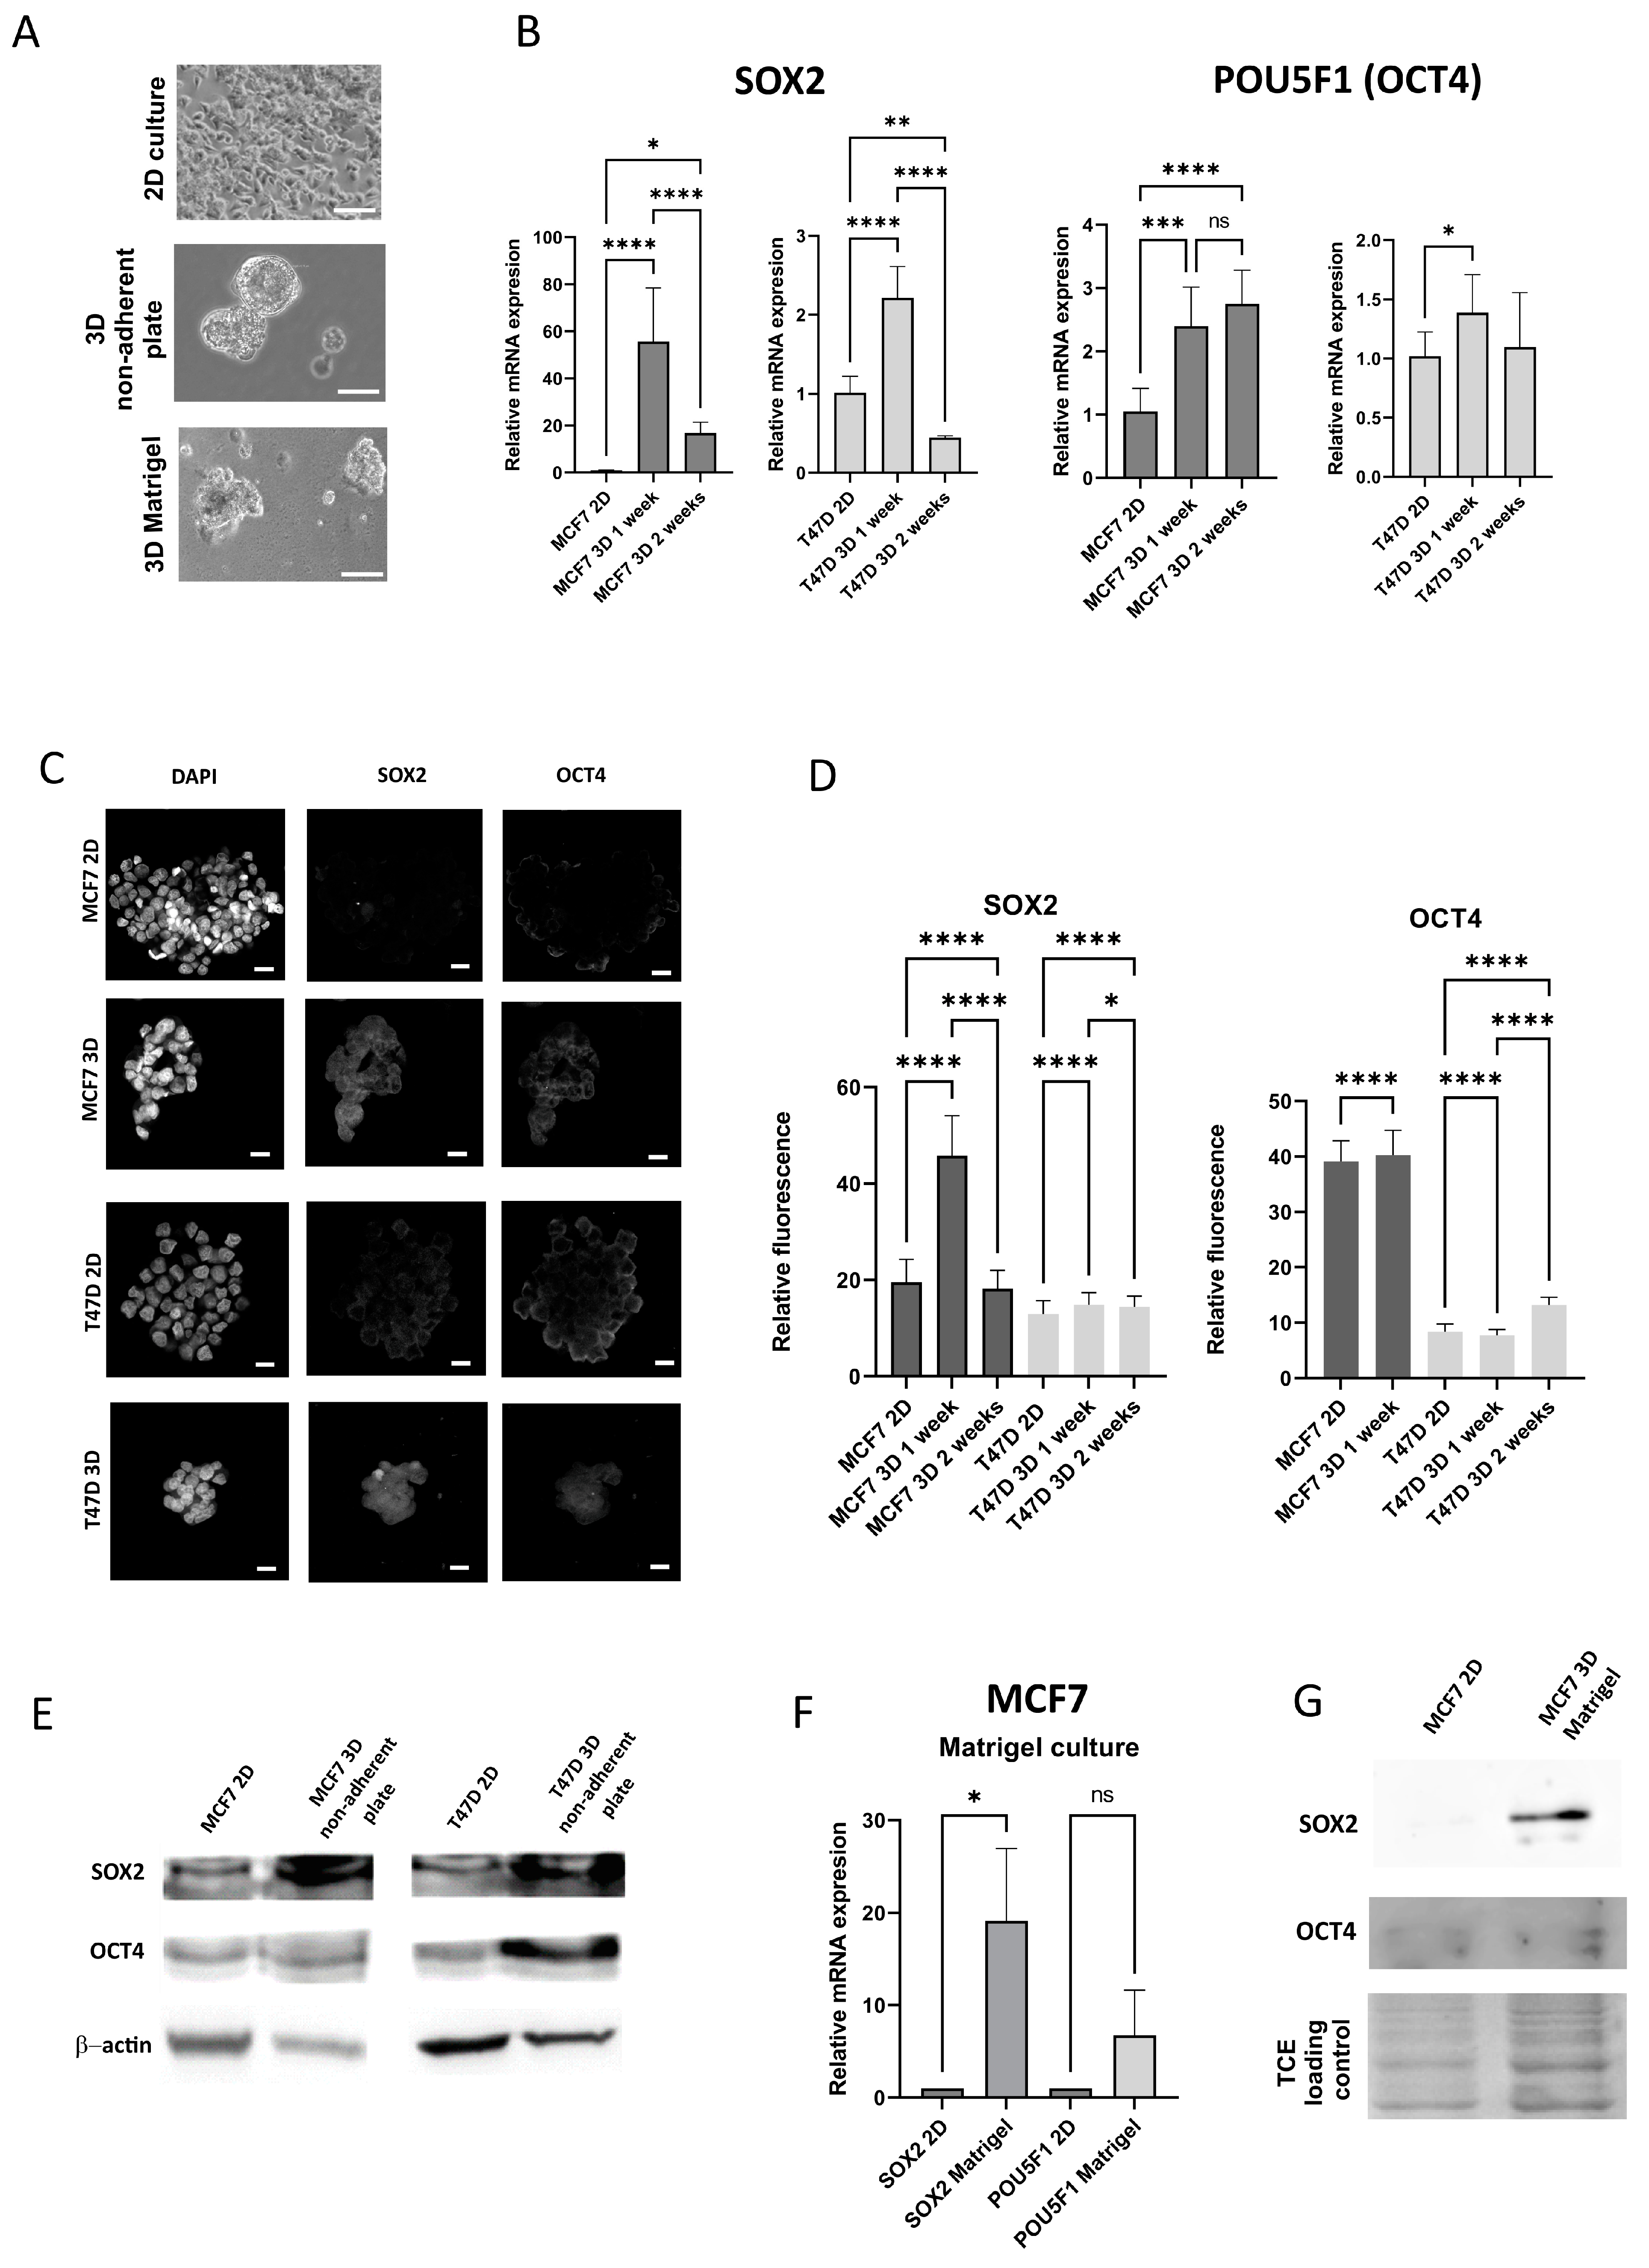
3.1. The Expression of Stem Cell Markers in Breast Cancer Cell Lines Increases Under 3D Culture Conditions, Regardless of the 3D Model
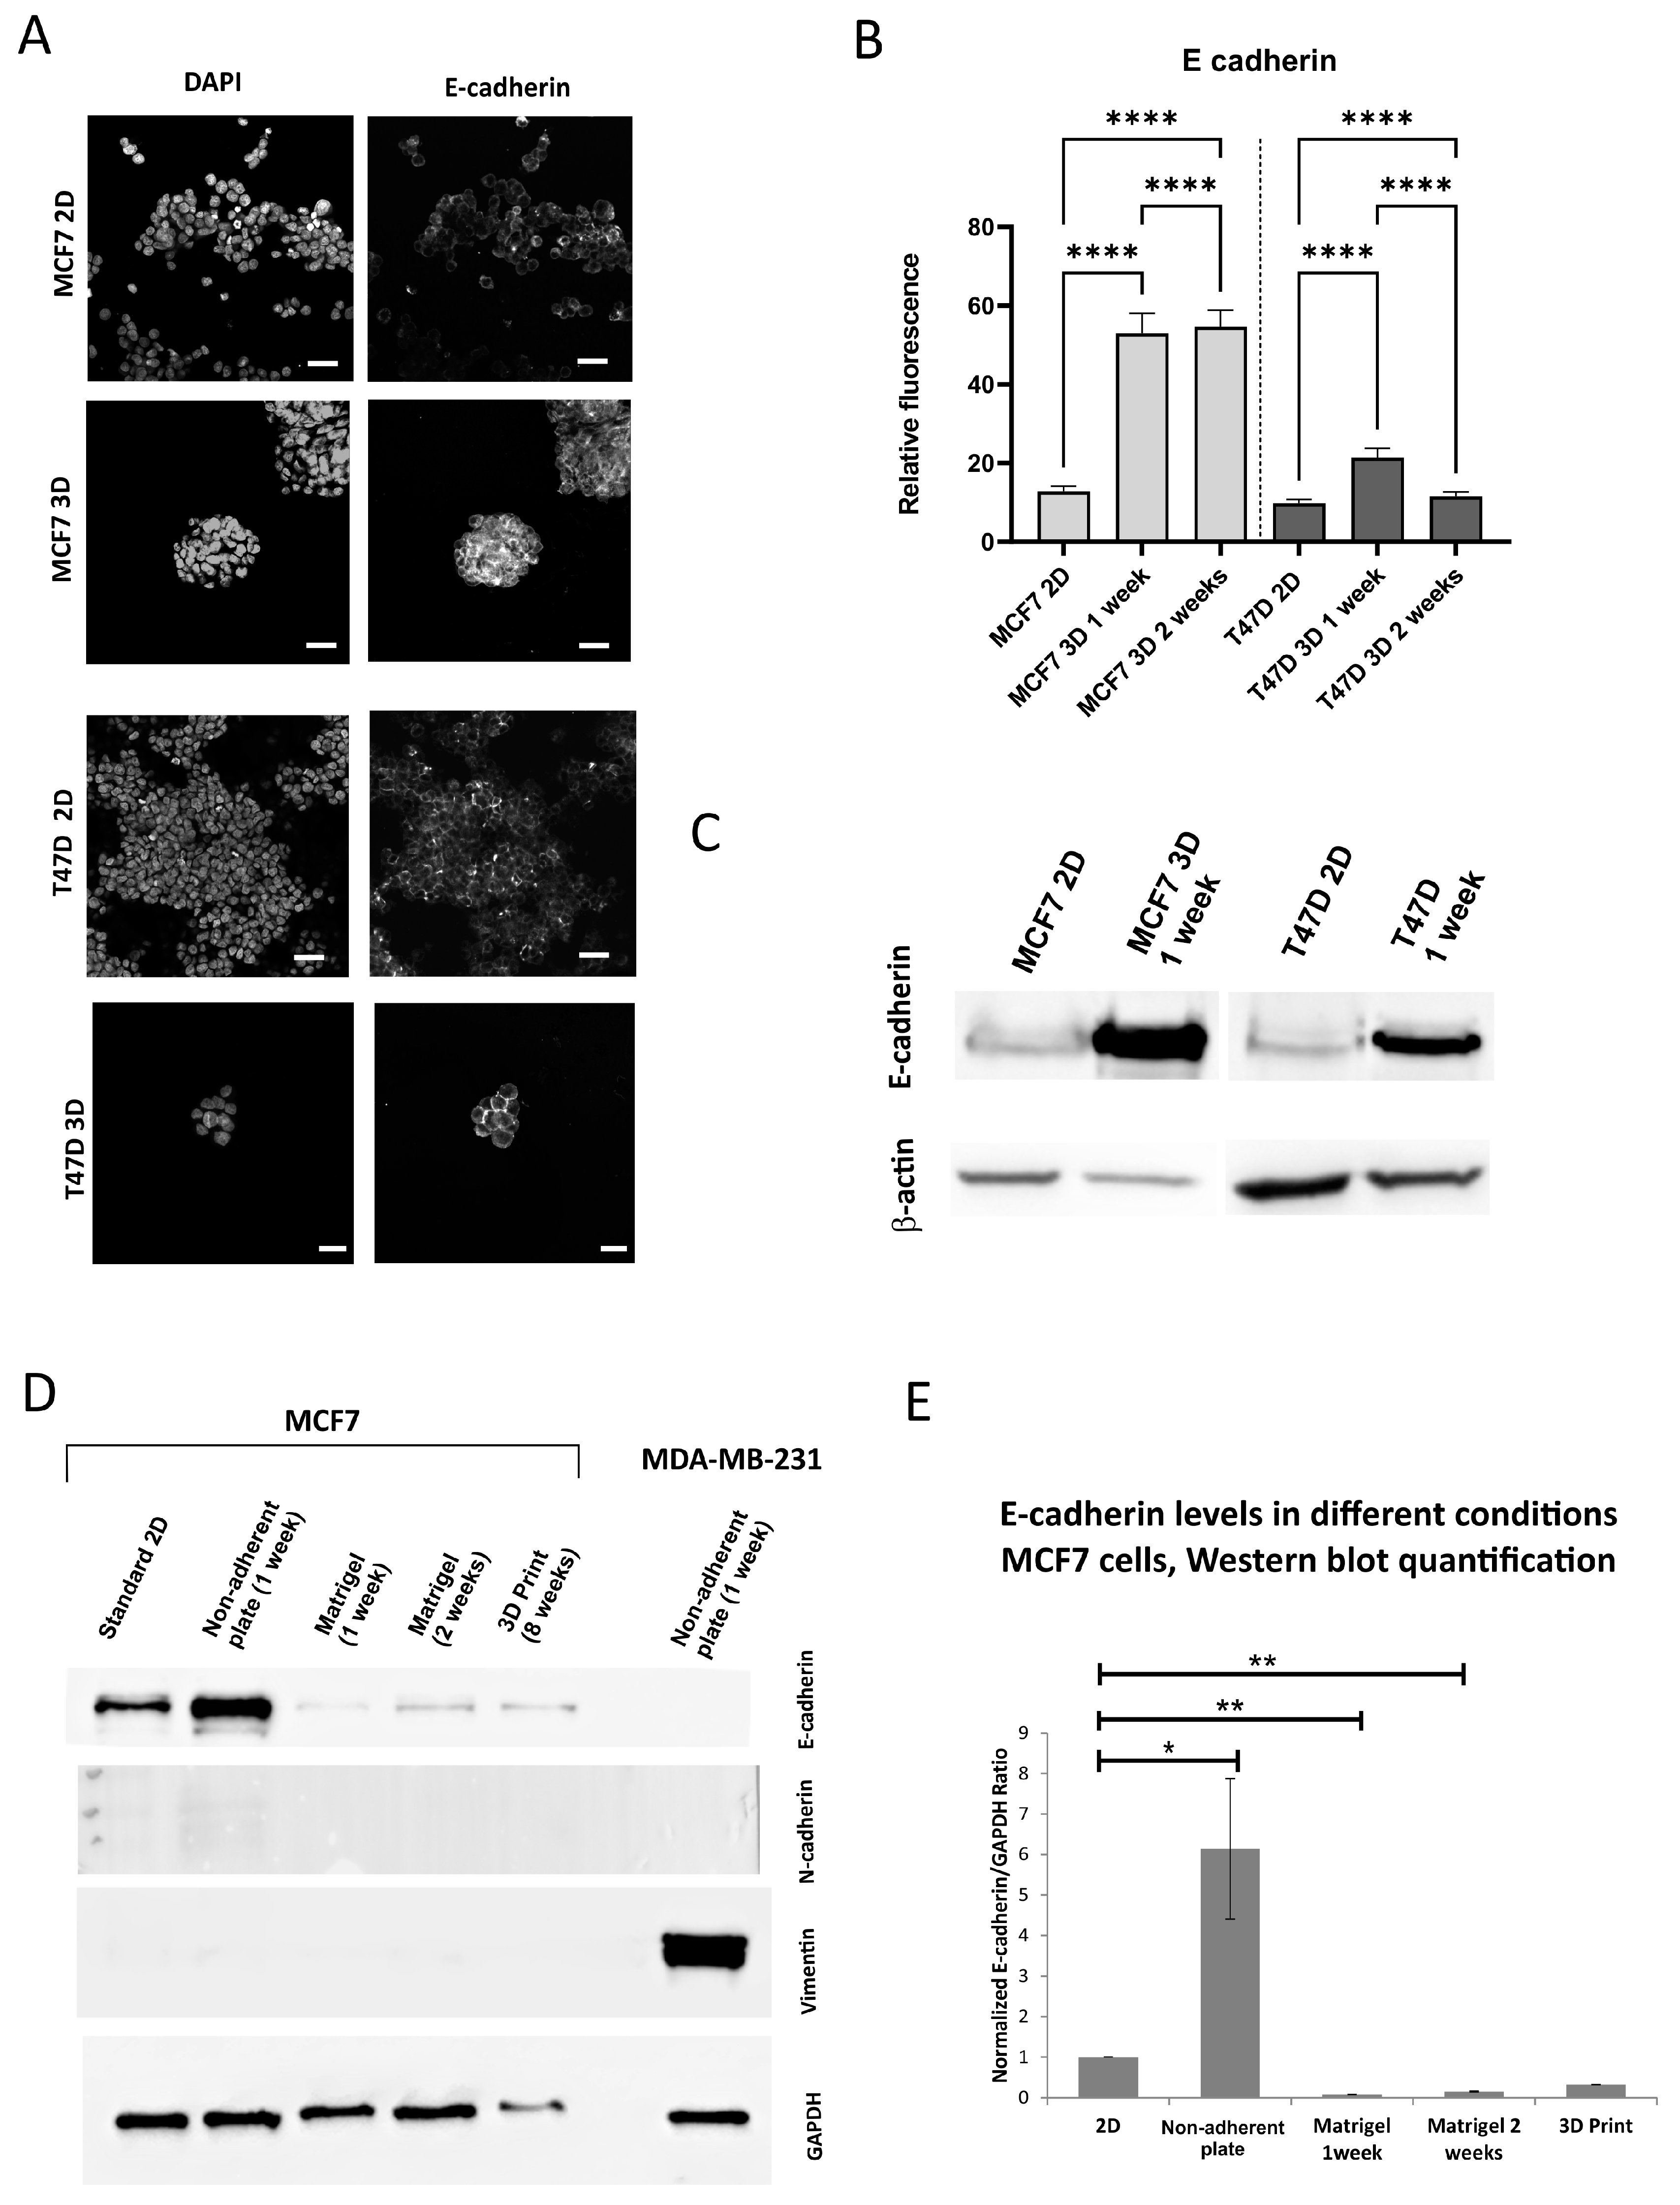
3.2. The Expression of the Epithelial Marker E-Cadherin Under 3D Versus 2D Conditions Varies Depending on a 3D Model
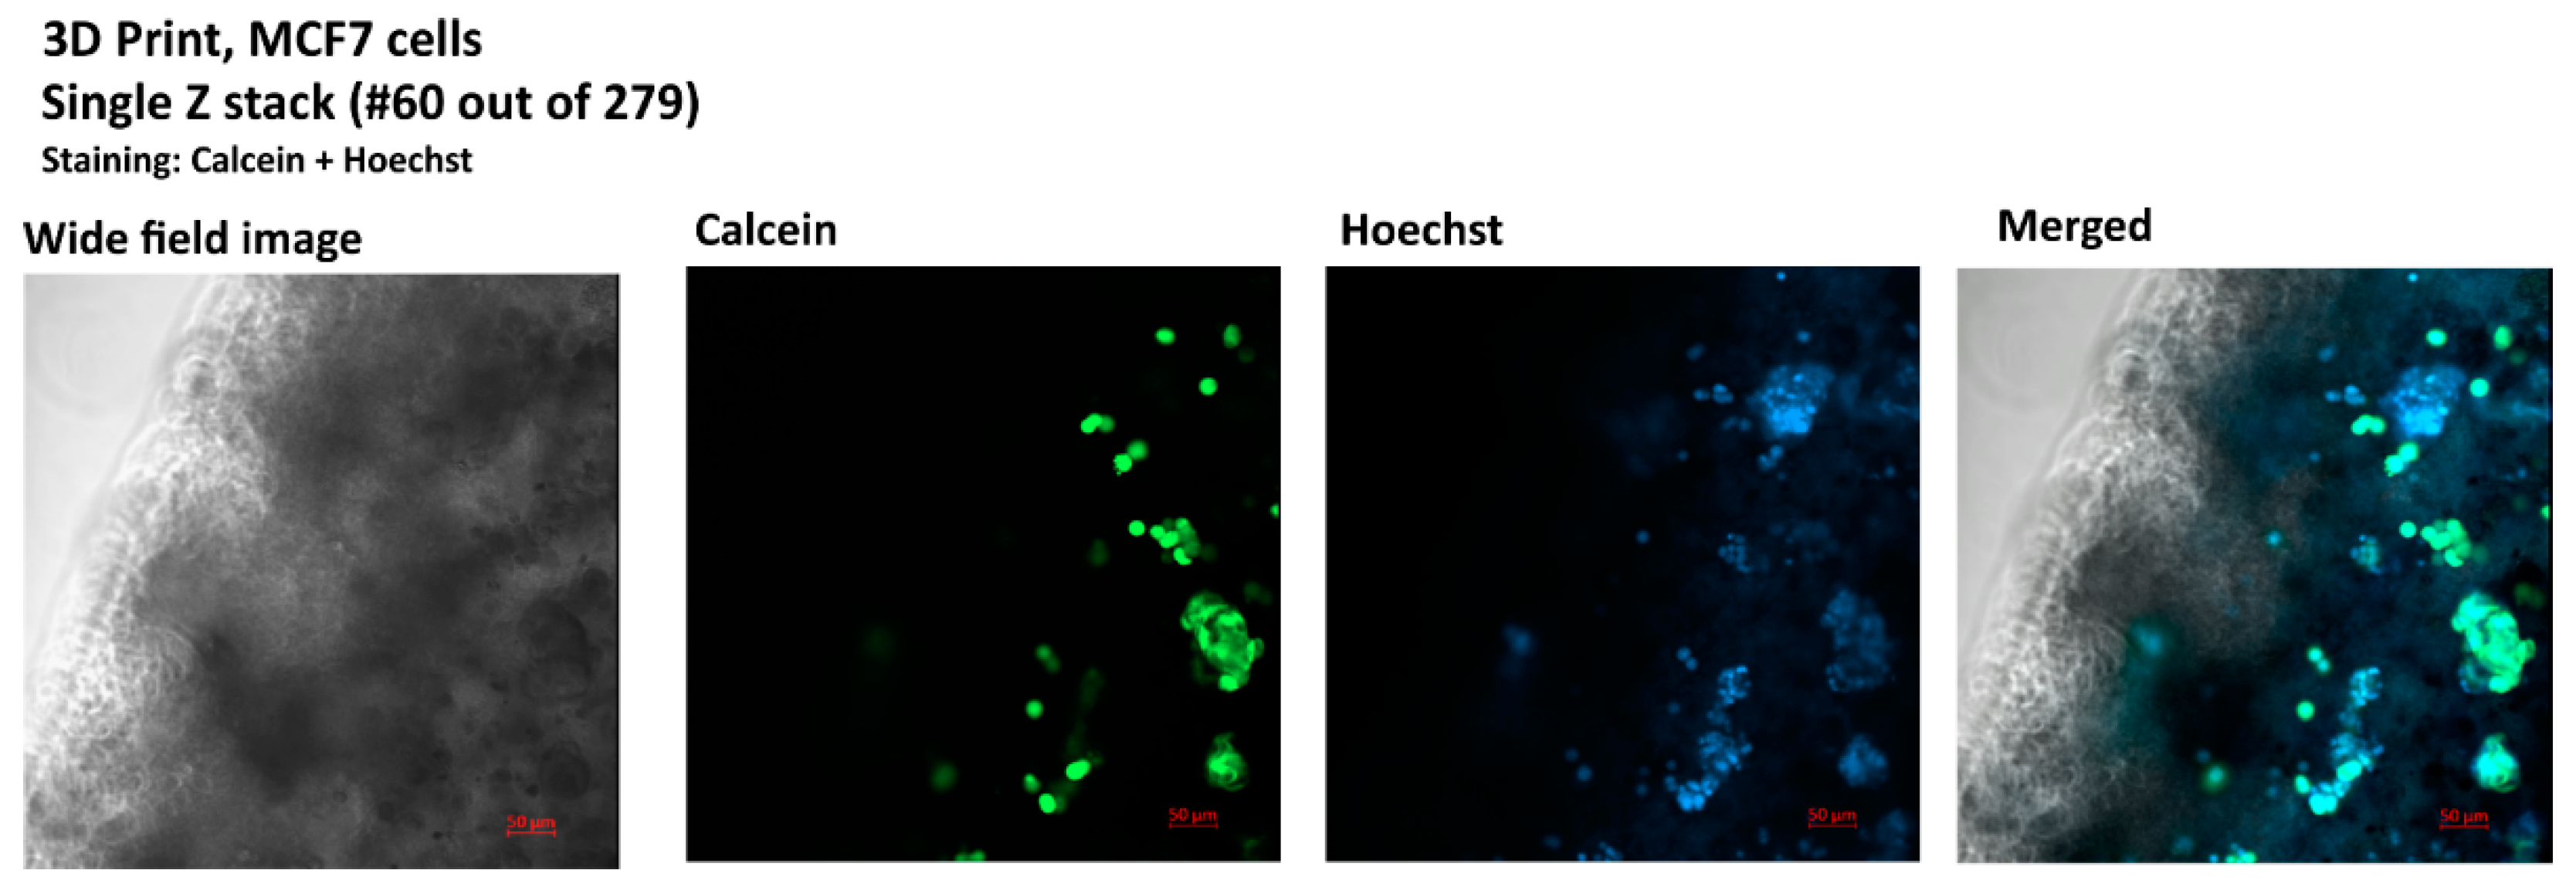
3.3. Bioprinting and Imagining of a 3D Culture for the Generation of the Model
3.4. Mathematical Model of Stress Analysis
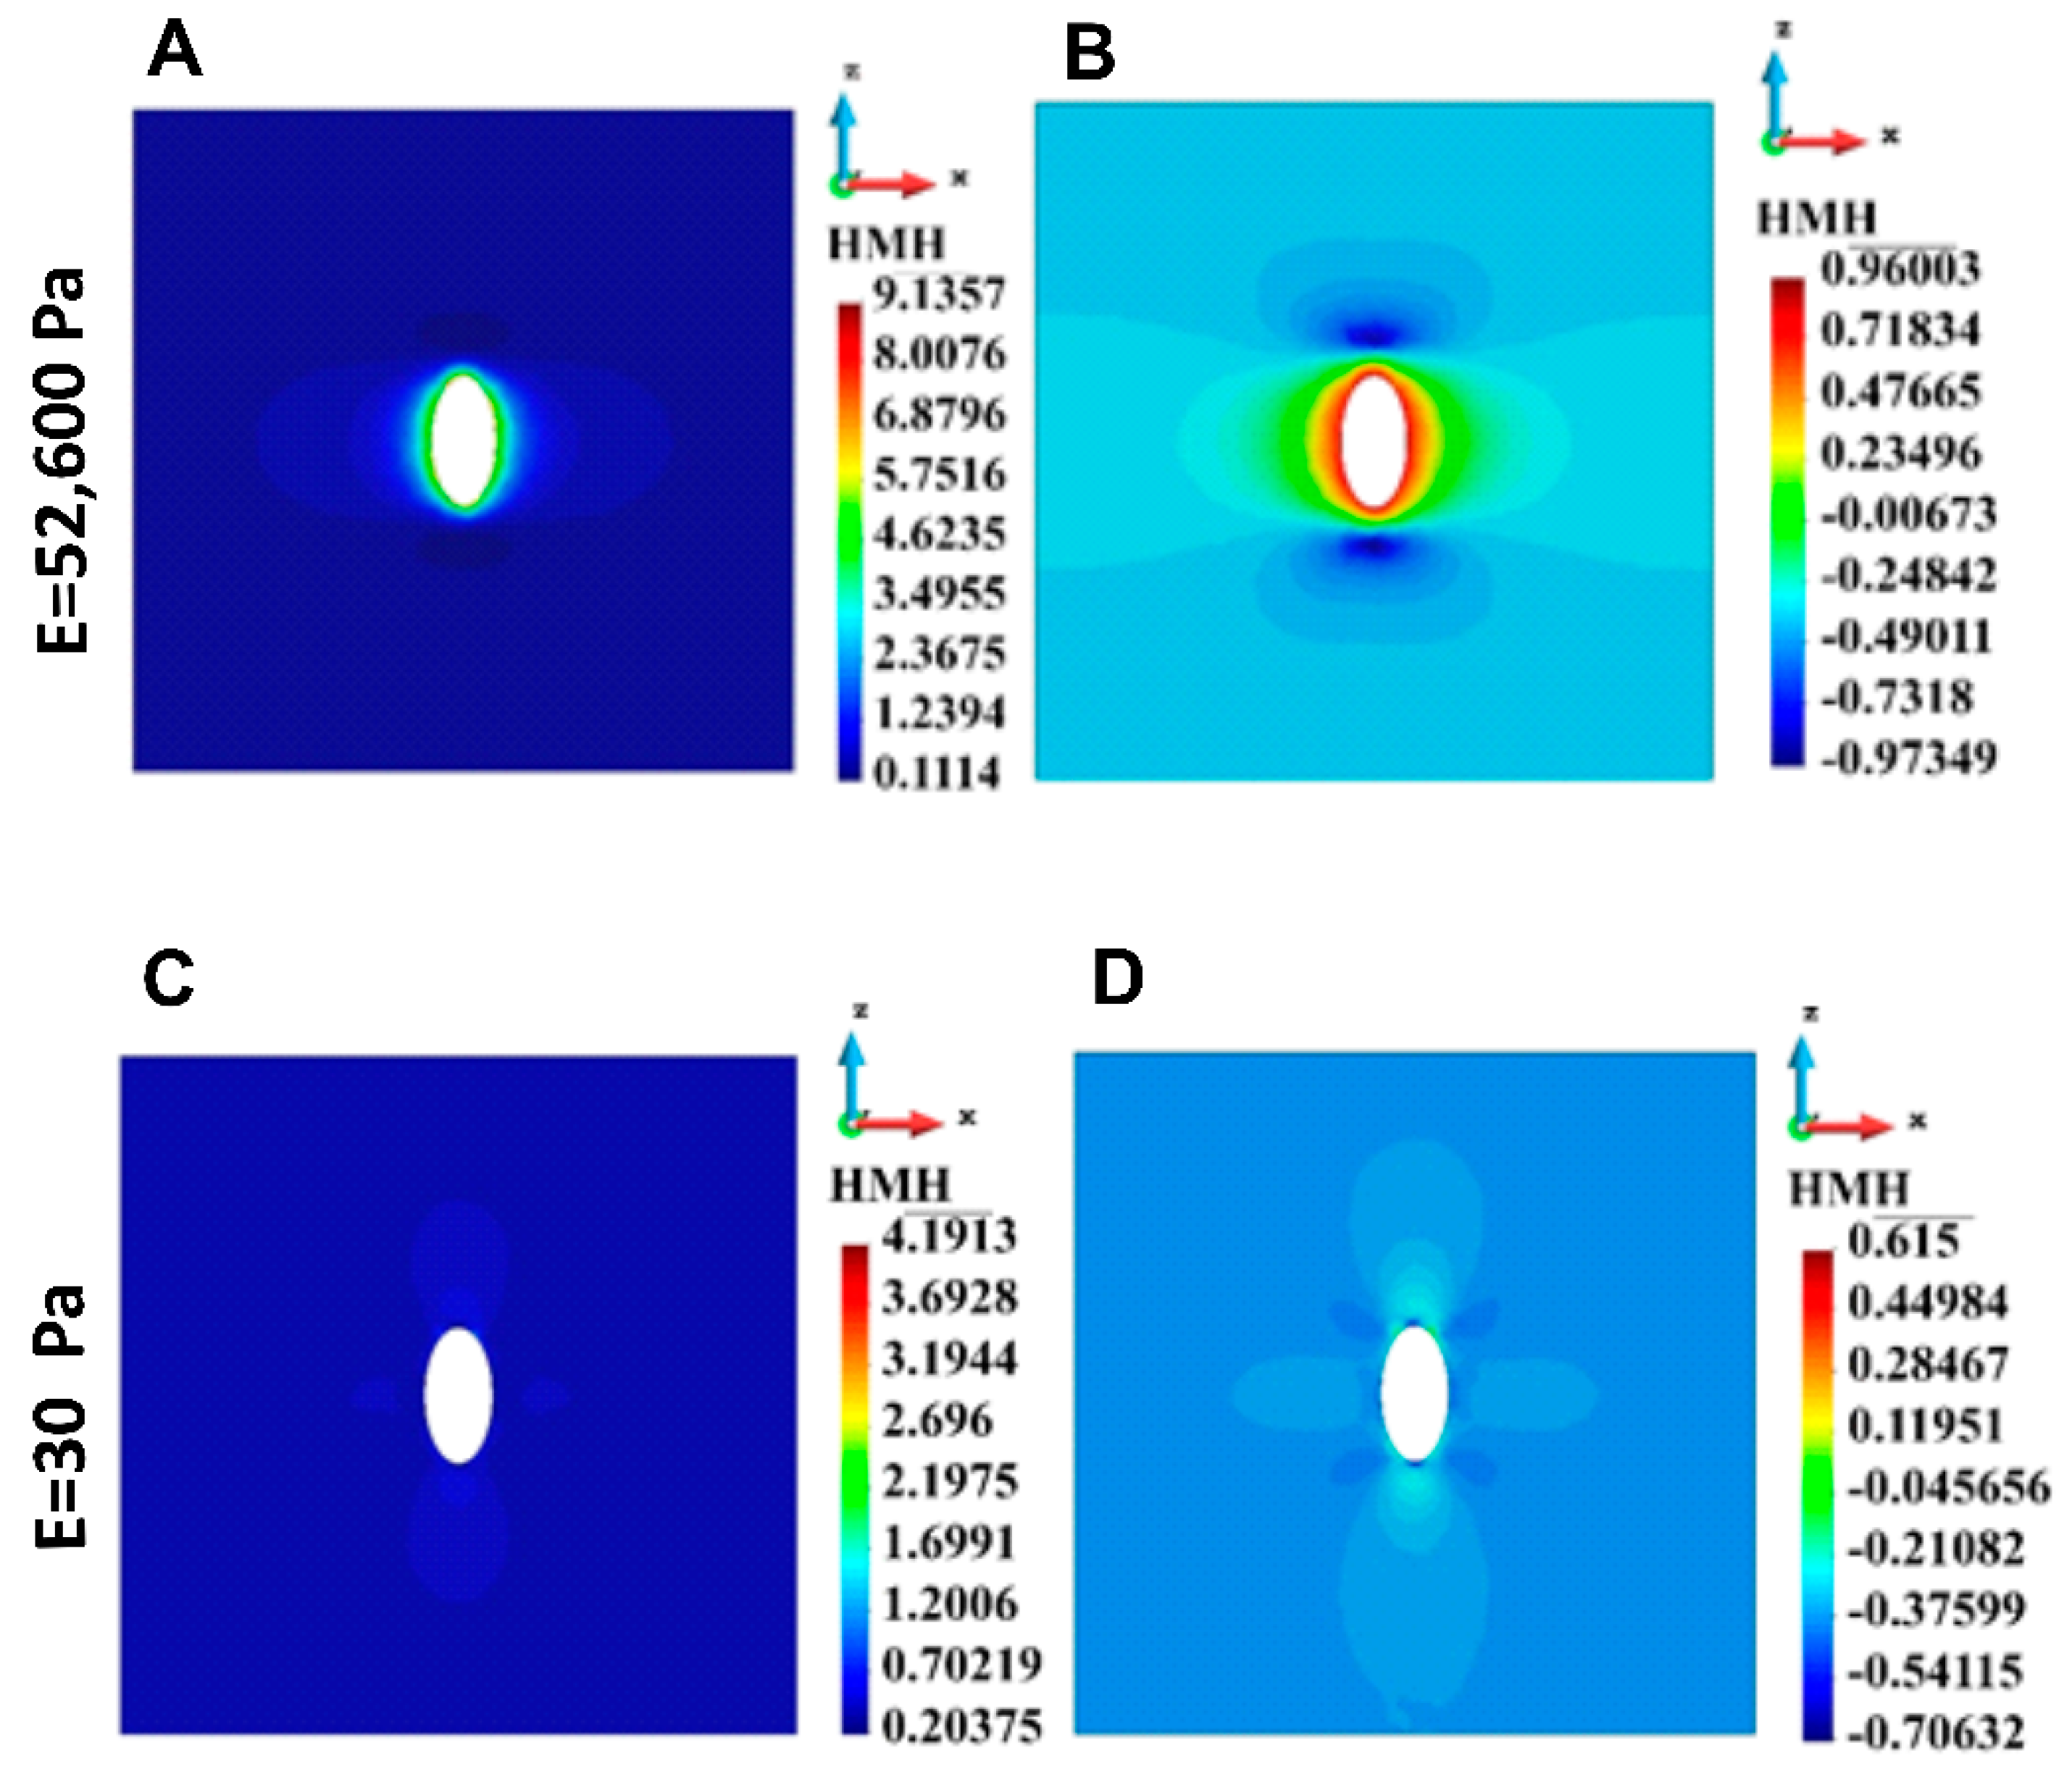
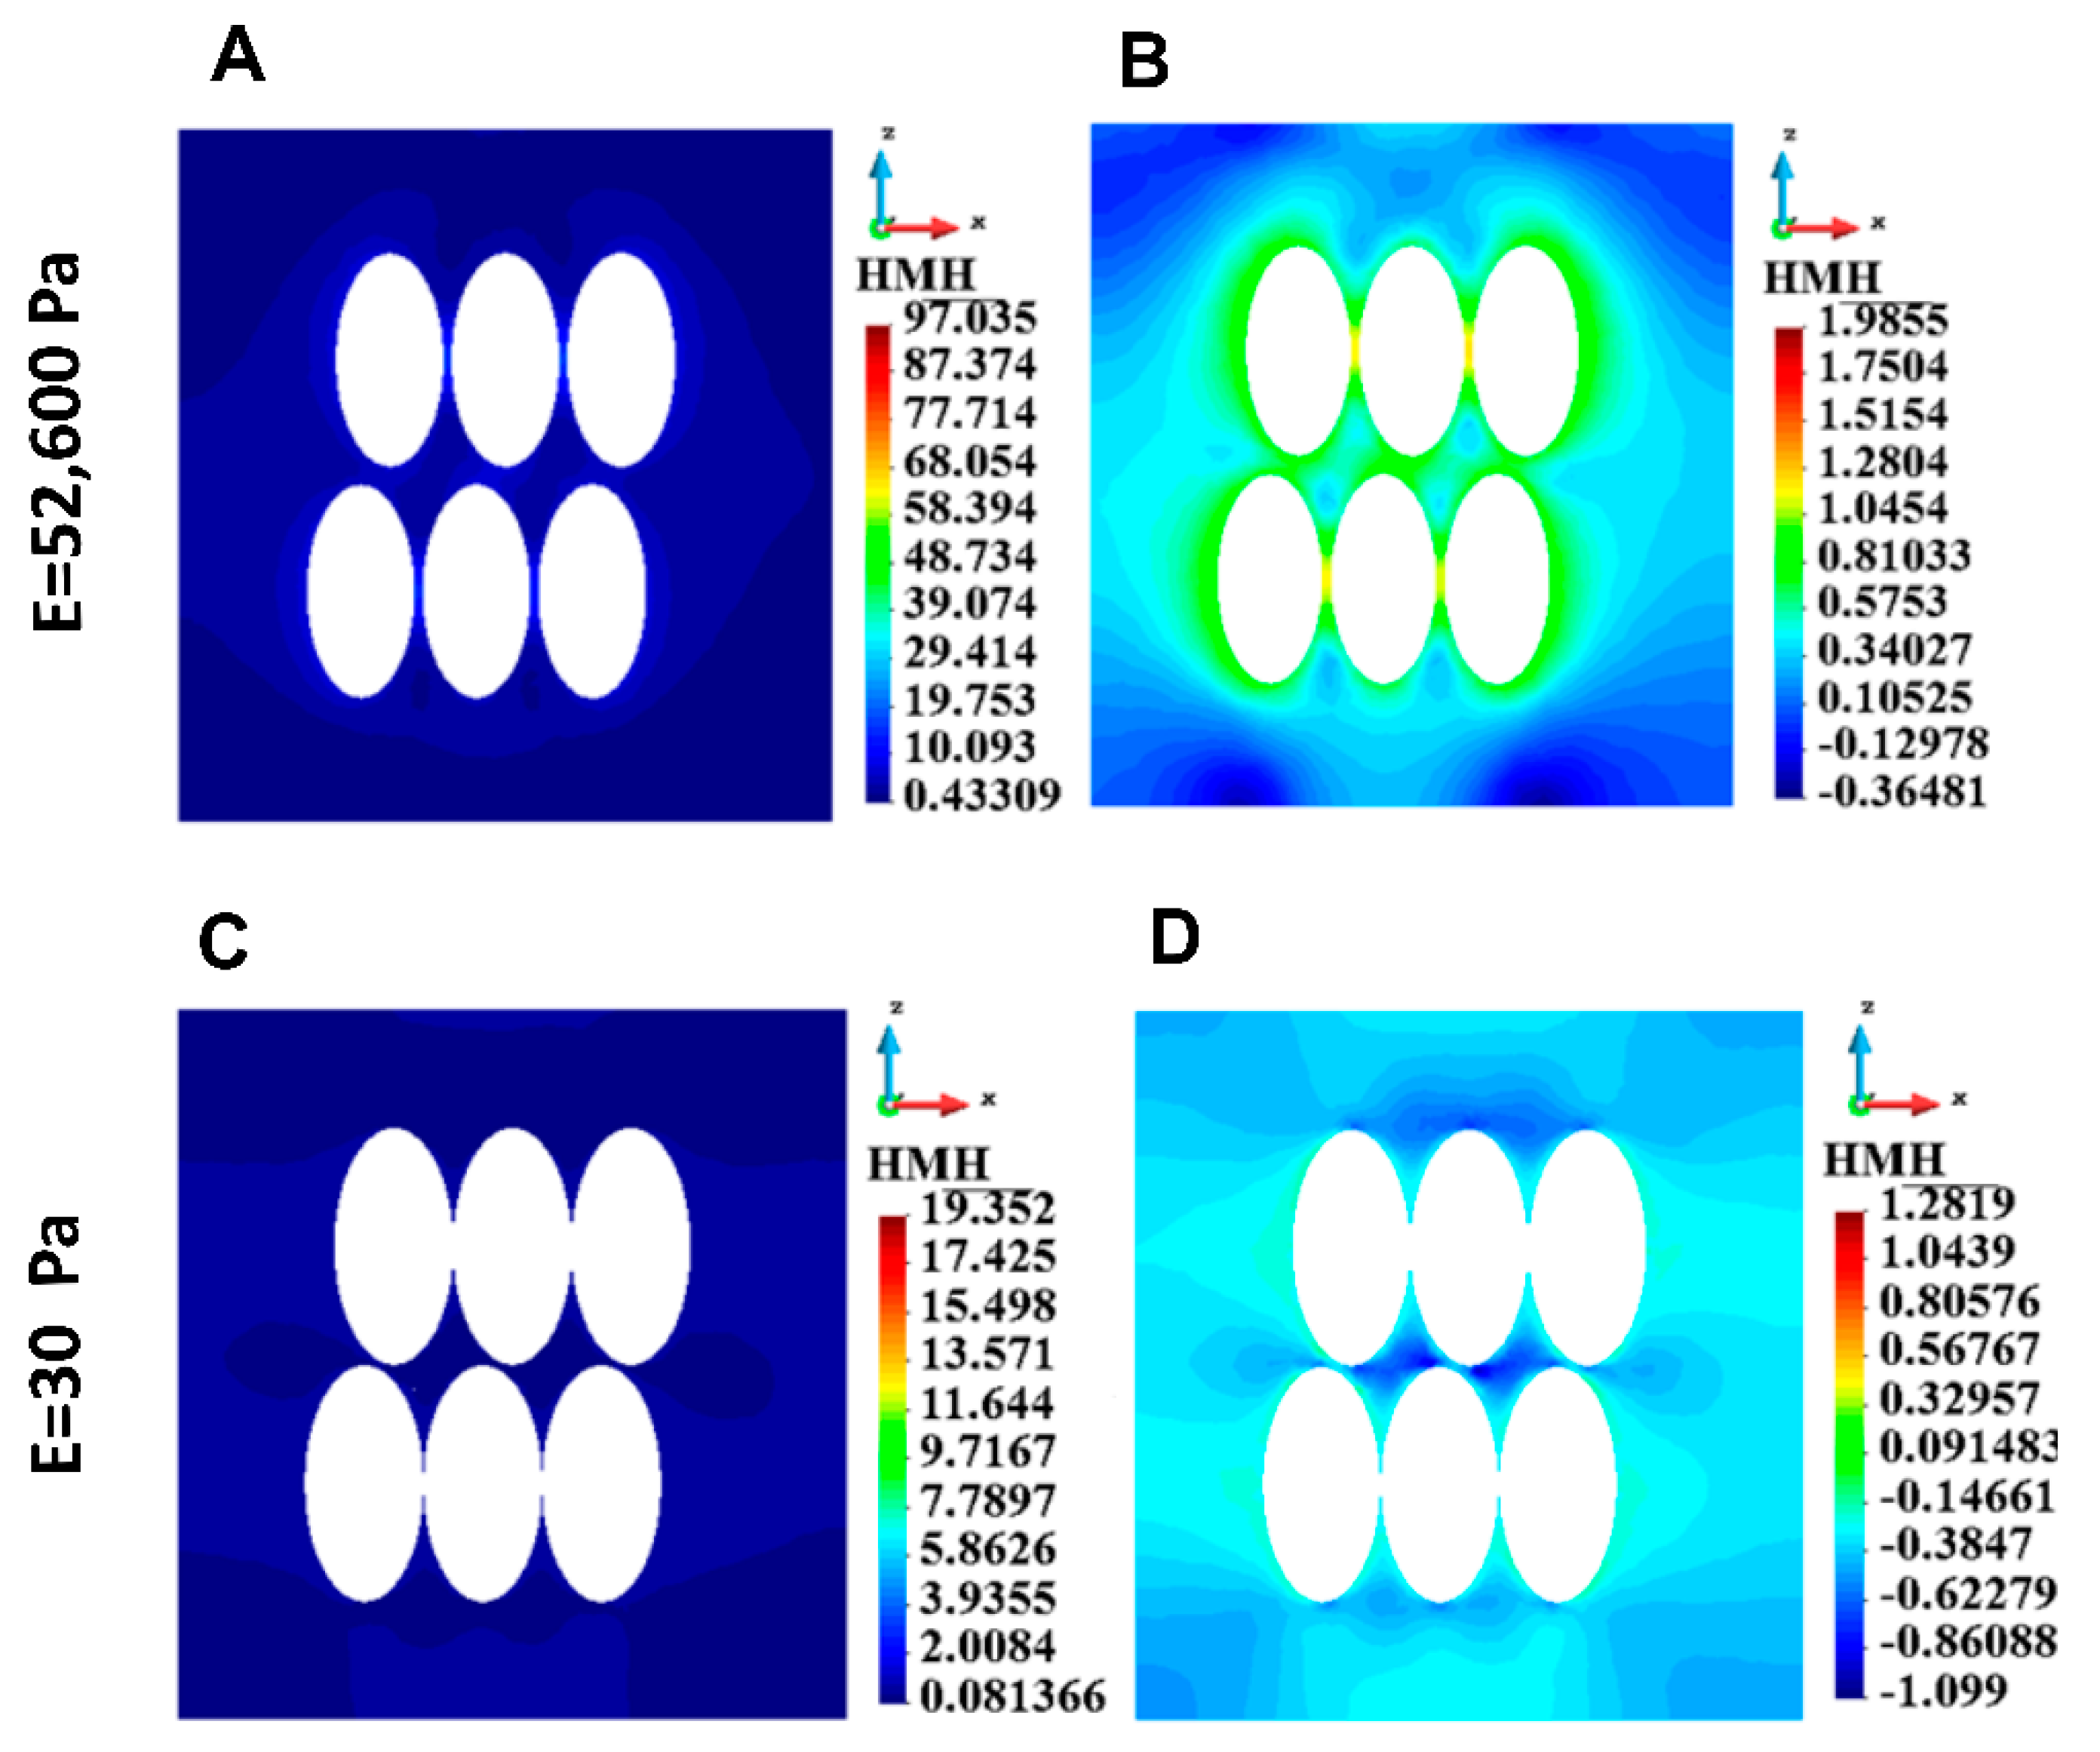
3.4.1. ECM Stress
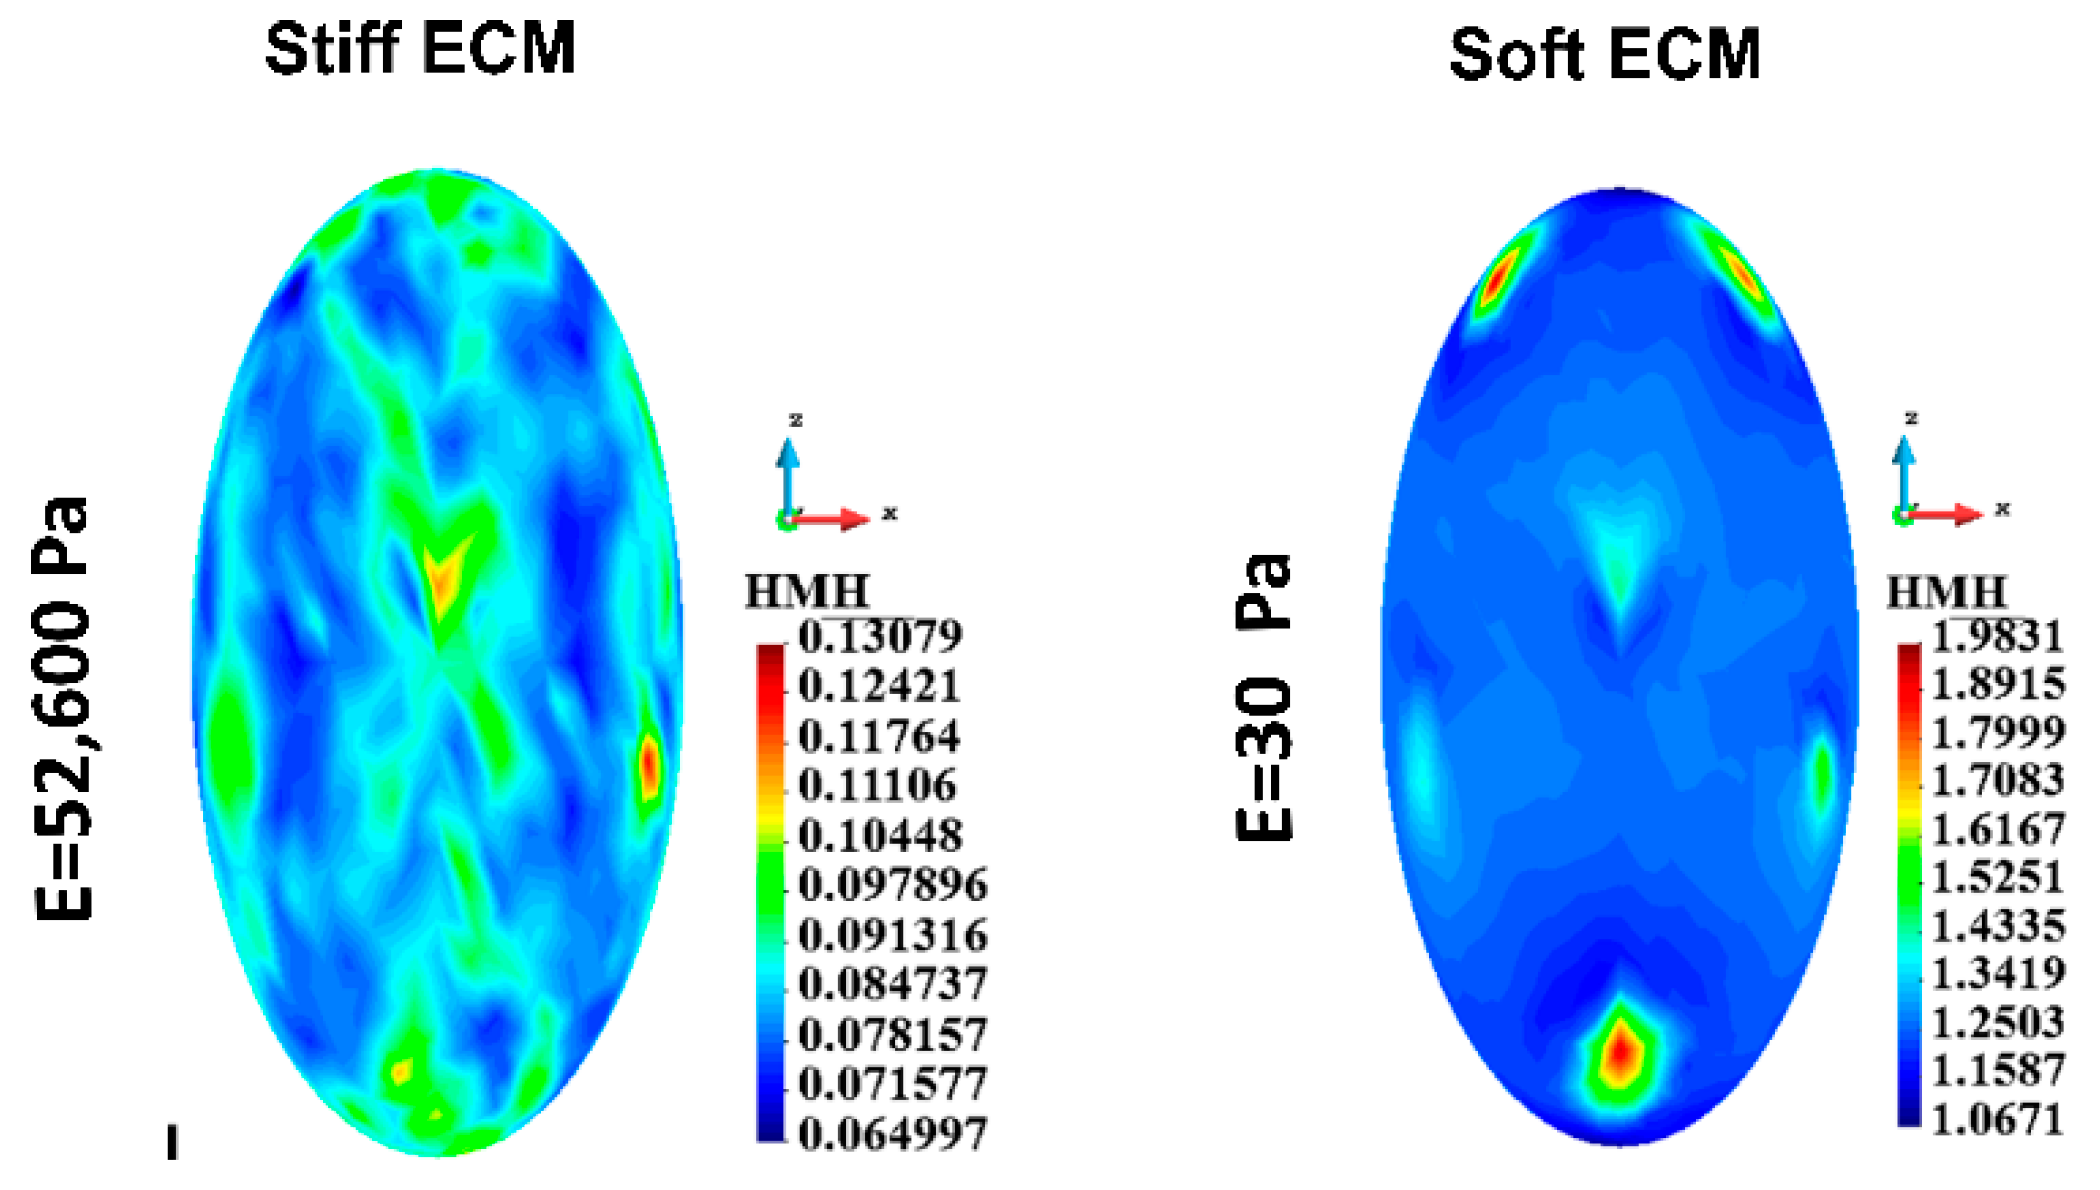
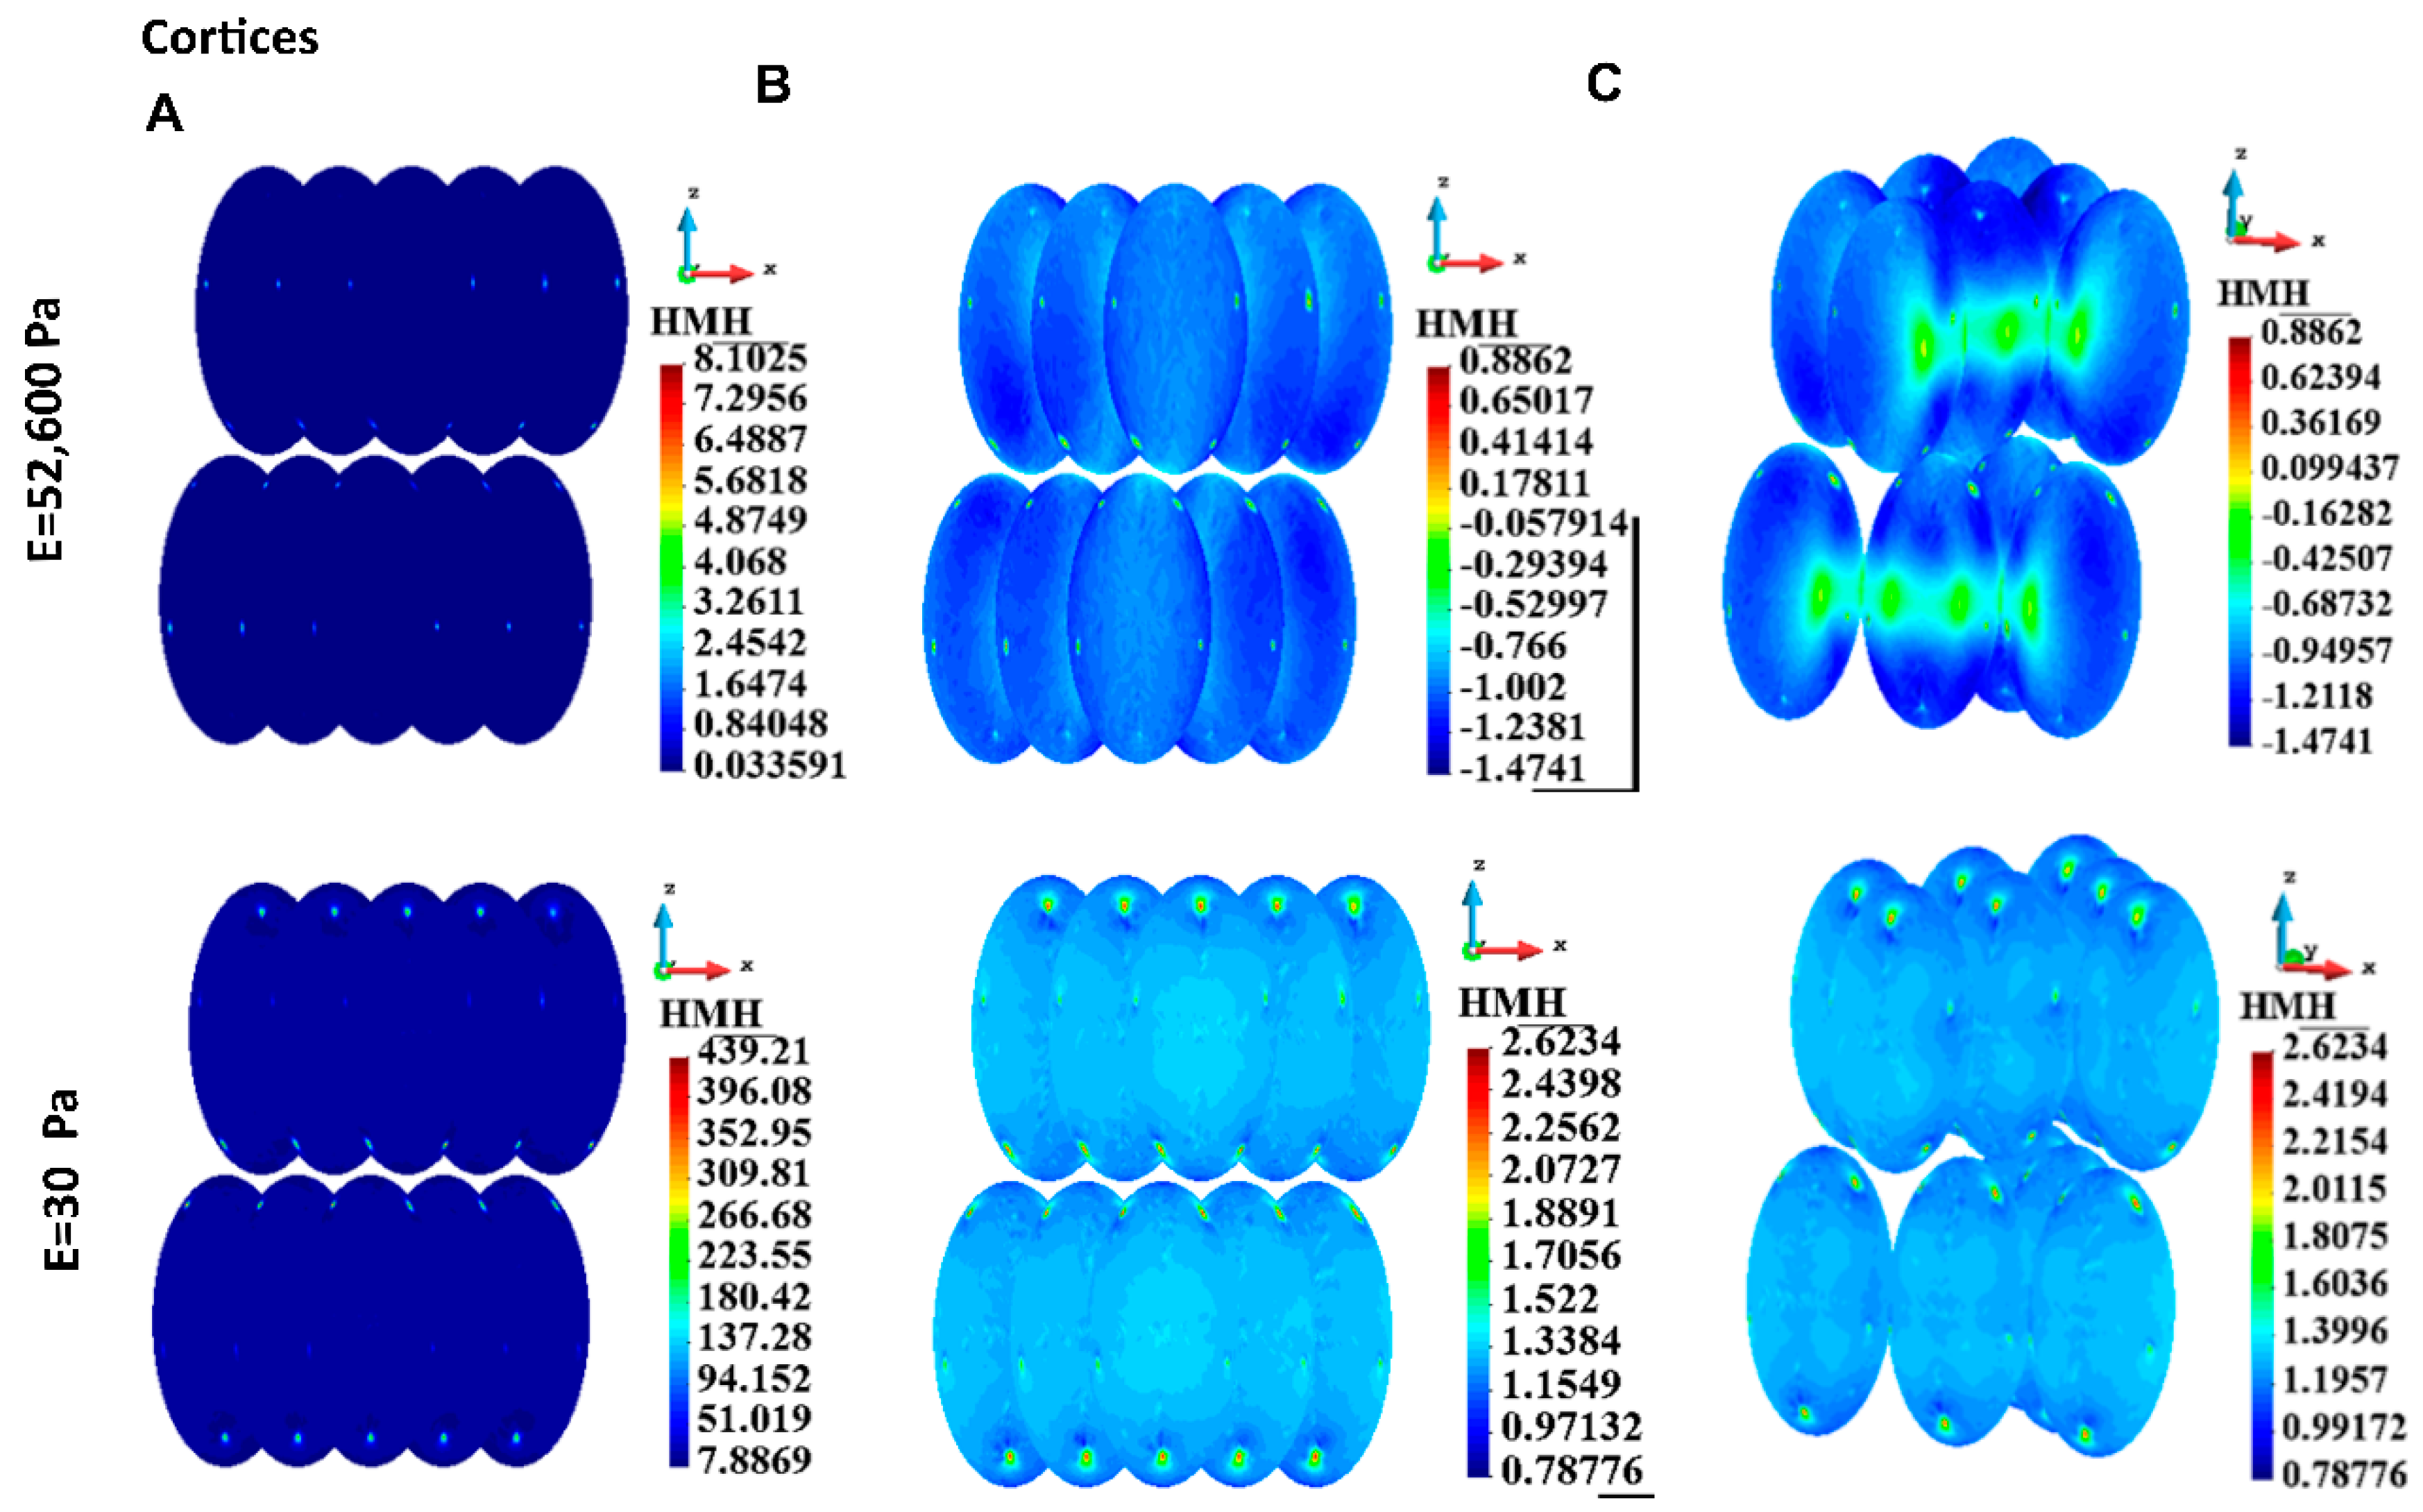
3.4.2. Cortices
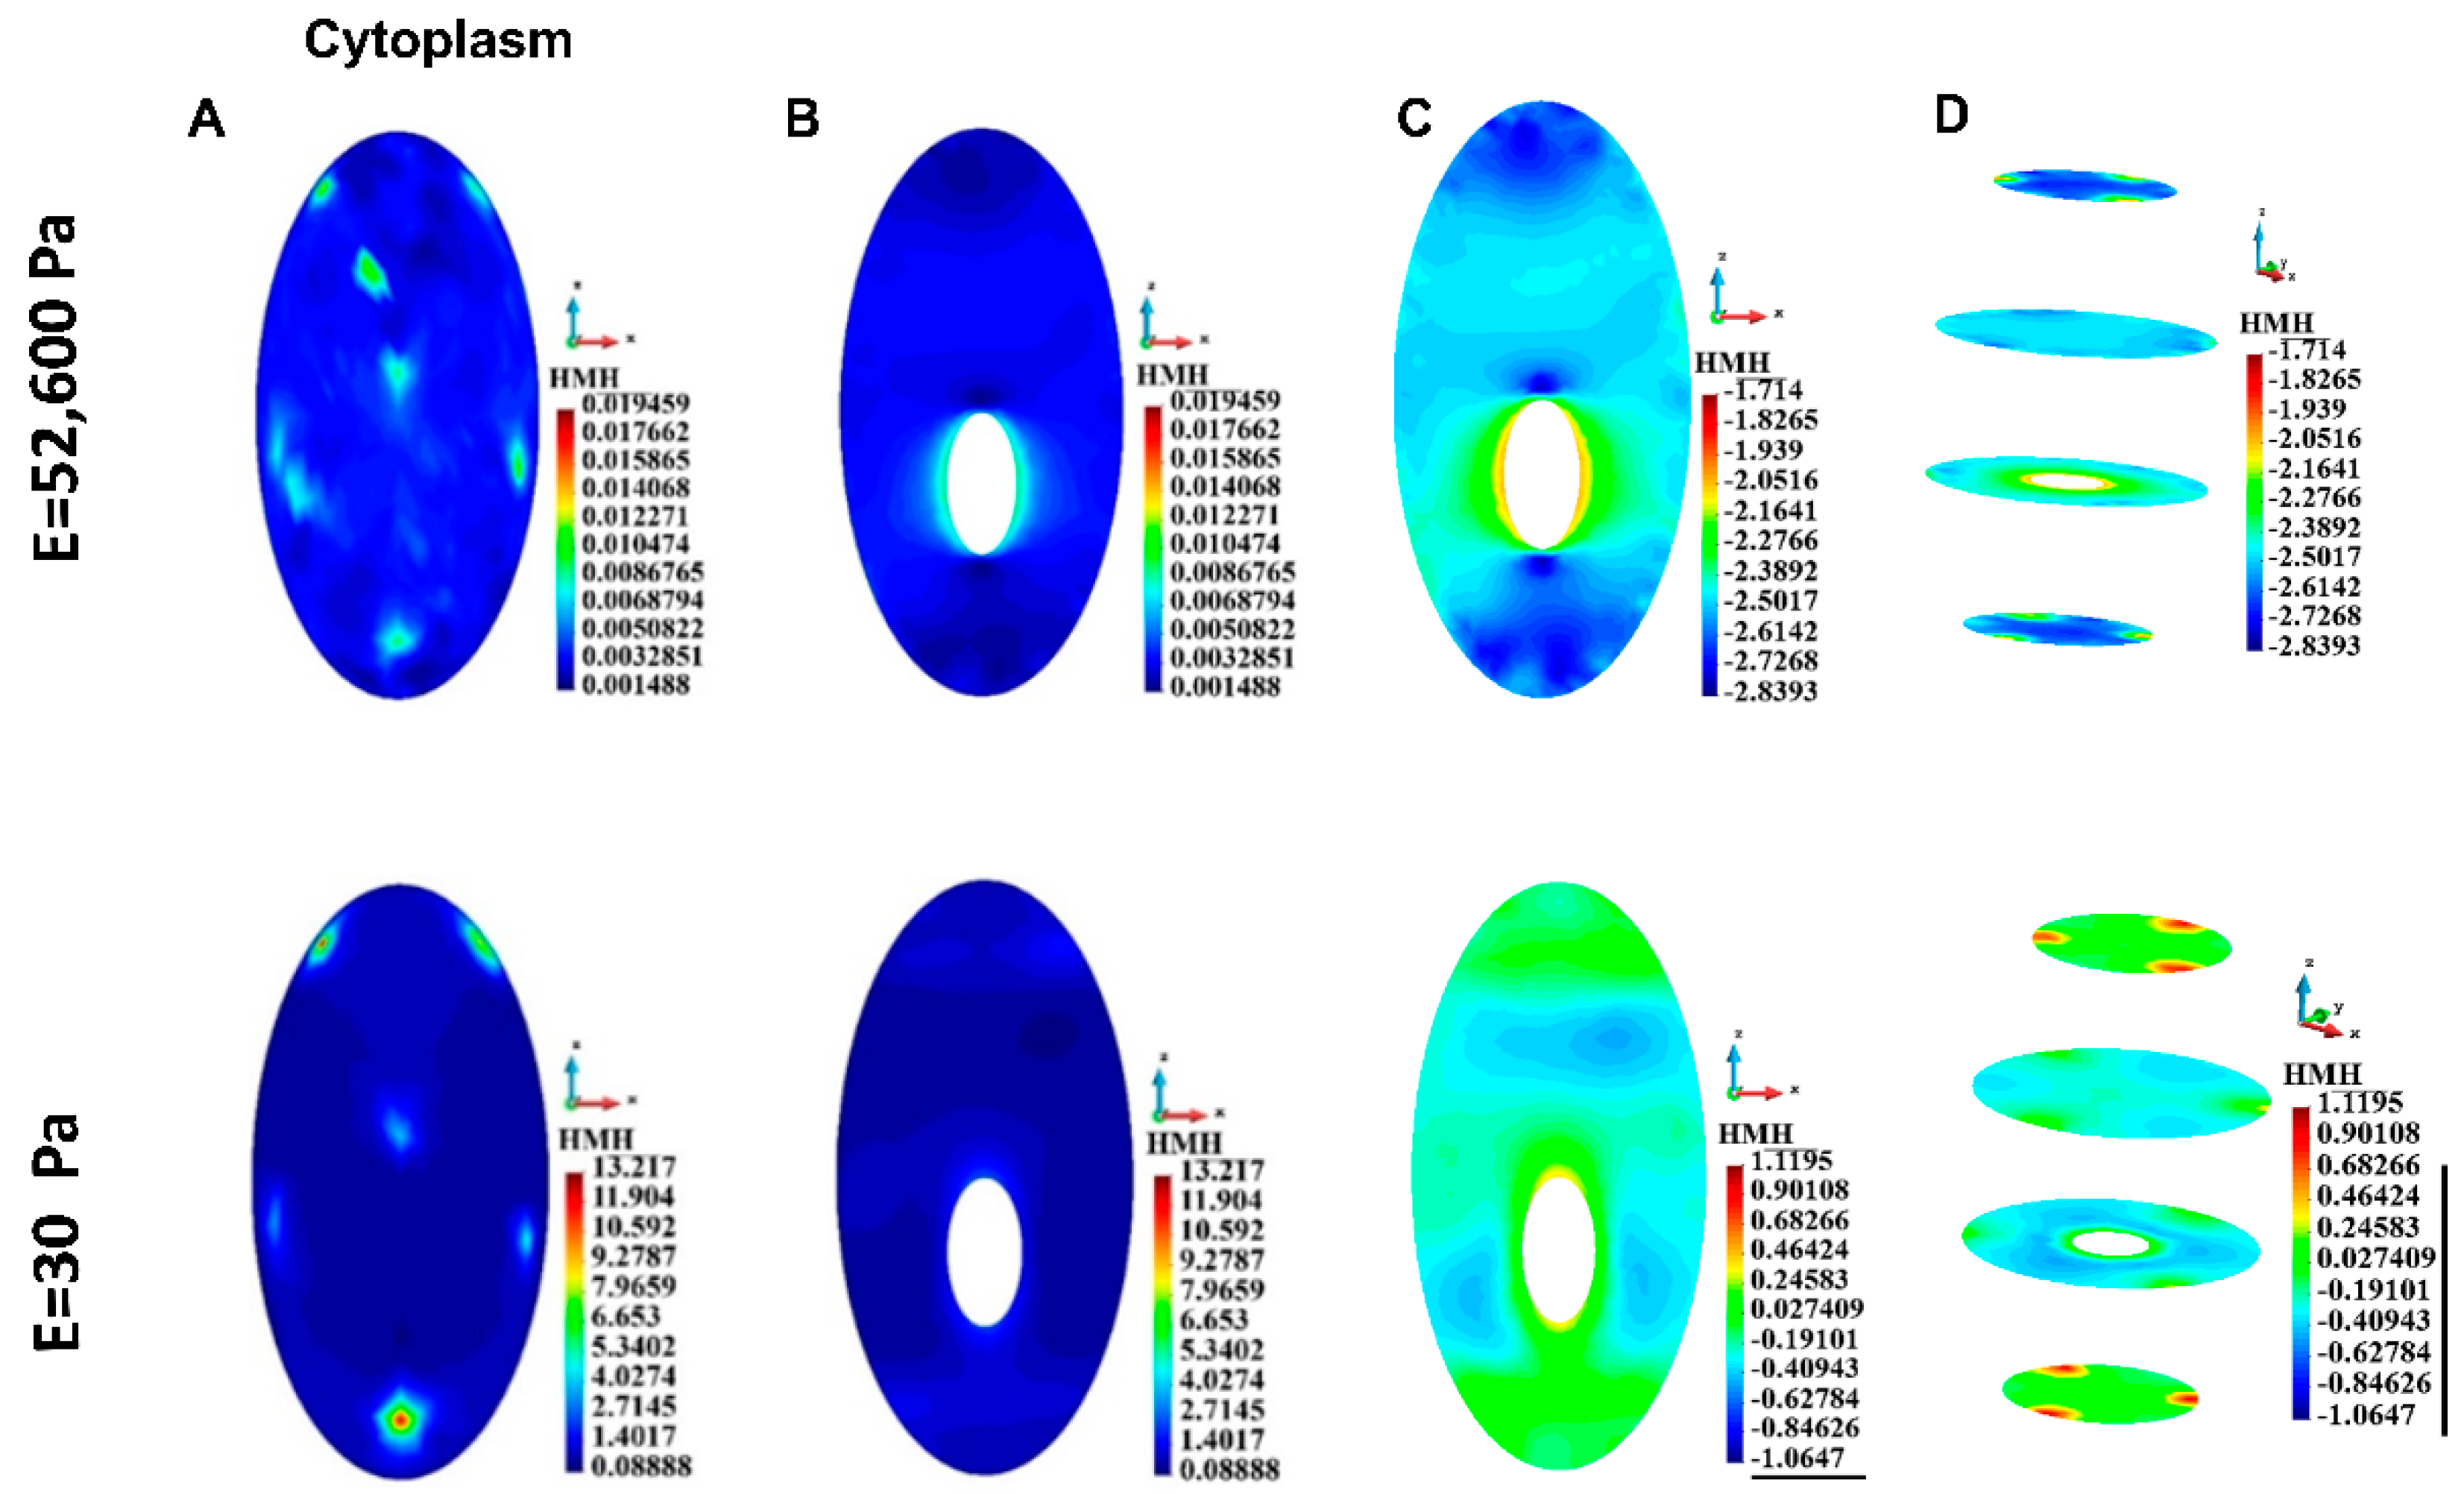
3.4.3. Cytoplasm
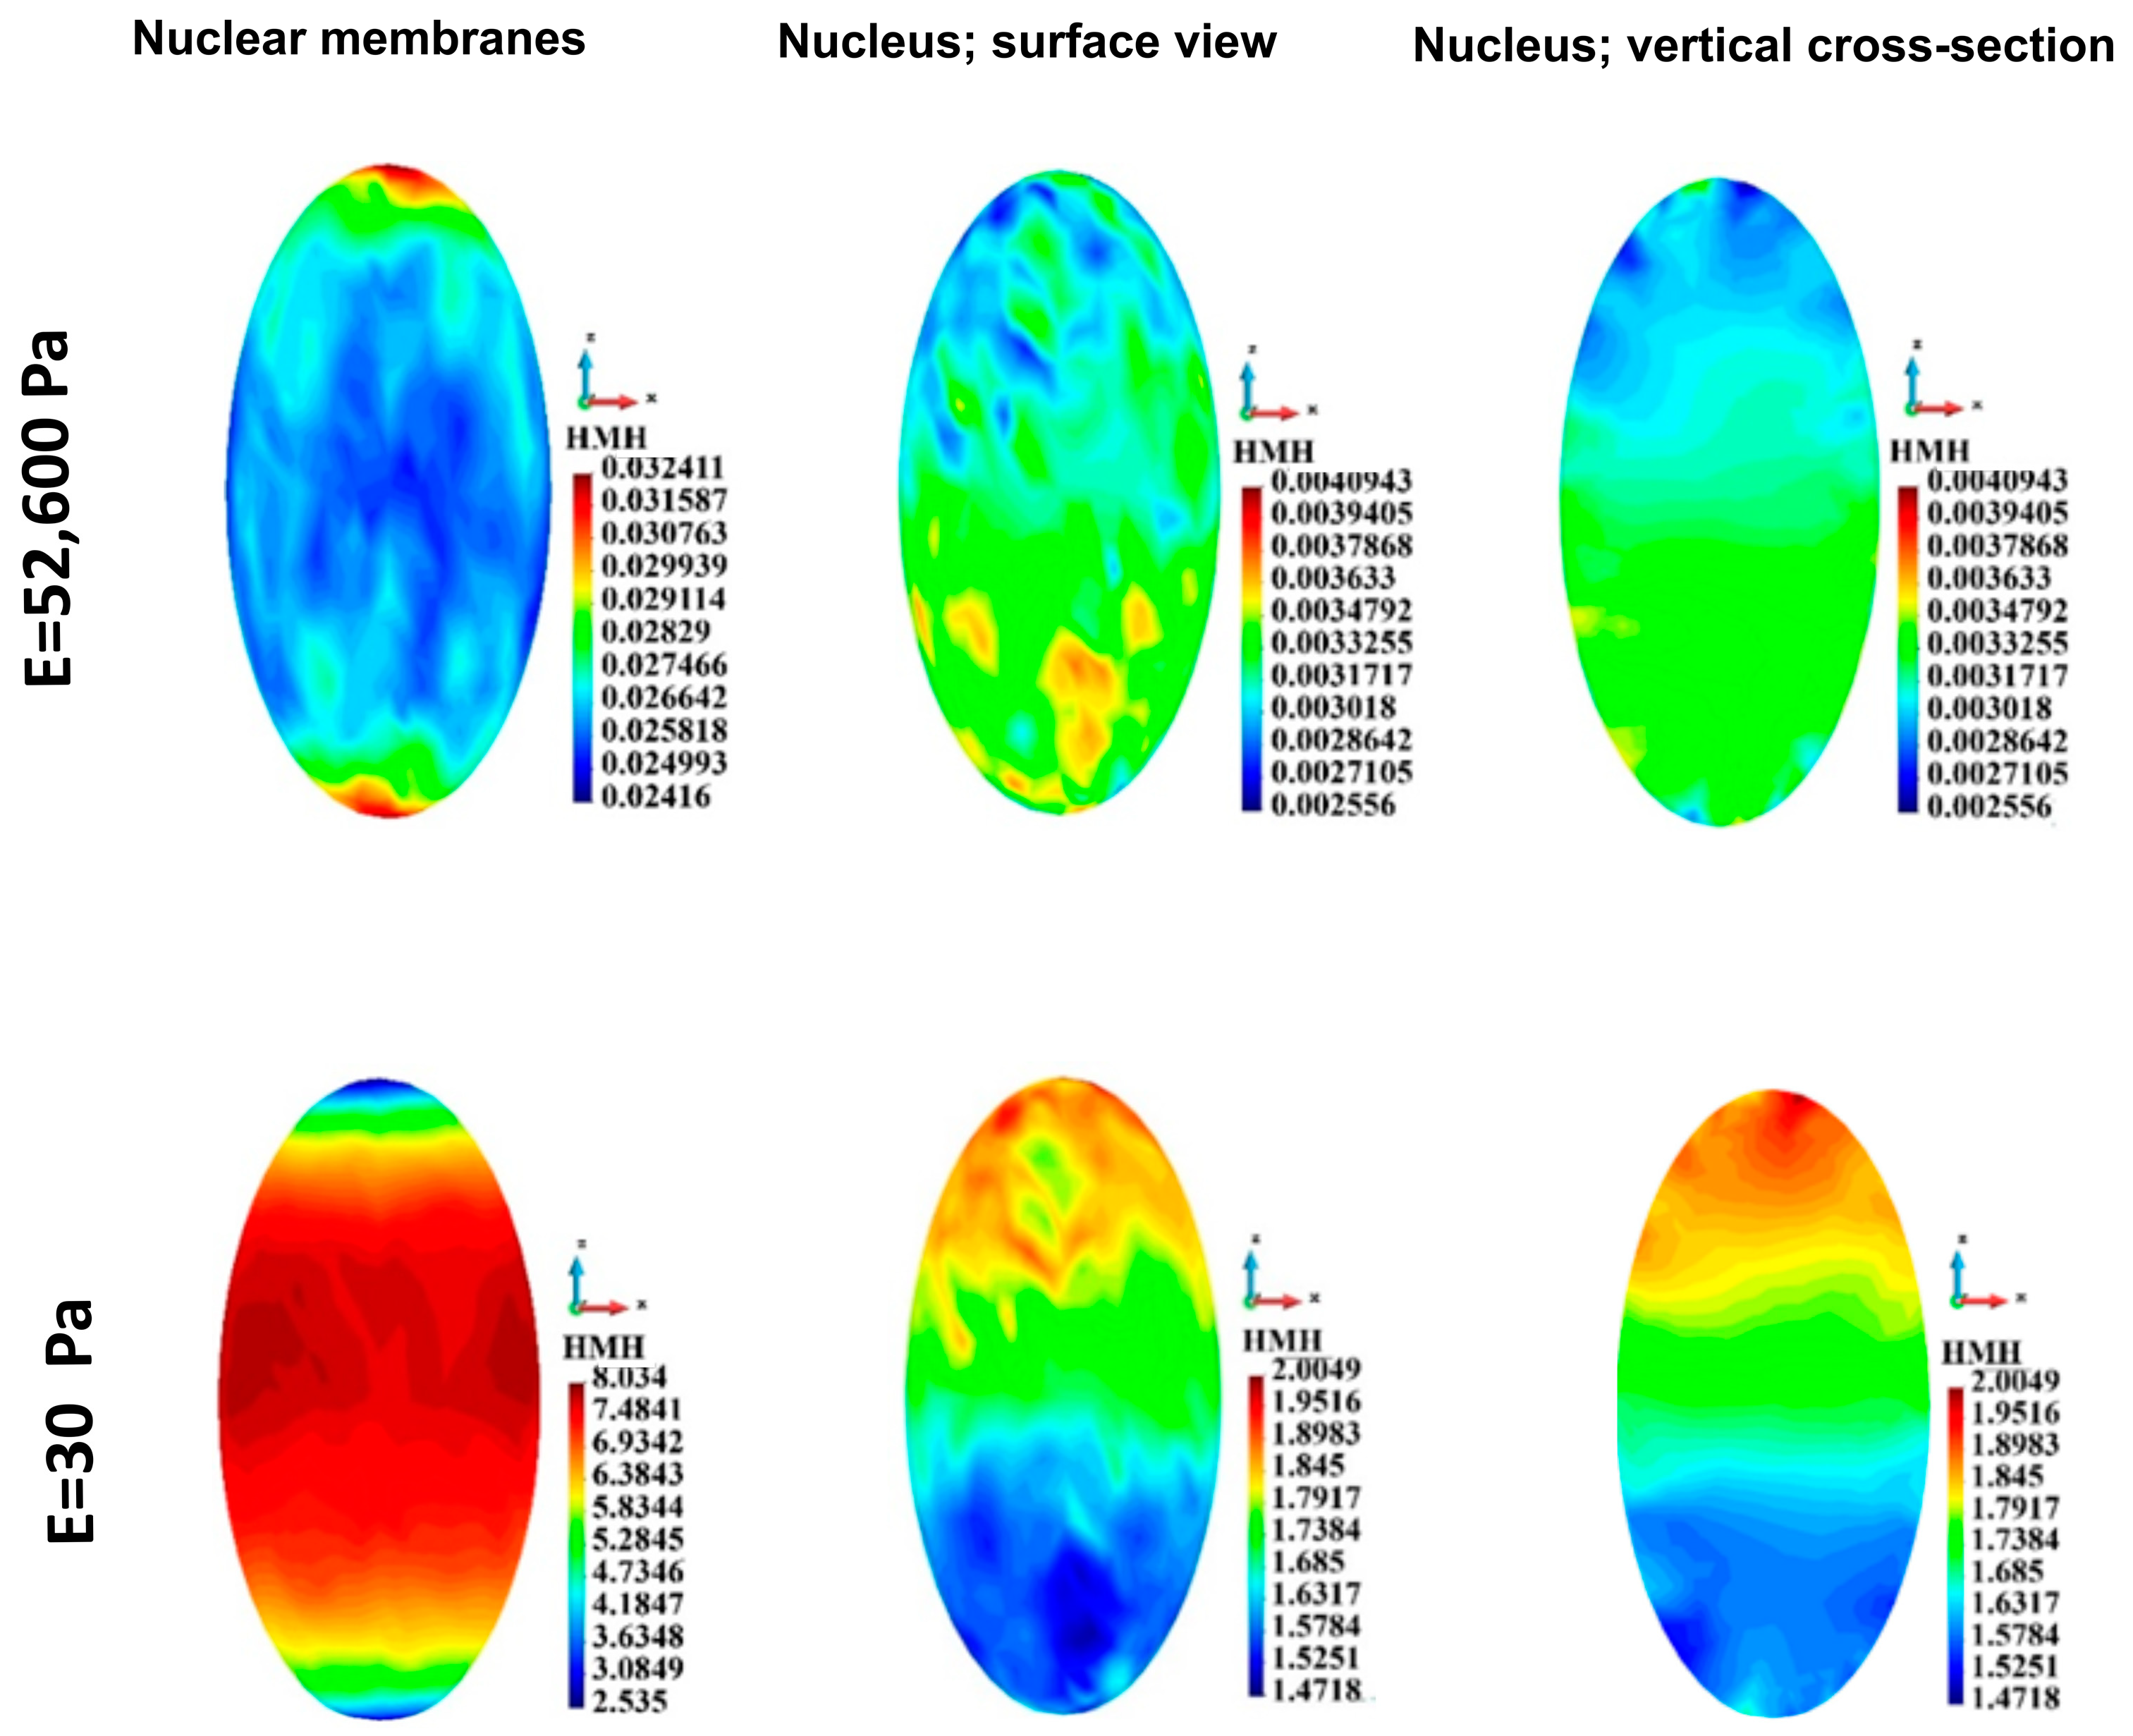
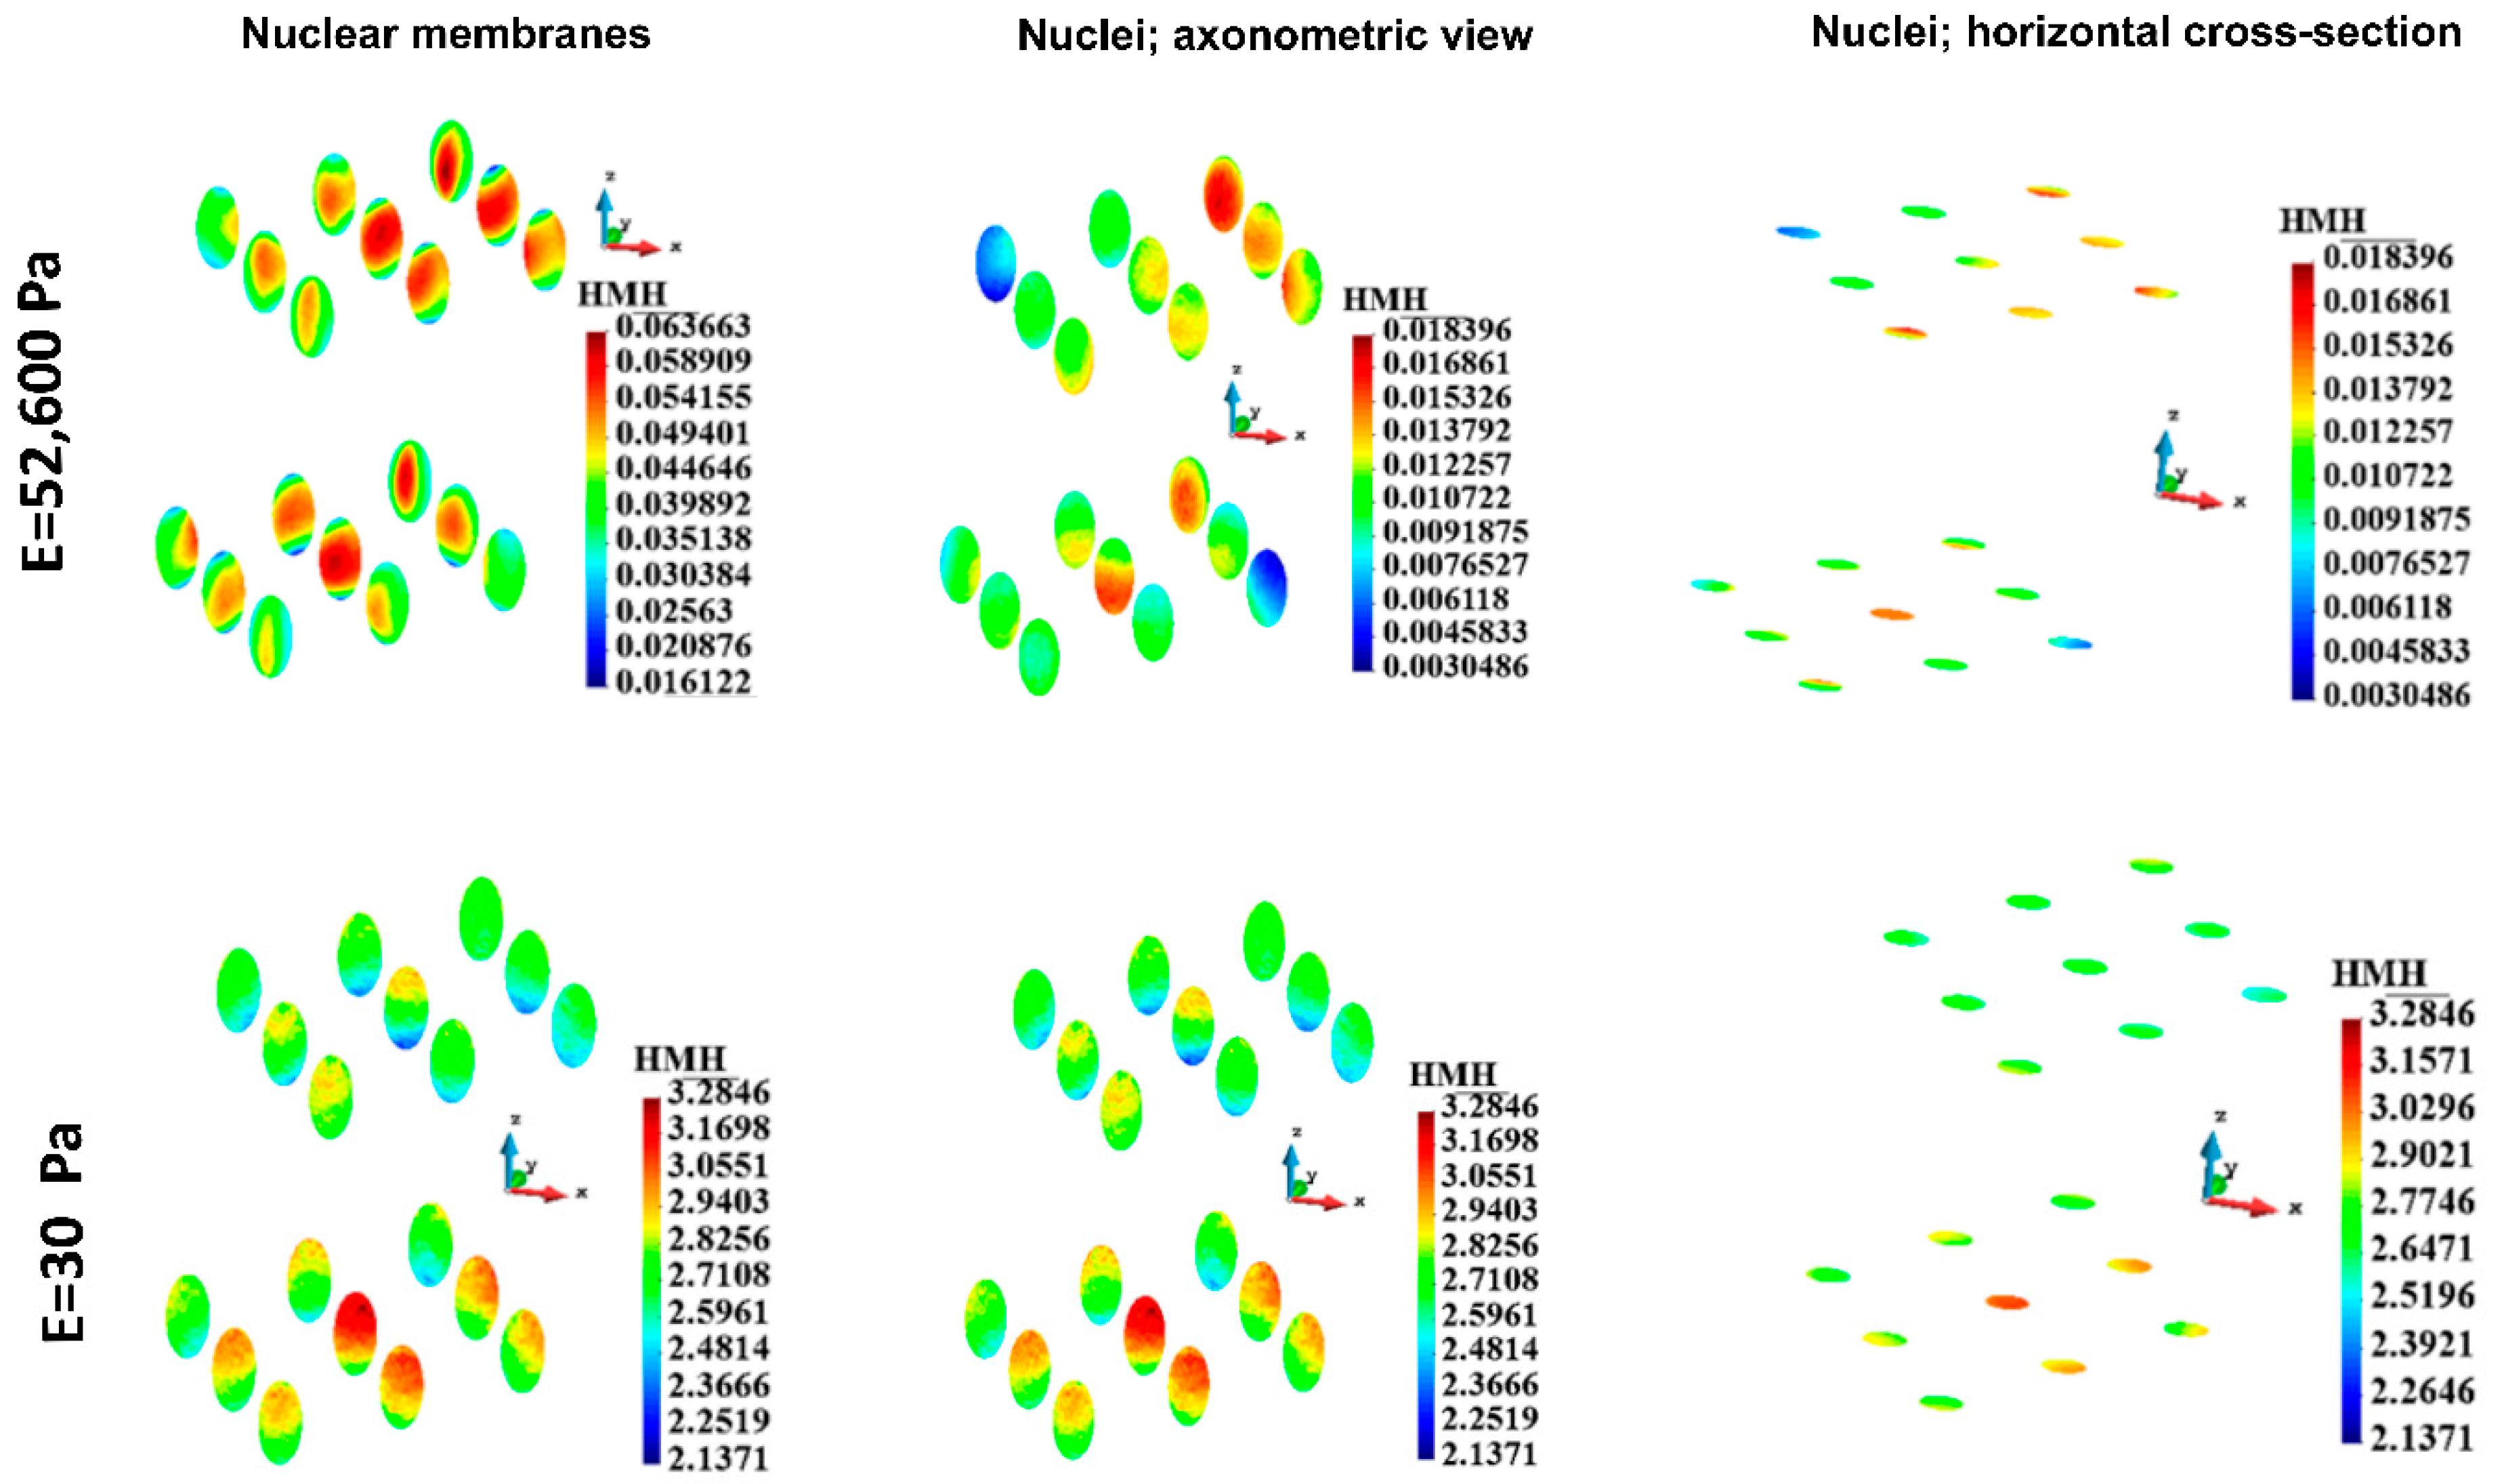
3.4.4. Nuclei Membranes
3.4.5. Nuclei
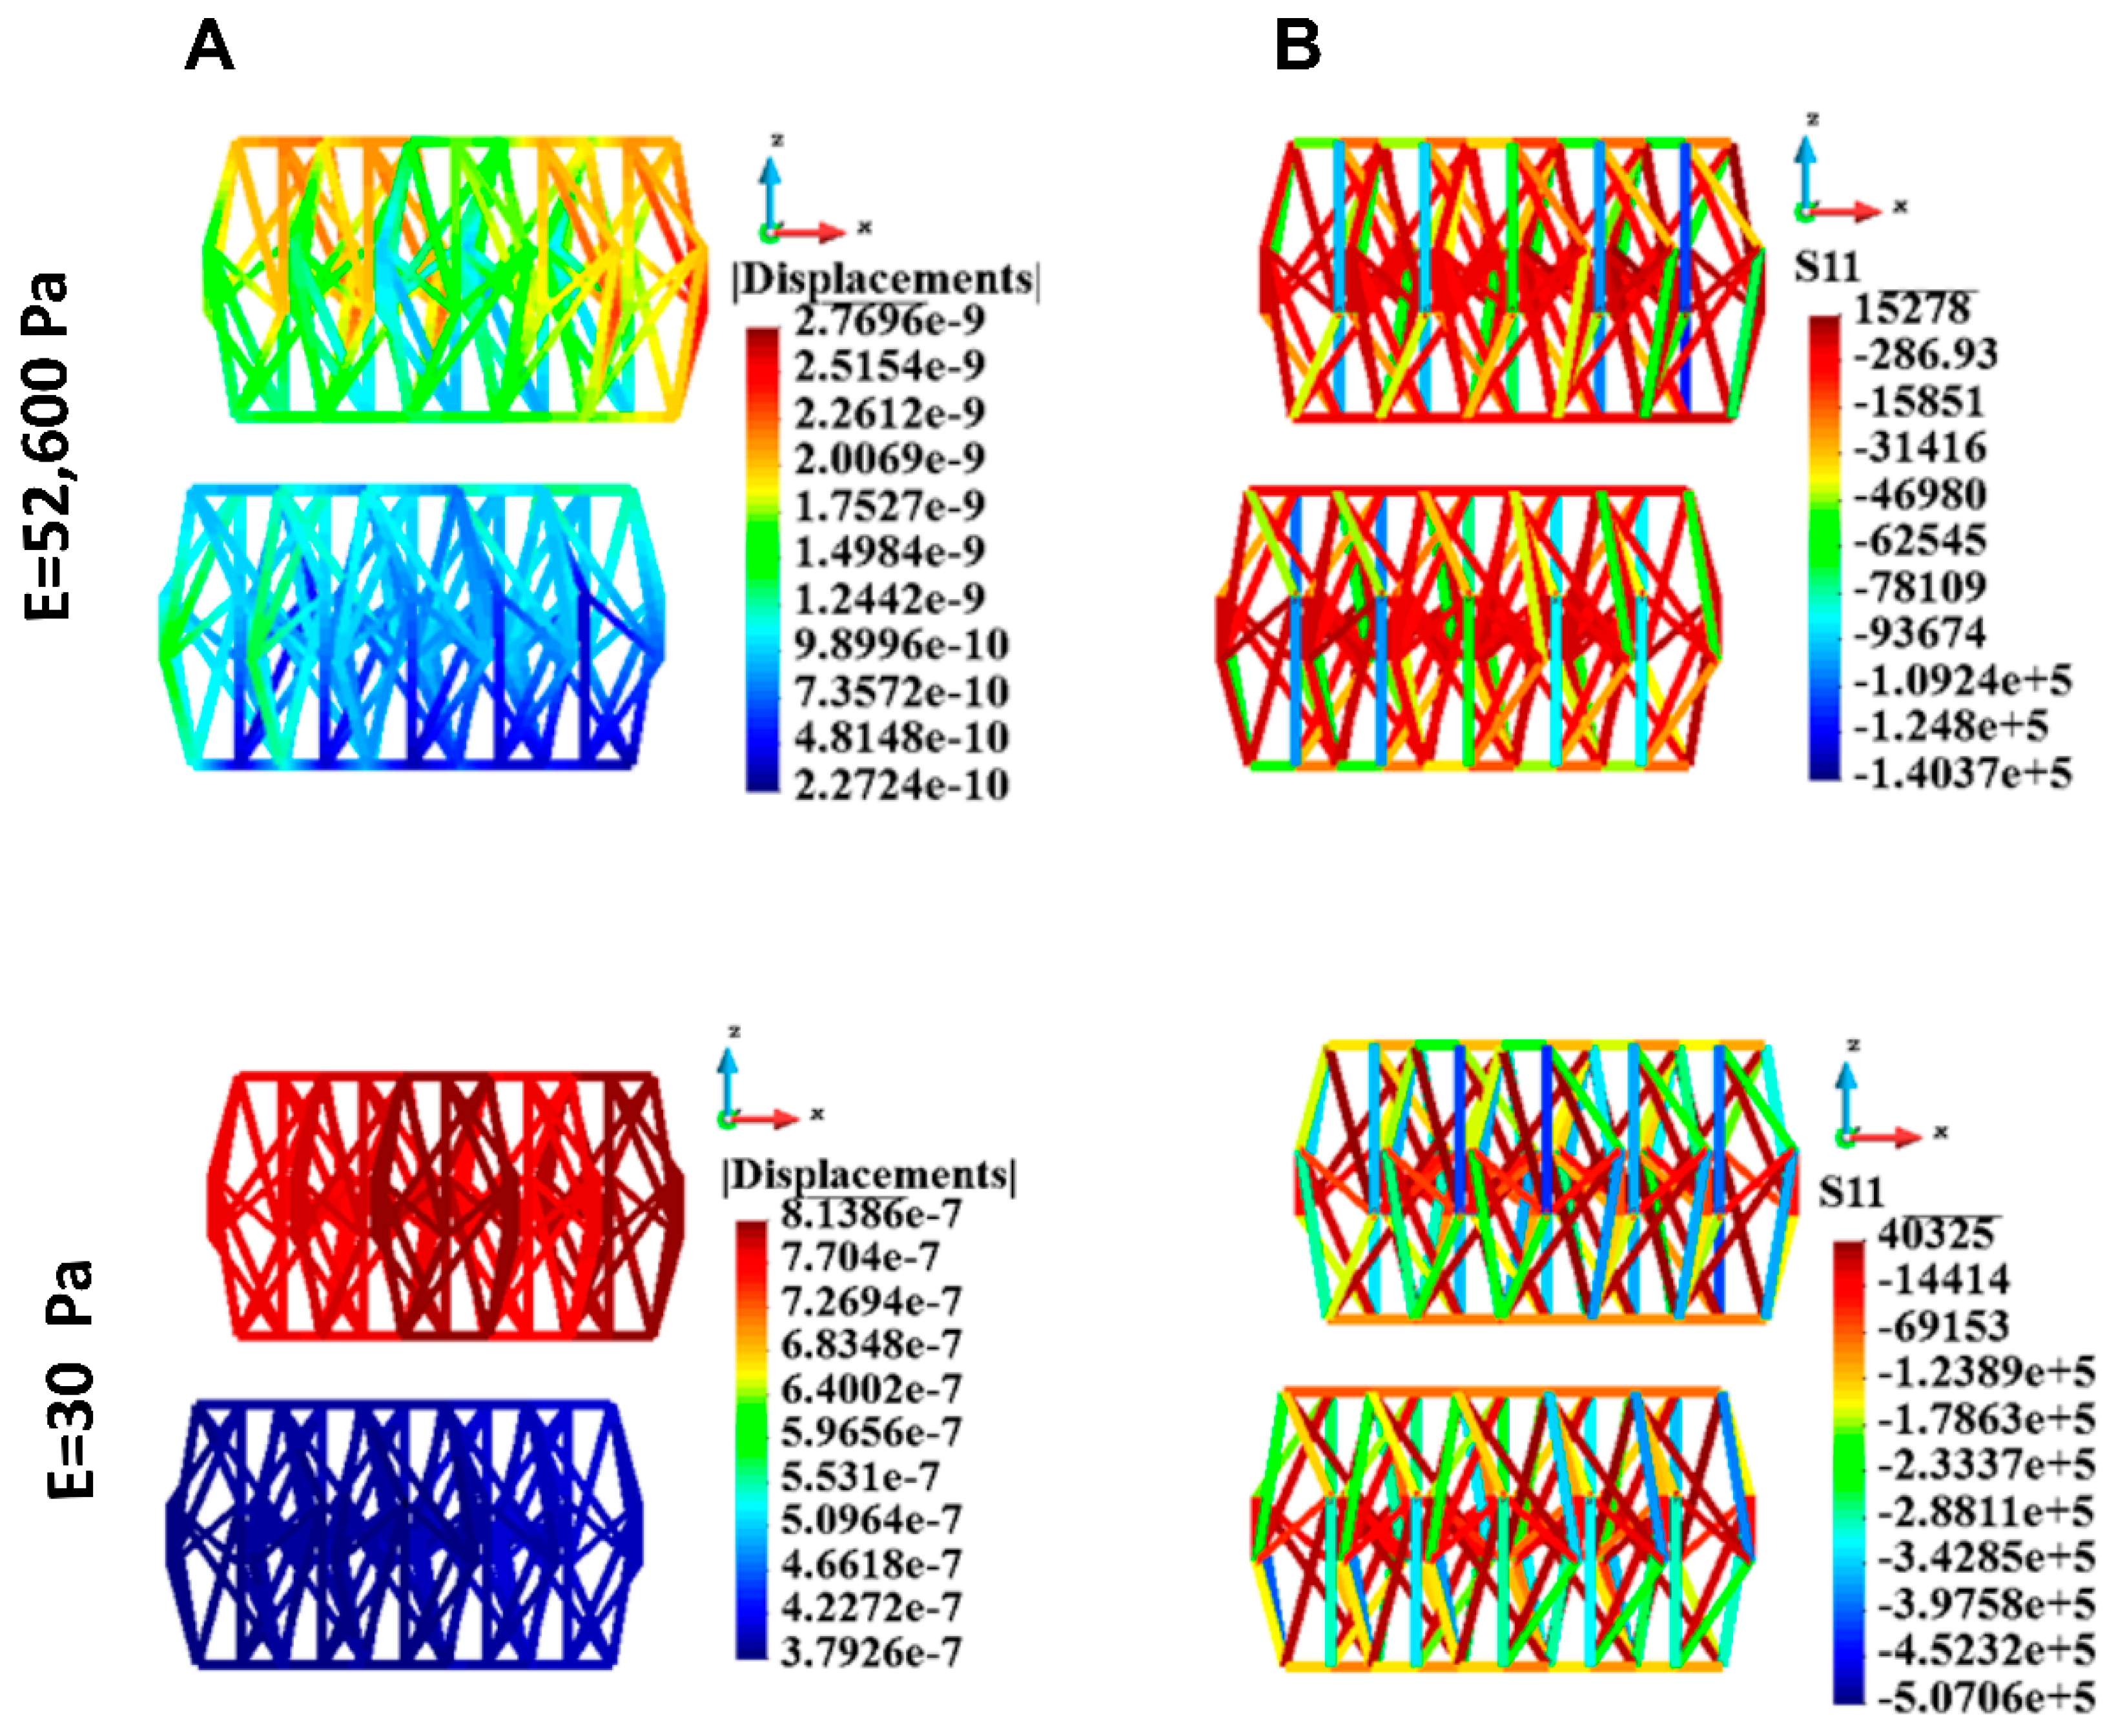
3.4.6. Cytoskeletons
4. Discussion
5. Conclusions
Supplementary Materials
Author Contributions
Funding
Institutional Review Board Statement
Informed Consent Statement
Data Availability Statement
Acknowledgments
Conflicts of Interest
References
- Van Zundert, I.; Fortuni, B.; Rocha, S. From 2D to 3D Cancer Cell Models-The Enigmas of Drug Delivery Research. Nanomaterials 2020, 10, 2236. [Google Scholar] [CrossRef] [PubMed]
- Karlsson, H.; Fryknas, M.; Larsson, R.; Nygren, P. Loss of cancer drug activity in colon cancer HCT-116 cells during spheroid formation in a new 3-D spheroid cell culture system. Exp. Cell Res. 2012, 318, 1577–1585. [Google Scholar] [CrossRef]
- Chen, L.; Xiao, Z.; Meng, Y.; Zhao, Y.; Han, J.; Su, G.; Chen, B.; Dai, J. The enhancement of cancer stem cell properties of MCF-7 cells in 3D collagen scaffolds for modeling of cancer and anti-cancer drugs. Biomaterials 2012, 33, 1437–1444. [Google Scholar] [CrossRef] [PubMed]
- Zhang, S.; Liu, P.; Chen, L.; Wang, Y.; Wang, Z.; Zhang, B. The effects of spheroid formation of adipose-derived stem cells in a microgravity bioreactor on stemness properties and therapeutic potential. Biomaterials 2015, 41, 15–25. [Google Scholar] [CrossRef]
- Pulze, L.; Congiu, T.; Brevini, T.A.L.; Grimaldi, A.; Tettamanti, G.; D’Antona, P.; Baranzini, N.; Acquati, F.; Ferraro, F.; de Eguileor, M. MCF7 Spheroid Development: New Insight about Spatio/Temporal Arrangements of TNTs, Amyloid Fibrils, Cell Connections, and Cellular Bridges. Int. J. Mol. Sci. 2020, 21, 5400. [Google Scholar] [CrossRef] [PubMed]
- Vahala, D.; Amos, S.E.; Sacchi, M.; Soliman, B.G.; Hepburn, M.S.; Mowla, A.; Li, J.; Jeong, J.H.; Astell, C.; Hwang, Y.; et al. 3D Volumetric Mechanosensation of MCF7 Breast Cancer Spheroids in a Linear Stiffness Gradient GelAGE. Adv. Healthc. Mater. 2023, 12, e2301506. [Google Scholar] [CrossRef]
- Melissaridou, S.; Wiechec, E.; Magan, M.; Jain, M.V.; Chung, M.K.; Farnebo, L.; Roberg, K. The effect of 2D and 3D cell cultures on treatment response, EMT profile and stem cell features in head and neck cancer. Cancer Cell Int. 2019, 19, 16. [Google Scholar] [CrossRef]
- Abuwatfa, W.H.; Pitt, W.G.; Husseini, G.A. Scaffold-based 3D cell culture models in cancer research. J. Biomed. Sci. 2024, 31, 7. [Google Scholar] [CrossRef] [PubMed]
- Sharma, K.; Dey, S.; Karmakar, R.; Rengan, A.K. A comprehensive review of 3D cancer models for drug screening and translational research. Cancer Innov. 2024, 3, e102. [Google Scholar] [CrossRef]
- Biju, T.S.; Priya, V.V.; Francis, A.P. Role of three-dimensional cell culture in therapeutics and diagnostics: An updated review. Drug Deliv. Transl. Res. 2023, 13, 2239–2253. [Google Scholar] [CrossRef] [PubMed]
- Yoshii, Y.; Waki, A.; Yoshida, K.; Kakezuka, A.; Kobayashi, M.; Namiki, H.; Kuroda, Y.; Kiyono, Y.; Yoshii, H.; Furukawa, T.; et al. The use of nanoimprinted scaffolds as 3D culture models to facilitate spontaneous tumor cell migration and well-regulated spheroid formation. Biomaterials 2011, 32, 6052–6058. [Google Scholar] [CrossRef] [PubMed]
- Rossi, M.; Blasi, P. Multicellular Tumor Spheroids in Nanomedicine Research: A Perspective. Front. Med. Technol. 2022, 4, 909943. [Google Scholar] [CrossRef] [PubMed]
- Rebelo, S.P.; Pinto, C.; Martins, T.R.; Harrer, N.; Estrada, M.F.; Loza-Alvarez, P.; Cabecadas, J.; Alves, P.M.; Gualda, E.J.; Sommergruber, W.; et al. 3D-3-culture: A tool to unveil macrophage plasticity in the tumour microenvironment. Biomaterials 2018, 163, 185–197. [Google Scholar] [CrossRef] [PubMed]
- Souza, G.R.; Molina, J.R.; Raphael, R.M.; Ozawa, M.G.; Stark, D.J.; Levin, C.S.; Bronk, L.F.; Ananta, J.S.; Mandelin, J.; Georgescu, M.M.; et al. Three-dimensional tissue culture based on magnetic cell levitation. Nat. Nanotechnol. 2010, 5, 291–296. [Google Scholar] [CrossRef] [PubMed]
- Kurzyk, A.; Szumera-Cieckiewicz, A.; Miloszewska, J.; Chechlinska, M. 3D modeling of normal skin and cutaneous squamous cell carcinoma. A comparative study in 2D cultures, spheroids, and 3D bioprinted systems. Biofabrication 2024, 16, 025021. [Google Scholar] [CrossRef]
- Grzybowska, E.A.; Zayat, V.; Konopinski, R.; Trebinska, A.; Szwarc, M.; Sarnowska, E.; Macech, E.; Korczynski, J.; Knapp, A.; Siedlecki, J.A. HAX-1 is a nucleocytoplasmic shuttling protein with a possible role in mRNA processing. FEBS J. 2013, 280, 256–272. [Google Scholar] [CrossRef]
- Zienkiewicz, O.; Taylor, R.L. The Finite Element Method: Its Basis and Fundamentals, 7th ed.; Butterworth-Heinemann: Oxford, UK, 2013. [Google Scholar] [CrossRef]
- Bathe, K.J. Finite Element Procedures; Prentice Hall: Upper Saddle River, NJ, USA, 1996. [Google Scholar]
- Kleiber, M. Incremental Finite Element Modelling in Non-Linear Solid Mechanics; Polish Scientific Publishers, Warsaw Poland and Ellis Horwood Series in Mechanical Engineering: Chichester, UK, 1989. [Google Scholar]
- Mofrad, M.R.; Kamm, R.D. (Eds.) Cytoskeletal Mechanics: Models and Measurements; Cambridge University Press: Cambridge, UK, 2006. [Google Scholar] [CrossRef]
- Postek, E. Parameter sensitivity of a monolayer tensegrity model of tissues. J. Coupled Syst. Multiscale Dyn. 2014, 2, 179–187. [Google Scholar] [CrossRef]
- Fung, Y.C. Foundations of Solid Mechanics, 2nd ed.; Prentice Hall: Hoboken, NJ, USA, 1965. [Google Scholar]
- McGarry, J.G.; Prendergast, P.J. A three-dimensional finite element model of an adherent eukaryotic cell. Eur. Cell Mater. 2004, 7, 27–33, discussion 33–24. [Google Scholar] [CrossRef] [PubMed]
- Postek, E.; Sadowski, T. Thermomechanical effects during impact testing of WC/Co composite material. Compos. Struct. 2020, 241, 112054. [Google Scholar] [CrossRef]
- Schmid, R.; Schmidt, S.K.; Schrufer, S.; Schubert, D.W.; Heltmann-Meyer, S.; Schicht, M.; Paulsen, F.; Horch, R.E.; Bosserhoff, A.K.; Kengelbach-Weigand, A.; et al. A vascularized in vivo melanoma model suitable for metastasis research of different tumor stages using fundamentally different bioinks. Mater. Today Bio 2024, 26, 101071. [Google Scholar] [CrossRef] [PubMed]
- Gittes, F.; Mickey, B.; Nettleton, J.; Howard, J. Flexural rigidity of microtubules and actin filaments measured from thermal fluctuations in shape. J. Cell Biol. 1993, 120, 923–934. [Google Scholar] [CrossRef] [PubMed]
- Guilak, F.; Mow, V.C. The mechanical environment of the chondrocyte: A biphasic finite element model of cell–matrix interactions in articular cartilage. J. Biomech. 2000, 33, 1663–1673. [Google Scholar] [CrossRef] [PubMed]
- Shin, D.; Athanasiou, K. Cytoindentation for obtaining cell biomechanical properties. J. Orthop. Res. 1999, 17, 880–890. [Google Scholar] [CrossRef] [PubMed]
- Guilak, F.; Tedrow, J.R.; Burgkart, R. Viscoelastic properties of the cell nucleus. Biochem. Biophys. Res. Commun. 2000, 269, 781–786. [Google Scholar] [CrossRef]
- Luca, A.C.; Mersch, S.; Deenen, R.; Schmidt, S.; Messner, I.; Schafer, K.L.; Baldus, S.E.; Huckenbeck, W.; Piekorz, R.P.; Knoefel, W.T.; et al. Impact of the 3D microenvironment on phenotype, gene expression, and EGFR inhibition of colorectal cancer cell lines. PLoS ONE 2013, 8, e59689. [Google Scholar] [CrossRef]
- Kiss, D.L.; Windus, L.C.; Avery, V.M. Chemokine receptor expression on integrin-mediated stellate projections of prostate cancer cells in 3D culture. Cytokine 2013, 64, 122–130. [Google Scholar] [CrossRef]
- Xu, X.; Farach-Carson, M.C.; Jia, X. Three-dimensional in vitro tumor models for cancer research and drug evaluation. Biotechnol. Adv. 2014, 32, 1256–1268. [Google Scholar] [CrossRef]
- Imamura, Y.; Mukohara, T.; Shimono, Y.; Funakoshi, Y.; Chayahara, N.; Toyoda, M.; Kiyota, N.; Takao, S.; Kono, S.; Nakatsura, T.; et al. Comparison of 2D- and 3D-culture models as drug-testing platforms in breast cancer. Oncol. Rep. 2015, 33, 1837–1843. [Google Scholar] [CrossRef]
- Jia, W.; Jiang, X.; Liu, W.; Wang, L.; Zhu, B.; Zhu, H.; Liu, X.; Zhong, M.; Xie, D.; Huang, W.; et al. Effects of three-dimensional collagen scaffolds on the expression profiles and biological functions of glioma cells. Int. J. Oncol. 2018, 52, 1787–1800. [Google Scholar] [CrossRef]
- Wang, Y.; Mirza, S.; Wu, S.; Zeng, J.; Shi, W.; Band, H.; Band, V.; Duan, B. 3D hydrogel breast cancer models for studying the effects of hypoxia on epithelial to mesenchymal transition. Oncotarget 2018, 9, 32191–32203. [Google Scholar] [CrossRef]
- Qi, X.; Prokhorova, A.V.; Mezentsev, A.V.; Shen, N.; Trofimenko, A.V.; Filkov, G.I.; Sulimanov, R.A.; Makarov, V.A.; Durymanov, M.O. Comparison of EMT-Related and Multi-Drug Resistant Gene Expression, Extracellular Matrix Production, and Drug Sensitivity in NSCLC Spheroids Generated by Scaffold-Free and Scaffold-Based Methods. Int. J. Mol. Sci. 2022, 23, 13306. [Google Scholar] [CrossRef]
- Buckley, C.D.; Tan, J.; Anderson, K.L.; Hanein, D.; Volkmann, N.; Weis, W.I.; Nelson, W.J.; Dunn, A.R. Cell adhesion. The minimal cadherin-catenin complex binds to actin filaments under force. Science 2014, 346, 1254211. [Google Scholar] [CrossRef] [PubMed]
- Verma, D.; Bajpai, V.K.; Ye, N.; Maneshi, M.M.; Jetta, D.; Andreadis, S.T.; Sachs, F.; Hua, S.Z. Flow induced adherens junction remodeling driven by cytoskeletal forces. Exp. Cell Res. 2017, 359, 327–336. [Google Scholar] [CrossRef] [PubMed]
- Aceto, N.; Bardia, A.; Miyamoto, D.T.; Donaldson, M.C.; Wittner, B.S.; Spencer, J.A.; Yu, M.; Pely, A.; Engstrom, A.; Zhu, H.; et al. Circulating tumor cell clusters are oligoclonal precursors of breast cancer metastasis. Cell 2014, 158, 1110–1122. [Google Scholar] [CrossRef]
- Rozenberg, J.M.; Buzdin, A.A.; Mohammad, T.; Rakitina, O.A.; Didych, D.A.; Pleshkan, V.V.; Alekseenko, I.V. Molecules promoting circulating clusters of cancer cells suggest novel therapeutic targets for treatment of metastatic cancers. Front. Immunol. 2023, 14, 1099921. [Google Scholar] [CrossRef] [PubMed]
- Schrader, J.; Gordon-Walker, T.T.; Aucott, R.L.; van Deemter, M.; Quaas, A.; Walsh, S.; Benten, D.; Forbes, S.J.; Wells, R.G.; Iredale, J.P. Matrix stiffness modulates proliferation, chemotherapeutic response, and dormancy in hepatocellular carcinoma cells. Hepatology 2011, 53, 1192–1205. [Google Scholar] [CrossRef]
- Zustiak, S.; Nossal, R.; Sackett, D.L. Multiwell stiffness assay for the study of cell responsiveness to cytotoxic drugs. Biotechnol. Bioeng. 2014, 111, 396–403. [Google Scholar] [CrossRef] [PubMed]
- Nguyen, T.V.; Sleiman, M.; Moriarty, T.; Herrick, W.G.; Peyton, S.R. Sorafenib resistance and JNK signaling in carcinoma during extracellular matrix stiffening. Biomaterials 2014, 35, 5749–5759. [Google Scholar] [CrossRef] [PubMed]


| Cell Element | Young Modulus (E) (Pa) | Poisson Ratio (v) | Area (m2) | Thickness (m) |
|---|---|---|---|---|
| Actin [26] | 2.6 × 10⁹ | 18.0 × 10⁻¹⁸ [23] | ||
| Microtubules [26] | 1.2 × 10⁹ | 190.0 × 10⁻¹⁸ [23] | ||
| Cytoplasm [27] | 100.0 | 0.37 [28] | ||
| Nucleus [29] | 400.0 | 0.37 [28] | ||
| Cortex | 1000.0 | 0.3 | 6.0 × 10⁻⁹ | |
| Nucleus membrane | 1000.0 | 0.3 | 6.0 × 10⁻⁹ | |
| ECM | 56,200 (stiff) 30.0 Pa (soft) | 0.4777 |
| Case | Stiff ECM (Pa) | Soft ECM (Pa) |
|---|---|---|
| 1 cell | 9.14 | 4.19 |
| 18 cells | 97.03 | 19.35 |
| Case | Stiff ECM (Pa) | Soft ECM (Pa) |
|---|---|---|
| 1 cell | 0.13 | 96.60 |
| 18 cells | 8.13 | 439.21 |
| Case | Stiff ECM (Pa) | Soft ECM (Pa) |
|---|---|---|
| 1 cell | 0.02 | 13.22 |
| 18 cells | 0.77 | 64.24 |
| Case | Stiff ECM (Pa) | Soft ECM (Pa) |
|---|---|---|
| 1 cell | 0.032 | 8.034 |
| 18 cells | 0.063 | 3.28 |
| Case | Stiff ECM (Pa) | Soft ECM (Pa) |
|---|---|---|
| 1 cell | 0.04 | 2.00 |
| 18 cells | 0.018 | 3.28 |
| Case | Stiff ECM | Soft ECM | ||
|---|---|---|---|---|
| S11 Max | S11 Min | S11 Max | S11 Min | |
| 1 cell | 27,808.0 | −1.28 × 10⁵ | 71,423.0 | −8.98 × 10⁵ |
| 18 cells | 15,278.0 | −1.40 × 10⁵ | 40,325.0 | −5.07 × 10⁵ |
Disclaimer/Publisher’s Note: The statements, opinions and data contained in all publications are solely those of the individual author(s) and contributor(s) and not of MDPI and/or the editor(s). MDPI and/or the editor(s) disclaim responsibility for any injury to people or property resulting from any ideas, methods, instructions or products referred to in the content. |
© 2025 by the authors. Licensee MDPI, Basel, Switzerland. This article is an open access article distributed under the terms and conditions of the Creative Commons Attribution (CC BY) license (https://creativecommons.org/licenses/by/4.0/).
Share and Cite
Szostakowska-Rodzoś, M.; Chmielarczyk, M.; Zacharska, W.; Fabisiewicz, A.; Kurzyk, A.; Myśliwy, I.; Kozaryna, Z.; Postek, E.; Grzybowska, E.A. Plasticity of Expression of Stem Cell and EMT Markers in Breast Cancer Cells in 2D and 3D Culture Depend on the Spatial Parameters of Cell Growth; Mathematical Modeling of Mechanical Stress in Cell Culture in Relation to ECM Stiffness. Bioengineering 2025, 12, 147. https://doi.org/10.3390/bioengineering12020147
Szostakowska-Rodzoś M, Chmielarczyk M, Zacharska W, Fabisiewicz A, Kurzyk A, Myśliwy I, Kozaryna Z, Postek E, Grzybowska EA. Plasticity of Expression of Stem Cell and EMT Markers in Breast Cancer Cells in 2D and 3D Culture Depend on the Spatial Parameters of Cell Growth; Mathematical Modeling of Mechanical Stress in Cell Culture in Relation to ECM Stiffness. Bioengineering. 2025; 12(2):147. https://doi.org/10.3390/bioengineering12020147
Chicago/Turabian StyleSzostakowska-Rodzoś, Małgorzata, Mateusz Chmielarczyk, Weronika Zacharska, Anna Fabisiewicz, Agata Kurzyk, Izabella Myśliwy, Zofia Kozaryna, Eligiusz Postek, and Ewa A. Grzybowska. 2025. "Plasticity of Expression of Stem Cell and EMT Markers in Breast Cancer Cells in 2D and 3D Culture Depend on the Spatial Parameters of Cell Growth; Mathematical Modeling of Mechanical Stress in Cell Culture in Relation to ECM Stiffness" Bioengineering 12, no. 2: 147. https://doi.org/10.3390/bioengineering12020147
APA StyleSzostakowska-Rodzoś, M., Chmielarczyk, M., Zacharska, W., Fabisiewicz, A., Kurzyk, A., Myśliwy, I., Kozaryna, Z., Postek, E., & Grzybowska, E. A. (2025). Plasticity of Expression of Stem Cell and EMT Markers in Breast Cancer Cells in 2D and 3D Culture Depend on the Spatial Parameters of Cell Growth; Mathematical Modeling of Mechanical Stress in Cell Culture in Relation to ECM Stiffness. Bioengineering, 12(2), 147. https://doi.org/10.3390/bioengineering12020147