
Bilateral Asymmetries of Plantar Pressure and Foot Balance During Walking, Running, and Turning Gait in Typically Developing Children

 , ,
, ,  ,
,  ,
,  and
and 
Abstract
1. Introduction
2. Materials and Methods
2.1. Participants
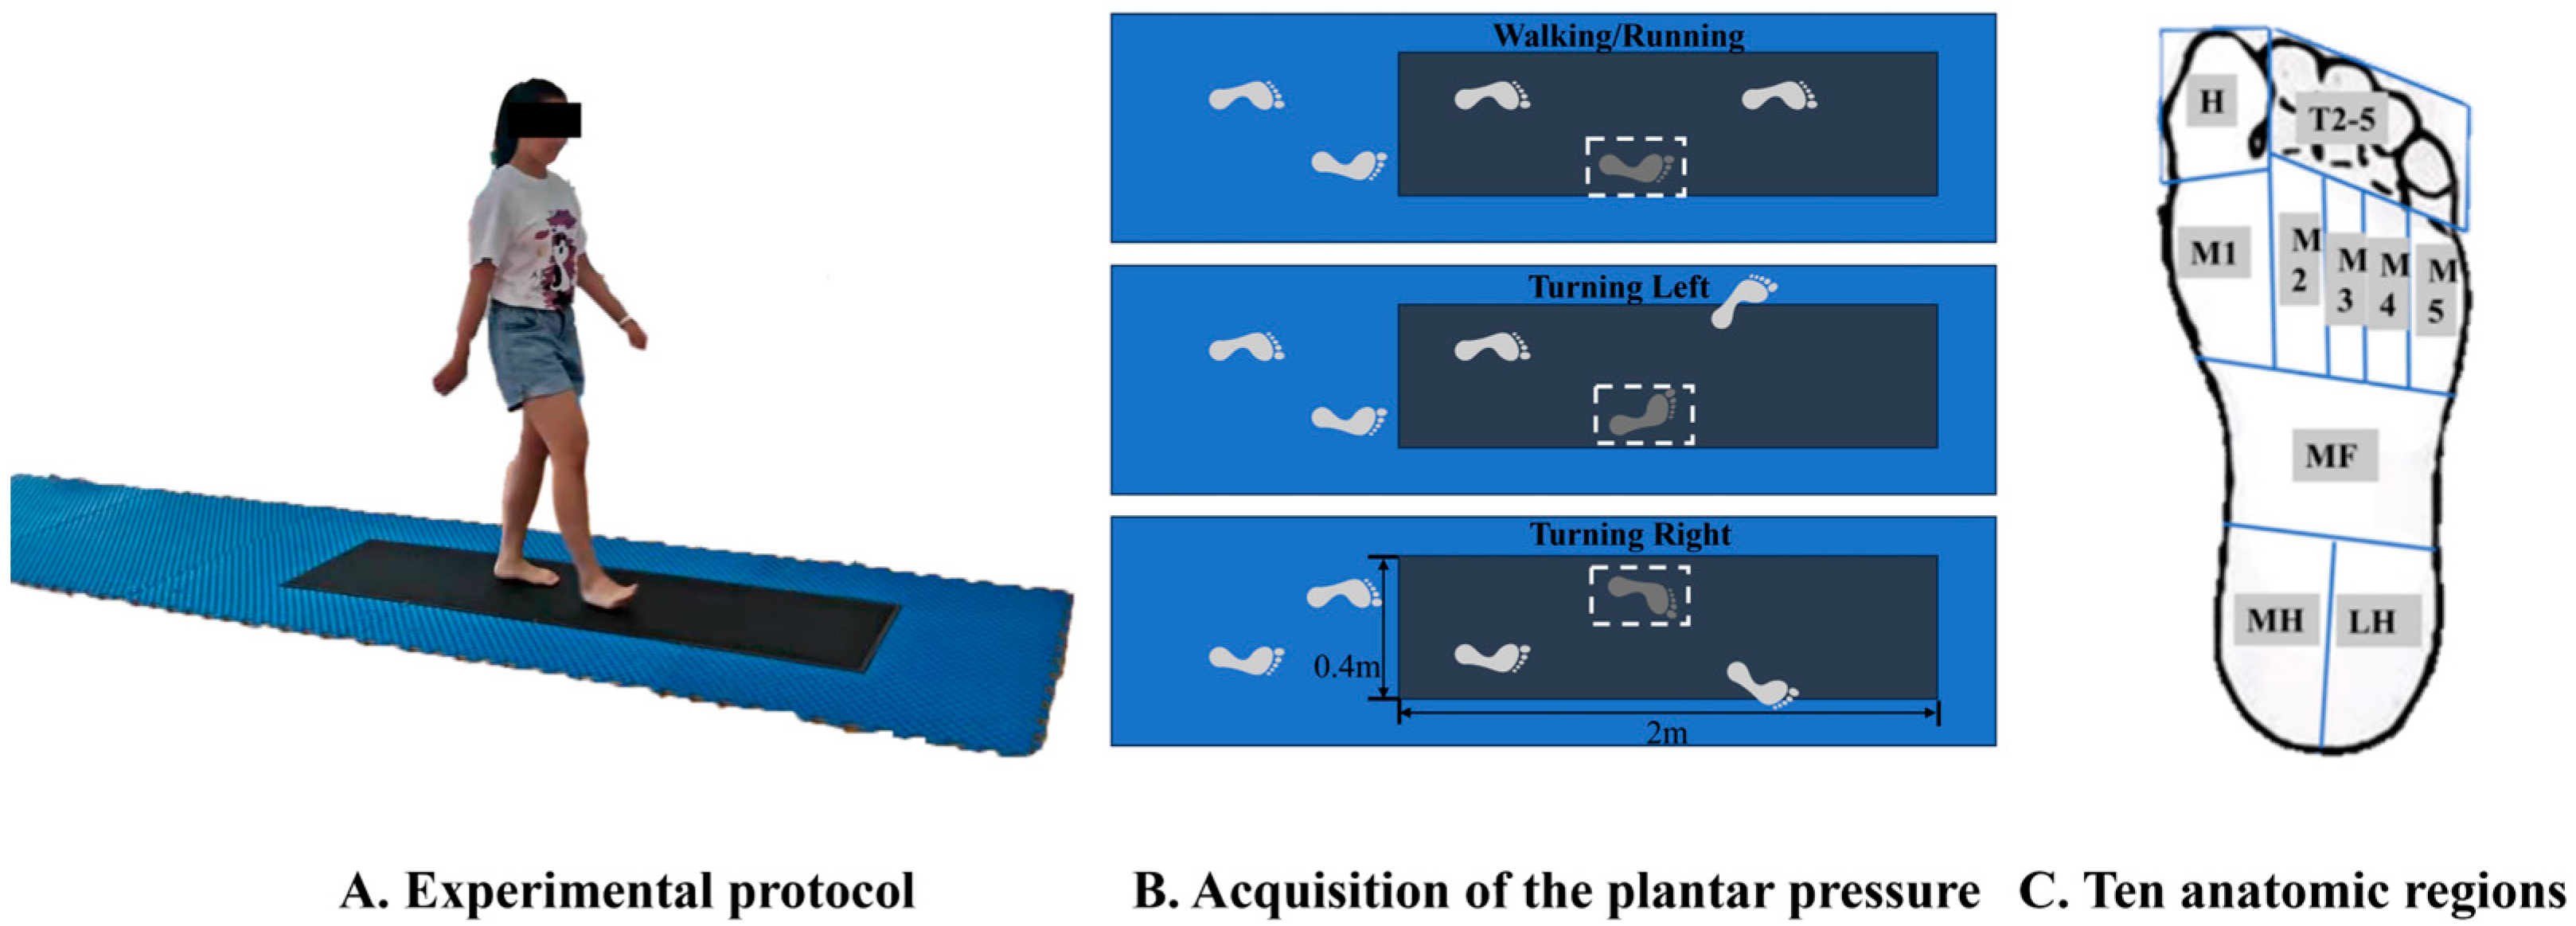
2.2. Test Protocol
2.3. Data Processing
2.4. Statistical Analysis
3. Results
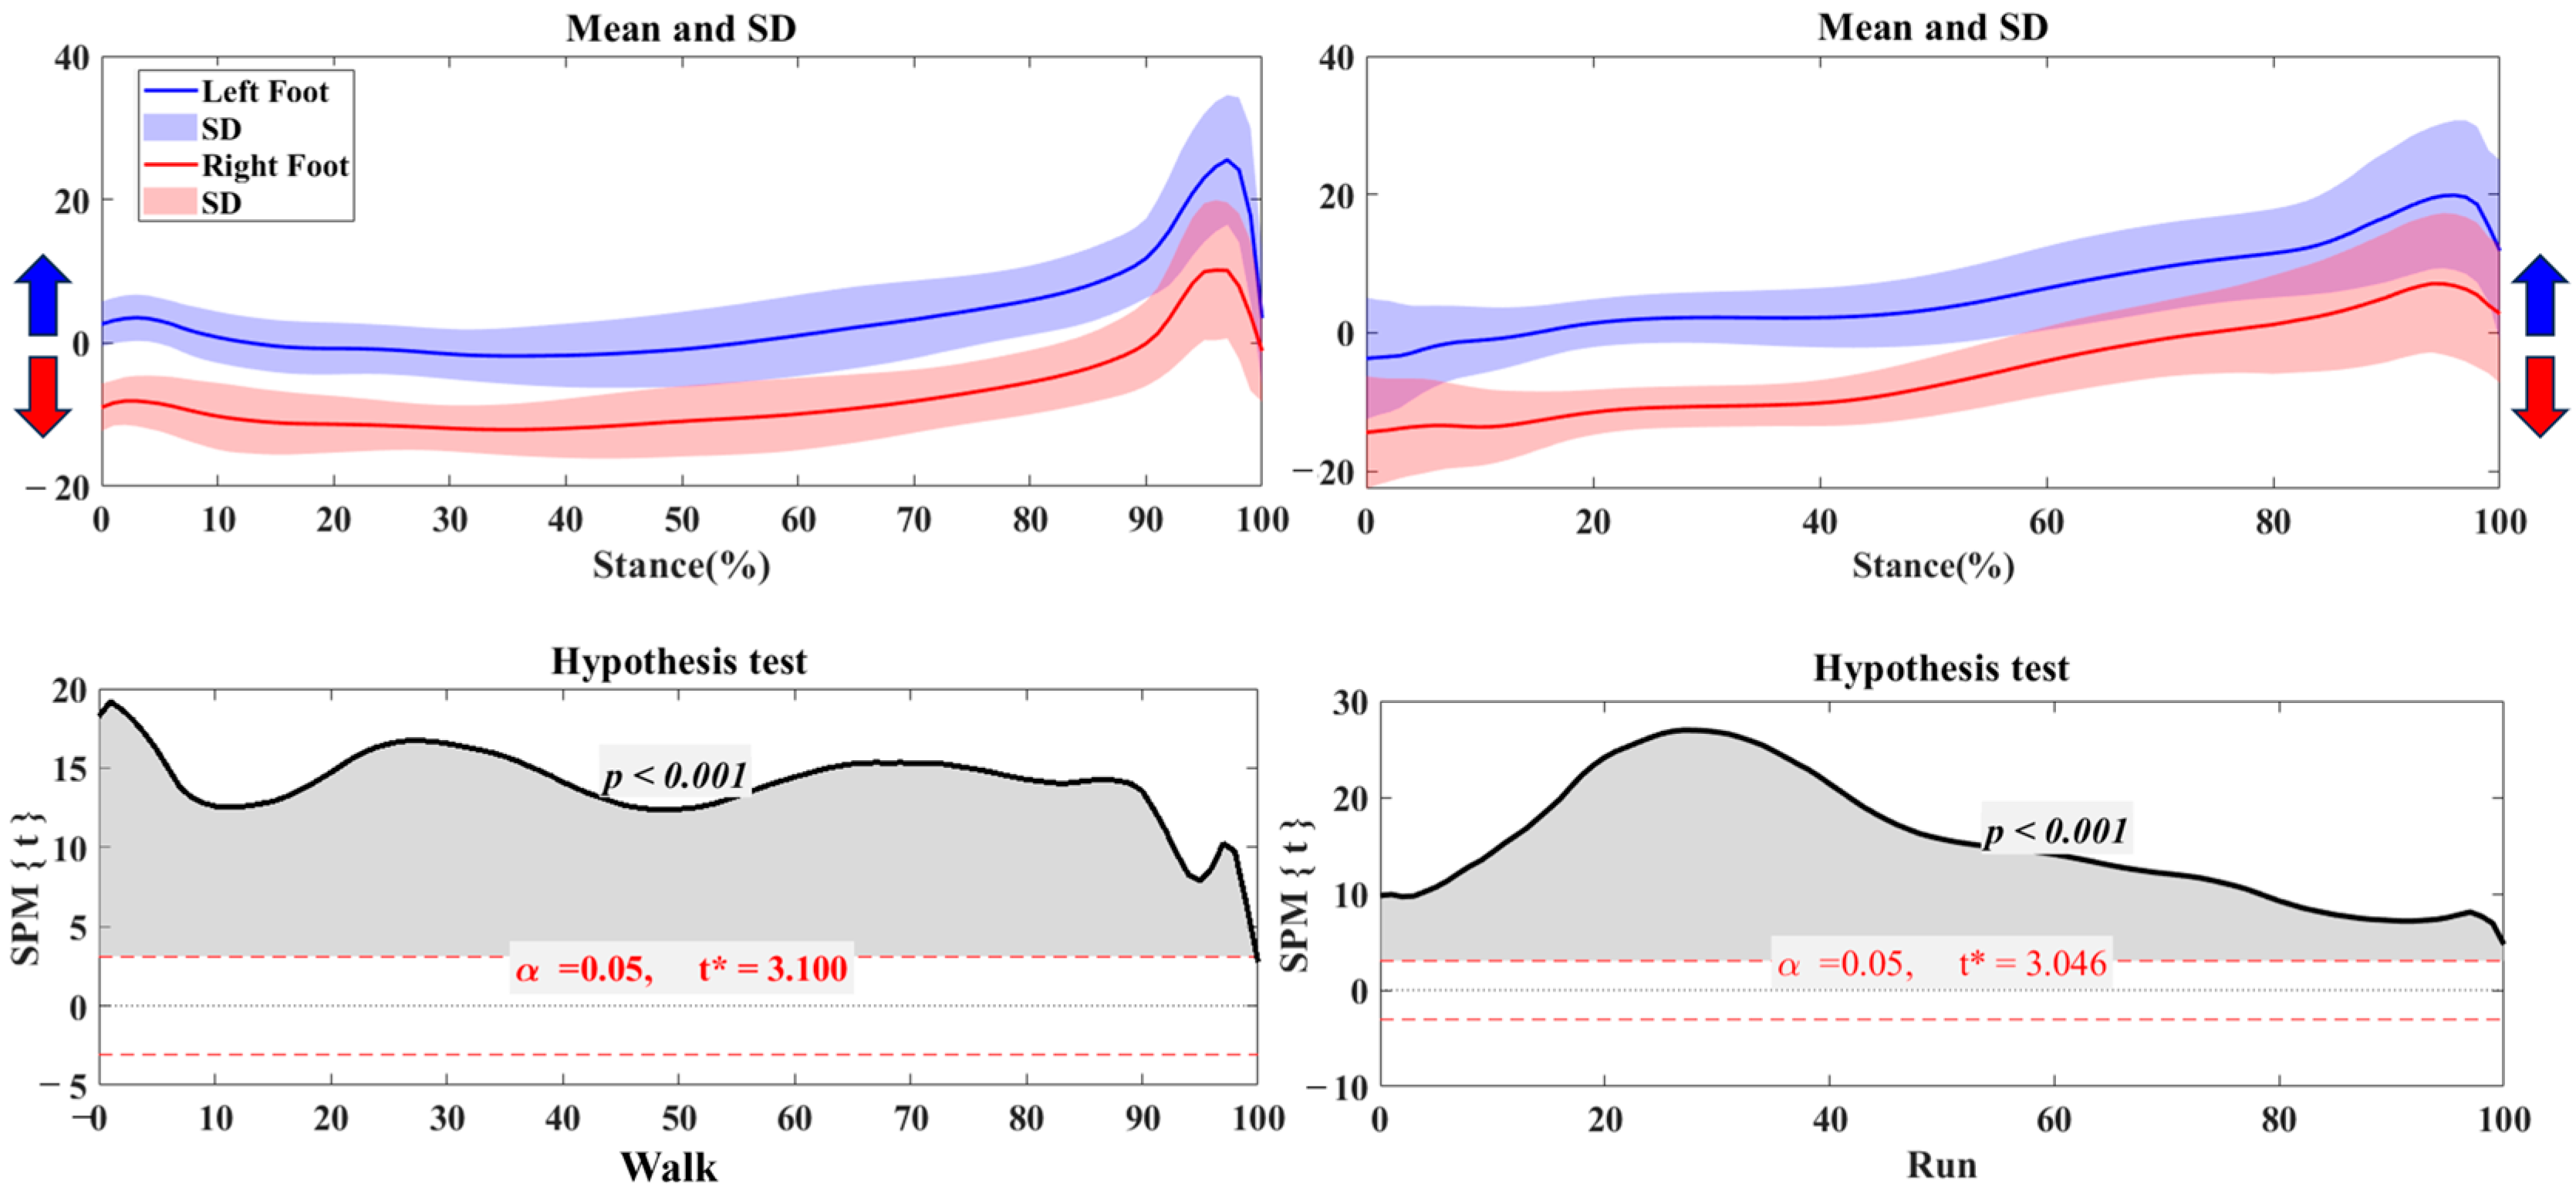
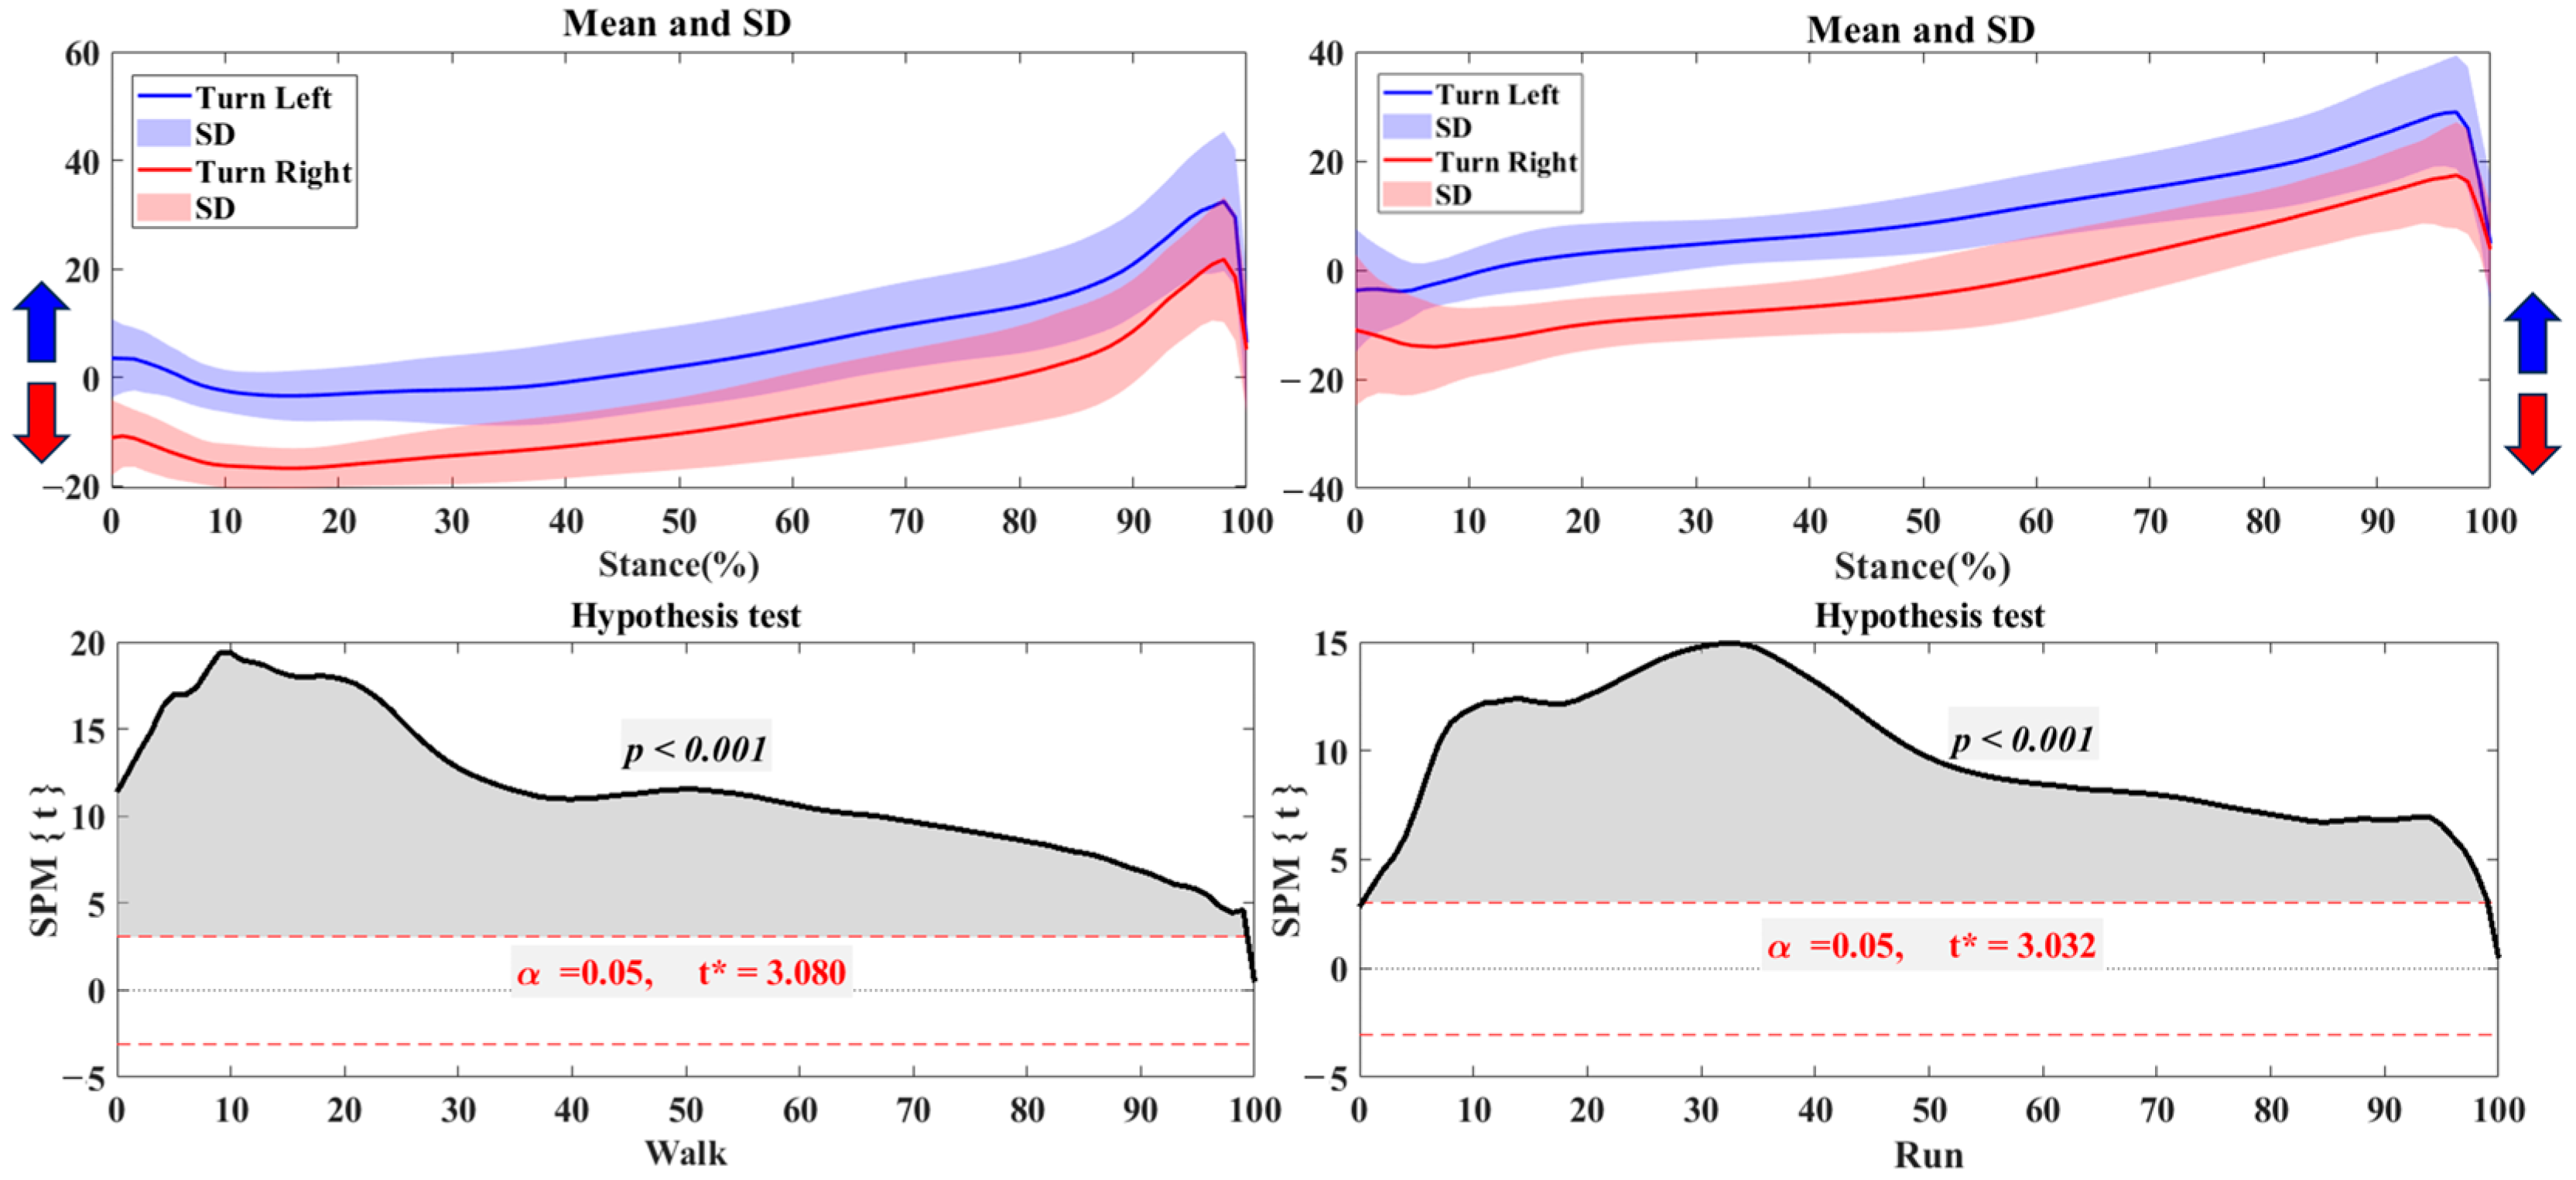
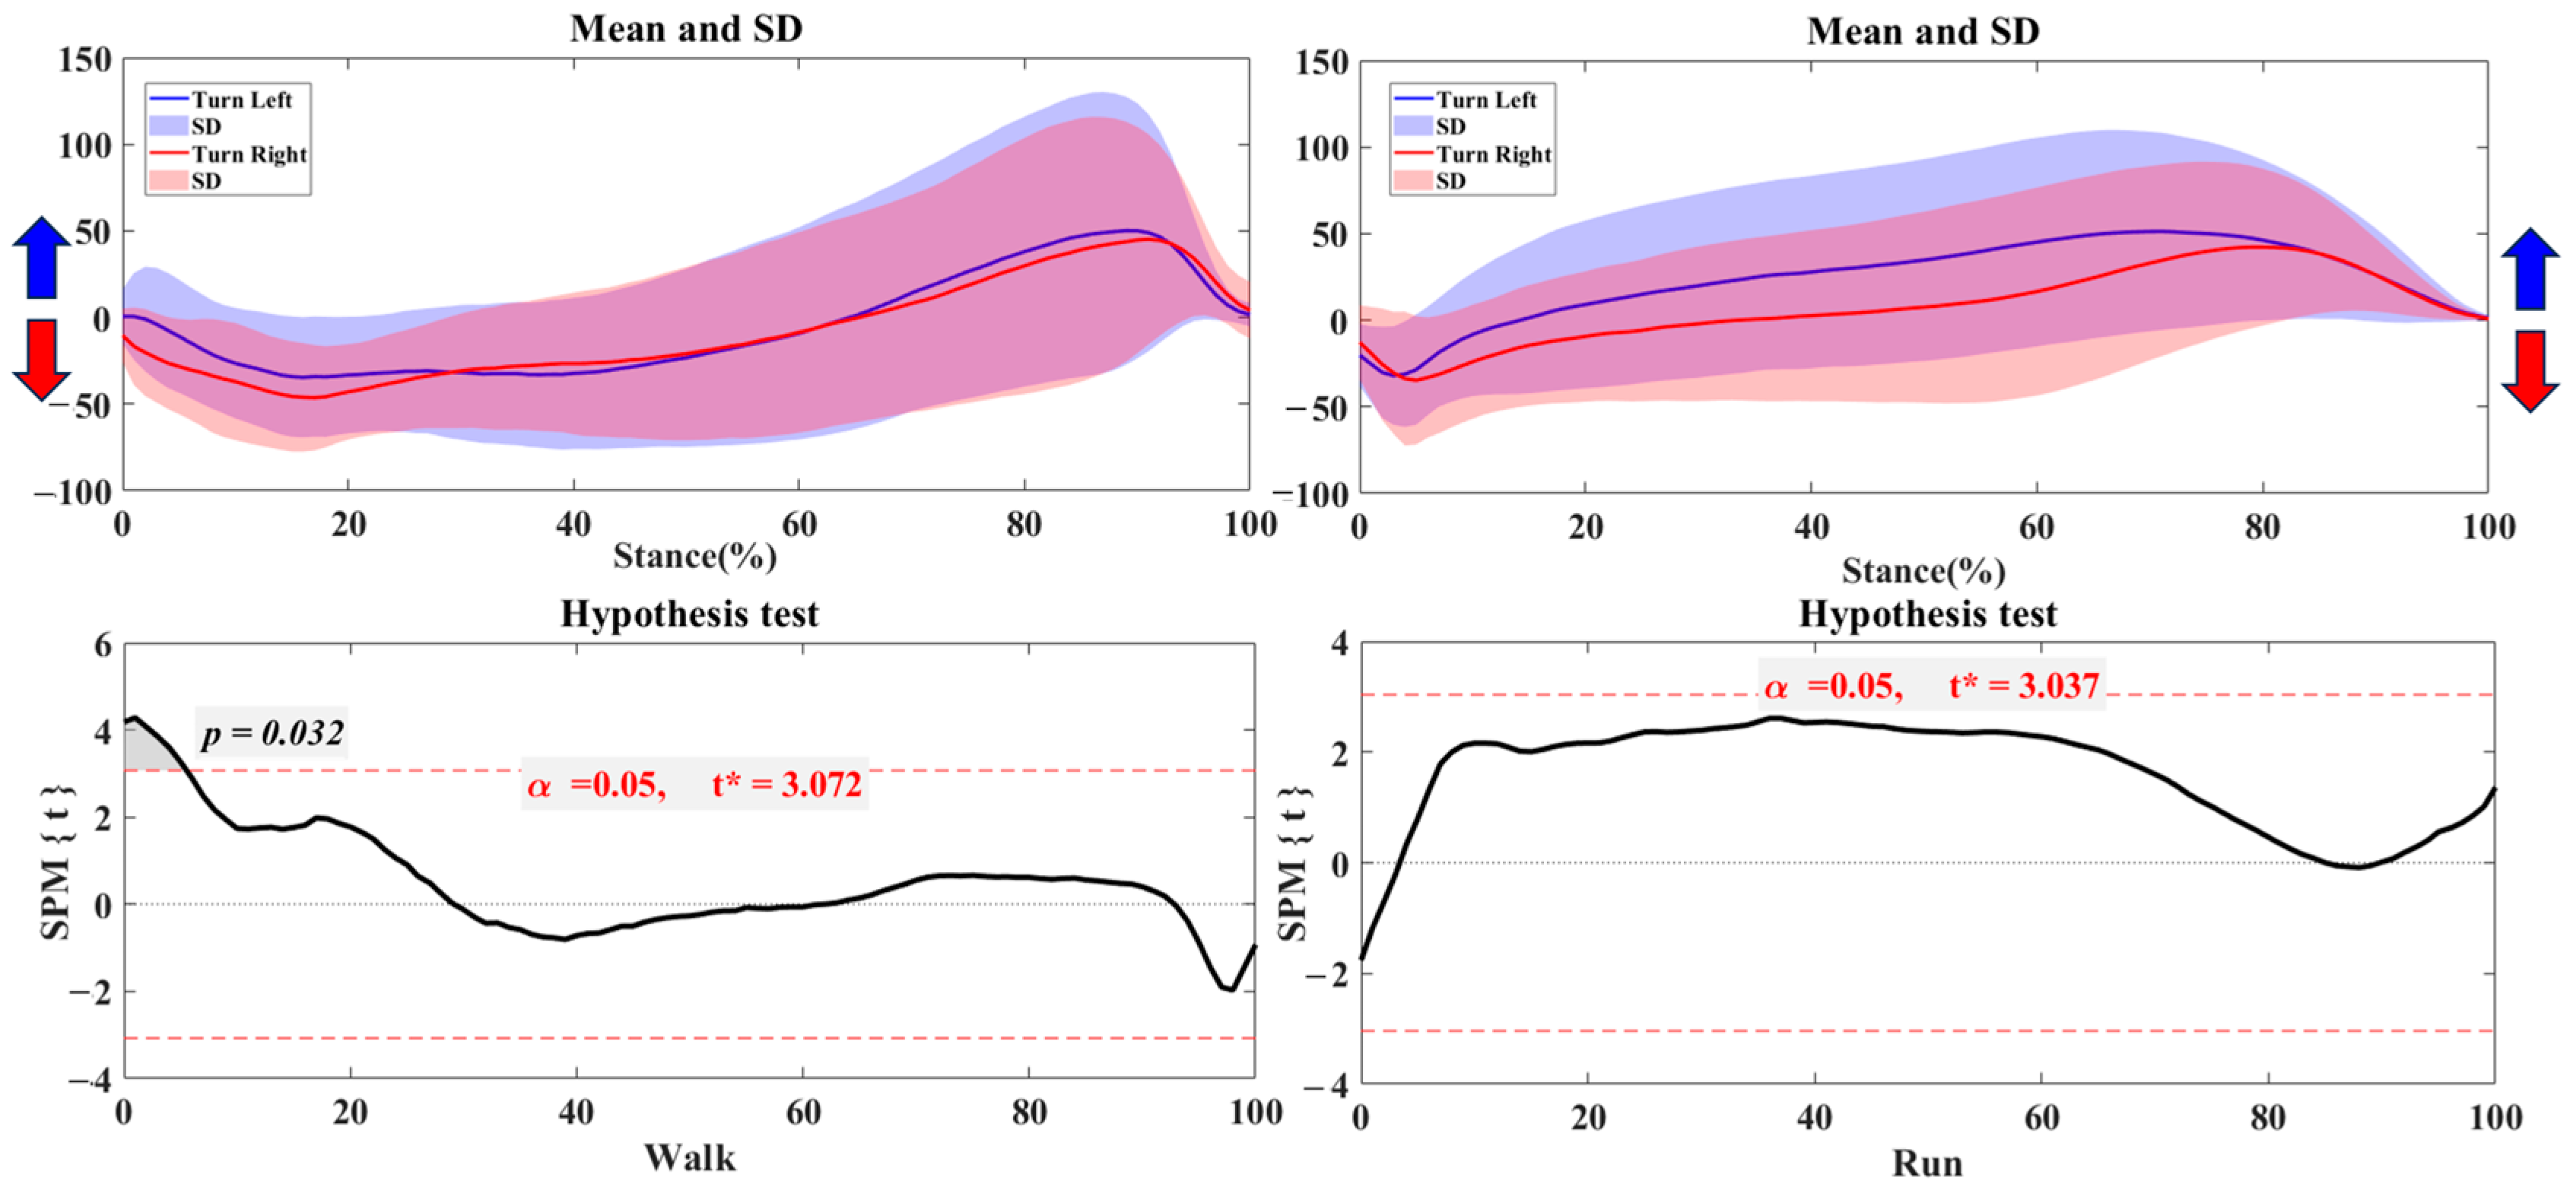
3.1. Center of Pressure Trajectory
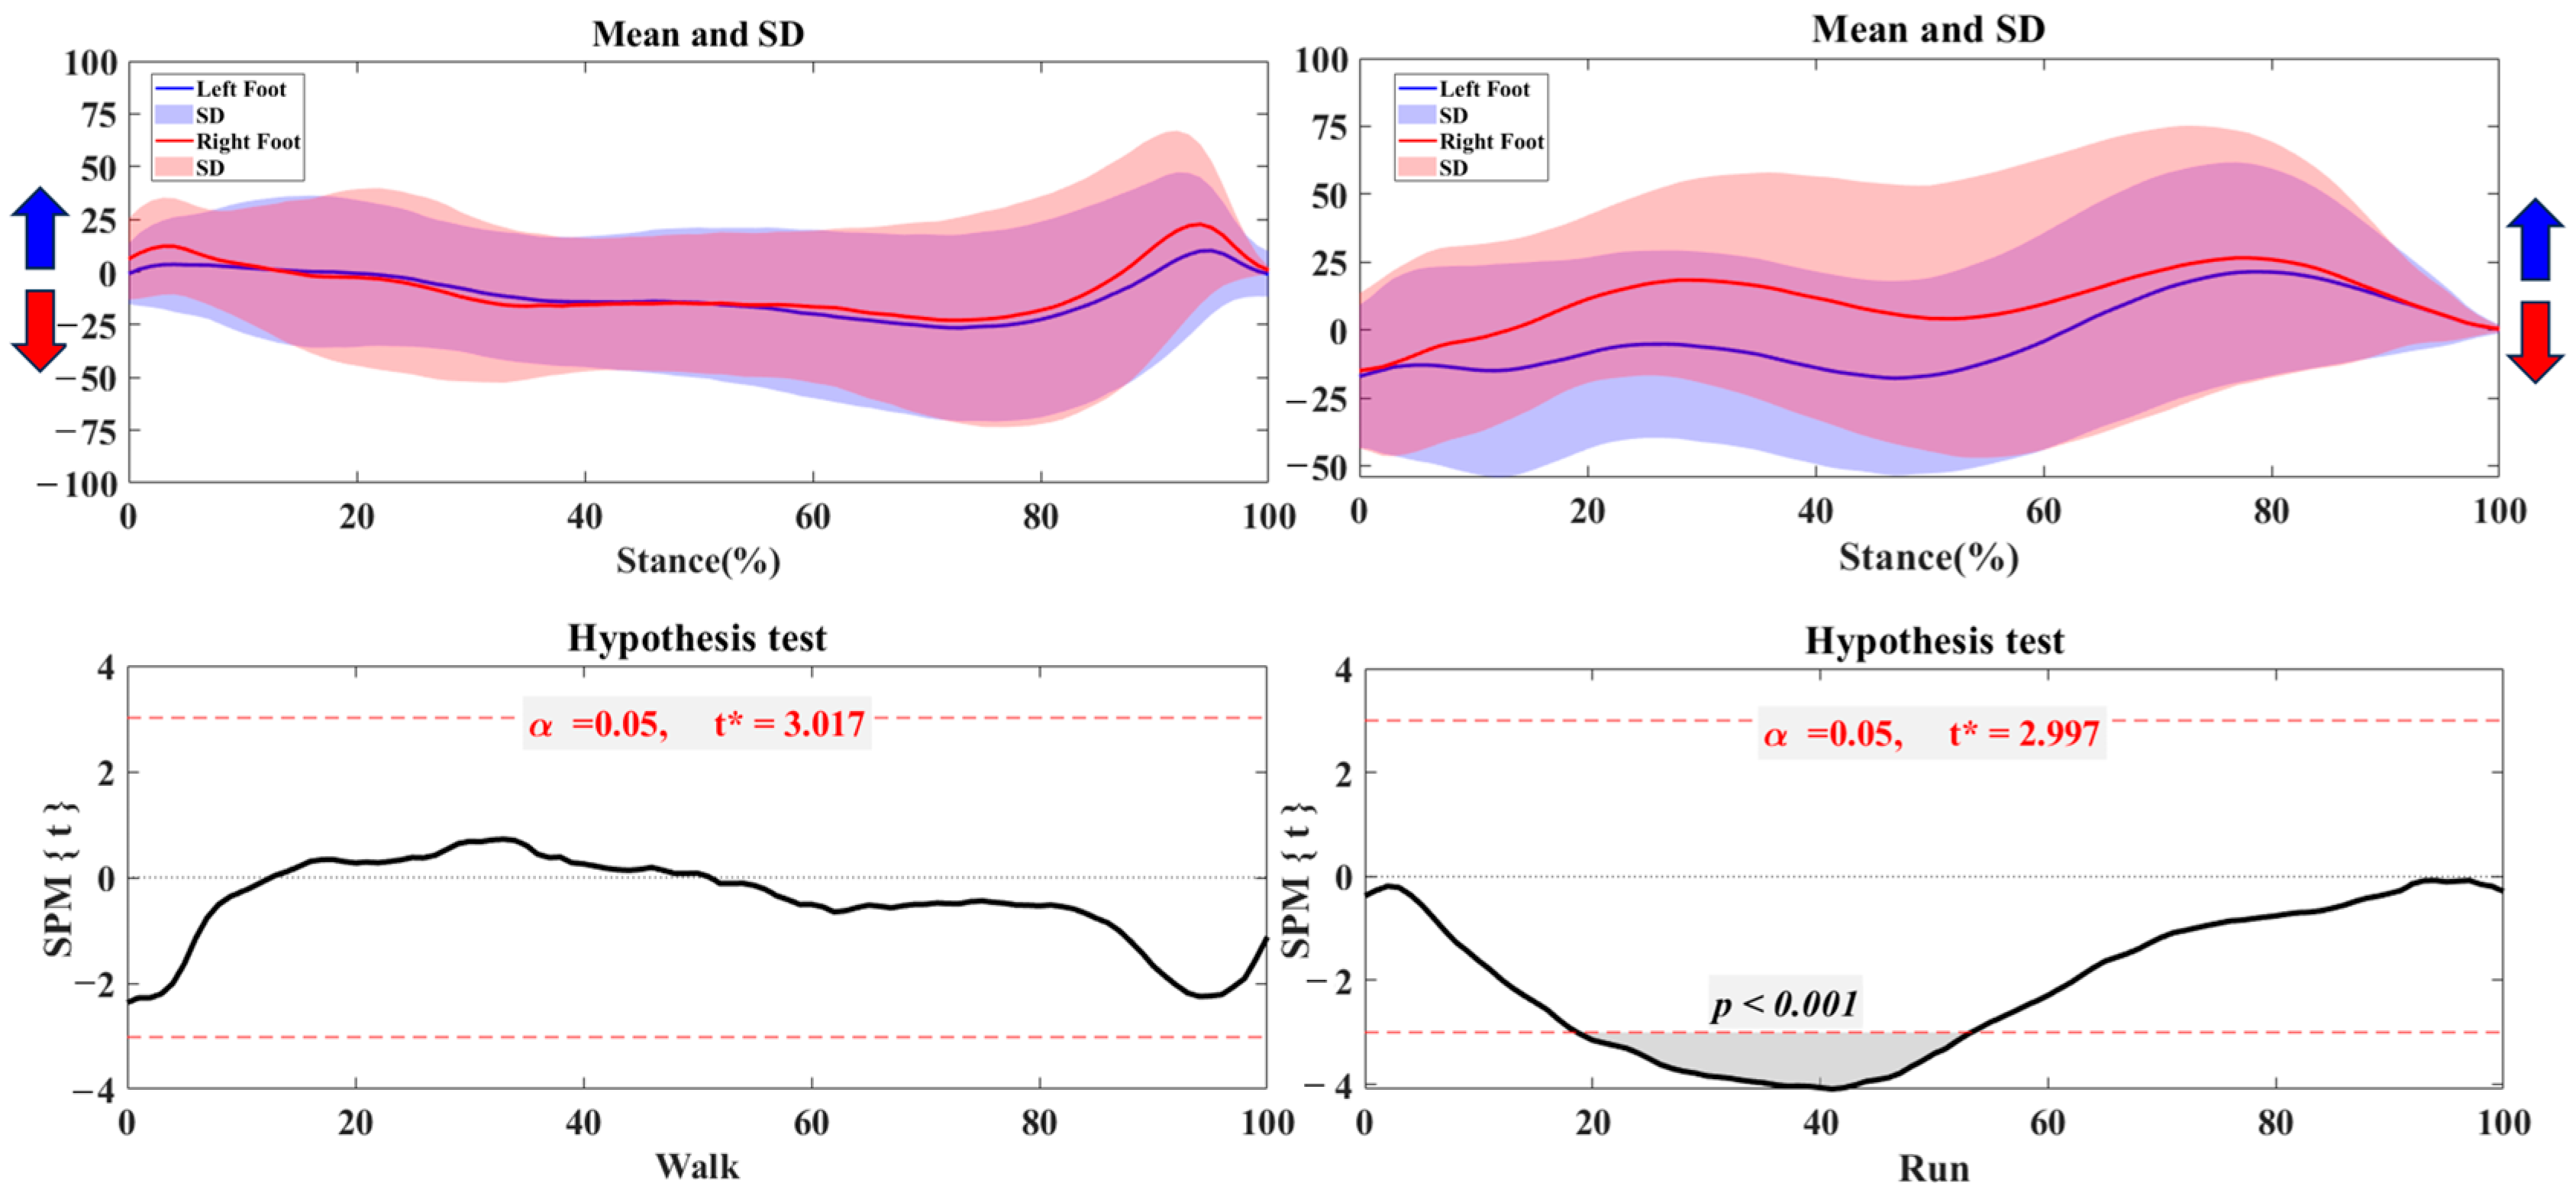
3.2. Foot Balance Index
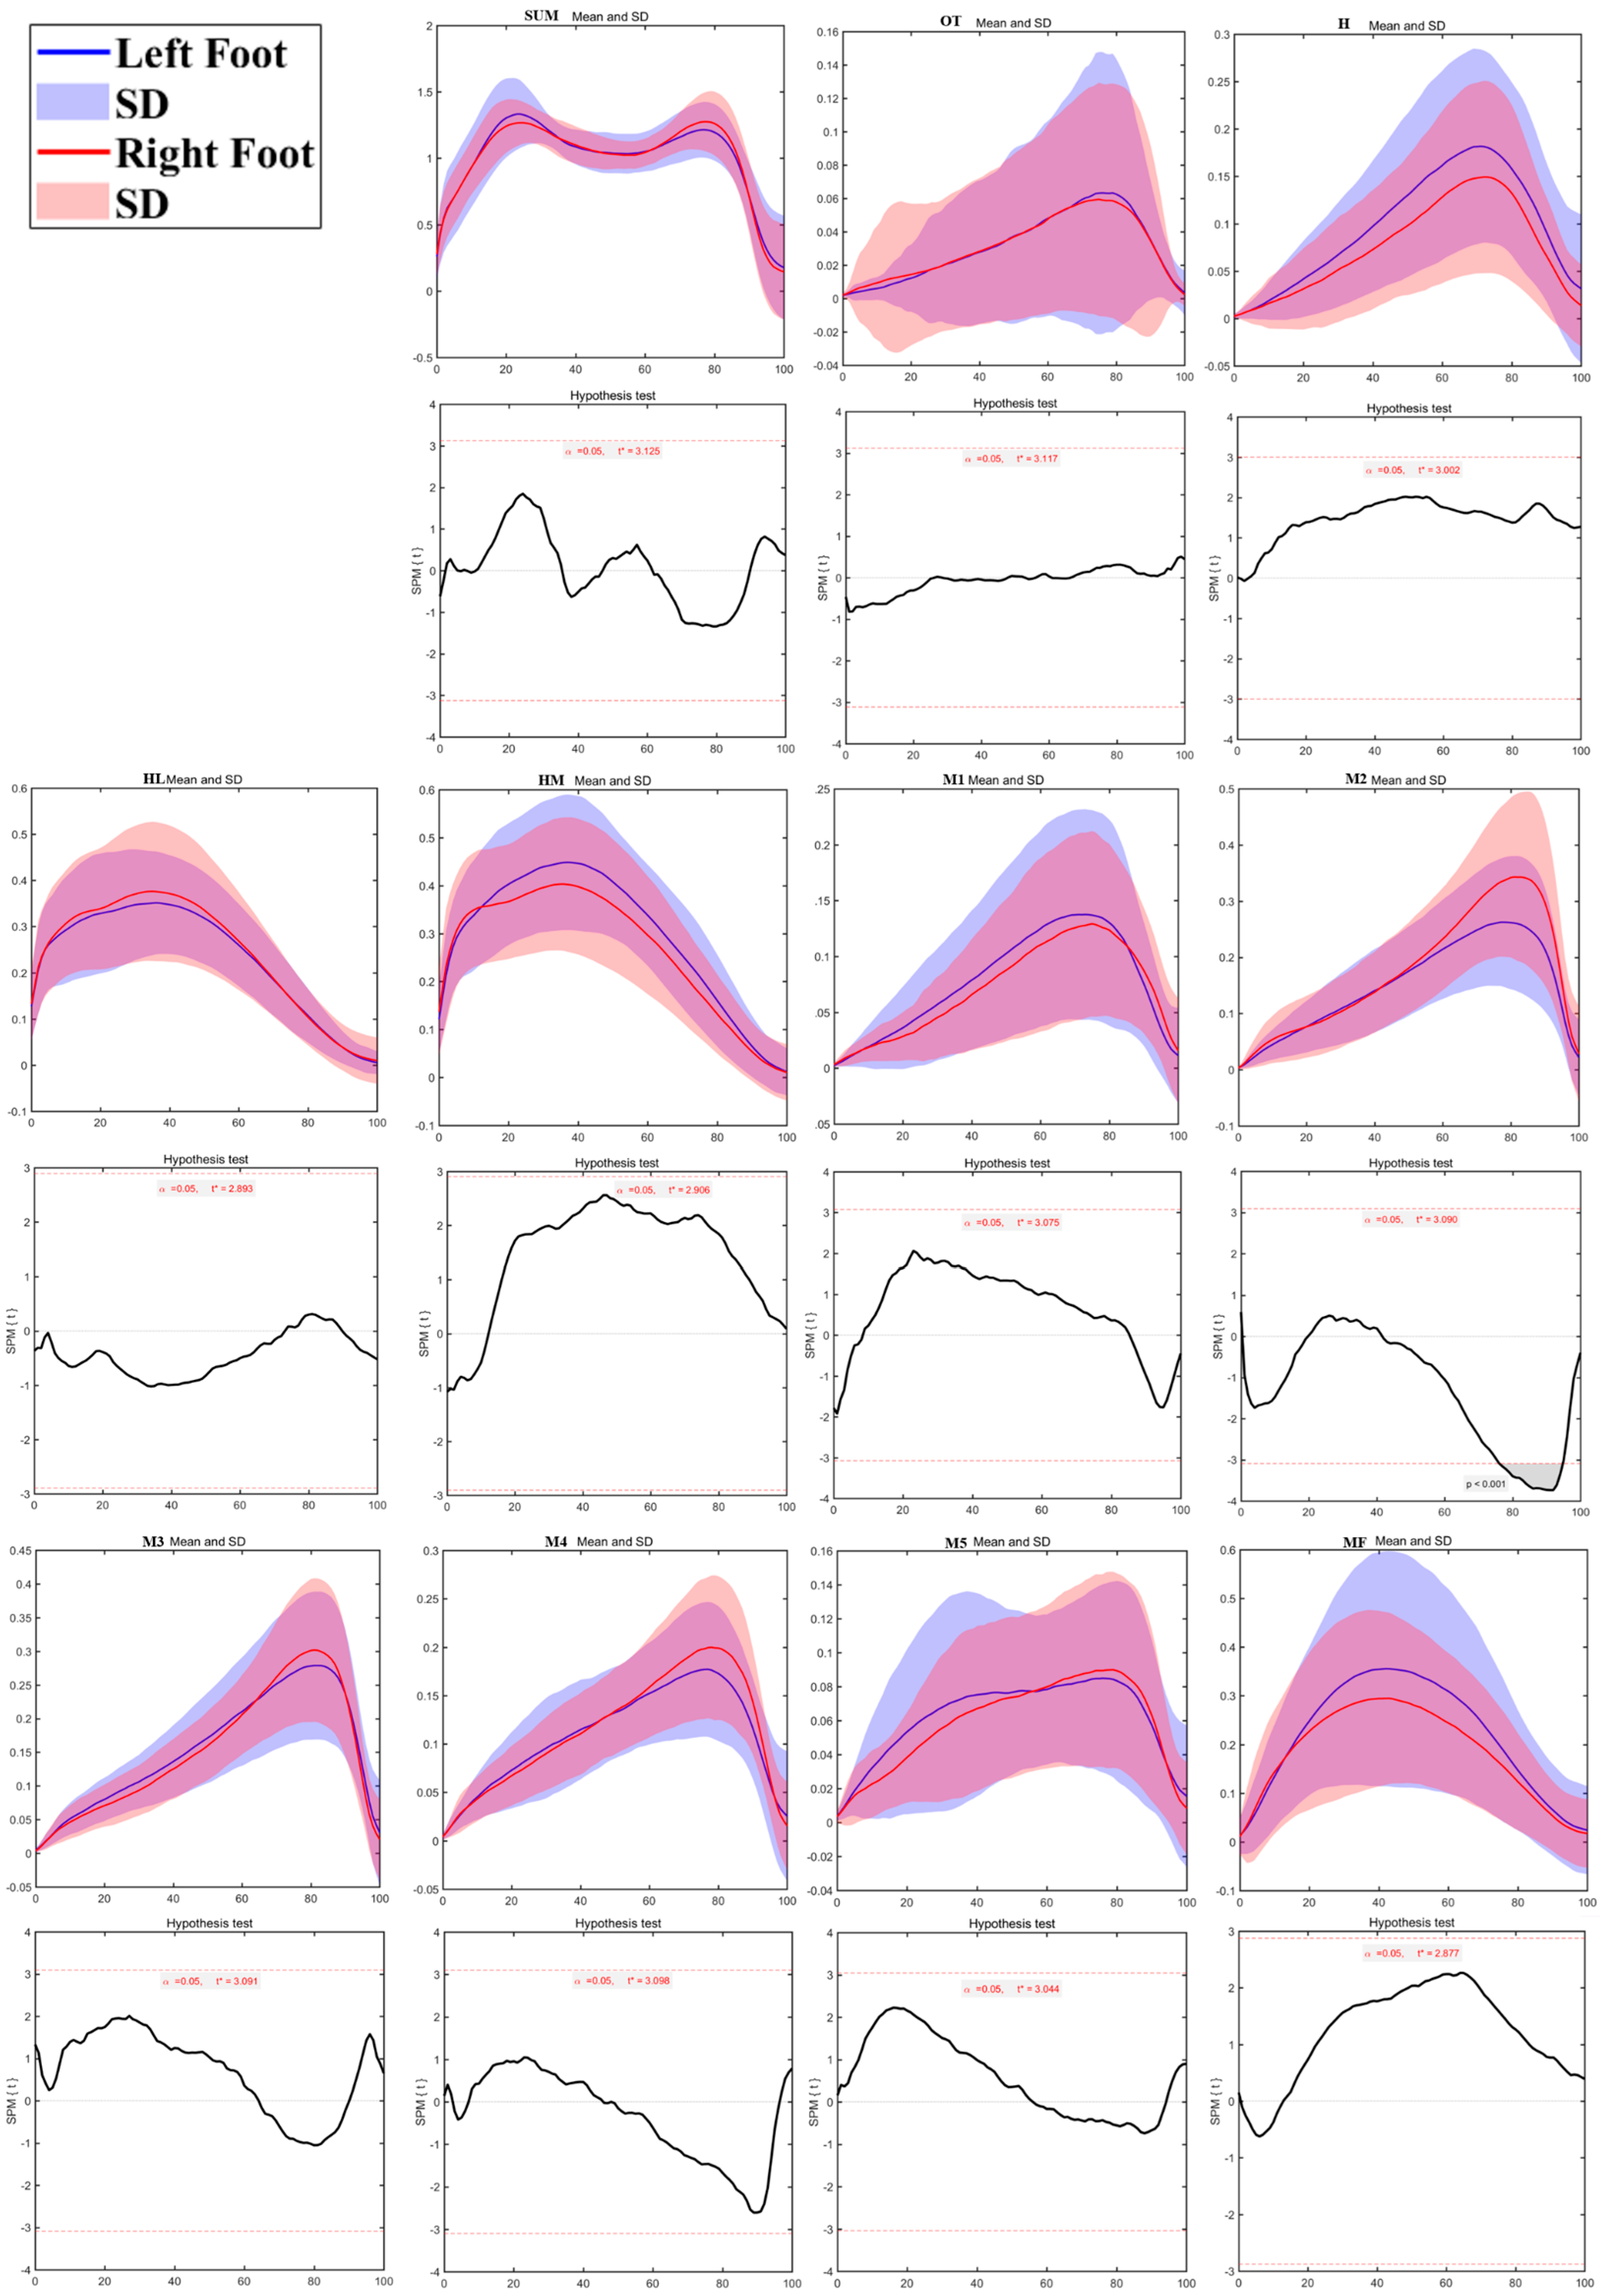
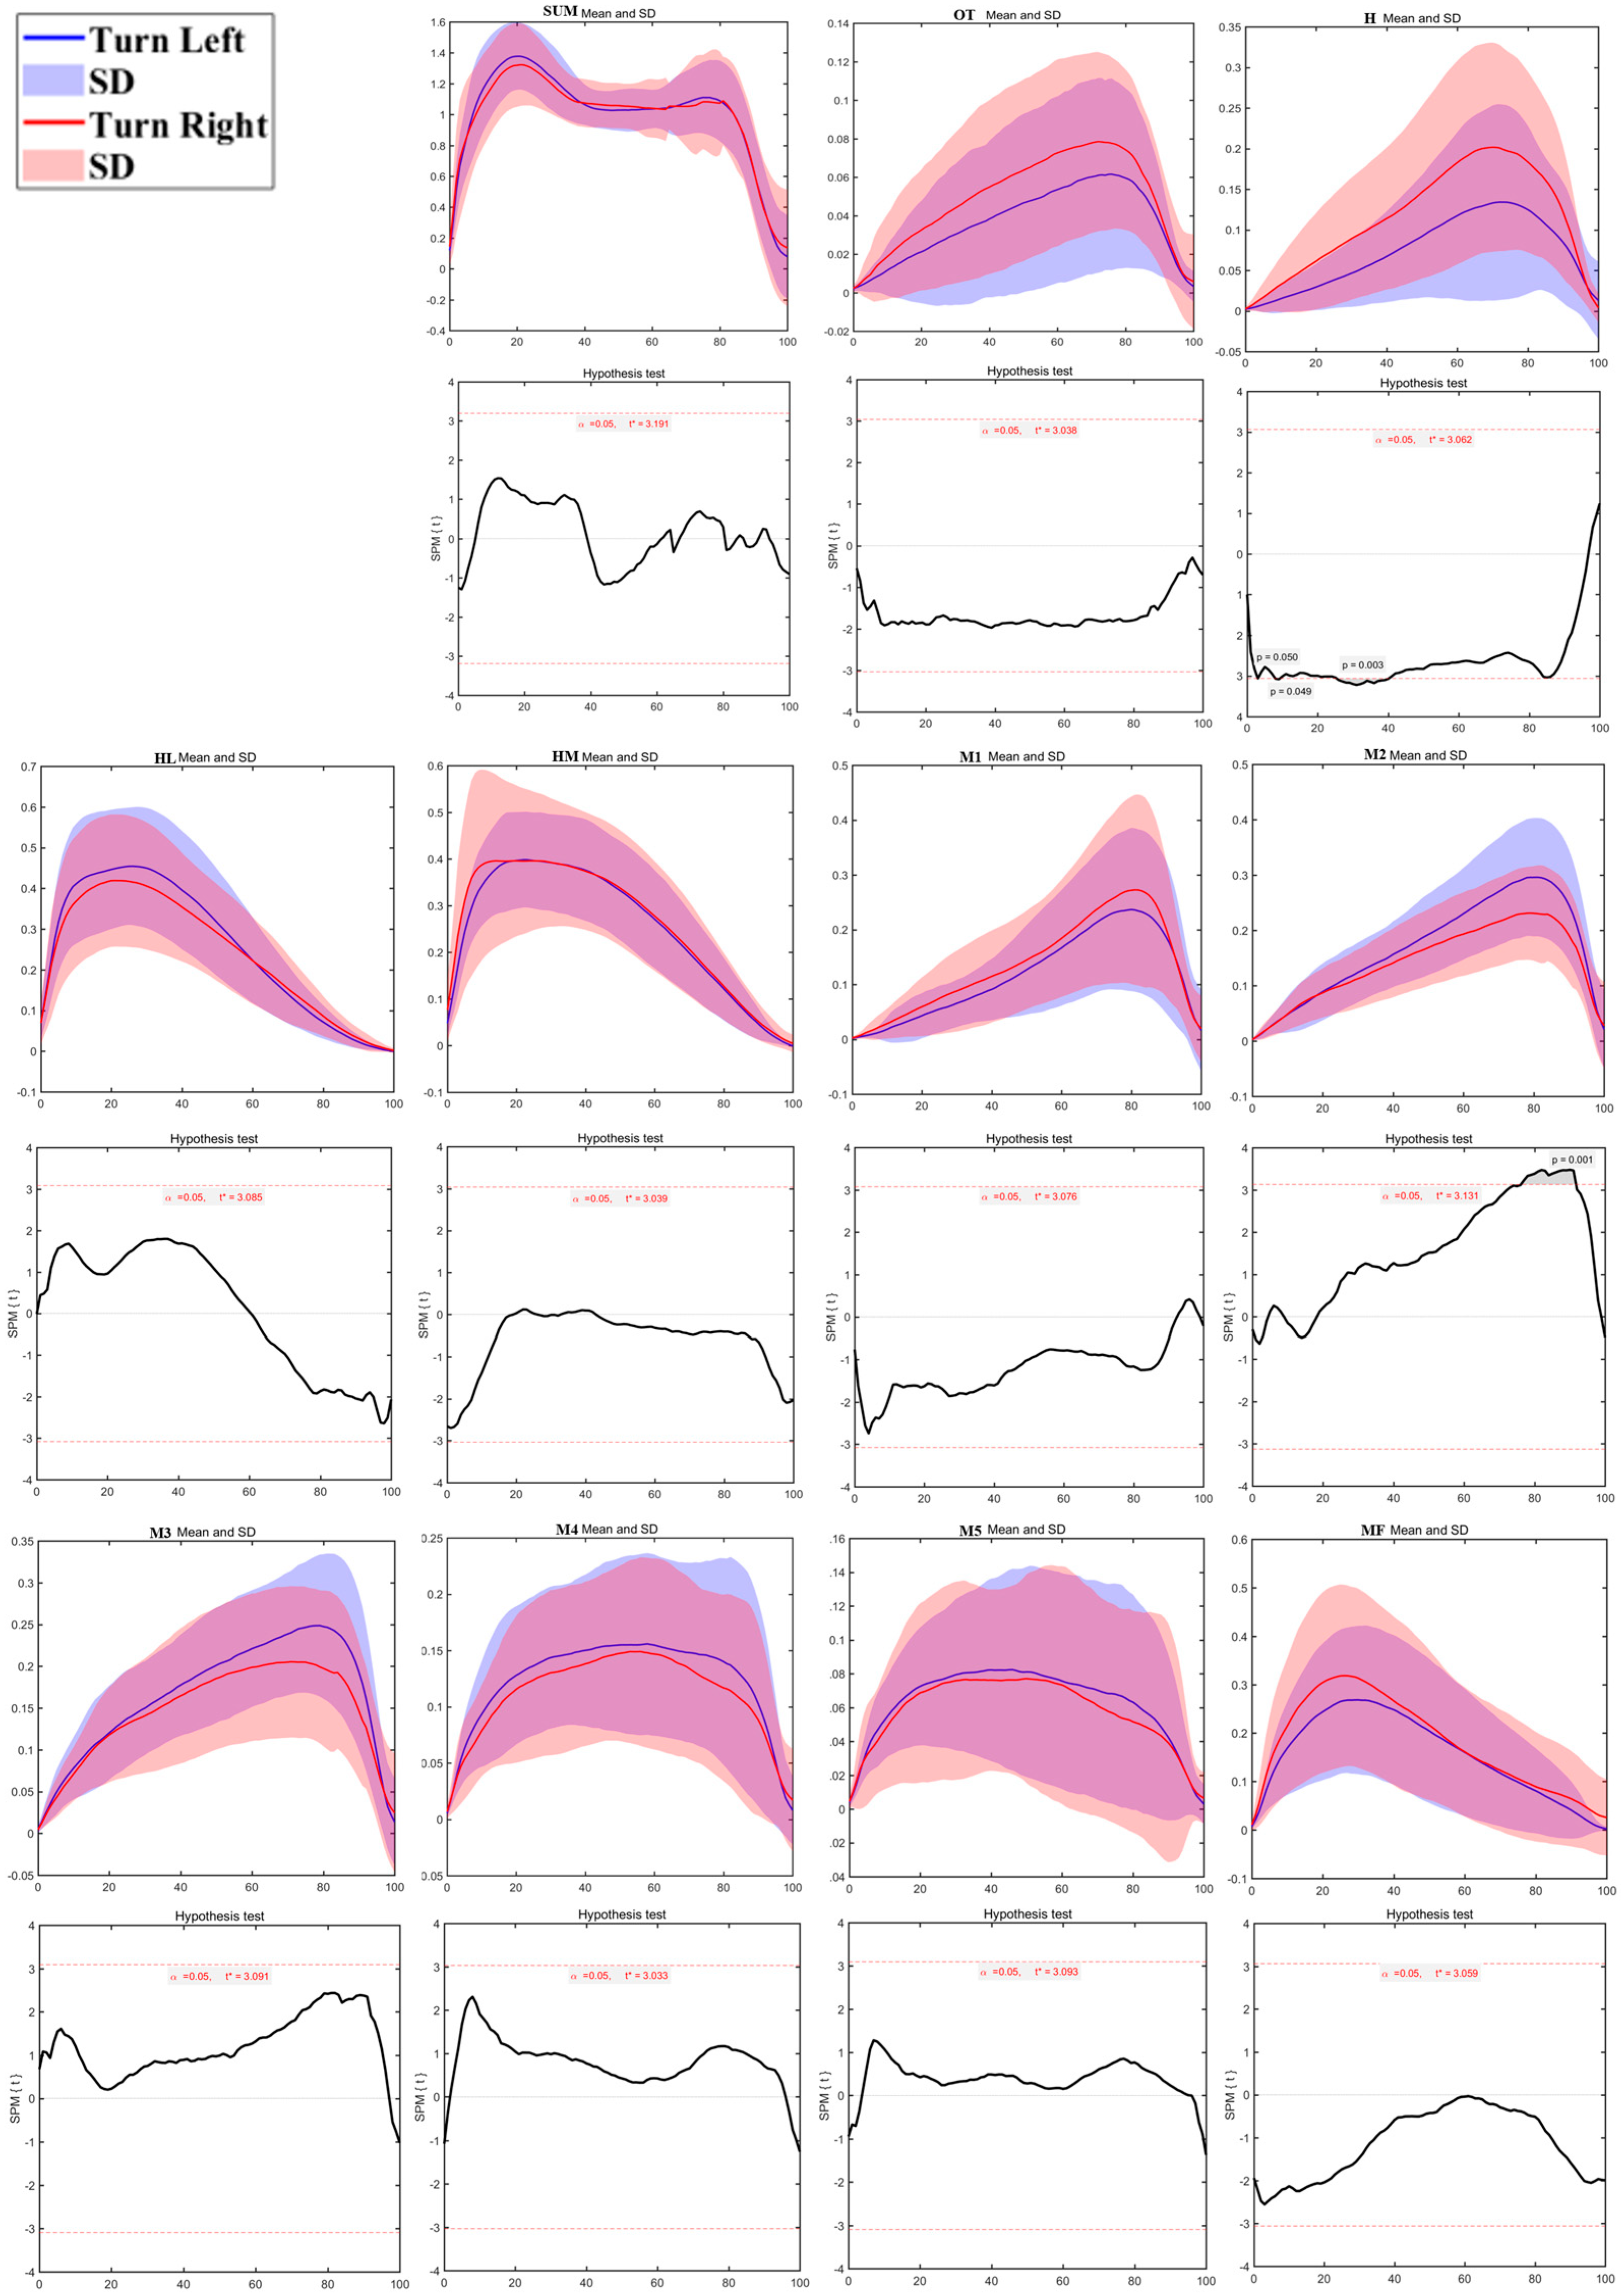
3.3. Regional Plantar Forces
4. Discussion
5. Conclusions
Author Contributions
Funding
Institutional Review Board Statement
Informed Consent Statement
Data Availability Statement
Acknowledgments
Conflicts of Interest
References
- Levy, J.C.; Mizel, M.S.; Wilson, L.S.; Fox, W.; McHale, K.; Taylor, D.C.; Temple, T. Incidence of foot and ankle injuries in west point cadets with pes planus compared to the general cadet population. Foot Ankle Int. 2006, 27, 1060–1064. [Google Scholar] [CrossRef] [PubMed]
- Mauch, M.; Grau, S.; Krauss, I.; Maiwald, C.; Horstmann, T. A new approach to children’s footwear based on foot type classification. Ergonomics 2009, 52, 999–1008. [Google Scholar] [CrossRef] [PubMed]
- Mauch, M.; Grau, S.; Krauss, I.; Maiwald, C.; Horstmann, T. Foot morphology of normal, underweight and overweight children. Int. J. Obes. 2008, 32, 1068–1075. [Google Scholar] [CrossRef] [PubMed]
- Ledoux, W.R.; Shofer, J.B.; Ahroni, J.H.; Smith, D.G.; Sangeorzan, B.J.; Boyko, E.J. Biomechanical differences among pes cavus, neutrally aligned, and pes planus feet in subjects with diabetes. Foot Ankle Int. 2003, 24, 845–850. [Google Scholar] [CrossRef]
- Naudi, S.; Dauplat, G.; Staquet, V.; Parent, S.; Mehdi, N.; Maynou, C. Anterior tarsectomy long-term results in adult pes cavus. Orthop. Traumatol.-Surg. Res. 2009, 95, 293–300. [Google Scholar] [CrossRef]
- Sugathan, H.K.; Sherlock, D.A. A Modified Jones Procedure for Managing Clawing of Lesser Toes in Pes Cavus: Long-term Follow-up in 8 Patients. J. Foot Ankle Surg. 2009, 48, 637–641. [Google Scholar] [CrossRef]
- Carvalho, B.K.G.d.; Penha, P.J.; Penha, N.L.J.; Andrade, R.M.; Ribeiro, A.P.; Joao, S.M.A. The influence of gender and body mass index on the FPI-6 evaluated foot posture of 10- to 14-year-old school children in Sao Paulo, Brazil: A cross-sectional study. J. Foot Ankle Res. 2017, 10, 1. [Google Scholar] [CrossRef]
- Ferber, R.; Noehren, B.; Hamill, J.; Davis, I. Competitive Female Runners With a History of Iliotibial Band Syndrome Demonstrate Atypical Hip and Knee Kinematics. J. Orthop. Sports Phys. Ther. 2010, 40, 52–58. [Google Scholar] [CrossRef]
- Bosch, K.; Nagel, A.; Weigend, L.; Rosenbaum, D. From “first” to “last” steps in life-Pressure patterns of three generations. Clin. Biomech. 2009, 24, 676–681. [Google Scholar] [CrossRef]
- Szczepanowska-Wolowiec, B.; Sztandera, P.; Kotela, I.; Zak, M. Vulnerability of the foot’s morphological structure to deformities caused by foot loading paradigm in school-aged children: A cross-sectional study. Sci. Rep. 2021, 11, 2749. [Google Scholar] [CrossRef]
- Wang, Y.; Jiang, H.; Yu, L.; Gao, Z.; Liu, W.; Mei, Q.; Gu, Y. Understanding the Role of Children’s Footwear on Children’s Feet and Gait Development: A Systematic Scoping Review. Healthcare 2023, 11, 1418. [Google Scholar] [CrossRef] [PubMed]
- Chow, J.Y.; Seifert, L.; Hérault, R.; Chia, S.J.Y.; Lee, M.C.Y. A dynamical system perspective to understanding badminton singles game play. Hum. Mov. Sci. 2014, 33, 70–84. [Google Scholar] [CrossRef] [PubMed]
- Molloy, J.M.; Christie, D.S.; Teyhen, D.S.; Yeykal, N.S.; Tragord, B.S.; Neal, M.S.; Nelson, E.S.; McPoil, T. Effect of Running Shoe Type on the Distribution and Magnitude of Plantar Pressures in Individuals with Low- or High-Arched Feet. J. Am. Podiatr. Med. Assoc. 2009, 99, 330–338. [Google Scholar] [CrossRef] [PubMed]
- Cen, X.Z.; Xu, D.T.; Baker, J.S.; Gu, Y.D. Association of Arch Stiffness with Plantar Impulse Distribution during Walking, Running, and Gait Termination. Int. J. Environ. Res. Public Health 2020, 17, 2090. [Google Scholar] [CrossRef] [PubMed]
- Yu, P.M.; Cen, X.Z.; Xiang, L.L.; Mei, Q.C.; Wang, A.L.; Gu, Y.D.; Fernandez, J. Regional plantar forces and surface geometry variations of a chronic ankle instability population described by statistical shape modelling. Gait Posture 2023, 106, 11–17. [Google Scholar] [CrossRef]
- Hu, X.Y.; Tang, J.P.; Cai, W.F.; Sun, Z.L.; Zhao, Z.; Qu, X.D. Characteristics of foot plantar pressure during turning in young male adults. Gait Posture 2023, 101, 1–7. [Google Scholar] [CrossRef]
- Chapman, J.P.; Chapman, L.J.; Allen, J.J. The measurement of foot preference. Neuropsychologia 1987, 25, 579–584. [Google Scholar] [CrossRef]
- Gao, Z.; Mei, Q.; Xiang, L.; Baker, J.S.; Fernandez, J.; Gu, Y. Effects of limb dominance on the symmetrical distribution of plantar loading during walking and running. Proc. Inst. Mech. Eng. Part P J. Sports Eng. Technol. 2022, 236, 17–23. [Google Scholar] [CrossRef]
- Yu, L.; Yu, P.; Liu, W.; Gao, Z.; Sun, D.; Mei, Q.; Fernandez, J.; Gu, Y. Understanding foot loading and balance behavior of children with motor sensory processing disorder. Children 2022, 9, 379. [Google Scholar] [CrossRef]
- Chang, W.-D.; Chang, N.-J.; Lin, H.-Y.; Lai, P.-T. Changes of plantar pressure and gait parameters in children with mild cerebral palsy who used a customized external strap orthosis: A crossover study. BioMed Res. Int. 2015, 2015, 813942. [Google Scholar] [CrossRef]
- Mei, Q.; Gu, Y.; Fernandez, J. Alterations of pregnant gait during pregnancy and post-partum. Sci. Rep. 2018, 8, 2217. [Google Scholar] [CrossRef] [PubMed]
- Carpinella, I.; Crenna, P.; Calabrese, E.; Rabuffetti, M.; Mazzoleni, P.; Nemni, R.; Ferrarin, M. Locomotor function in the early stage of Parkinson’s disease. IEEE Trans. Neural Syst. Rehabil. Eng. 2007, 15, 543–551. [Google Scholar] [CrossRef] [PubMed]
- Mei, Q.; Feng, N.; Ren, X.; Lake, M.; Gu, Y. Foot Loading patterns with different unstable soles structure. J. Mech. Med. Biol. 2015, 15, 1550014. [Google Scholar] [CrossRef]
- Gao, Z.; Mei, Q.; Fekete, G.; Baker, J.S.; Gu, Y. The effect of prolonged running on the symmetry of biomechanical variables of the lower limb joints. Symmetry 2020, 12, 720. [Google Scholar] [CrossRef]
- Wen, J.; Ding, Q.; Yu, Z.; Sun, W.; Wang, Q.; Wei, K. Adaptive changes of foot pressure in hallux valgus patients. Gait Posture 2012, 36, 344–349. [Google Scholar] [CrossRef]
- Yu, L.; Mohamad, N.I. Development of badminton-specific footwork training from traditional physical exercise to novel intervention approaches. Phys. Act. Health 2022, 6, 219–225. [Google Scholar] [CrossRef]
- Mei, Q.; Xiang, L.; Li, J.; Fernandez, J.; Gu, Y. Analysis of Running Ground Reaction Forces Using the One-Dimensional Statistical Parametric Mapping (SPM1d). Yiyong Shengwu Lixue/J. Med. Biomech. 2021, 36, 684–691. [Google Scholar] [CrossRef]
- Pataky, T.C. One-dimensional statistical parametric mapping in Python. Comput. Methods Biomech. Biomed. Eng. 2012, 15, 295–301. [Google Scholar] [CrossRef]
- Sadeghi, H.; Allard, P.; Prince, F.; Labelle, H. Symmetry and limb dominance in able-bodied gait: A review. Gait Posture 2000, 12, 34–45. [Google Scholar] [CrossRef]
- Bosch, K.; Rosenbaum, D. Gait symmetry improves in childhood—A 4-year follow-up of foot loading data. Gait Posture 2010, 32, 464–468. [Google Scholar] [CrossRef]
- Eshraghi, A.; Safaeepour, Z.; Geil, M.D.; Andrysek, J. Walking and balance in children and adolescents with lower-limb amputation: A review of literature. Clin. Biomech. 2018, 59, 181–198. [Google Scholar] [CrossRef] [PubMed]
- Hsiang, S.M.; Chang, C. The effect of gait speed and load carrying on the reliability of ground reaction forces. Saf. Sci. 2002, 40, 639–657. [Google Scholar] [CrossRef]
- Schaefer, S.; Jagenow, D.; Verrel, J.; Lindenberger, U. The influence of cognitive load and walking speed on gait regularity in children and young adults. Gait Posture 2015, 41, 258–262. [Google Scholar] [CrossRef] [PubMed]
- Tajima, T.; Tateuchi, H.; Koyama, Y.; Ikezoe, T.; Ichihashi, N. Gait strategies to reduce the dynamic joint load in the lower limbs during a loading response in young healthy adults. Hum. Mov. Sci. 2018, 58, 260–267. [Google Scholar] [CrossRef]
- Hase, K.; Stein, R.B. Turning strategies during human walking. J. Neurophysiol. 1999, 81, 2914–2922. [Google Scholar] [CrossRef]
- Dixon, P.C.; Stebbins, J.; Theologis, T.; Zavatsky, A.B. Spatio-temporal parameters and lower-limb kinematics of turning gait in typically developing children. Gait Posture 2013, 38, 870–875. [Google Scholar] [CrossRef]
- Ludwig, O.; Kelm, J.; Hammes, A.; Schmitt, E.; Fröhlich, M. Neuromuscular performance of balance and posture control in childhood and adolescence. Heliyon 2020, 6, e04541. [Google Scholar] [CrossRef]
- Fong, S.S.M.; Chung, L.M.Y.; Bae, Y.-H.; Vackova, D.; Ma, A.W.W.; Liu, K.P.Y. Neuromuscular processes in the control of posture in children with developmental coordination disorder: Current evidence and future research directions. Curr. Dev. Disord. Rep. 2018, 5, 43–48. [Google Scholar] [CrossRef]
- Daley, M.A.; Felix, G.; Biewener, A.A. Running stability is enhanced by a proximo-distal gradient in joint neuromechanical control. J. Exp. Biol. 2007, 210, 383–394. [Google Scholar] [CrossRef]
- Spech, C.; Paponetti, M.; Mansfield, C.; Schmitt, L.; Briggs, M. Biomechanical variations in children who are overweight and obese during high-impact activities: A systematic review and meta-analysis. Obes. Rev. 2022, 23, e13431. [Google Scholar] [CrossRef]
- Carpes, F.P.; Mota, C.B.; Faria, I.E. On the bilateral asymmetry during running and cycling—A review considering leg preference. Phys. Ther. Sport 2010, 11, 136–142. [Google Scholar] [CrossRef] [PubMed]
- Yiou, E.; Caderby, T.; Delafontaine, A.; Fourcade, P.; Honeine, J.-L. Balance control during gait initiation: State-of-the-art and research perspectives. World J. Orthop. 2017, 8, 815. [Google Scholar] [CrossRef] [PubMed]
- Keenan, B.E.; Evans, S.L.; Oomens, C.W.J. A review of foot finite element modelling for pressure ulcer prevention in bedrest: Current perspectives and future recommendations. J. Tissue Viability 2022, 31, 73–83. [Google Scholar] [CrossRef] [PubMed]
- Ménard, A.L.; Begon, M.; Barrette, J.; Green, B.; Ballaz, L.; Nault, M.L. Plantar pressure analysis: Identifying risk of foot and ankle injury in soccer players. Transl. Sports Med. 2021, 4, 684–690. [Google Scholar] [CrossRef]


Disclaimer/Publisher’s Note: The statements, opinions and data contained in all publications are solely those of the individual author(s) and contributor(s) and not of MDPI and/or the editor(s). MDPI and/or the editor(s) disclaim responsibility for any injury to people or property resulting from any ideas, methods, instructions or products referred to in the content. |
© 2025 by the authors. Licensee MDPI, Basel, Switzerland. This article is an open access article distributed under the terms and conditions of the Creative Commons Attribution (CC BY) license (https://creativecommons.org/licenses/by/4.0/).
Share and Cite
Liu, W.; Xu, L.; Wu, H.; Wang, Y.; Jiang, H.; Gao, Z.; Jánosi, E.; Fekete, G.; Mei, Q.; Gu, Y. Bilateral Asymmetries of Plantar Pressure and Foot Balance During Walking, Running, and Turning Gait in Typically Developing Children. Bioengineering 2025, 12, 151. https://doi.org/10.3390/bioengineering12020151
Liu W, Xu L, Wu H, Wang Y, Jiang H, Gao Z, Jánosi E, Fekete G, Mei Q, Gu Y. Bilateral Asymmetries of Plantar Pressure and Foot Balance During Walking, Running, and Turning Gait in Typically Developing Children. Bioengineering. 2025; 12(2):151. https://doi.org/10.3390/bioengineering12020151
Chicago/Turabian StyleLiu, Wei, Liu Xu, Haidan Wu, Yile Wang, Hanhui Jiang, Zixiang Gao, Endre Jánosi, Gusztav Fekete, Qichang Mei, and Yaodong Gu. 2025. "Bilateral Asymmetries of Plantar Pressure and Foot Balance During Walking, Running, and Turning Gait in Typically Developing Children" Bioengineering 12, no. 2: 151. https://doi.org/10.3390/bioengineering12020151
APA StyleLiu, W., Xu, L., Wu, H., Wang, Y., Jiang, H., Gao, Z., Jánosi, E., Fekete, G., Mei, Q., & Gu, Y. (2025). Bilateral Asymmetries of Plantar Pressure and Foot Balance During Walking, Running, and Turning Gait in Typically Developing Children. Bioengineering, 12(2), 151. https://doi.org/10.3390/bioengineering12020151