


SwinDAF3D: Pyramid Swin Transformers with Deep Attentive Features for Automated Finger Joint Segmentation in 3D Ultrasound Images for Rheumatoid Arthritis Assessment

 , , , , , , , , ,
Abstract
1. Introduction
- Utilization of Deep Attention Mechanism: SwinDAF3D uniquely integrates deep attention mechanisms with Swin FPN, allowing the model to focus on relevant features while suppressing irrelevant ones, thereby refining the overall feature extraction process in 3D US images.
- Clinical Impact for RA Assessment: SwinDAF3D improves automated synovium segmentation accuracy in 3D US images compared to baseline models, a critical advancement for reliable RA assessment and monitoring.
2. Materials and Methods
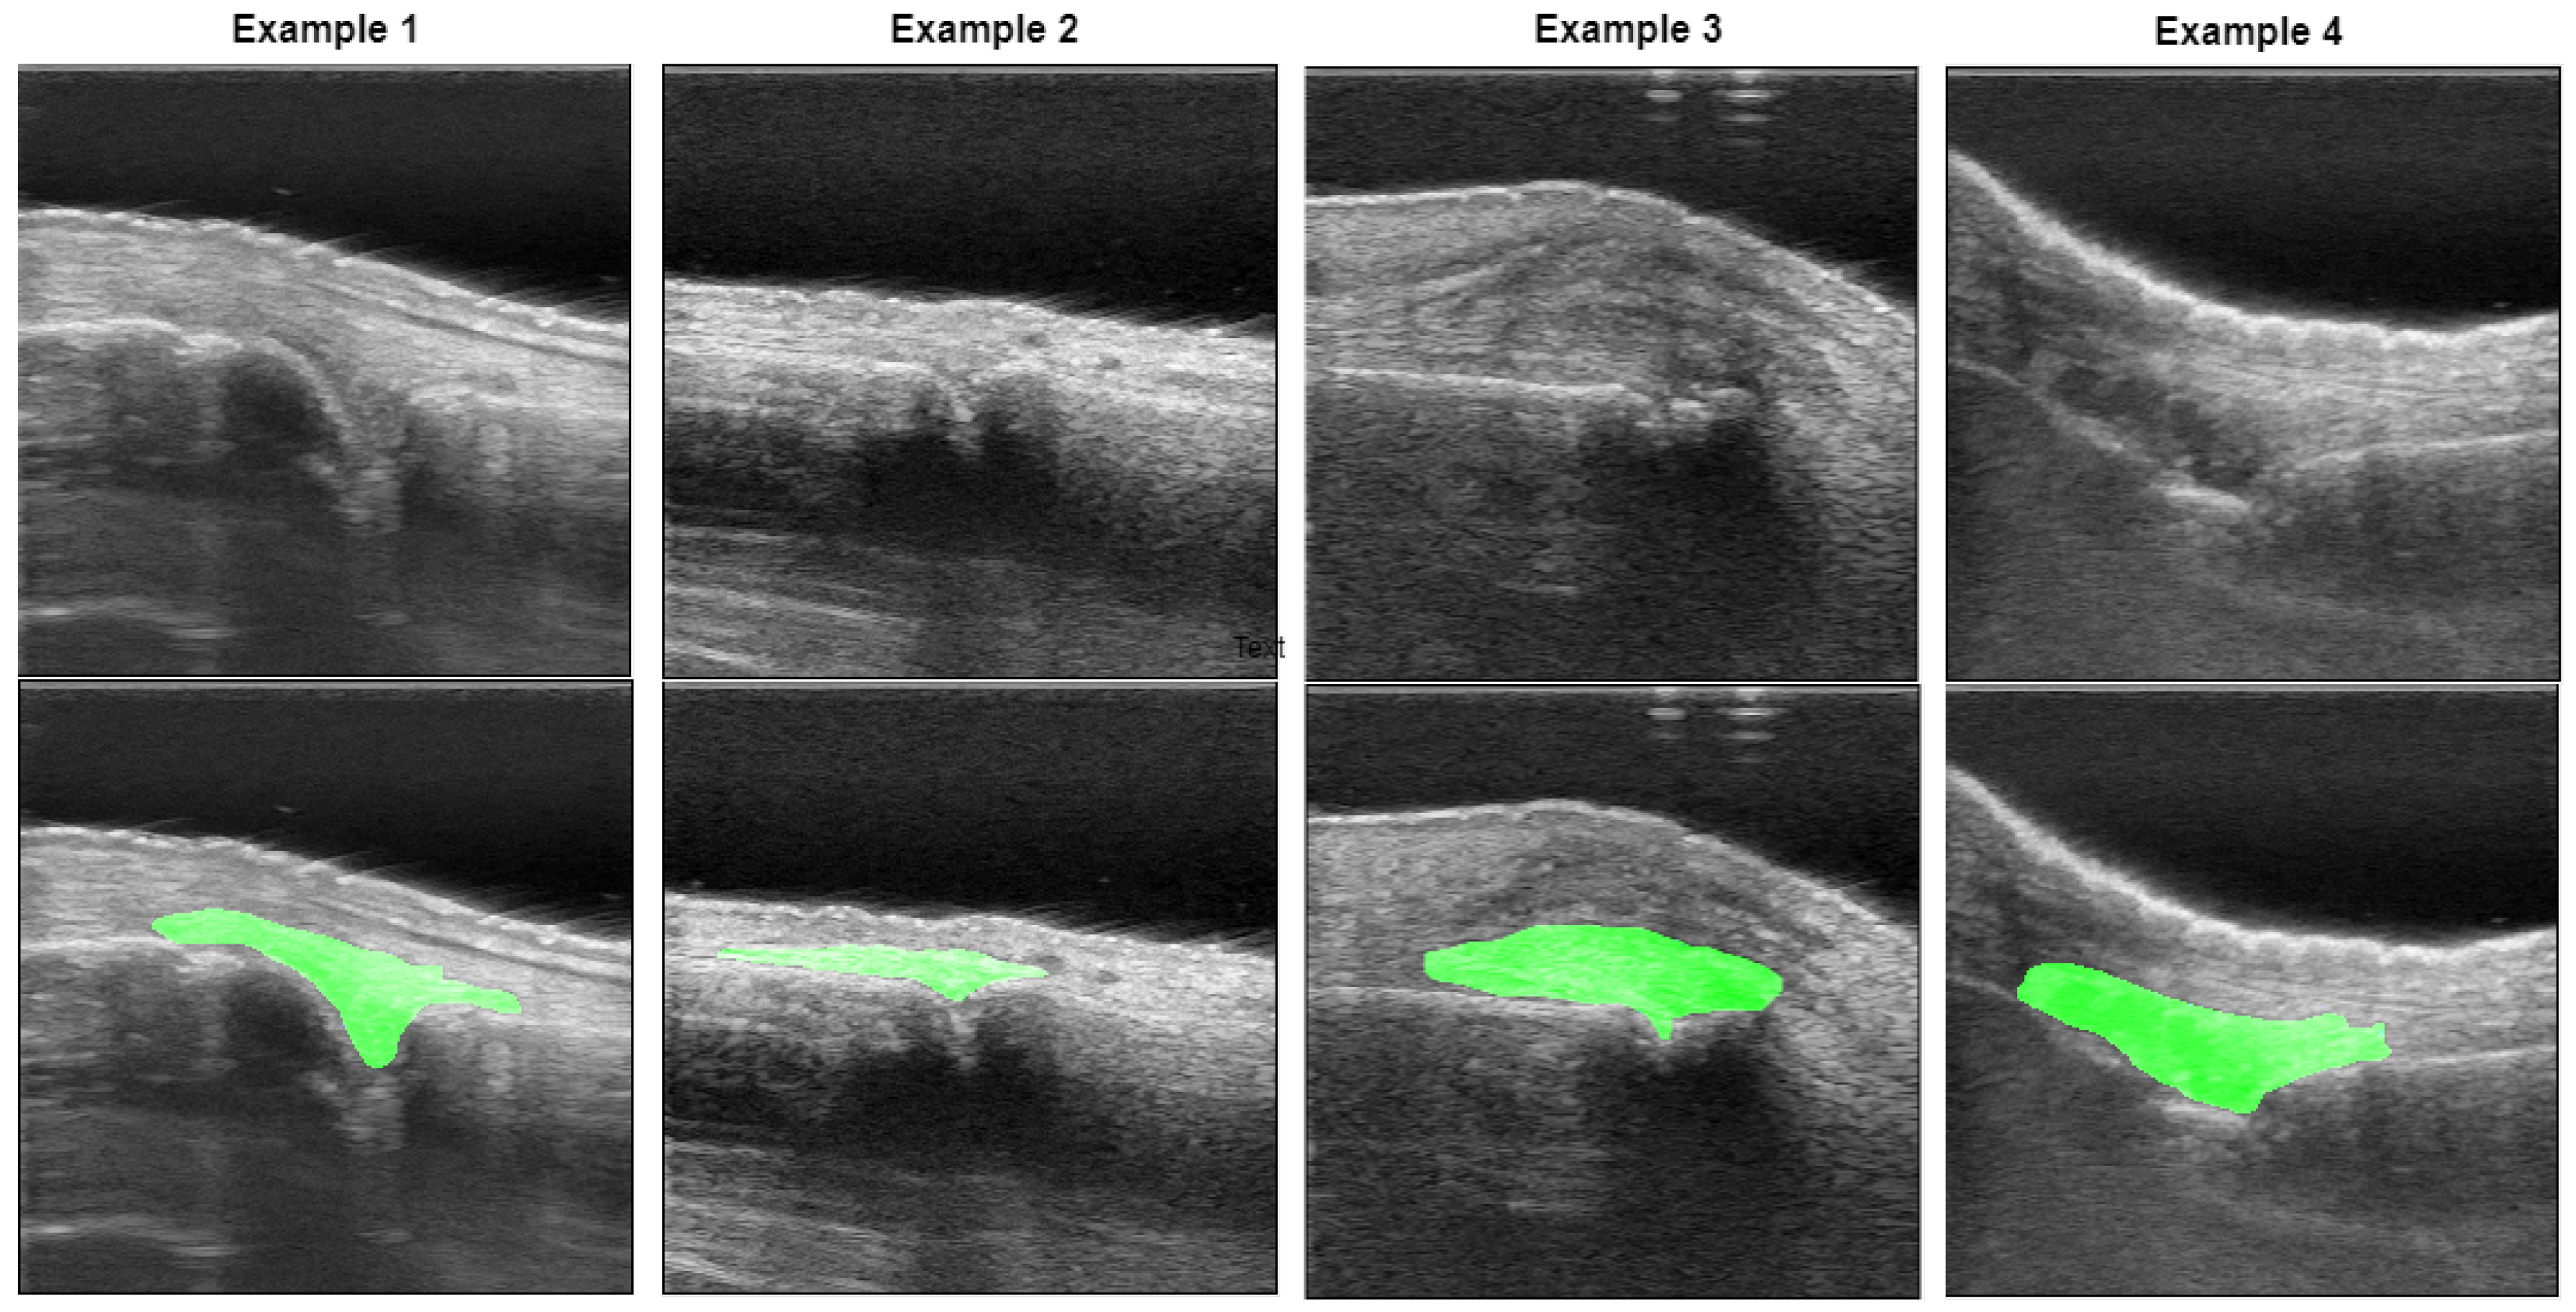
2.1. Data Acquisition
2.2. Data Pre-Processing
2.3. Network Architectures
2.3.1. 3D UNet
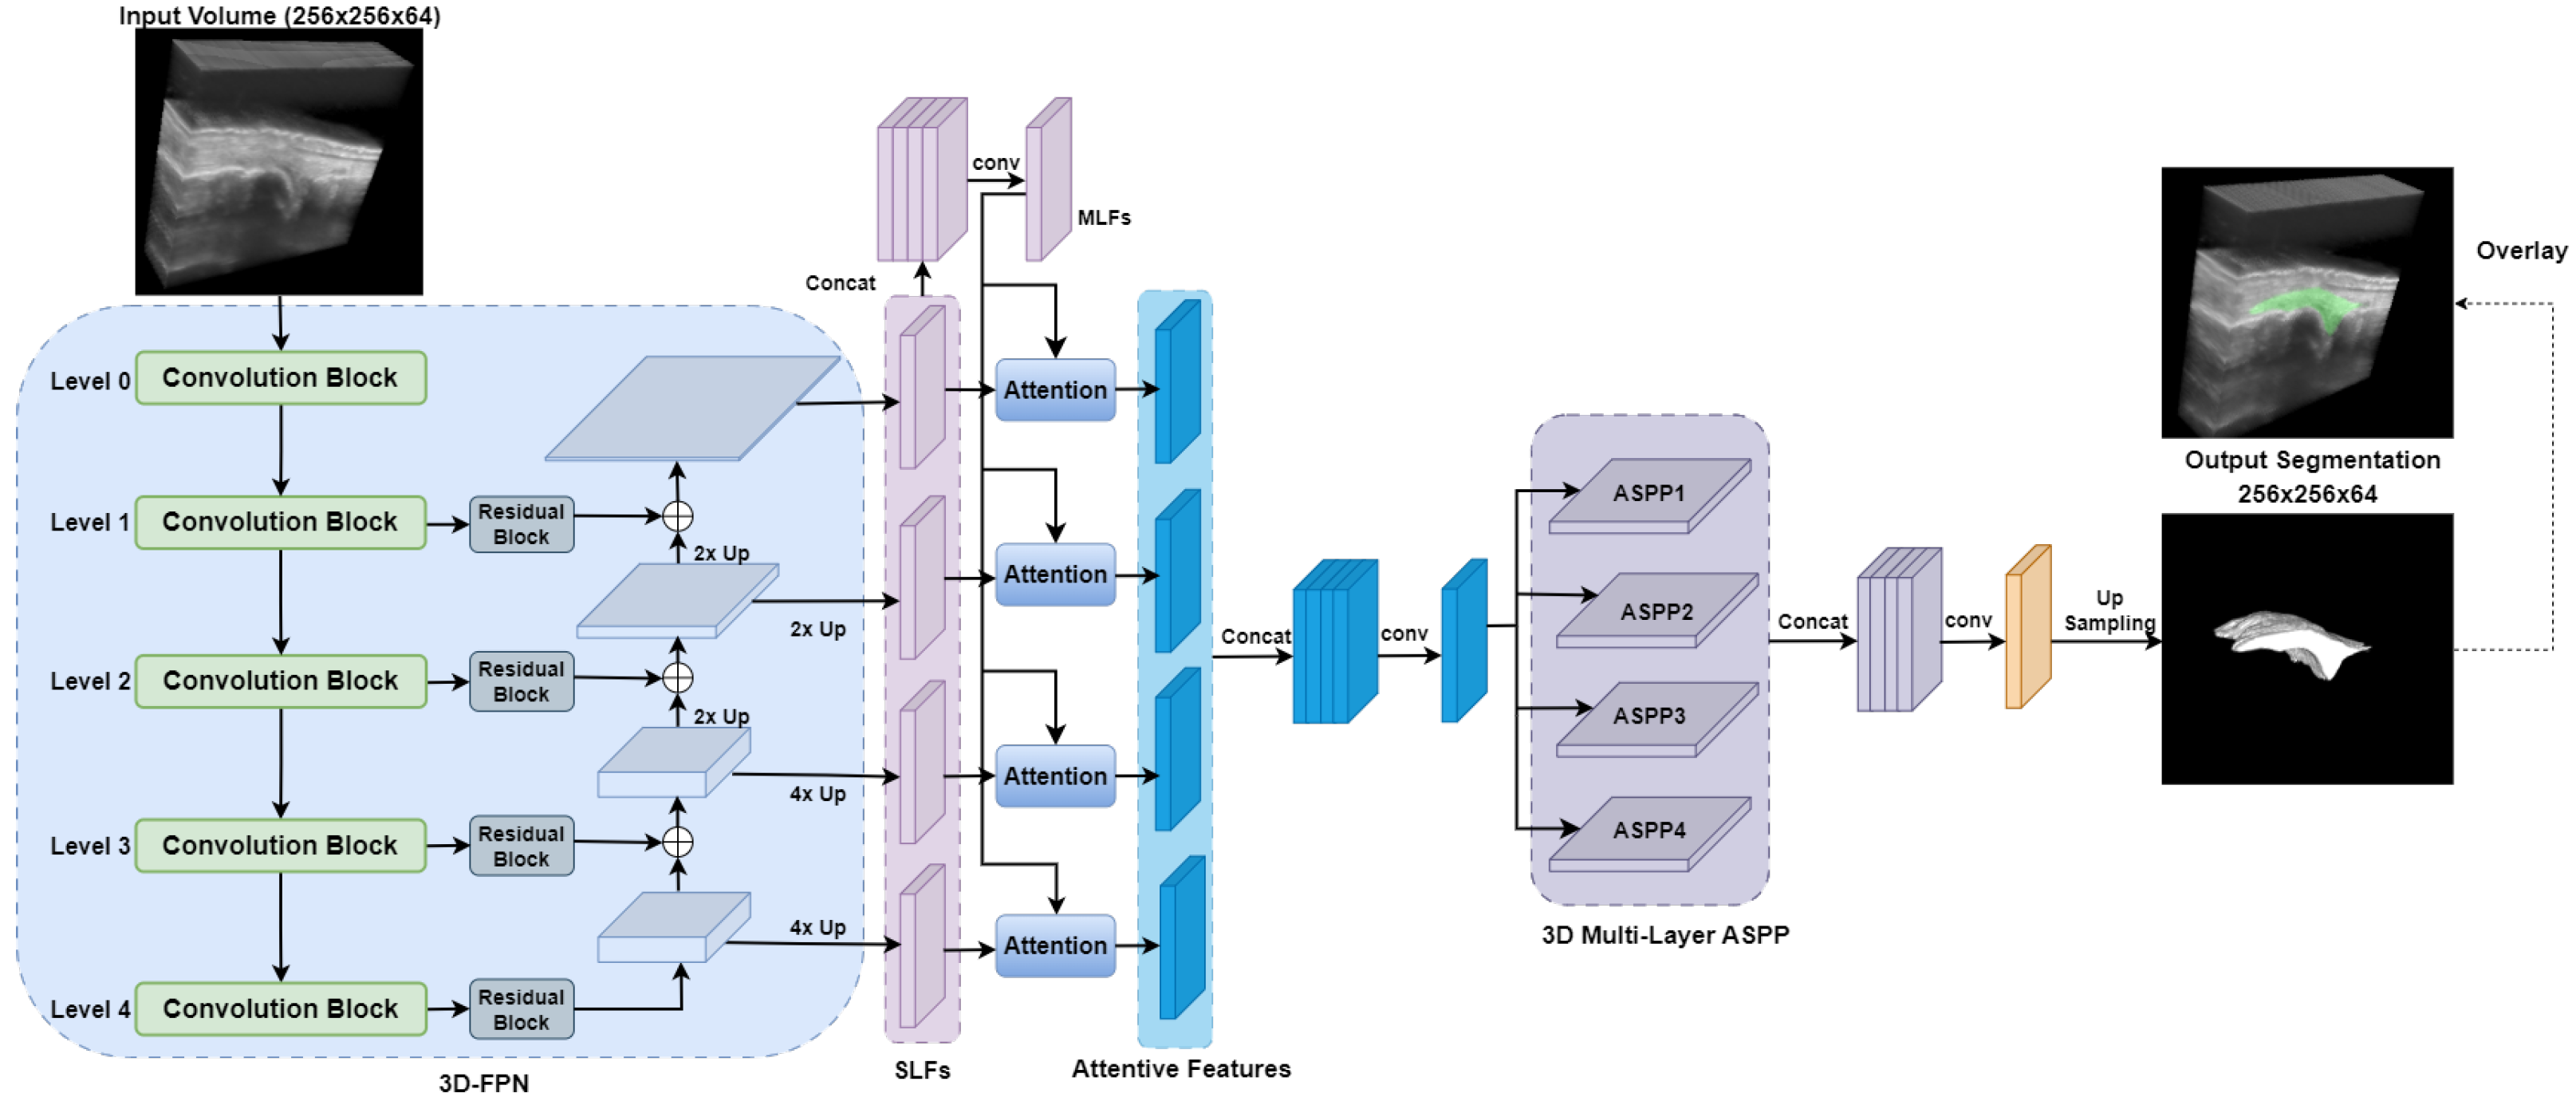
2.3.2. DAF3D
2.3.3. Swin UNETR
2.3.4. UNETR++
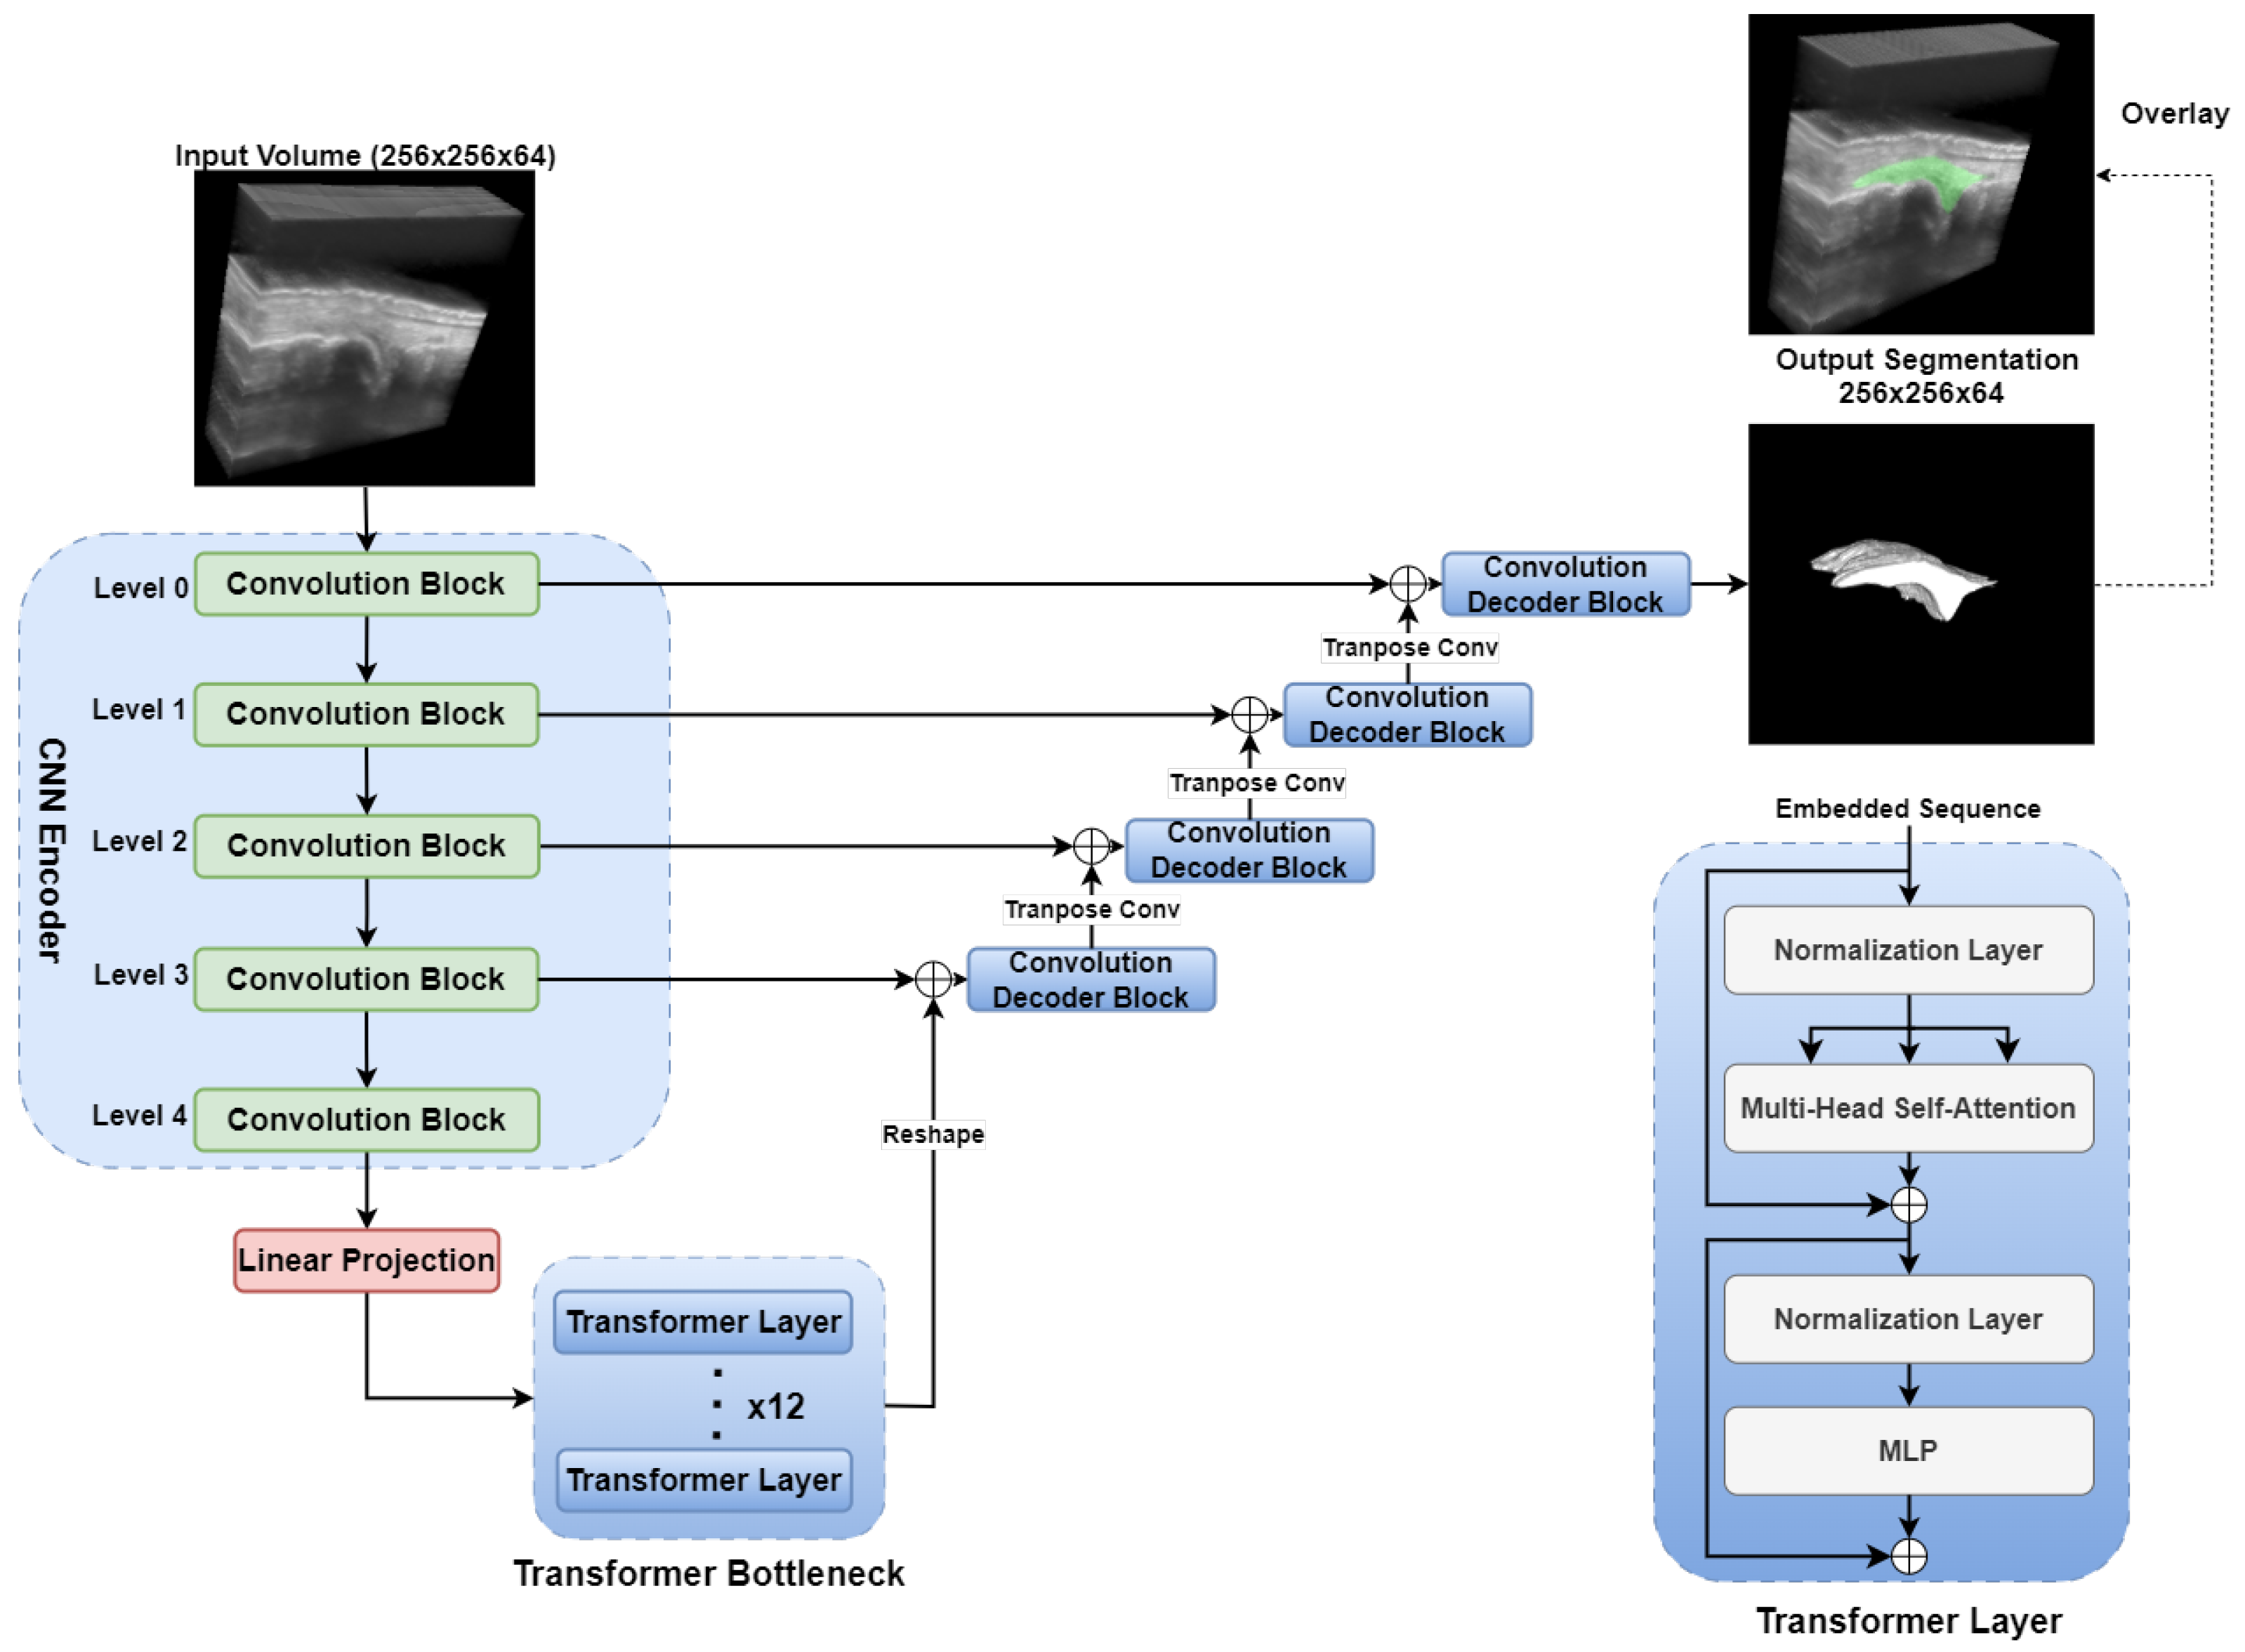
2.3.5. TransUNet
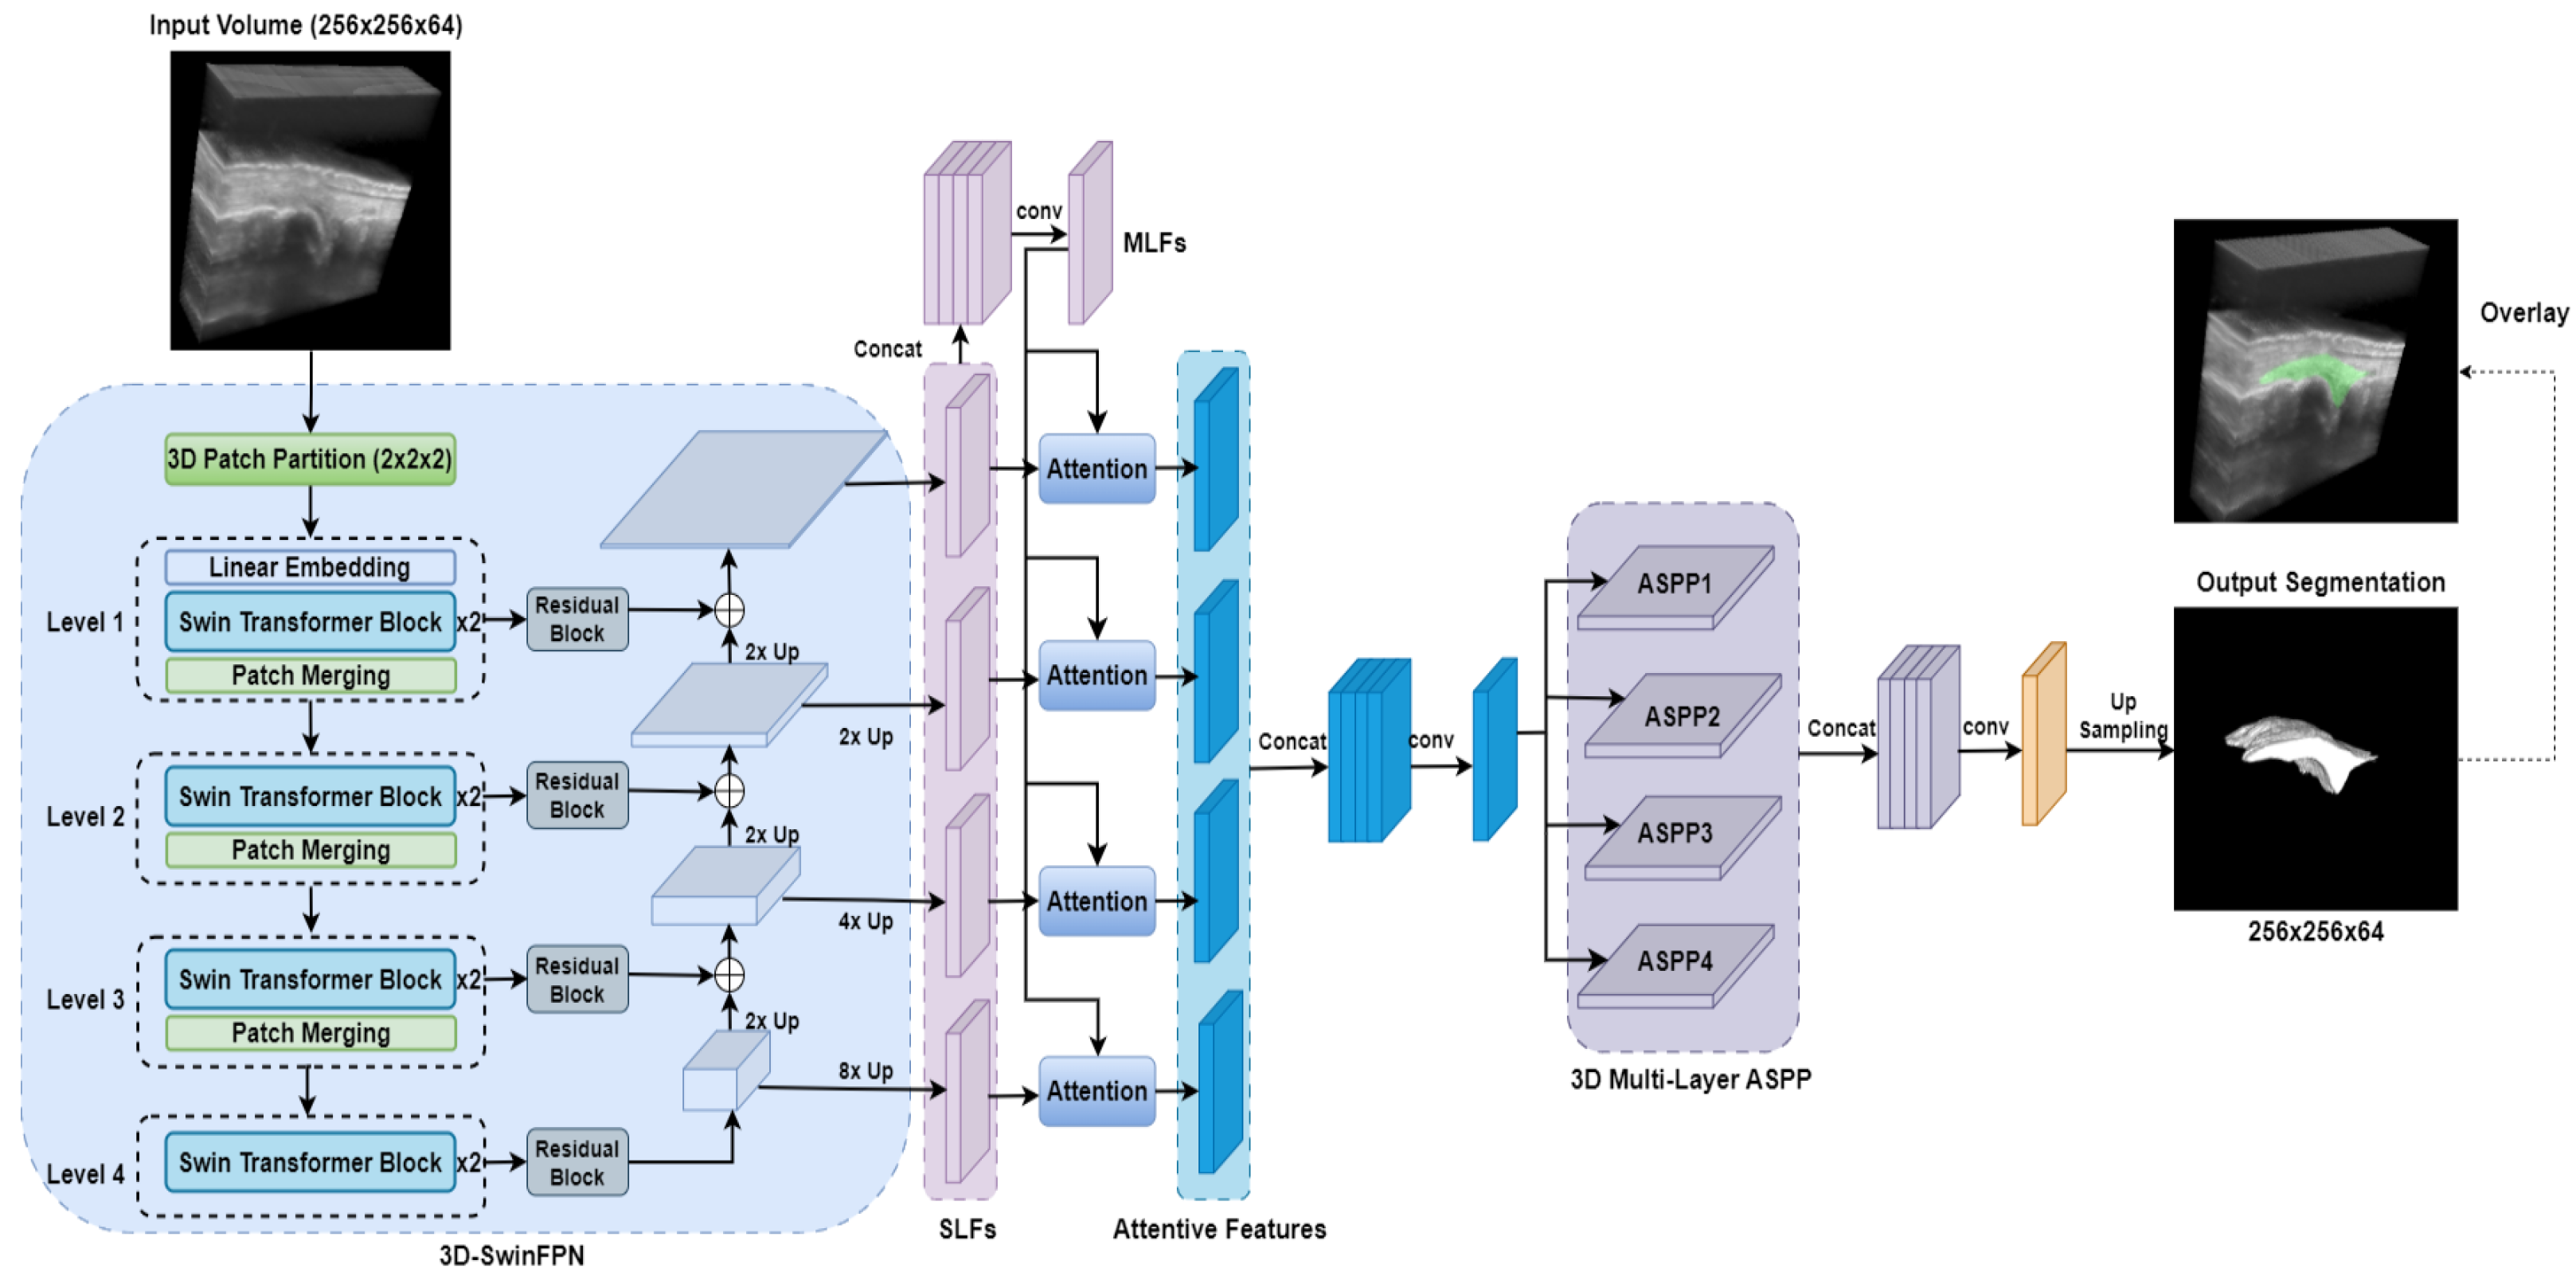
2.3.6. SwinDAF3D
2.4. Design of Ablation Study
- 3D UNet: Serves as a standard baseline CNN model for evaluating segmentation performance.
- DAF3D: Assesses the performance gains achieved by employing a hierarchical Swin Transformers backbone as opposed to a conventional CNN-based backbone like ResNeXt.
- Swin UNETR: Assesses the incremental benefits obtained by integrating deep attention mechanisms into the hierarchical Swin Transformers backbone.
- UNETR++: Compares the relative effectiveness of deep attention mechanisms against efficient paired attention (EPA) modules within a hierarchical transformer framework.
- TransUNet: Assesses the advantages of fully integrating hierarchical Swin Transformers and deep attention mechanisms compared to architectures that use transformers only at the bottleneck stage.
2.5. Model Training
2.6. Model Performance Assessment
3. Results
4. Discussion
5. Conclusions
Author Contributions
Funding
Institutional Review Board Statement
Informed Consent Statement
Data Availability Statement
Acknowledgments
Conflicts of Interest
References
- Aletaha, D.; Smolen, J.S. Diagnosis and management of rheumatoid arthritis: A review. JAMA 2018, 320, 1360–1372. [Google Scholar] [CrossRef] [PubMed]
- Dougados, M.; Devauchelle-Pensec, V.; François Ferlet, J.; D’Agostino, M.A.; Backhaus, M.; Bentin, J.; Chalès, G.; Chary-Valckenaere, I.; Conaghan, P.; Wakefield, R.J.; et al. The ability of synovitis to predict structural damage in rheumatoid arthritis: A comparative study between clinical examination and ultrasound. Ann. Rheum. Dis. 2013, 72, 665–671. [Google Scholar] [CrossRef] [PubMed]
- Visser, H. Early diagnosis of rheumatoid arthritis. Best Pract. Res. Clin. Rheumatol. 2005, 19, 55–72. [Google Scholar] [CrossRef] [PubMed]
- Naredo, E.; Collado, P.; Cruz, A.; Palop, M.J.; Cabero, F.; Richi, P.; Carmona, L.; Crespo, M. Longitudinal power Doppler ultrasonographic assessment of joint inflammatory activity in early rheumatoid arthritis: Predictive value in disease activity and radiologic progression. Arthritis Care Res. Off. J. Am. Coll. Rheumatol. 2007, 57, 116–124. [Google Scholar] [CrossRef]
- Sudoł-Szopińska, I.; Jans, L.; Teh, J. Rheumatoid arthritis: What do MRI and ultrasound show. J. Ultrason. 2017, 17, 5–16. [Google Scholar]
- Savnik, A.; Malmskov, H.; Thomsen, H.S.; Graff, L.B.; Nielsen, H.; Danneskiold-Samsøe, B.; Boesen, J.; Bliddal, H. MRI of the wrist and finger joints in inflammatory joint diseases at 1-year interval: MRI features to predict bone erosions. Eur. Radiol. 2002, 12, 1203–1210. [Google Scholar]
- Østergaard, M.; Stoltenberg, M.; Løvgreen-Nielsen, P.; Volck, B.; Jensen, C.H.; Lorenzen, I. Magnetic resonance imaging-determined synovial membrane and joint effusion volumes in rheumatoid arthritis and osteoarthritis. Comparison with the macroscopic and microscopic appearance of the synovium. Arthritis Rheum. 1997, 40, 1856–1867. [Google Scholar] [CrossRef]
- Rowbotham, E.L.; Grainger, A.J. Rheumatoid arthritis: Ultrasound versus MRI. Am. J. Roentgenol. 2011, 197, 541–546. [Google Scholar]
- Jo, J.; Xu, G.; Zhu, Y.; Burton, M.; Sarazin, J.; Schiopu, E.; Gandikota, G.; Wang, X. Detecting joint inflammation by an LED-based photoacoustic imaging system: A feasibility study. J. Biomed. Opt. 2018, 23, 110501. [Google Scholar]
- Yang, M.; Zhao, C.; Wang, M.; Wang, Q.; Zhang, R.; Bai, W.; Liu, J.; Zhang, S.; Xu, D.; Liu, S.; et al. Synovial oxygenation at photoacoustic imaging to assess rheumatoid arthritis disease activity. Radiology 2023, 306, 220–228. [Google Scholar]
- Jo, J.; Xu, G.; Cao, M.; Marquardt, A.; Francis, S.; Gandikota, G.; Wang, X. A functional study of human inflammatory arthritis using photoacoustic imaging. Sci. Rep. 2017, 7, 15026. [Google Scholar]
- Peng, X.; Dentinger, A.; Kewalramani, S.; Xu, Z.; Gray, S.; Ghose, S.; Tan, Y.T.; Yang, Z.; Jo, J.; Chamberland, D.; et al. An Automatic 3D Ultrasound and Photoacoustic Combined Imaging System for Human Inflammatory Arthritis. IEEE Trans. Ultrason. Ferroelectr. Freq. Control 2023, 70, 1691–1702. [Google Scholar] [PubMed]
- Nurzynska, K.; Smolka, B. Segmentation of finger joint synovitis in ultrasound images. In Proceedings of the 2016 IEEE Sixth International Conference on Communications and Electronics (ICCE), Ha Long, Vietnam, 27–29 July 2016; IEEE: New York, NY, USA, 2016; pp. 335–340. [Google Scholar]
- Radlak, K.; Raddle, N.; Smolka, B. Automatic detection of bones based on the confidence map for rheumatoid arthritis analysis. Comput. Vis. Med. Image Process. 2015, 215–220. [Google Scholar]
- Hemalatha, R.; Vijaybaskar, V.; Thamizhvani, T. Automatic localization of anatomical regions in medical ultrasound images of rheumatoid arthritis using deep learning. Proc. Inst. Mech. Eng. Part H J. Eng. Med. 2019, 233, 657–667. [Google Scholar]
- Wang, Z. Deep learning in medical ultrasound image segmentation: A review. arXiv 2020, arXiv:2002.07703. [Google Scholar]
- Song, Y.; Ren, S.; Lu, Y.; Fu, X.; Wong, K.K. Deep learning-based automatic segmentation of images in cardiac radiography: A promising challenge. Comput. Methods Programs Biomed. 2022, 220, 106821. [Google Scholar]
- Xing, W.; Li, G.; He, C.; Huang, Q.; Cui, X.; Li, Q.; Li, W.; Chen, J.; Ta, D. Automatic detection of A-line in lung ultrasound images using deep learning and image processing. Med. Phys. 2023, 50, 330–343. [Google Scholar]
- Rahman, H.; Bukht, T.F.N.; Imran, A.; Tariq, J.; Tu, S.; Alzahrani, A. A deep learning approach for liver and tumor segmentation in CT images using ResUNet. Bioengineering 2022, 9, 368. [Google Scholar] [CrossRef]
- Xu, Y.; Wang, Y.; Yuan, J.; Cheng, Q.; Wang, X.; Carson, P.L. Medical breast ultrasound image segmentation by machine learning. Ultrasonics 2019, 91, 1–9. [Google Scholar]
- Huang, Q.; Tian, H.; Jia, L.; Li, Z.; Zhou, Z. A review of deep learning segmentation methods for carotid artery ultrasound images. Neurocomputing 2023, 545, 126298. [Google Scholar]
- Sharbatdaran, A.; Romano, D.; Teichman, K.; Dev, H.; Raza, S.I.; Goel, A.; Moghadam, M.C.; Blumenfeld, J.D.; Chevalier, J.M.; Shimonov, D.; et al. Deep learning automation of kidney, liver, and spleen segmentation for organ volume measurements in autosomal dominant polycystic kidney disease. Tomography 2022, 8, 1804–1819. [Google Scholar] [CrossRef]
- Ramakrishnan, A.H.; Rajappa, M.; Krithivasan, K.; Chockalingam, N.; Chatzistergos, P.E.; Amirtharajan, R. A concept for fully automated segmentation of bone in ultrasound imaging. Sci. Rep. 2025, 15, 8124. [Google Scholar] [CrossRef] [PubMed]
- Huang, A.; Jiang, L.; Zhang, J.; Wang, Q. Attention-VGG16-UNet: A novel deep learning approach for automatic segmentation of the median nerve in ultrasound images. Quant. Imaging Med. Surg. 2022, 12, 3138. [Google Scholar] [CrossRef] [PubMed]
- Song, W.; Wang, X.; Guo, Y.; Li, S.; Xia, B.; Hao, A. Centerformer: A novel cluster center enhanced transformer for unconstrained dental plaque segmentation. IEEE Trans. Multimed. 2024, 26, 10965–10978. [Google Scholar] [CrossRef]
- Çiçek, Ö.; Abdulkadir, A.; Lienkamp, S.S.; Brox, T.; Ronneberger, O. 3D U-Net: Learning dense volumetric segmentation from sparse annotation. In Proceedings of the Medical Image Computing and Computer-Assisted Intervention–MICCAI 2016: 19th International Conference, Athens, Greece, 17–21 October 2016; Proceedings, Part II 19. Springer: Berlin/Heidelberg, Germany, 2016; pp. 424–432. [Google Scholar]
- Liu, Z.; Lin, Y.; Cao, Y.; Hu, H.; Wei, Y.; Zhang, Z.; Lin, S.; Guo, B. Swin transformer: Hierarchical vision transformer using shifted windows. In Proceedings of the IEEE/CVF International Conference on Computer Vision, Montreal, BC, Canada, 11–17 October 2021; pp. 10012–10022. [Google Scholar]
- Liu, Z.; Ning, J.; Cao, Y.; Wei, Y.; Zhang, Z.; Lin, S.; Hu, H. Video swin transformer. In Proceedings of the IEEE/CVF Conference on Computer Vision and Pattern Recognition, New Orleans, LA, USA, 18–24 June 2022; pp. 3202–3211. [Google Scholar]
- Dosovitskiy, A.; Beyer, L.; Kolesnikov, A.; Weissenborn, D.; Zhai, X.; Unterthiner, T.; Dehghani, M.; Minderer, M.; Heigold, G.; Gelly, S.; et al. An image is worth 16x16 words: Transformers for image recognition at scale. arXiv 2020, arXiv:2010.11929. [Google Scholar]
- Rehman, M.U.; Nizami, I.F.; Ullah, F.; Hussain, I. IQA Vision Transformed: A Survey of Transformer Architectures in Perceptual Image Quality Assessment. IEEE Access 2024, 12, 183369–183393. [Google Scholar] [CrossRef]
- Hatamizadeh, A.; Nath, V.; Tang, Y.; Yang, D.; Roth, H.R.; Xu, D. Swin unetr: Swin transformers for semantic segmentation of brain tumors in mri images. In International MICCAI Brainlesion Workshop; Springer: Berlin/Heidelberg, Germany, 2021; pp. 272–284. [Google Scholar]
- Sun, W.; Chen, J.; Yan, L.; Lin, J.; Pang, Y.; Zhang, G. COVID-19 CT image segmentation method based on swin transformer. Front. Physiol. 2022, 13, 981463. [Google Scholar] [CrossRef]
- Yang, H.; Yang, D. CSwin-PNet: A CNN-Swin Transformer combined pyramid network for breast lesion segmentation in ultrasound images. Expert Syst. Appl. 2023, 213, 119024. [Google Scholar] [CrossRef]
- Li, G.Y.; Chen, J.; Jang, S.I.; Gong, K.; Li, Q. SwinCross: Cross-modal Swin transformer for head-and-neck tumor segmentation in PET/CT images. Med. Phys. 2024, 51, 2096–2107. [Google Scholar] [CrossRef]
- Wang, Y.; Dou, H.; Hu, X.; Zhu, L.; Yang, X.; Xu, M.; Qin, J.; Heng, P.A.; Wang, T.; Ni, D. Deep attentive features for prostate segmentation in 3D transrectal ultrasound. IEEE Trans. Med. Imaging 2019, 38, 2768–2778. [Google Scholar] [CrossRef]
- Xie, S.; Girshick, R.; Dollár, P.; Tu, Z.; He, K. Aggregated residual transformations for deep neural networks. In Proceedings of the IEEE Conference on Computer Vision and Pattern Recognition, Honolulu, HI, USA, 21–26 July 2017; pp. 1492–1500. [Google Scholar]
- Shaker, A.M.; Maaz, M.; Rasheed, H.; Khan, S.; Yang, M.H.; Khan, F.S. UNETR++: Delving into efficient and accurate 3D medical image segmentation. IEEE Trans. Med. Imaging 2024, 43, 3377–3390. [Google Scholar] [PubMed]
- Chen, J.; Lu, Y.; Yu, Q.; Luo, X.; Adeli, E.; Wang, Y.; Lu, L.; Yuille, A.L.; Zhou, Y. Transunet: Transformers make strong encoders for medical image segmentation. arXiv 2021, arXiv:2102.04306. [Google Scholar]
- Peng, X.; Xu, Z.; Dentinger, A.; Kewalramani, S.; Jo, J.; Xu, G.; Chamberland, D.; Abdulaziz, N.; Gandikota, G.; Mills, D.; et al. Longitudinal volumetric assessment of inflammatory arthritis via photoacoustic imaging and Doppler ultrasound imaging. Photoacoustics 2023, 31, 100514. [Google Scholar] [CrossRef] [PubMed]
- Yushkevich, P.A.; Piven, J.; Cody Hazlett, H.; Gimpel Smith, R.; Ho, S.; Gee, J.C.; Gerig, G. User-Guided 3D Active Contour Segmentation of Anatomical Structures: Significantly Improved Efficiency and Reliability. Neuroimage 2006, 31, 1116–1128. [Google Scholar] [CrossRef]
- Karageorgos, G.M.; Qiu, J.; Peng, X.; Yang, Z.; Ghose, S.; Dentinger, A.; Xu, Z.; Jo, J.; Ragupathi, S.; Xu, G.; et al. Automated Deep Learning-Based Finger Joint Segmentation in 3-D Ultrasound Images with Limited Dataset. Ultrason. Imaging 2025, 47, 14–23. [Google Scholar] [CrossRef]
- Zhou, Z.; Rahman Siddiquee, M.M.; Tajbakhsh, N.; Liang, J. Unet++: A nested u-net architecture for medical image segmentation. In Proceedings of the Deep Learning in Medical Image Analysis and Multimodal Learning for Clinical Decision Support: 4th International Workshop, DLMIA 2018, and 8th International Workshop, ML-CDS 2018, Held in Conjunction with MICCAI 2018, Granada, Spain, 20 September 2018; Proceedings 4. Springer: Berlin/Heidelberg, Germany, 2018; pp. 3–11. [Google Scholar]
- Pérez-García, F.; Sparks, R.; Ourselin, S. TorchIO: A Python library for efficient loading, preprocessing, augmentation and patch-based sampling of medical images in deep learning. Comput. Methods Programs Biomed. 2021, 208, 106236. [Google Scholar]
- Agarap, A.F. Deep learning using rectified linear units (relu). arXiv 2018, arXiv:1803.08375. [Google Scholar]
- He, K.; Zhang, X.; Ren, S.; Sun, J. Delving deep into rectifiers: Surpassing human-level performance on imagenet classification. In Proceedings of the IEEE International Conference on Computer Vision, Santiago, Chile, 7–13 December 2015; pp. 1026–1034. [Google Scholar]
- Chen, L.C.; Papandreou, G.; Schroff, F.; Adam, H. Rethinking atrous convolution for semantic image segmentation. arXiv 2017, arXiv:1706.05587. [Google Scholar]
- Vaswani, A.; Shazeer, N.; Parmar, N.; Uszkoreit, J.; Jones, L.; Gomez, A.N.; Kaiser, Ł.; Polosukhin, I. Attention is all you need. Adv. Neural Inf. Process. Syst. 2017, 30, 5998–6008. [Google Scholar]
- Hatamizadeh, A.; Tang, Y.; Nath, V.; Yang, D.; Myronenko, A.; Landman, B.; Roth, H.R.; Xu, D. Unetr: Transformers for 3d medical image segmentation. In Proceedings of the IEEE/CVF Winter Conference on Applications of Computer Vision, Waikoloa, HI, USA, 3–8 January 2022; pp. 574–584. [Google Scholar]
- Paszke, A.; Gross, S.; Massa, F.; Lerer, A.; Bradbury, J.; Chanan, G.; Killeen, T.; Lin, Z.; Gimelshein, N.; Antiga, L.; et al. Pytorch: An imperative style, high-performance deep learning library. Adv. Neural Inf. Process. Syst. 2019, 32, 8024–8035. [Google Scholar]
- Cardoso, M.J.; Li, W.; Brown, R.; Ma, N.; Kerfoot, E.; Wang, Y.; Murrey, B.; Myronenko, A.; Zhao, C.; Yang, D.; et al. Monai: An open-source framework for deep learning in healthcare. arXiv 2022, arXiv:2211.02701. [Google Scholar]
- Kingma, D.P.; Ba, J. Adam: A method for stochastic optimization. arXiv 2014, arXiv:1412.6980. [Google Scholar]
- Shamshad, F.; Khan, S.; Zamir, S.W.; Khan, M.H.; Hayat, M.; Khan, F.S.; Fu, H. Transformers in medical imaging: A survey. Med. Image Anal. 2023, 88, 102802. [Google Scholar]
- Heidari, M.; Kolahi, S.G.; Karimijafarbigloo, S.; Azad, B.; Bozorgpour, A.; Hatami, S.; Azad, R.; Diba, A.; Bagci, U.; Merhof, D.; et al. Computation-Efficient Era: A Comprehensive Survey of State Space Models in Medical Image Analysis. arXiv 2024, arXiv:2406.03430. [Google Scholar]
- Vafaeezadeh, M.; Behnam, H.; Gifani, P. Ultrasound Image Analysis with Vision Transformers. Diagnostics 2024, 14, 542. [Google Scholar] [CrossRef]
- Yeung, P.H.; Tan, Y.K.; Xu, S. Automated synovium segmentation in doppler ultrasound images for rheumatoid arthritis assessment. In Proceedings of the Medical Imaging 2018: Computer-Aided Diagnosis, Houston, TX, USA, 10–15 February 2018; SPIE: Philadelphia, PA, USA, 2018; Volume 10575, pp. 135–142. [Google Scholar]
- du Toit, C.; Hutter, M.; Gyacskov, I.; Tessier, D.; Dima, R.; Fenster, A.; Lalone, E. Deep learning for synovial volume segmentation of the first carpometacarpal joint in osteoarthritis patients. Osteoarthr. Imaging 2024, 4, 100176. [Google Scholar] [CrossRef]
- Kuok, C.P.; Yang, T.H.; Tsai, B.S.; Jou, I.M.; Horng, M.H.; Su, F.C.; Sun, Y.N. Segmentation of finger tendon and synovial sheath in ultrasound image using deep convolutional neural network. Biomed. Eng. Online 2020, 19, 24. [Google Scholar]


| Model Name | CNN Backbone | Transformer Backbone | Attention Mechanism | Transformer Integration Level |
|---|---|---|---|---|
| 3D UNet [26] | ✓ | – | – | – |
| DAF3D [35] | ✓ | – | ✓(Deep Attention) | – |
| Swin UNETR [31] | – | ✓(Swin) | – | Encoder |
| UNETR++ [37] | – | ✓ | ✓(EPA) | Encoder & Decoder |
| TransUNet [38] | ✓ | ✓ | – | Bottleneck |
| SwinDAF3D | – | ✓(Swin) | ✓(Deep Attention) | Encoder |
| 3D UNet | DAF3D | Swin UNETR | UNETR++ | TransUNet | SwinDAF3D | |||||||||||||
|---|---|---|---|---|---|---|---|---|---|---|---|---|---|---|---|---|---|---|
| Metrics | DSC | IoU | SDSC | DSC | IoU | SDSC | DSC | IoU | SDSC | DSC | IoU | SDSC | DSC | IoU | SDSC | DSC | IoU | SDSC |
| Fold 1 | 0.723 | 0.566 | 0.639 | 0.835 | 0.715 | 0.838 | 0.829 | 0.706 | 0.863 | 0.833 | 0.711 | 0.876 | 0.842 | 0.722 | 0.823 | 0.854 | 0.745 | 0.887 |
| Fold 2 | 0.747 | 0.596 | 0.675 | 0.814 | 0.697 | 0.826 | 0.768 | 0.628 | 0.798 | 0.791 | 0.659 | 0.801 | 0.817 | 0.690 | 0.789 | 0.815 | 0.684 | 0.845 |
| Fold 3 | 0.784 | 0.638 | 0.638 | 0.801 | 0.673 | 0.814 | 0.802 | 0.674 | 0.823 | 0.808 | 0.685 | 0.818 | 0.805 | 0.674 | 0.796 | 0.841 | 0.723 | 0.821 |
| Fold 4 | 0.713 | 0.555 | 0.623 | 0.833 | 0.714 | 0.821 | 0.835 | 0.704 | 0.822 | 0.801 | 0.671 | 0.811 | 0.807 | 0.677 | 0.822 | 0.832 | 0.709 | 0.851 |
| Fold 5 | 0.721 | 0.563 | 0.687 | 0.788 | 0.653 | 0.798 | 0.831 | 0.708 | 0.869 | 0.821 | 0.701 | 0.857 | 0.824 | 0.703 | 0.831 | 0.849 | 0.733 | 0.864 |
| Fold 6 | 0.763 | 0.617 | 0.701 | 0.811 | 0.683 | 0.805 | 0.785 | 0.645 | 0.755 | 0.807 | 0.675 | 0.814 | 0.812 | 0.683 | 0.828 | 0.835 | 0.719 | 0.841 |
| Mean | 0.742 | 0.589 | 0.661 | 0.813 | 0.689 | 0.817 | 0.808 | 0.678 | 0.822 | 0.810 | 0.684 | 0.829 | 0.818 | 0.692 | 0.815 | 0.838 | 0.719 | 0.852 |
| Std | 0.025 | 0.031 | 0.029 | 0.017 | 0.022 | 0.013 | 0.025 | 0.032 | 0.039 | 0.014 | 0.018 | 0.027 | 0.013 | 0.017 | 0.016 | 0.013 | 0.019 | 0.020 |
| Test Set | 0.691 | 0.571 | 0.633 | 0.768 | 0.643 | 0.793 | 0.788 | 0.654 | 0.814 | 0.779 | 0.646 | 0.811 | 0.781 | 0.651 | 0.798 | 0.825 | 0.692 | 0.832 |
| Feature Size (Window Size = 7) | Window Size (Feature Size = 48) | ||||||
|---|---|---|---|---|---|---|---|
| Size | DSC | IoU | SDSC | Size | DSC | IoU | SDSC |
| 24 | 0.793 | 0.658 | 0.801 | 3 | 0.778 | 0.641 | 0.793 |
| 36 | 0.811 | 0.676 | 0.818 | 5 | 0.808 | 0.671 | 0.831 |
| 48 | 0.825 | 0.692 | 0.832 | 7 | 0.825 | 0.692 | 0.832 |
| 60 | 0.827 | 0.695 | 0.833 | 9 | 0.824 | 0.690 | 0.837 |
| Model Name | GFLOPs | Memory Usage (MB) | Inference Time (s) |
|---|---|---|---|
| 3D UNet | 1006 | 2536 | 0.175 |
| DAF3D | 1263 | 1958 | 0.201 |
| Swin UNETR | 1522 | 7227 | 0.343 |
| UNETR++ | 262 | 1165 | 0.085 |
| TransUNet | 1182 | 4125 | 0.189 |
| SwinDAF3D | 1730 | 7597 | 0.375 |
Disclaimer/Publisher’s Note: The statements, opinions and data contained in all publications are solely those of the individual author(s) and contributor(s) and not of MDPI and/or the editor(s). MDPI and/or the editor(s) disclaim responsibility for any injury to people or property resulting from any ideas, methods, instructions or products referred to in the content. |
© 2025 by the authors. Licensee MDPI, Basel, Switzerland. This article is an open access article distributed under the terms and conditions of the Creative Commons Attribution (CC BY) license (https://creativecommons.org/licenses/by/4.0/).
Share and Cite
Qiu, J.; Karageorgos, G.M.; Peng, X.; Ghose, S.; Yang, Z.; Dentinger, A.; Xu, Z.; Jo, J.; Ragupathi, S.; Xu, G.; et al. SwinDAF3D: Pyramid Swin Transformers with Deep Attentive Features for Automated Finger Joint Segmentation in 3D Ultrasound Images for Rheumatoid Arthritis Assessment. Bioengineering 2025, 12, 390. https://doi.org/10.3390/bioengineering12040390
Qiu J, Karageorgos GM, Peng X, Ghose S, Yang Z, Dentinger A, Xu Z, Jo J, Ragupathi S, Xu G, et al. SwinDAF3D: Pyramid Swin Transformers with Deep Attentive Features for Automated Finger Joint Segmentation in 3D Ultrasound Images for Rheumatoid Arthritis Assessment. Bioengineering. 2025; 12(4):390. https://doi.org/10.3390/bioengineering12040390
Chicago/Turabian StyleQiu, Jianwei, Grigorios M. Karageorgos, Xiaorui Peng, Soumya Ghose, Zhaoyuan Yang, Aaron Dentinger, Zhanpeng Xu, Janggun Jo, Siddarth Ragupathi, Guan Xu, and et al. 2025. "SwinDAF3D: Pyramid Swin Transformers with Deep Attentive Features for Automated Finger Joint Segmentation in 3D Ultrasound Images for Rheumatoid Arthritis Assessment" Bioengineering 12, no. 4: 390. https://doi.org/10.3390/bioengineering12040390
APA StyleQiu, J., Karageorgos, G. M., Peng, X., Ghose, S., Yang, Z., Dentinger, A., Xu, Z., Jo, J., Ragupathi, S., Xu, G., Abdulaziz, N., Gandikota, G., Wang, X., & Mills, D. (2025). SwinDAF3D: Pyramid Swin Transformers with Deep Attentive Features for Automated Finger Joint Segmentation in 3D Ultrasound Images for Rheumatoid Arthritis Assessment. Bioengineering, 12(4), 390. https://doi.org/10.3390/bioengineering12040390