
Development of a Smartphone-Based Expert System for COVID-19 Risk Prediction at Early Stage

 ,
,  ,
, 
 ,
,  ,
,
Abstract
:1. Introduction
- Excluding redundant features from the utilized dataset by applying two different algorithms for ablation studies, such as K Best and Recursive Feature Elimination (RFE);
- Optimizing the ML models’ hyperparameters using Bayesian optimization;
- Performing comprehensive comparison in terms of different evaluation metrics among different ML models to select the best performing classifier for the aimed task;
- Finding the association between the significant features with the Apriori algorithm;
- Developing an intelligent application system in both smartphone and web interfaces to prognosticate COVID-19.
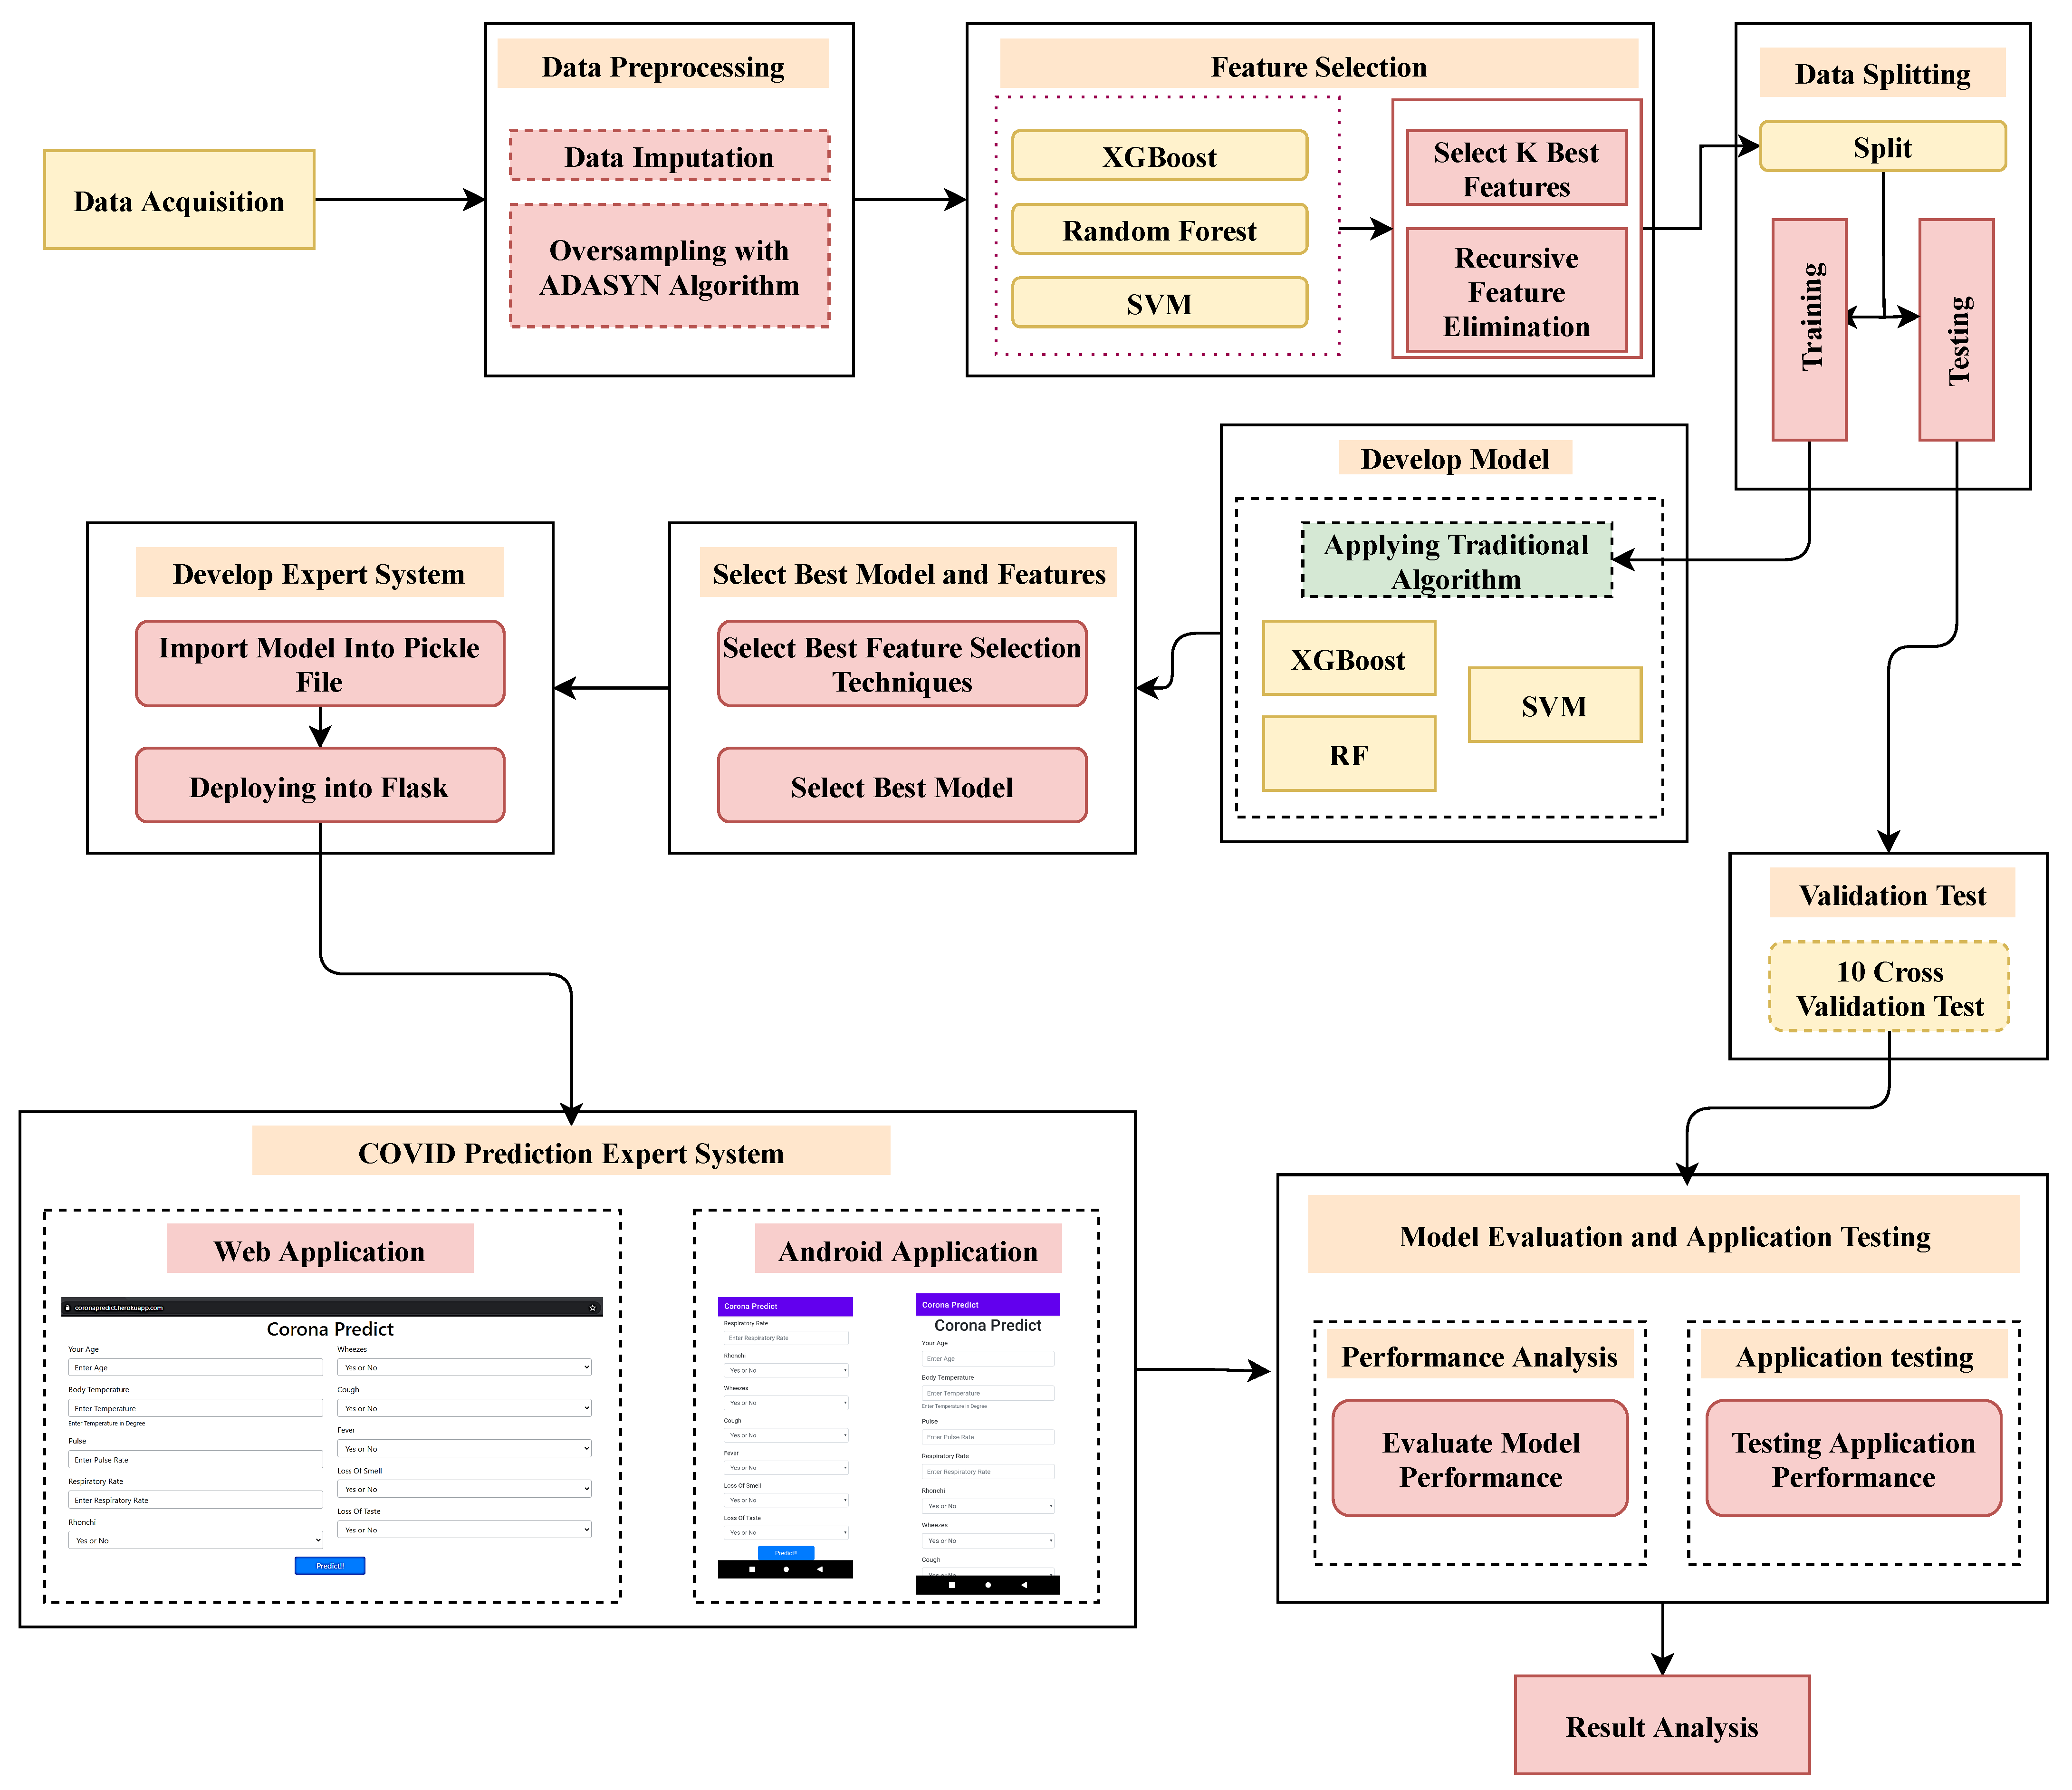
2. Analysis Procedure
2.1. Data Acquisition
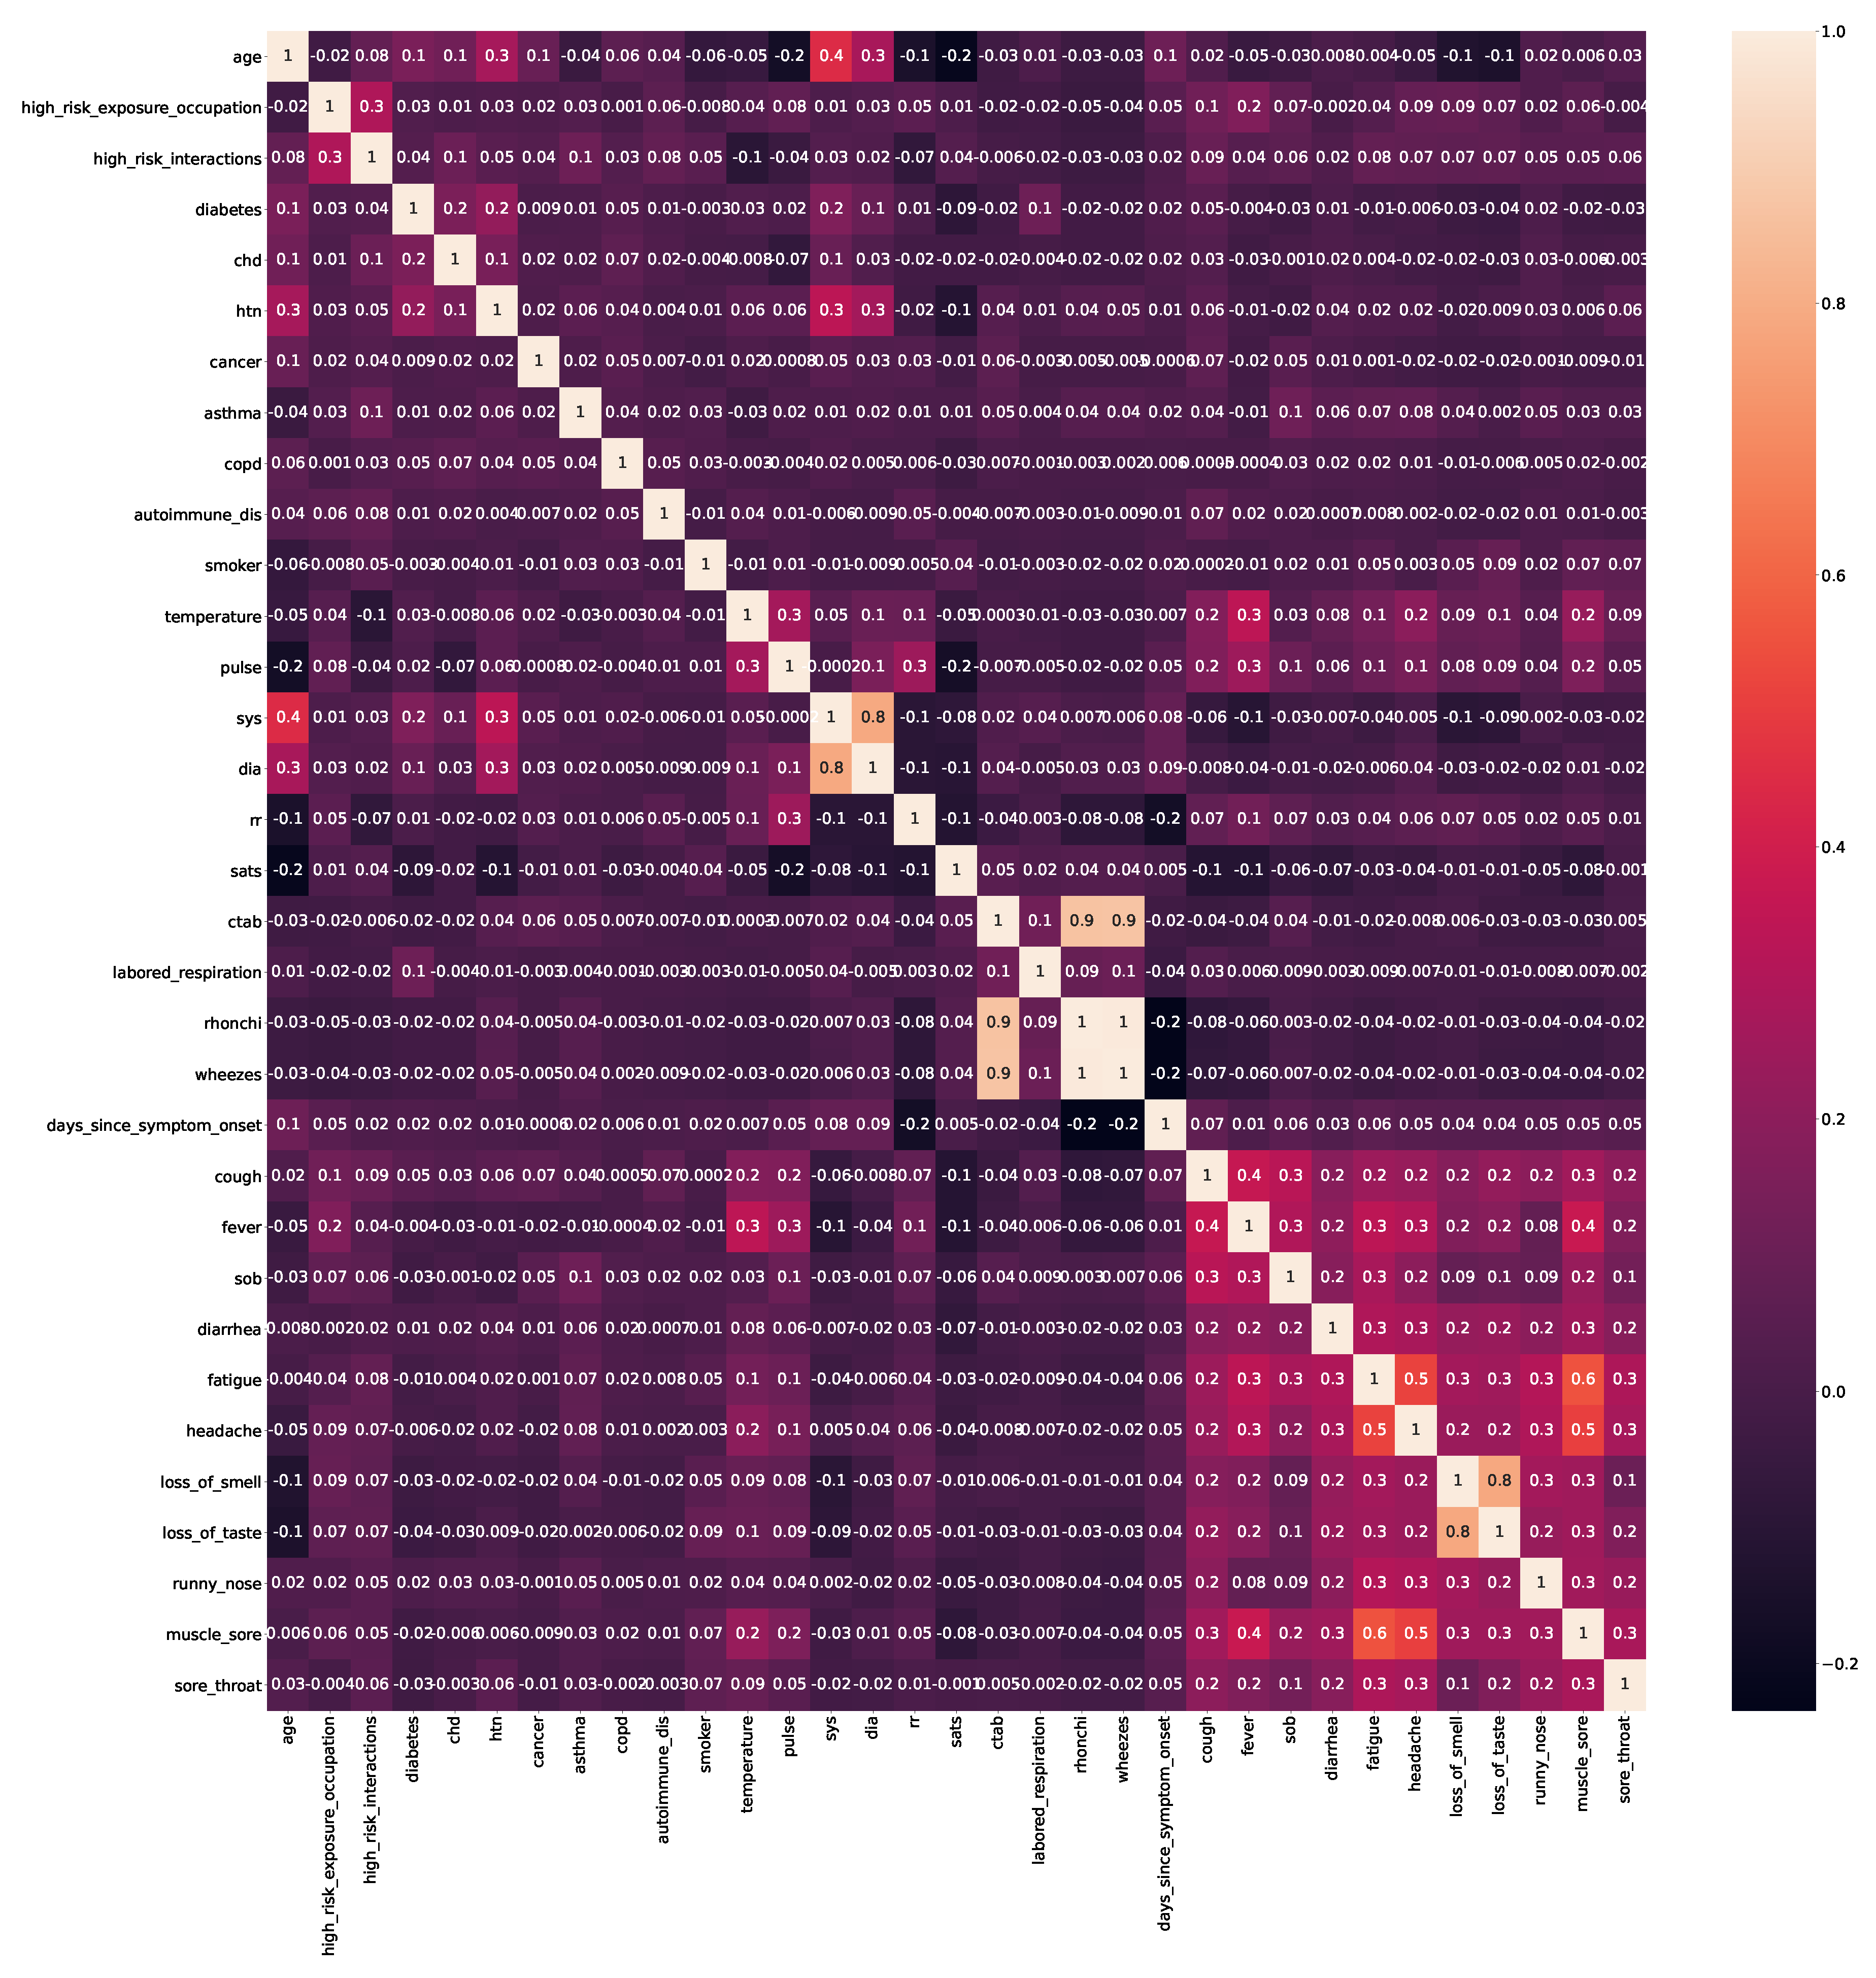
2.2. Preprocessing
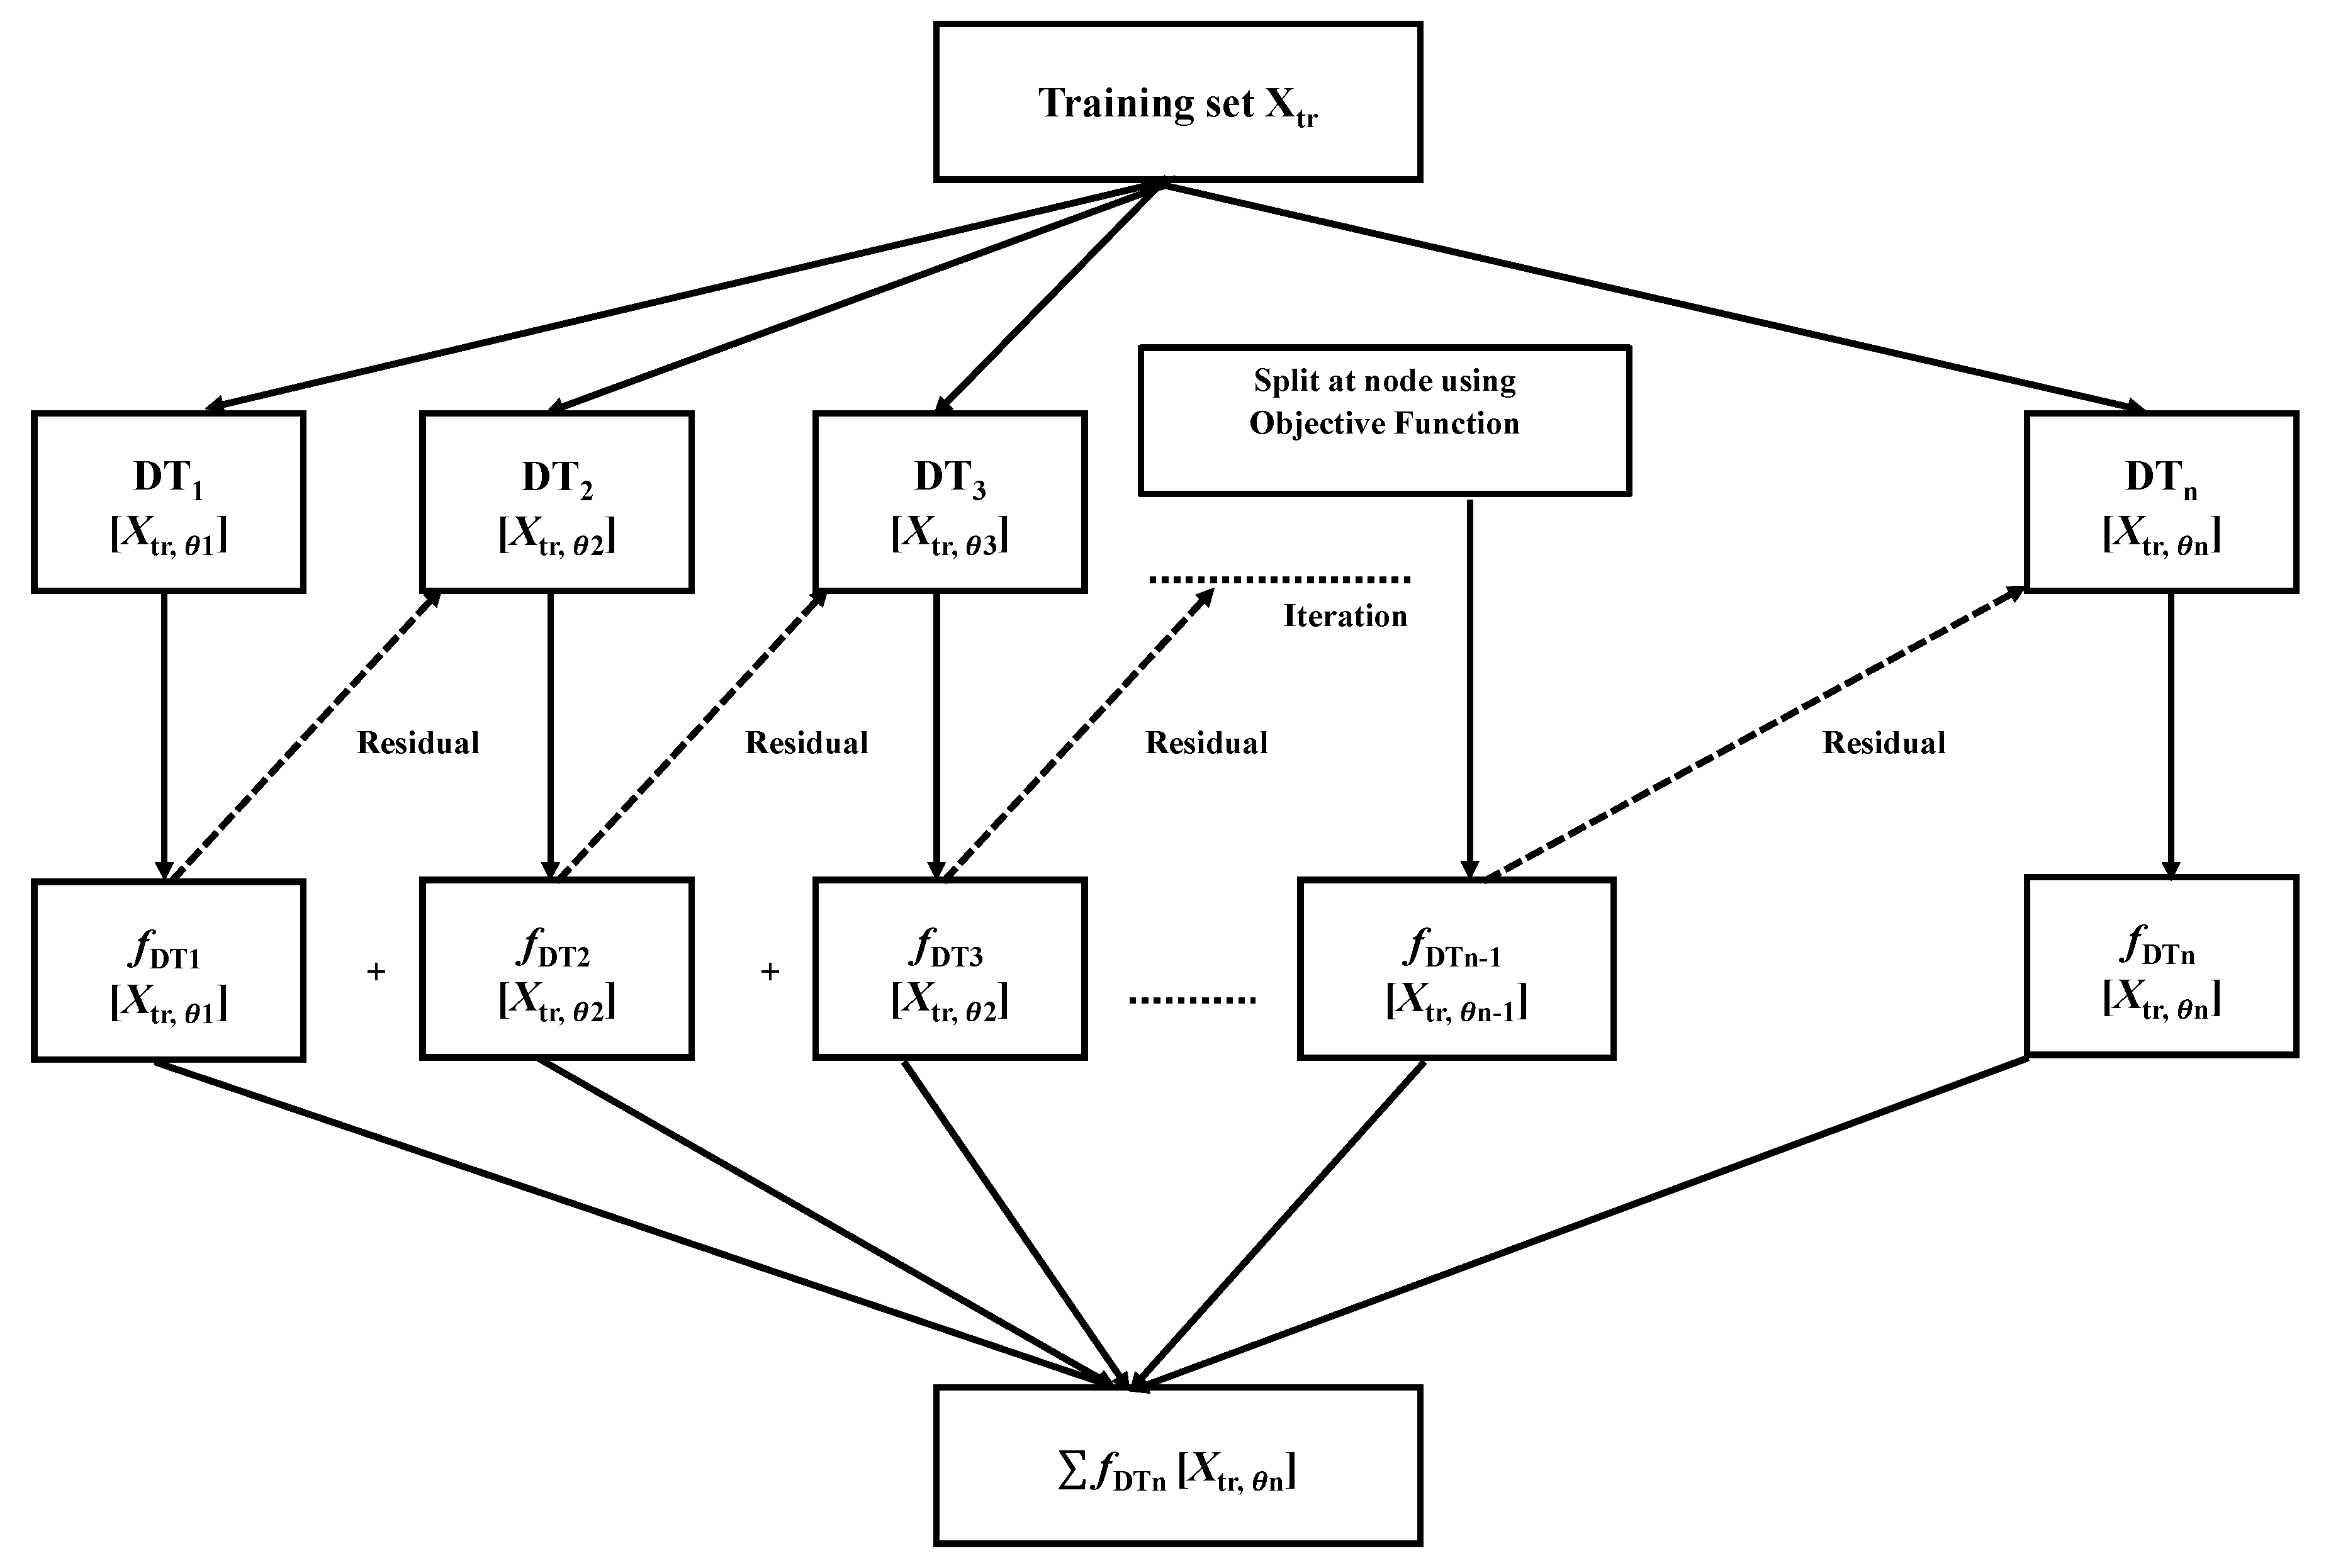
2.3. Classifiers
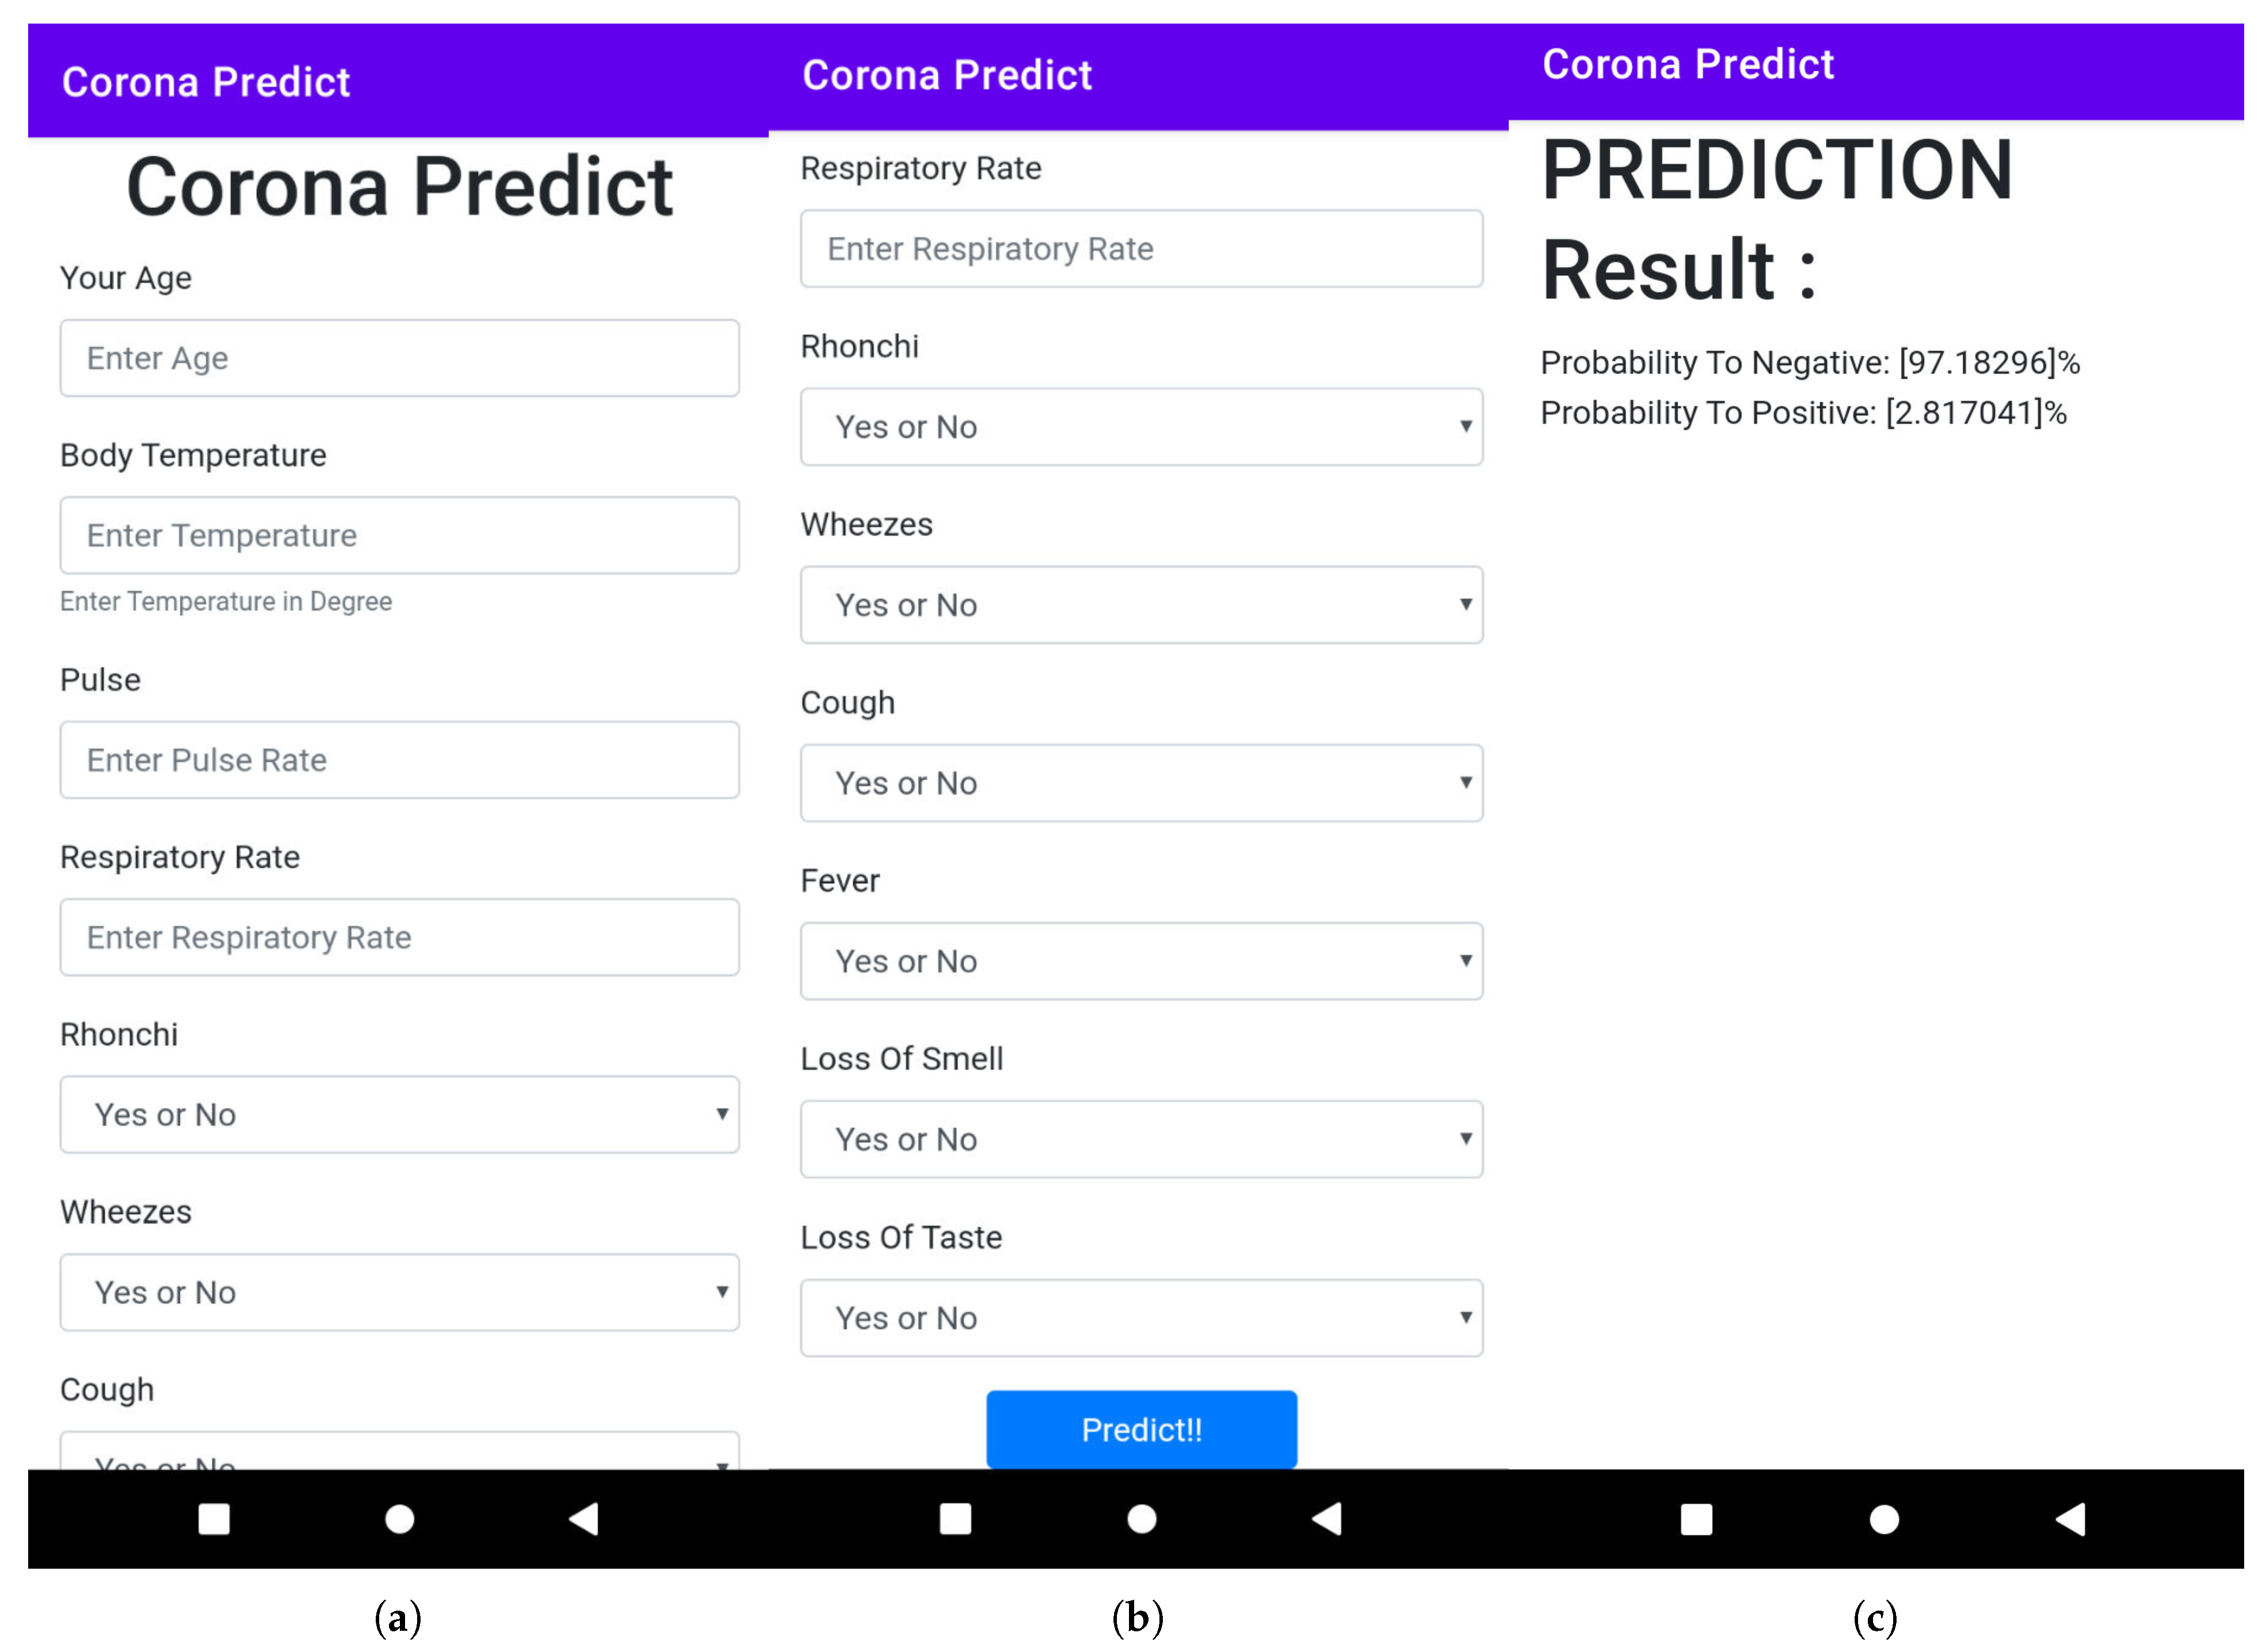
2.4. User Application Design
3. Experimented Outcome and Discussions
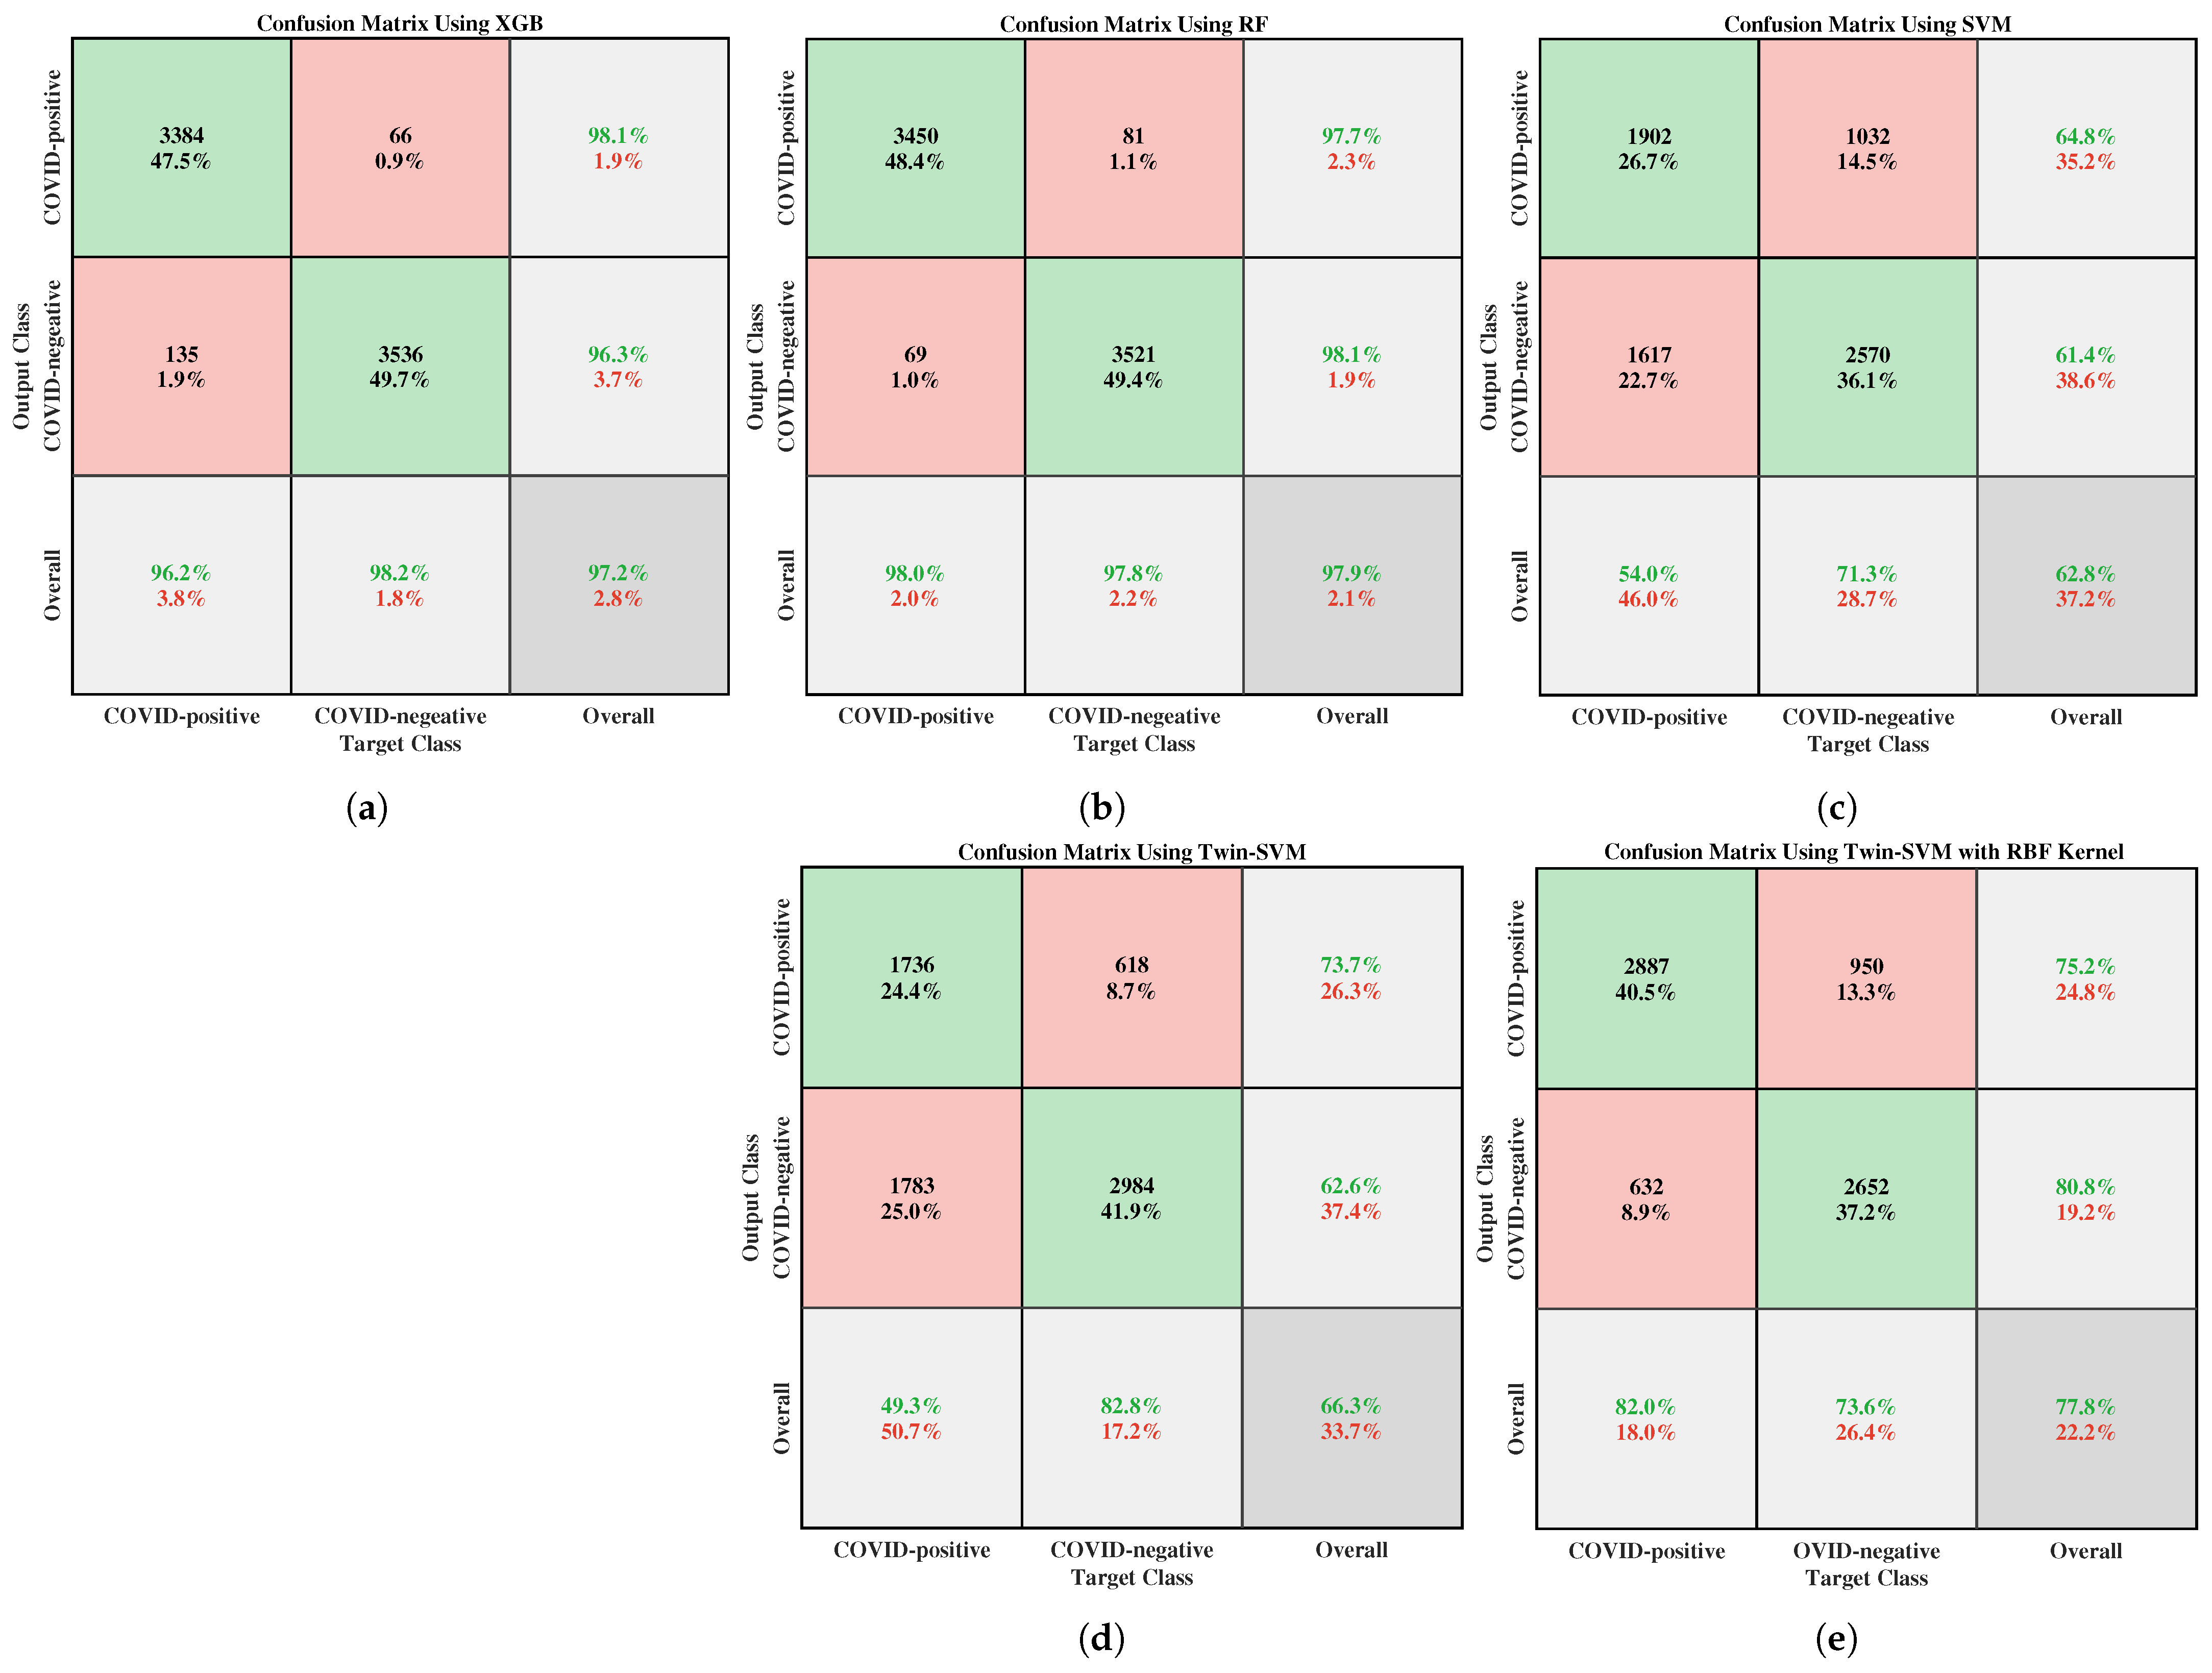
3.1. The Outcome of ML Classifiers
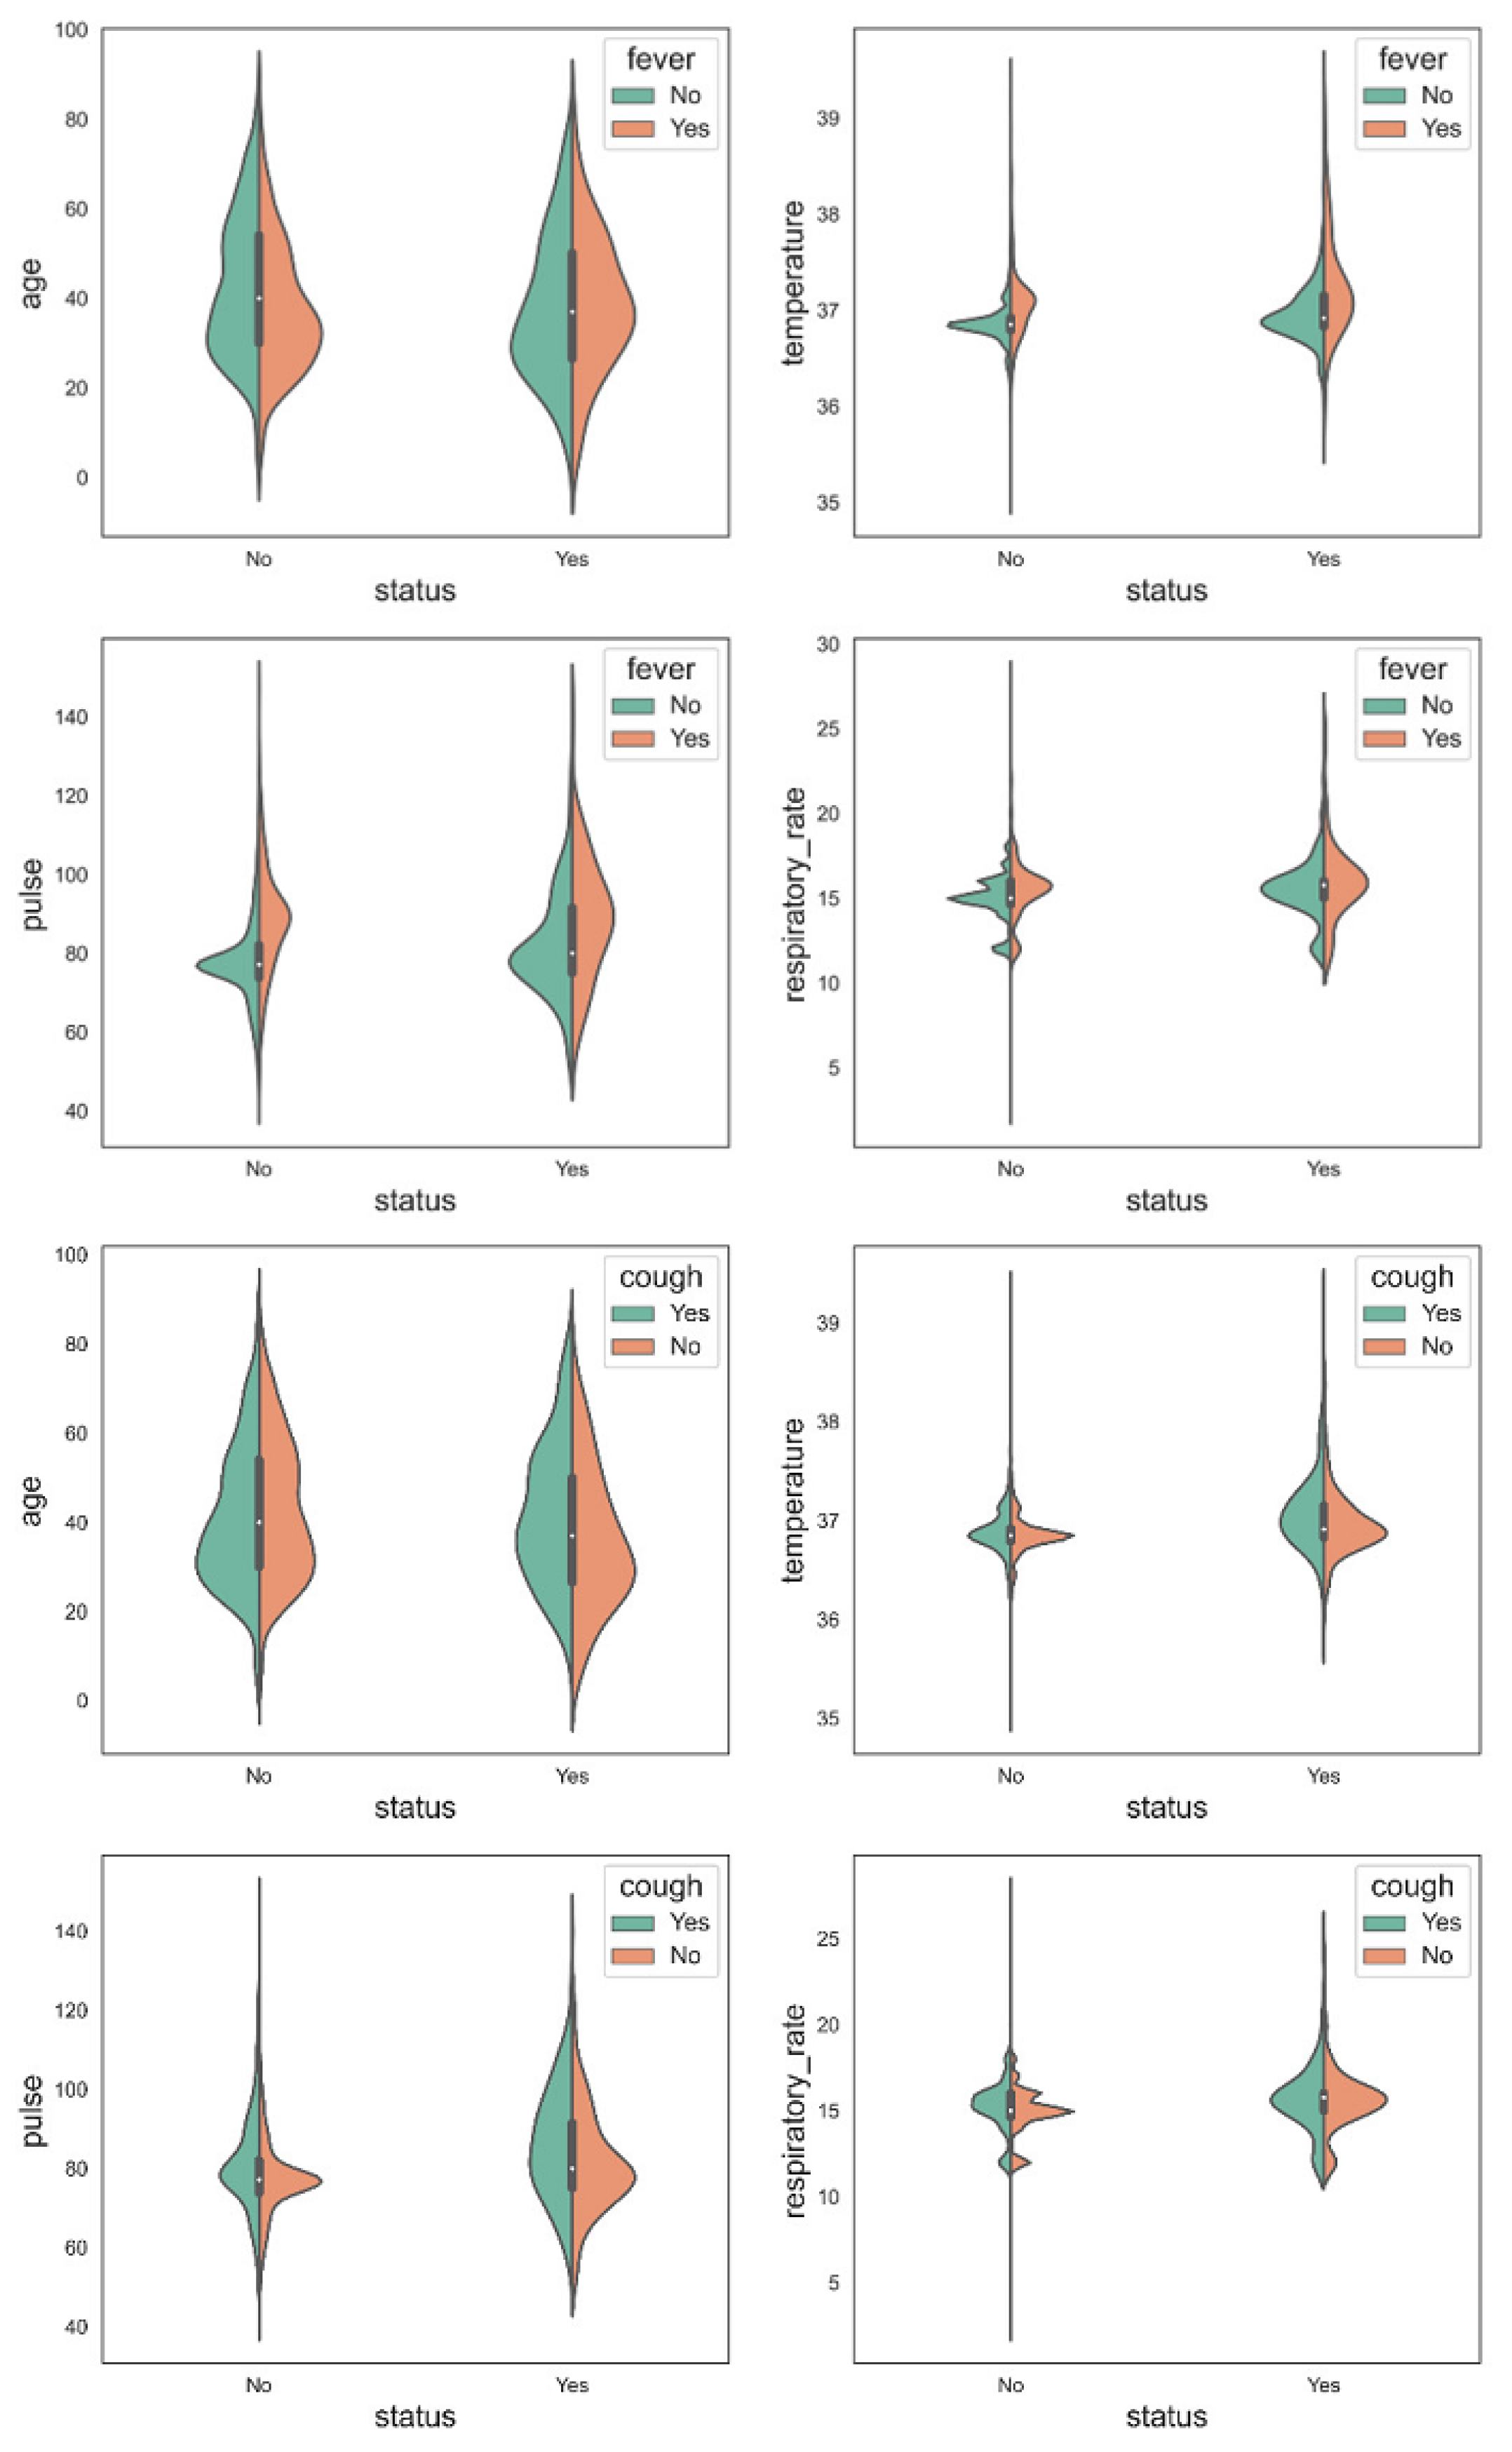
- Age;
- Temperature;
- Pulse;
- Respiratory rate;
- Bronchi;
- Wheezes;
- Cough;
- Fever;
- Loss of smell;
- Loss of taste.
3.1.1. Cross-Validation, Analysis of Variance (ANOVA), and Multi-Comparison Test
3.1.2. State-of-the-Art Comparison
3.2. Mobile and Web Application Development
4. Conclusions
Author Contributions
Funding
Institutional Review Board Statement
Informed Consent Statement
Data Availability Statement
Conflicts of Interest
References
- Alshukry, A.; Ali, H.; Ali, Y.; Al-Taweel, T.; Abu-Farha, M.; AbuBaker, J.; Devarajan, S.; Dashti, A.A.; Bandar, A.; Taleb, H.; et al. Clinical characteristics of coronavirus disease 2019 (COVID-19) patients in Kuwait. PLoS ONE 2020, 15, e0242768. [Google Scholar] [CrossRef] [PubMed]
- 210,214,749 Cases and 4,407,236 Deaths from the Coronavirus. Worldometer. 2021. Available online: https://www.worldometers.info/coronavirus (accessed on 1 May 2022).
- Raihan, M.; Bairagi, A.K.; Rahman, S. A Machine Learning Based Study to Predict Depression with Monitoring Actigraph Watch Data. In Proceedings of the 2021 12th International Conference on Computing Communication and Networking Technologies (ICCCNT), Kharagpur, India, 6–8 July 2021; IEEE: Piscataway, NJ, USA, 2021; pp. 1–5. [Google Scholar]
- Raihan, M.; Islam, M.T.; Ghosh, P.; Hassan, M.M.; Angon, J.H.; Kabiraj, S. Human Behavior Analysis using Association Rule Mining Techniques. In Proceedings of the 2020 11th International Conference on Computing, Communication and Networking Technologies (ICCCNT), Kharagpur, India, 1–3 July 2020; IEEE: Piscataway, NJ, USA, 2020; pp. 1–5. [Google Scholar]
- Hasan, M.K.; Alam, M.A.; Dahal, L.; Elahi, M.T.E.; Roy, S.; Wahid, S.R.; Marti, R.; Khanal, B. Challenges of deep learning methods for COVID-19 detection using public datasets. Inform. Med. Unlocked 2020, 30, 100945. [Google Scholar] [CrossRef]
- Aljameel, S.S.; Khan, I.U.; Aslam, N.; Aljabri, M.; Alsulmi, E.S. Machine Learning-Based Model to Predict the Disease Severity and Outcome in COVID-19 Patients. Sci. Program. 2021, 2021, 5587188. [Google Scholar] [CrossRef]
- Arpaci, I.; Huang, S.; Al-Emran, M.; Al-Kabi, M.N.; Peng, M. Predicting the COVID-19 infection with fourteen clinical features using machine learning classification algorithms. Multimed. Tools Appl. 2021, 80, 11943–11957. [Google Scholar] [CrossRef] [PubMed]
- Debjit, K.; Islam, M.S.; Rahman, M.A.; Pinki, F.T.; Nath, R.D.; Al-Ahmadi, S.; Hossain, M.S.; Mumenin, K.M.; Awal, M.A. An Improved Machine-Learning Approach for COVID-19 Prediction Using Harris Hawks Optimization and Feature Analysis Using SHAP. Diagnostics 2022, 12, 1023. [Google Scholar] [CrossRef] [PubMed]
- Wang, S.; Zha, Y.; Li, W.; Wu, Q.; Li, X.; Niu, M.; Wang, M.; Qiu, X.; Li, H.; Yu, H.; et al. A fully automatic deep learning system for COVID-19 diagnostic and prognostic analysis. Eur. Respir. J. 2020, 56, 2000775. [Google Scholar] [CrossRef] [PubMed]
- Kumar, R.; Arora, R.; Bansal, V.; Sahayasheela, V.J.; Buckchash, H.; Imran, J.; Narayanan, N.; Pandian, G.N.; Raman, B. Accurate prediction of COVID-19 using chest X-Ray images through deep feature learning model with SMOTE and machine learning classifiers. MedRxiv 2020. [Google Scholar] [CrossRef]
- Brinati, D.; Campagner, A.; Ferrari, D.; Locatelli, M.; Banfi, G.; Cabitza, F. Detection of COVID-19 infection from routine blood exams with machine learning: A feasibility study. J. Med. Syst. 2020, 44, 1–12. [Google Scholar] [CrossRef]
- Cabitza, F.; Campagner, A.; Ferrari, D.; Di Resta, C.; Ceriotti, D.; Sabetta, E.; Colombini, A.; De Vecchi, E.; Banfi, G.; Locatelli, M.; et al. Development, evaluation, and validation of machine learning models for COVID-19 detection based on routine blood tests. Clin. Chem. Lab. Med. (CCLM) 2021, 59, 421–431. [Google Scholar] [CrossRef]
- Elaziz, M.A.; Hosny, K.M.; Salah, A.; Darwish, M.M.; Lu, S.; Sahlol, A.T. New machine learning method for image-based diagnosis of COVID-19. PLoS ONE 2020, 15, e0235187. [Google Scholar] [CrossRef]
- Dhiman, H.S.; Deb, D.; Guerrero, J.M. Hybrid machine intelligent SVR variants for wind forecasting and ramp events. Renew. Sustain. Energy Rev. 2019, 108, 369–379. [Google Scholar] [CrossRef]
- Dhiman, H.S.; Deb, D.; Carroll, J.; Muresan, V.; Unguresan, M.L. Wind turbine gearbox condition monitoring based on class of support vector regression models and residual analysis. Sensors 2020, 20, 6742. [Google Scholar] [CrossRef] [PubMed]
- Dhiman, H.S.; Deb, D.; Muyeen, S.; Kamwa, I. Wind turbine gearbox anomaly detection based on adaptive threshold and twin support vector machines. IEEE Trans. Energy Convers. 2021, 36, 3462–3469. [Google Scholar] [CrossRef]
- D’Silva, K.M.; Serling-Boyd, N.; Wallwork, R.; Hsu, T.; Fu, X.; Gravallese, E.M.; Choi, H.K.; Sparks, J.A.; Wallace, Z.S. Clinical characteristics and outcomes of patients with coronavirus disease 2019 (COVID-19) and rheumatic disease: A comparative cohort study from a US ‘hot spot’. Ann. Rheum. Dis. 2020, 79, 1156–1162. [Google Scholar] [CrossRef]
- Hasan, M.K.; Alam, M.A.; Das, D.; Hossain, E.; Hasan, M. Diabetes prediction using ensembling of different machine learning classifiers. IEEE Access 2020, 8, 76516–76531. [Google Scholar] [CrossRef]
- Van Buuren, S.; Groothuis-Oudshoorn, K. mice: Multivariate imputation by chained equations in R. J. Stat. Softw. 2011, 45, 1–67. [Google Scholar] [CrossRef] [Green Version]
- Islam, M.S.; Awal, M.A.; Laboni, J.N.; Pinki, F.T.; Karmokar, S.; Mumenin, K.M.; Al-Ahmadi, S.; Rahman, M.A.; Hossain, M.S.; Mirjalili, S. HGSORF: Henry Gas Solubility Optimization-based Random Forest for C-Section prediction and XAI-based cause analysis. Comput. Biol. Med. 2022, 147, 105671. [Google Scholar] [CrossRef]
- Awal, M.A.; Hossain, M.S.; Debjit, K.; Ahmed, N.; Nath, R.D.; Habib, G.M.M.; Khan, M.S.; Islam, M.A.; Mahmud, M.A.P. An Early Detection of Asthma Using BOMLA Detector. IEEE Access 2021, 9, 58403–58420. [Google Scholar] [CrossRef]
- Hasan, M.K.; Jawad, M.T.; Dutta, A.; Awal, M.A.; Islam, M.A.; Masud, M.; Al-Amri, J.F. Associating Measles Vaccine Uptake Classification and its Underlying Factors Using an Ensemble of Machine Learning Models. IEEE Access 2021, 9, 119613–119628. [Google Scholar] [CrossRef]
- Awal, M.A.; Masud, M.; Hossain, M.S.; Bulbul, A.A.M.; Mahmud, S.H.; Bairagi, A.K. A novel bayesian optimization-based machine learning framework for COVID-19 detection from inpatient facility data. IEEE Access 2021, 9, 10263–10281. [Google Scholar] [CrossRef]
- Yan, L.; Zhang, H.T.; Goncalves, J.; Xiao, Y.; Wang, M.; Guo, Y.; Sun, C.; Tang, X.; Jing, L.; Zhang, M.; et al. An interpretable mortality prediction model for COVID-19 patients. Nat. Mach. Intell. 2020, 2, 283–288. [Google Scholar] [CrossRef]
- Chen, T.; Guestrin, C. Xgboost: A scalable tree boosting system. In Proceedings of the 22nd ACM Sigkdd International Conference on Knowledge Discovery and Data Mining, San Francisco, CA, USA, 13–17 August 2016; pp. 785–794. [Google Scholar]
- Zhang, D.; Qian, L.; Mao, B.; Huang, C.; Huang, B.; Si, Y. A data-driven design for fault detection of wind turbines using random forests and XGboost. IEEE Access 2018, 6, 21020–21031. [Google Scholar] [CrossRef]
- Khemchandani, R.; Chandra, S. Twin support vector machines for pattern classification. IEEE Trans. Pattern Anal. Mach. Intell. 2007, 29, 905–910. [Google Scholar]
- Tomar, D.; Agarwal, S. A comparison on multi-class classification methods based on least squares twin support vector machine. Knowl.-Based Syst. 2015, 81, 131–147. [Google Scholar] [CrossRef]
- DeVito, Z.; Ansel, J.; Constable, W.; Suo, M.; Zhang, A.; Hazelwood, K. Using Python for Model Inference in Deep Learning. arXiv 2021, arXiv:2104.00254. [Google Scholar]
- Kabiraj, S.; Raihan, M.; Alvi, N.; Afrin, M.; Akter, L.; Sohagi, S.A.; Podder, E. Breast cancer risk prediction using XGBoost and random forest algorithm. In Proceedings of the 2020 11th International Conference on Computing, Communication and Networking Technologies (ICCCNT), Kharagpur, India, 1–3 July 2020; IEEE: Piscataway, NJ, USA, 2020; pp. 1–4. [Google Scholar]
- Huang, H.; Wei, X.; Zhou, Y. Twin support vector machines: A survey. Neurocomputing 2018, 300, 34–43. [Google Scholar] [CrossRef]
- Jordan, E.; Shin, D.E.; Leekha, S.; Azarm, S. Optimization in the Context of COVID-19 Prediction and Control: A Literature Review. IEEE Access 2021, 9, 130072–130093. [Google Scholar] [CrossRef]
- Ramazi, P.; Haratian, A.; Meghdadi, M.; Oriyad, A.M.; Lewis, M.A.; Maleki, Z.; Vega, R.; Wang, H.; Wishart, D.S.; Greiner, R. Accurate long-range forecasting of COVID-19 mortality in the USA. Sci. Rep. 2021, 11, 1–11. [Google Scholar] [CrossRef]


| Hyperparameters | Short Description |
|---|---|
| XGB classifier | |
| Estimator numbers | Multiple boosting rounds worth of gradients were used to boost these trees |
| Learning rate | How much the contribution of each tree will shrink |
| Number of jobs | The number of XGB classifier parallel threads used |
| Maximum depth | The tree’s node count (the best value depends on the interaction of the input variables) |
| Gamma values | The bare minimum loss reduction necessary to allow for further leaf node partitioning |
| Minimum child’s weight | The bare minimum in terms of child instance weight |
| Column sample numbers | The ratio of columns’ sub-samples during tree construction |
| SVM classifier | |
| Cost (C) | A regularization parameter that controls the trade-off between classification accuracy on the training instances and margin maximization |
| Gamma () | A kernel parameter of the radial basis function that defines the reciprocal of standard deviation. It describes how the inverse of the radius influences support vector data points |
| RF classifier | |
| Estimator numbers | Represents the number of decision trees in the forest |
| Maximum depth | Denotes the decision tree’s maximum depth |
| Minimum samples’ split | Minimum instances needed to split a tree’s internal nodes are indicated by this value |
| Minimum samples’ leaf | Minimum number of instances required to be at leaf node is denoted by this value |
| Twin SVM classifier | |
| and | Represent the penalty parameters that control the classification accuracy and margin maximization |
| and | Denote the column vectors of ones of appropriate dimensions depending on the dataset |
| and | Symbolize the parameters that ascertain the tradeoff between the support vector and the interval error |
| Recursive Feature Elimination (RFE) | K Best | ||
|---|---|---|---|
| XGB | RF | SVM | |
| high_risk_exposure_occupation | age | diabetes | age |
| htn | high_risk_exposure_occupation | copd | temperature |
| smoker | high_risk_interactions | temperature | pulse |
| cough | temperature | ctab | rr |
| fever | sys | wheezes | rhonchi |
| sob | rr | fever | wheezes |
| fatigue | sats | diarrhea | cough |
| headache | cough | fatigue | fever |
| loss_of_smell | fever | loss_of_smell | loss_of_smell |
| loss_of_taste | loss_of_smell | loss_of_taste | loss_of_taste |
| Different Performance Metrics (%) | Feature Selection Methods | Without Feature Selection Methods | |||||||
|---|---|---|---|---|---|---|---|---|---|
| K Best | RFE | ||||||||
| RF | XGB | SVM | RF | XGB | SVM | RF | XGB | SVM | |
| Accuracy (ACC) | 94.38 | 97.18 | 63.91 | 95.82 | 66.53 | 62.12 | 97.88 | 97.18 | 62.80 |
| F1_Score | 94.43 | 97.23 | 66.77 | 95.88 | 71.88 | 71.31 | 97.91 | 97.24 | 65.99 |
| False Positive Rate (FPR) | 5.43 | 3.75 | 44.05 | 4.37 | 51.94 | 69.56 | 2.30 | 3.84 | 45.95 |
| Kappa Statistic (Kappa) | 88.76 | 94.35 | 27.68 | 91.65 | 32.78 | 23.69 | 95.76 | 94.35 | 25.45 |
| Matthews Correlation Coefficient (MCC) | 88.77 | 94.37 | 28.00 | 91.65 | 35.12 | 30.26 | 95.76 | 94.37 | 25.80 |
| Precision (PPV) | 94.67 | 96.40 | 62.48 | 95.73 | 62.50 | 57.80 | 97.76 | 96.32 | 61.38 |
| Sensitivity (SEN) | 94.20 | 98.08 | 71.68 | 96.02 | 84.59 | 93.08 | 98.06 | 98.17 | 71.35 |
| Specificity (SPE) | 94.57 | 96.25 | 55.95 | 95.62 | 48.05 | 30.43 | 97.70 | 96.16 | 54.05 |
| SVM and It Variants | Performance Metrics (%) | ||||||||
|---|---|---|---|---|---|---|---|---|---|
| ACC | Error | F1_Score | FPR | Kappa | MCC | PPV | SEN | SPE | |
| SVM | 63.91 | 36.09 | 66.77 | 44.05 | 27.68 | 28.00 | 62.48 | 71.68 | 55.95 |
| Twin SVM with linear kernel | 66.28 | 33.72 | 71.31 | 50.67 | 32.30 | 34.20 | 62.60 | 82.84 | 49.33 |
| Twin SVM with RBF kernel | 77.78 | 22.22 | 77.03 | 17.96 | 55.61 | 55.83 | 80.76 | 73.63 | 82.04 |
| Different Folds | RF | XGB | SVM |
|---|---|---|---|
| Fold 1 | 86.52 | 86.24 | 50.83 |
| Fold 2 | 91.38 | 97.68 | 66.50 |
| Fold 3 | 92.26 | 97.68 | 72.75 |
| Fold 4 | 87.21 | 95.09 | 61.68 |
| Fold 5 | 88.42 | 97.50 | 60.89 |
| Fold 6 | 93.05 | 98.66 | 68.86 |
| Fold 7 | 92.68 | 98.01 | 76.78 |
| Fold 8 | 92.59 | 98.75 | 58.39 |
| Fold 9 | 90.36 | 98.79 | 58.88 |
| Fold 10 | 93.32 | 98.42 | 60.59 |
| Mean ± Std |
| Classifiers | Performance Metrics (%) | ||||||||
|---|---|---|---|---|---|---|---|---|---|
| ACC | Error | F1_Score | FPR | Kappa | MCC | PPV | SEN | SPE | |
| RF | 97.89 | 2.11 | 97.91 | 1.96 | 95.79 | 95.79 | 98.08 | 97.75 | 98.04 |
| XGB | 97.18 | 2.82 | 97.24 | 3.84 | 94.35 | 94.37 | 96.32 | 98.17 | 96.16 |
| SVM | 62.80 | 37.20 | 65.99 | 45.95 | 25.45 | 25.80 | 61.38 | 71.35 | 54.05 |
| Different Studies (year) | Feature Numbers | Sample Numbers | Algorithms | Accuracy (%) |
|---|---|---|---|---|
| Awal et al. [23] (2021) | 33 | 21,578 | RF | 98.54 |
| XGB | 98.63 | |||
| SVM | 96.75 | |||
| Wang et al. [9] (2020) | 15 | 279 | RF | 80.00 |
| SVM | 80.00 | |||
| Kumar et al. [10] (2020) | 69 | 1925 | RF | 93.00 |
| SVM | 91.00 | |||
| Arpaci et al. [7] (2020) | 3 | 5840 | RF | 97.30 |
| XGB | 97.70 | |||
| Debjit et al. [8] (2022) | 20 | 48,676 | XGB | 92.54 |
| RF | 91.53 | |||
| SVM | 84.54 | |||
| Proposed system (2022) | 10 | 21,578 | XGB | 97.91 |
| RF | 97.81 | |||
| SVM | 73.37 |
Publisher’s Note: MDPI stays neutral with regard to jurisdictional claims in published maps and institutional affiliations. |
© 2022 by the authors. Licensee MDPI, Basel, Switzerland. This article is an open access article distributed under the terms and conditions of the Creative Commons Attribution (CC BY) license (https://creativecommons.org/licenses/by/4.0/).
Share and Cite
Raihan, M.; Hassan, M.M.; Hasan, T.; Bulbul, A.A.-M.; Hasan, M.K.; Hossain, M.S.; Roy, D.S.; Awal, M.A. Development of a Smartphone-Based Expert System for COVID-19 Risk Prediction at Early Stage. Bioengineering 2022, 9, 281. https://doi.org/10.3390/bioengineering9070281
Raihan M, Hassan MM, Hasan T, Bulbul AA-M, Hasan MK, Hossain MS, Roy DS, Awal MA. Development of a Smartphone-Based Expert System for COVID-19 Risk Prediction at Early Stage. Bioengineering. 2022; 9(7):281. https://doi.org/10.3390/bioengineering9070281
Chicago/Turabian StyleRaihan, M., Md. Mehedi Hassan, Towhid Hasan, Abdullah Al-Mamun Bulbul, Md. Kamrul Hasan, Md. Shahadat Hossain, Dipa Shuvo Roy, and Md. Abdul Awal. 2022. "Development of a Smartphone-Based Expert System for COVID-19 Risk Prediction at Early Stage" Bioengineering 9, no. 7: 281. https://doi.org/10.3390/bioengineering9070281