
Improved Time Resolved KPI and Strain Characterization of Multiple Hosts in Shake Flasks Using Advanced Online Analytics and Data Science
 ,
,  , and
, and
Abstract
:
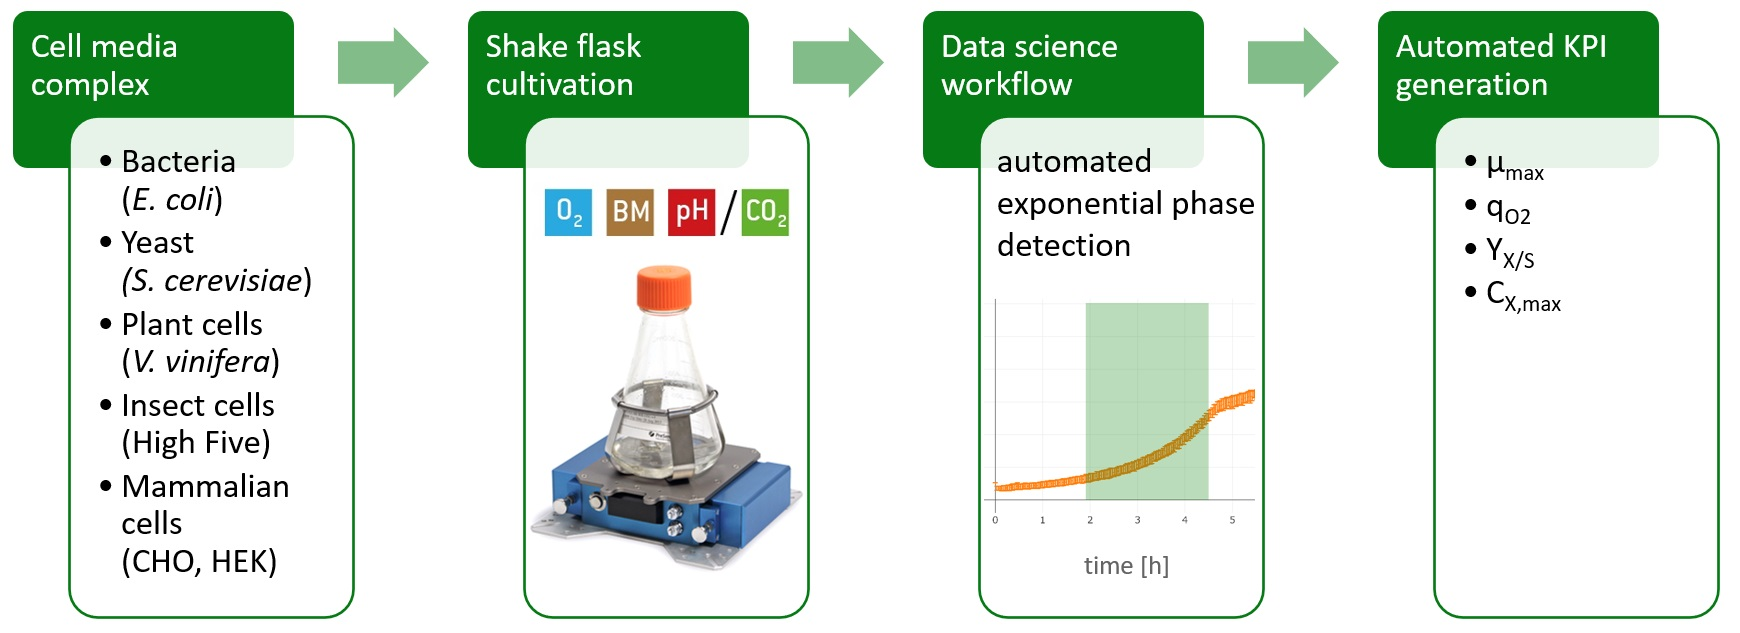
1. Introduction
- Use a recipe database as a basis for knowledge management;
- Automate and standardize detection of the exponential growth phase within shake flask experiments with enhanced data science;
- Automate determination of KPIs based on the detected exponential growth phase and data from the recipe database;
- Store KPIs in the database to simplify and enable comparison with other recipes.
2. Results and Discussion
2.1. Workflow
2.1.1. Initial Phase Fitting and Noise Reduction
2.1.2. Optimization of Phase Start
2.1.3. Optimization of Phase End
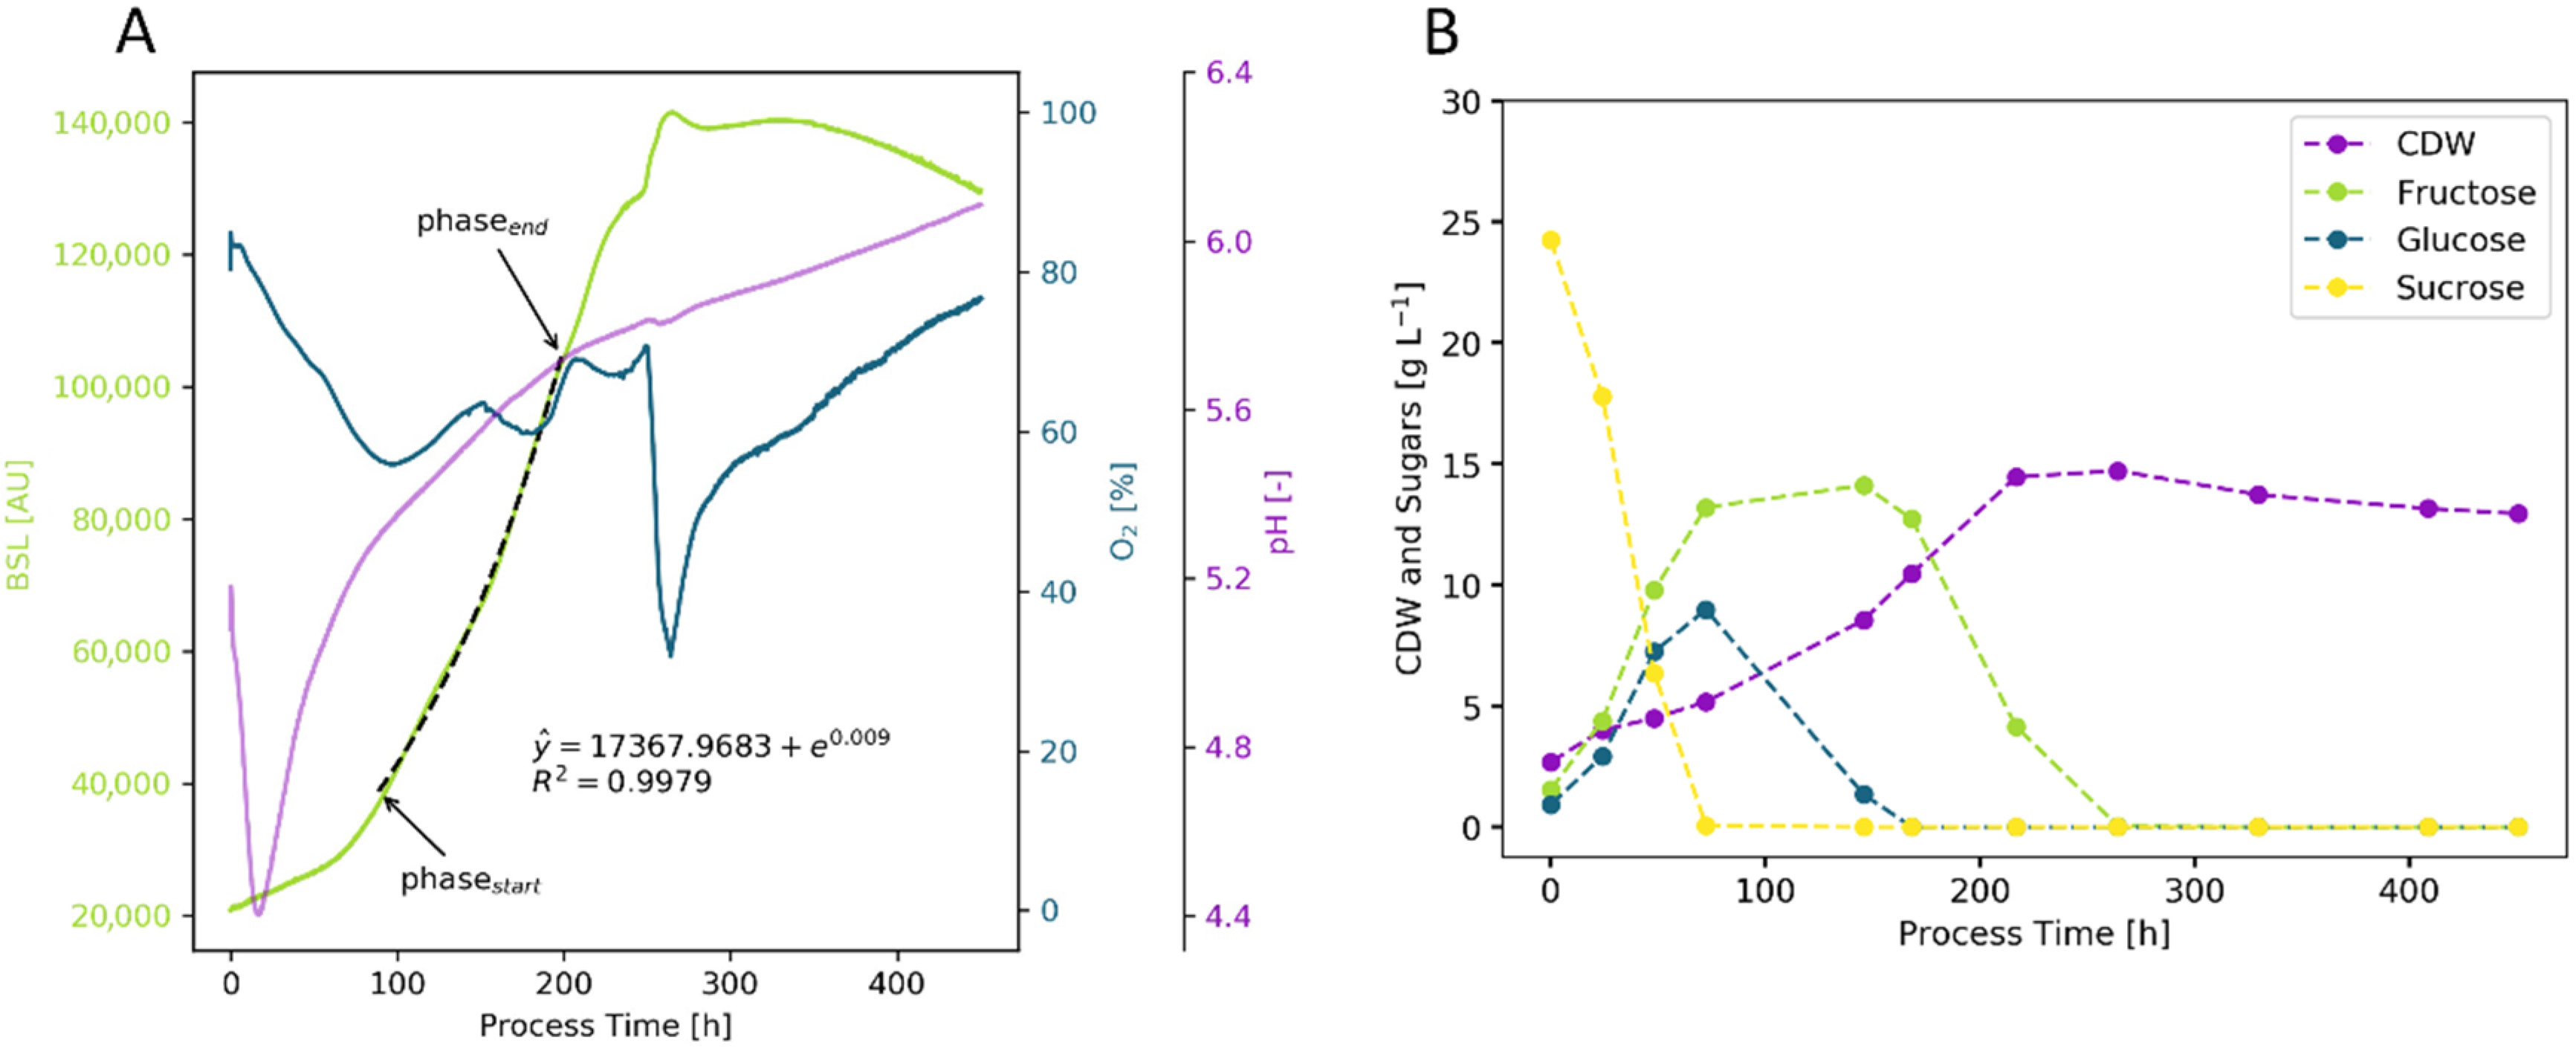
2.2. Cultivation Results
- maximum specific growth rate µmax;
- cell-specific oxygen consumption rate qO2;
- biomass and product yield YX/S and YP/S;
- maximum achieved biomass concentration CX,max.
2.2.1. Bacteria—E. coli
2.2.2. Yeast—S. cerevisiae
2.2.3. Plant Cells—Vitis vinifera
2.2.4. Animal Cells
2.3. Evaluation of Measurement Techniques
2.4. Evaluation of KPIs
3. Conclusions and Outlook
4. Materials and Methods
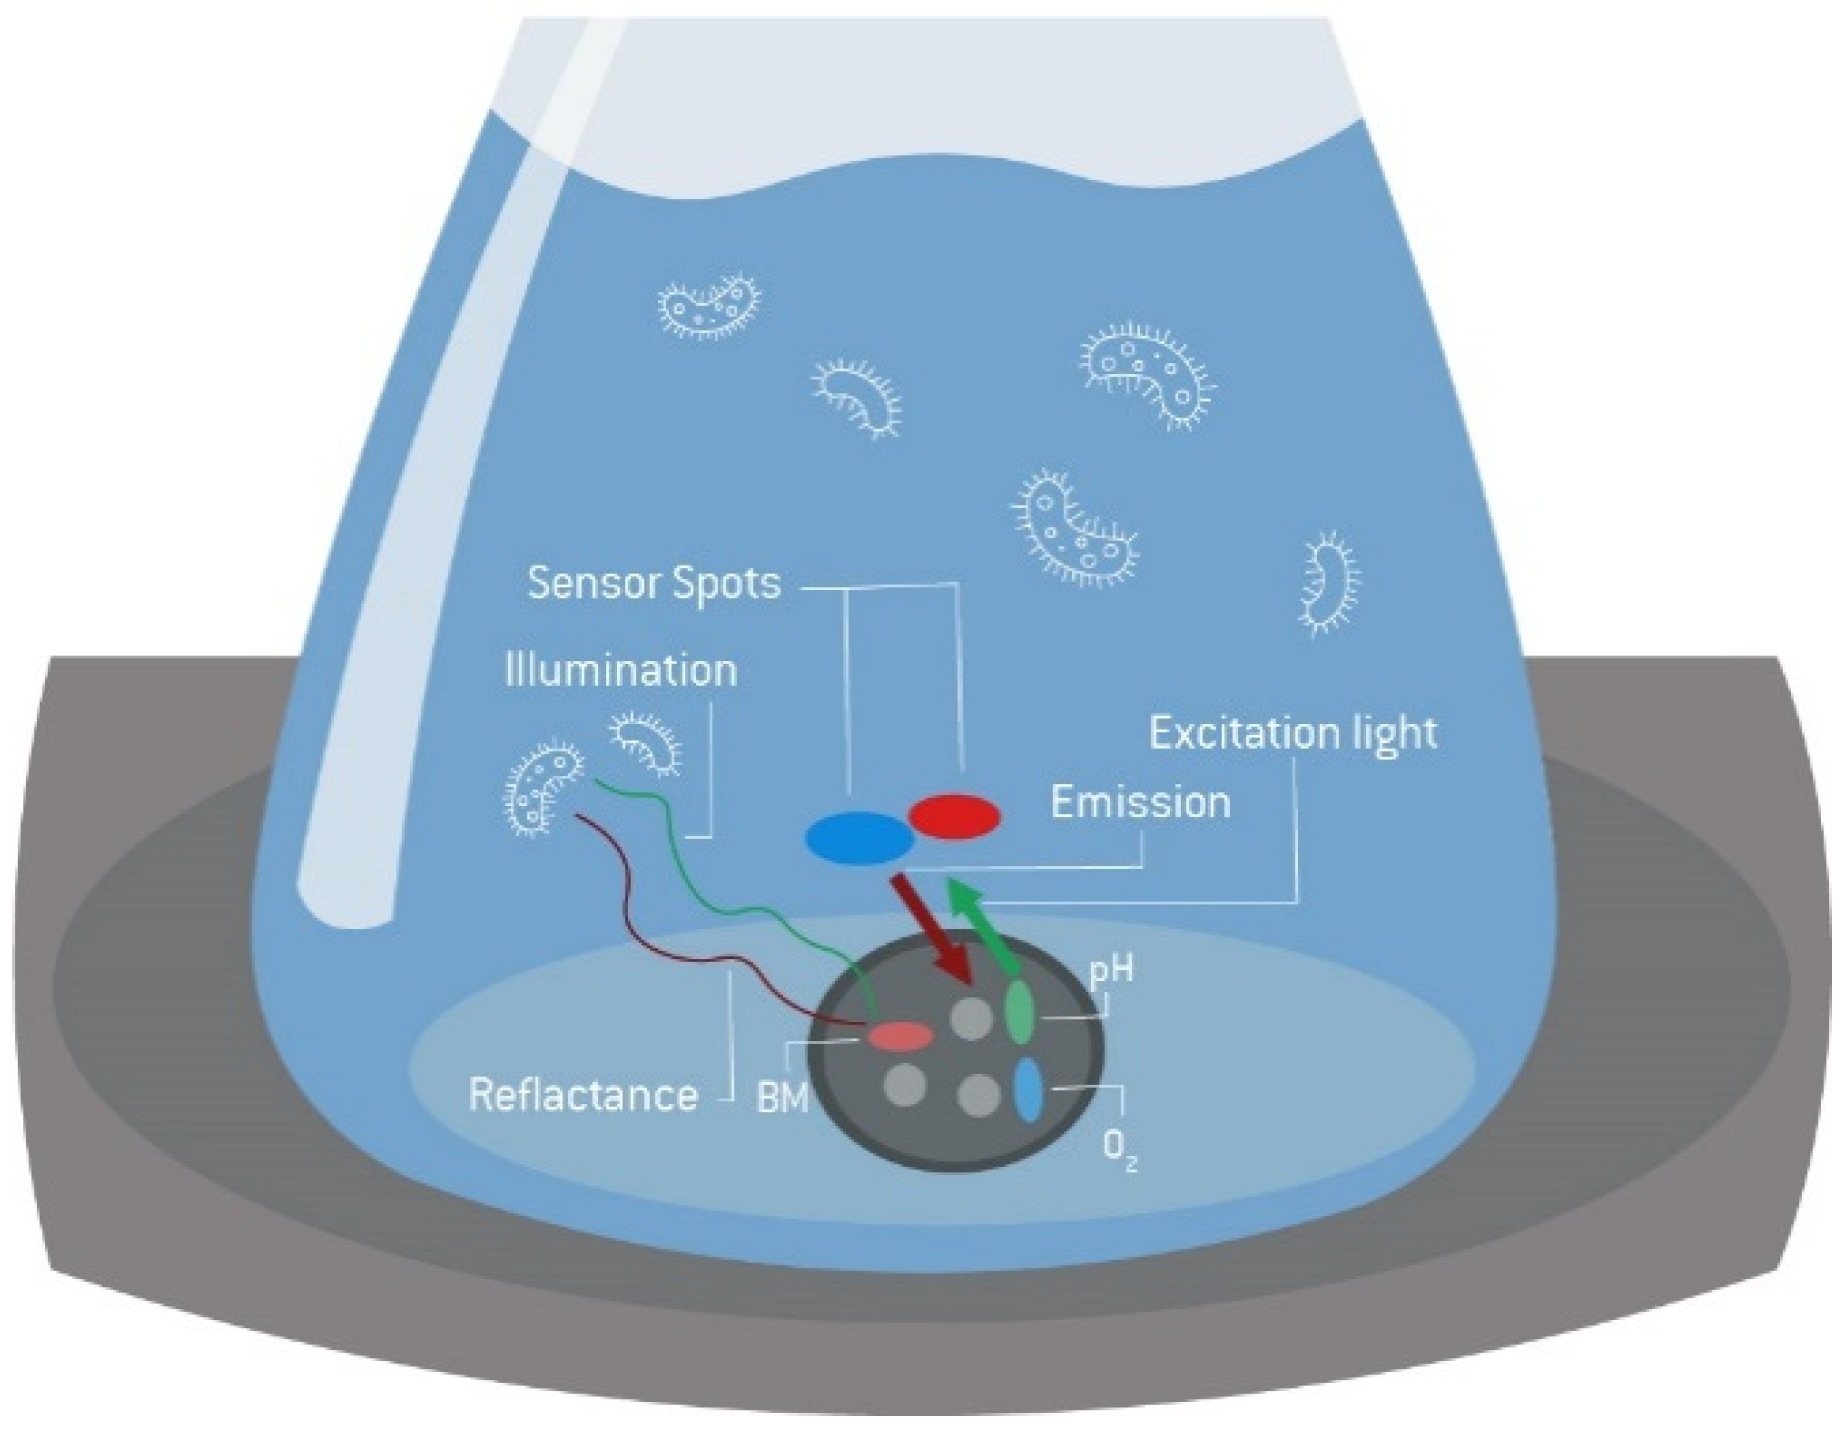
4.1. General Equipment and Online Measurement Systems
4.2. Cultivation Details
4.2.1. Bacteria Cultivation—E. coli
- Lysogeny broth (LB) medium with 5 g L−1 yeast extract (cat. Y1625, Sigma-Aldrich, St. Louis, MI, USA), 10 g L−1 tryptone (cat. 95039, Sigma-Aldrich) and 5 g L−1 sodium chloride (cat. S9888, Sigma-Aldrich) [82];
- Terrific broth (TB) medium with 24 g L−1 yeast extract (cat. Y1625, Sigma-Aldrich), 20 g L−1 tryptone (cat. 95039, Sigma-Aldrich), 4 mL L−1 glycerin (cat. 49770, Sigma-Aldrich) and a phosphate buffer consisting of 0.17 mol L−1 KH2PO4 (cat. P5655, Sigma-Aldrich) and 0.72 mol L−1 K2HPO4 (cat. P3786, Sigma-Aldrich) [83];
- Modified Biener medium consisting of glucose (10 g L−1), a mineral salt solution, a trace element solution and MgSO4 solution [60]. Details can be found in Appendix A.
4.2.2. Yeast Cultivation—S. cerevisiae
4.2.3. Plant Suspension Cultivation—Vitis vinifera
4.2.4. Animal Cell Cultivation—CHO, High Five, HEK293
4.3. Software
Author Contributions
Funding
Institutional Review Board Statement
Informed Consent Statement
Data Availability Statement
Acknowledgments
Conflicts of Interest
Appendix A
Recipe for 1 L E.coli Medium
- 40 mL of glucose stock solution with 500 g L−1 glucose;
- 480 mL of mineral stock solution, consisting of:
- o
- 2.1 g L−1 (NH4)2 H-citrate;
- o
- 4.2 g L−1 Na2SO4;
- o
- 8.4 g L−1 (NH4)2SO4;
- o
- 1.06 g L−1 NH4Cl;
- o
- 31.6 g L−1 K2HPO4;
- o
- 7.4 g L−1 NaH2PO4·H2O;
- 4.5 mL of trace element solution, consisting of:
- o
- 0.18 g L−1 CoCl2·6 H2O;
- o
- 0.50 g L−1 CaCl2·2 H2O;
- o
- 0.18 g L−1 ZnSO4·7 H2O;
- o
- 0.10 g L−1 MnSO4·H2O;
- o
- 10.05 g L−1 Na2-EDTA·2 H2O;
- o
- 8.35 g L−1 FeCl3·6 H2O;
- o
- 0.16 g L−1 CuSO4·5 H2O;
- 2.2 mL of 1 mol L−1 MgSO4·7 H2O stock solution;
- 473.3 mL of sterile deionized H2O.
Appendix B
Appendix B.1. Additional Cultivation Results
Appendix B.1.1. Bacteria—E. coli
Appendix B.1.2. Animal Cell Cultures
References
- Arrowsmith, J.; Miller, P. Phase II and Phase III Attrition Rates 2011–2012. Nat. Rev. Drug Discov. 2013, 12, 569. [Google Scholar] [CrossRef] [PubMed]
- Paul, S.M.; Mytelka, D.S.; Dunwiddie, C.T.; Persinger, C.C.; Munos, B.H.; Lindborg, S.R.; Schacht, A.L. How to Improve R & D Productivity: The Pharmaceutical Industry’s Grand Challenge. Nat. Rev. Drug Discov. 2010, 9, 203–214. [Google Scholar] [CrossRef] [PubMed]
- US Food and Drug Administration. Q8(R2)-Pharmaceutical-Development; Food and Drug Administration: Washington, DC, USA, 2009. [Google Scholar]
- ICH Guideline Q9 on Quality Risk Management; European Medicines Agency: London, UK, 2015.
- ICH Guideline Q10 on Pharmaceutical Quality System-Step 5; European Medicines Agency: London, UK, 2015.
- US Food and Drug Administration. Guidance for Industry PAT—A Framework for Innovative Pharmaceutical Manufacturing and Quality Assurance; Food and Drug Administration: Washington, DC, USA, 2004. [Google Scholar]
- Katz, P.; Campbell, C. FDA 2011 Process Validation Guidance: Process Validation Revisited. J. GXP Compliance 2012, 16, 18. [Google Scholar]
- Borchert, D.; Suarez-Zuluaga, D.A.; Thomassen, Y.E.; Herwig, C. Risk Assessment and Integrated Process Modeling–an Improved QbD Approach for the Development of the Bioprocess Control Strategy. AIMS Bioeng. 2020, 7, 254–271. [Google Scholar] [CrossRef]
- Politis, S.N.; Colombo, P.; Colombo, G.; Rekkas, D.M. Design of Experiments (DoE) in Pharmaceutical Development. Drug Dev. Ind. Pharm. 2017, 43, 889–901. [Google Scholar] [CrossRef]
- Burdick, R.K.; LeBlond, D.J.; Pfahler, L.B.; Quiroz, J.; Sidor, L.; Vukovinsky, K.; Zhang, L. Process Design: Stage 1 of the FDA Process Validation Guidance. In Statistical Applications for Chemistry, Manufacturing and Controls (CMC) in the Pharmaceutical Industry; Springer International Publishing: Cham, Switzerland, 2017; pp. 115–154. ISBN 978-3-319-50184-0. [Google Scholar]
- Abu-Absi, S.F.; Yang, L.; Thompson, P.; Jiang, C.; Kandula, S.; Schilling, B.; Shukla, A.A. Defining Process Design Space for Monoclonal Antibody Cell Culture. Biotechnol. Bioeng. 2010, 106, 894–905. [Google Scholar] [CrossRef]
- Hakemeyer, C.; McKnight, N.; John, R.S.; Meier, S.; Trexler-Schmidt, M.; Kelley, B.; Zettl, F.; Puskeiler, R.; Kleinjans, A.; Lim, F.; et al. Process Characterization and Design Space Definition. Biologicals 2016, 44, 306–318. [Google Scholar] [CrossRef]
- Zurdo, J.; Arnell, A.; Obrezanova, O.; Smith, N.; Gómez de la Cuesta, R.; Gallagher, T.R.A.; Michael, R.; Stallwood, Y.; Ekblad, C.; Abrahmsén, L.; et al. Early Implementation of QbD in Biopharmaceutical Development: A Practical Example. BioMed Res. Int. 2015, 2015, 605427. [Google Scholar] [CrossRef]
- Zurdo, J. Developability Assessment as an Early De-Risking Tool for Biopharmaceutical Development. Pharm. Bioprocess. 2013, 1, 29–50. [Google Scholar] [CrossRef]
- Herwig, C.; Garcia-Aponte, O.F.; Golabgir, A.; Rathore, A.S. Knowledge Management in the QbD Paradigm: Manufacturing of Biotech Therapeutics. Trends Biotechnol. 2015, 33, 381–387. [Google Scholar] [CrossRef]
- Kumar, D.; Batra, J.; Komives, C.; Rathore, A. QbD Based Media Development for the Production of Fab Fragments in E. Coli. Bioengineering 2019, 6, 29. [Google Scholar] [CrossRef] [PubMed]
- Rathore, A.S.; Chopda, V.R.; Gomes, J. Knowledge Management in a Waste Based Biorefinery in the QbD Paradigm. Bioresour. Technol. 2016, 215, 63–75. [Google Scholar] [CrossRef] [PubMed]
- Goey, C.H.; Bell, D.; Kontoravdi, C. CHO Cell Cultures in Shake Flasks and Bioreactors Present Different Host Cell Protein Profiles in the Supernatant. Biochem. Eng. J. 2019, 144, 185–192. [Google Scholar] [CrossRef]
- Winkler, K.; Socher, M.L. Shake Flask Technology. In Encyclopedia of Industrial Biotechnology; Flickinger, M.C., Ed.; John Wiley & Sons, Inc.: New Jersey, NJ, USA, 2014; ISBN 978-0-470-05458-1. [Google Scholar]
- Klöckner, W.; Büchs, J. Advances in Shaking Technologies. Trends Biotechnol. 2012, 30, 307–314. [Google Scholar] [CrossRef] [PubMed]
- Maschke, R.W.; Seidel, S.; Bley, T.; Eibl, R.; Eibl, D. Determination of Culture Design Spaces in Shaken Disposable Cultivation Systems for CHO Suspension Cell Cultures. Biochem. Eng. J. 2022, 177, 108224. [Google Scholar] [CrossRef]
- Schirmer, C.; Maschke, R.W.; Pörtner, R.; Eibl, D. An Overview of Drive Systems and Sealing Types in Stirred Bioreactors Used in Biotechnological Processes. Appl. Microbiol. Biotechnol. 2021, 105, 2225–2242. [Google Scholar] [CrossRef] [PubMed]
- Xu, P.; Clark, C.; Ryder, T.; Sparks, C.; Zhou, J.; Wang, M.; Russell, R.; Scott, C. Characterization of TAP Ambr 250 Disposable Bioreactors, as a Reliable Scale-down Model for Biologics Process Development: Characterization and Application of Ambr 250 in Clone Selection and Process Development. Biotechnol. Prog. 2017, 33, 478–489. [Google Scholar] [CrossRef]
- Frey, L.J.; Krull, R. Microbioreactors for Process Development and Cell-Based Screening Studies. In Advances in Biochemical Engineering/Biotechnology; Springer: Berlin/Heidelberg, Germang, 2020. [Google Scholar]
- Birgen, C.; Degnes, K.F.; Markussen, S.; Wentzel, A.; Sletta, H. Butanol Production from Lignocellulosic Sugars by Clostridium Beijerinckii in Microbioreactors. Biotechnol. Biofuels 2021, 14, 34. [Google Scholar] [CrossRef]
- Zhu, Z.; Hu, Y.; Teixeira, P.G.; Pereira, R.; Chen, Y.; Siewers, V.; Nielsen, J. Multidimensional Engineering of Saccharomyces Cerevisiae for Efficient Synthesis of Medium-Chain Fatty Acids. Nat. Catal. 2020, 3, 64–74. [Google Scholar] [CrossRef]
- van Dijk, M.; Trollmann, I.; Saraiva, M.A.F.; Brandão, R.L.; Olsson, L.; Nygård, Y. Small Scale Screening of Yeast Strains Enables High-Throughput Evaluation of Performance in Lignocellulose Hydrolysates. Bioresour. Technol. Rep. 2020, 11, 100532. [Google Scholar] [CrossRef]
- Brunner, M.; Doppler, P.; Klein, T.; Herwig, C.; Fricke, J. Elevated PCO2 Affects the Lactate Metabolic Shift in CHO Cell Culture Processes. Eng. Life Sci. 2018, 18, 204–214. [Google Scholar] [CrossRef] [PubMed]
- Basan, M.; Hui, S.; Okano, H.; Zhang, Z.; Shen, Y.; Williamson, J.R.; Hwa, T. Overflow Metabolism in Escherichia Coli Results from Efficient Proteome Allocation. Nature 2015, 528, 99–104. [Google Scholar] [CrossRef] [PubMed]
- Kleman, G.L.; Strohl, W.R. Acetate Metabolism by Escherichia coli in High-Cell-Density Fermentation. Appl. Environ. Microbiol. 1994, 60, 3952. [Google Scholar] [CrossRef] [PubMed]
- Wolfe, A.J. The Acetate Switch. Microbiol. Mol. Biol. Rev. 2005, 69, 12. [Google Scholar] [CrossRef] [PubMed]
- De Mey, M.; De Maeseneire, S.; Soetaert, W.; Vandamme, E. Minimizing Acetate Formation in E. Coli Fermentations. J. Ind. Microbiol. Biotechnol. 2007, 34, 689–700. [Google Scholar] [CrossRef]
- Anderlei, T.; Zang, W.; Papaspyrou, M.; Büchs, J. Online Respiration Activity Measurement (OTR, CTR, RQ) in Shake Flasks. Biochem. Eng. J. 2004, 17, 187–194. [Google Scholar] [CrossRef]
- Hansen, S.; Hariskos, I.; Luchterhand, B.; Büchs, J. Development of a Modified Respiration Activity Monitoring System for Accurate and Highly Resolved Measurement of Respiration Activity in Shake Flask Fermentations. J. Biol. Eng. 2012, 6, 11. [Google Scholar] [CrossRef]
- Munch, G.; Schulte, A.; Mann, M.; Dinger, R.; Regestein, L.; Rehmann, L.; Büchs, J. Online Measurement of CO2 and Total Gas Production in Parallel Anaerobic Shake Flask Cultivations. Biochem. Eng. J. 2020, 153, 107418. [Google Scholar] [CrossRef]
- Wewetzer, S.J.; Kunze, M.; Ladner, T.; Luchterhand, B.; Roth, S.; Rahmen, N.; Kloß, R.; Costa e Silva, A.; Regestein, L.; Büchs, J. Parallel Use of Shake Flask and Microtiter Plate Online Measuring Devices (RAMOS and BioLector) Reduces the Number of Experiments in Laboratory-Scale Stirred Tank Bioreactors. J. Biol. Eng. 2015, 9, 9. [Google Scholar] [CrossRef]
- Meier, K.; Klöckner, W.; Bonhage, B.; Antonov, E.; Regestein, L.; Büchs, J. Correlation for the Maximum Oxygen Transfer Capacity in Shake Flasks for a Wide Range of Operating Conditions and for Different Culture Media. Biochem. Eng. J. 2016, 109, 228–235. [Google Scholar] [CrossRef]
- Lapierre, F.M.; Schmid, J.; Ederer, B.; Ihling, N.; Büchs, J.; Huber, R. Revealing Nutritional Requirements of MICP-Relevant Sporosarcina Pasteurii DSM33 for Growth Improvement in Chemically Defined and Complex Media. Sci. Rep. 2020, 10, 22448. [Google Scholar] [CrossRef] [PubMed]
- Brillet, F.; Cregut, M.; Durand, M.J.; Sweetlove, C.; Chenèble, J.C.; L’Haridon, J.; Thouand, G. Biodegradability Assessment of Complex Chemical Mixtures Using a Carbon Balance Approach. Green Chem. 2018, 20, 1031–1041. [Google Scholar] [CrossRef]
- Bruder, S.; Reifenrath, M.; Thomik, T.; Boles, E.; Herzog, K. Parallelised Online Biomass Monitoring in Shake Flasks Enables Efficient Strain and Carbon Source Dependent Growth Characterisation of Saccharomyces Cerevisiae. Microb. Cell Factories 2016, 15, 127. [Google Scholar] [CrossRef] [PubMed]
- Sörensen, M.; Khakimov, B.; Nurjadi, D.; Boutin, S.; Yi, B.; Dalpke, A.H.; Eigenbrod, T. Comparative Evaluation of the Effect of Different Growth Media on in Vitro Sensitivity to Azithromycin in Multi-Drug Resistant Pseudomonas Aeruginosa Isolated from Cystic Fibrosis Patients. Antimicrob. Resist. Infect. Control. 2020, 9, 197. [Google Scholar] [CrossRef] [PubMed]
- Vasala, A.; Panula, J.; Bollók, M.; Illmann, L.; Hälsig, C.; Neubauer, P. A New Wireless System for Decentralised Measurement of Physiological Parameters from Shake Flasks. Microb. Cell Factories 2006, 5, 8. [Google Scholar] [CrossRef]
- Spichiger, S.; Spichiger-Keller, U.E. New Single-Use Sensors for Online Measurement of Glucose and Lactate: The Answer to the PAT Initiative. In Single-Use Technology in Biopharmaceutical Manufacture; Eibl, R., Eibl, D., Eds.; John Wiley & Sons, Inc.: Hoboken, NJ, USA, 2011; pp. 295–299. ISBN 978-0-470-90999-7. [Google Scholar]
- Ebert, F.V.; Reitz, C.; Cruz-Bournazou, M.N.; Neubauer, P. Characterization of a Noninvasive On-Line Turbidity Sensor in Shake Flasks for Biomass Measurements. Biochem. Eng. J. 2018, 132, 20–28. [Google Scholar] [CrossRef]
- Schmidt-Hager, J.; Ude, C.; Findeis, M.; John, G.T.; Scheper, T.; Beutel, S. Noninvasive Online Biomass Detector System for Cultivation in Shake Flasks. Eng. Life Sci. 2014, 14, 467–476. [Google Scholar] [CrossRef]
- Pretzner, B.; Maschke, R.W.; Haiderer, C.; John, G.T.; Herwig, C.; Sykacek, P. Predictive Monitoring of Shake Flask Cultures with Online Estimated Growth Models. Bioengineering 2021, 8, 177. [Google Scholar] [CrossRef]
- Johnstone, I.M.; Titterington, D.M. Statistical Challenges of High-Dimensional Data. Philos. Trans. R. Soc. Math. Phys. Eng. Sci. 2009, 367, 4237–4253. [Google Scholar] [CrossRef]
- Savitzky, A.; Golay, M.J.E. Smoothing and Differentiation of Data by Simplified Least Squares Procedures. Anal. Chem. 1964, 36, 1627–1639. [Google Scholar] [CrossRef]
- Scipy Signal Savgol_filter—SciPy v1.8.1 Manual. Available online: https://docs.scipy.org/doc/scipy/reference/generated/scipy.signal.savgol_filter.html (accessed on 4 July 2022).
- Suresh, S.; Srivastava, V.; Mishra, I. Techniques for Oxygen Transfer Measurement in Bioreactors: A Review. J. Chem. Technol. Biotechnol. 2009, 84, 1091–1103. [Google Scholar] [CrossRef]
- Bauer, I.; Dreher, T.; Eibl, D.; Glöckler, R.; Husemann, U.; John, G.T.; Kaiser, S.C.; Kampeis, P.; Kauling, J.; Kleebank, S.; et al. Recommendations for Process Engineering Characterisation of Single-Use Bioreactors and Mixing Systems by Using Experimental Methods, 2nd ed.; DECHEMA: Frankfurt am Main, Germany, 2020. [Google Scholar]
- Seidel, S.; Maschke, R.W.; Werner, S.; Jossen, V.; Eibl, D. Oxygen Mass Transfer in Biopharmaceutical Processes: Numerical and Experimental Approaches. Chem. Ing. Tech. 2021, 93, 42–61. [Google Scholar] [CrossRef]
- Werner, S.; Olownia, J.; Egger, D.; Eibl, D. An Approach for Scale-Up of Geometrically Dissimilar Orbitally Shaken Single-Use Bioreactors. Chem. Ing. Tech. 2013, 85, 118–126. [Google Scholar] [CrossRef]
- Andersen, K.B.; von Meyenburg, K. Are Growth Rates of Escherichia coli in Batch Cultures Limited by Respiration? J. Bacteriol. 1980, 144, 114–123. [Google Scholar] [CrossRef]
- Lin, H.Y.; Mathiszik, B.; Xu, B.; Enfors, S.-O.; Neubauer, P. Determination of the Maximum Specific Uptake Capacities for Glucose and Oxygen in Glucose-Limited Fed-Batch Cultivations of Escherichia coli. Biotechnol. Bioeng. 2001, 73, 347–357. [Google Scholar] [CrossRef]
- van der Aar, P.C.; van Verseveld, H.W.; Stouthamer, A.H. Stimulated Glycolytic Flux Increases the Oxygen Uptake Rate and Aerobic Ethanol Production, during Oxido-Reductive Growth of Saccharomyces Cerevisiae. J. Biotechnol. 1990, 13, 347–359. [Google Scholar] [CrossRef]
- Pépin, M.-F.; Archambault, J.; Chavarie, C.; Cormier, F. Growth Kinetics of Vitis Vinifera Cell Suspension Cultures: I. Shake Flask Cultures. Biotechnol. Bioeng. 1995, 47, 131–138. [Google Scholar] [CrossRef]
- Pfizenmaier, J.; Matuszczyk, J.-C.; Takors, R. Changes in Intracellular ATP-Content of CHO Cells as Response to Hyperosmolality. Biotechnol. Prog. 2015, 31, 1212–1216. [Google Scholar] [CrossRef]
- Aehle, M.; Kuprijanov, A.; Schaepe, S.; Simutis, R.; Lübbert, A. Simplified Off-Gas Analyses in Animal Cell Cultures for Process Monitoring and Control Purposes. Biotechnol. Lett. 2011, 33, 2103–2110. [Google Scholar] [CrossRef]
- Biener, R.; Steinkämper, A.; Hofmann, J. Calorimetric Control for High Cell Density Cultivation of a Recombinant Escherichia coli Strain. J. Biotechnol. 2010, 146, 45–53. [Google Scholar] [CrossRef]
- Xu, B.; Jahic, M.; Enfors, S.-O. Modeling of Overflow Metabolism in Batch and Fed-Batch Cultures of Escherichia coli. Biotechnol. Prog. 1999, 15, 81–90. [Google Scholar] [CrossRef] [PubMed]
- Stahl, G.; Salem, S.N.B.; Chen, L.; Zhao, B.; Farabaugh, P.J. Translational Accuracy during Exponential, Postdiauxic, and Stationary Growth Phases in Saccharomyces cerevisiae. Eukaryot. Cell 2004, 3, 331–338. [Google Scholar] [CrossRef] [PubMed]
- du Preez, J.C.; Maré, J.E.; Albertyn, J.; Kilian, S.G. Transcriptional Repression of ADH2-Regulated β-Xylanase Production by Ethanol in Recombinant Strains of Saccharomyces cerevisiae. FEMS Yeast Res. 2001, 1, 233–240. [Google Scholar] [CrossRef]
- Paalme, T.; Elken, R.; Vilu, R.; Korhola, M. Growth Efficiency of Saccharomyces cerevisiae on Glucose/Ethanol Media with a Smooth Change in the Dilution Rate (A-Stat). Enzym. Microb. Technol. 1997, 20, 174–181. [Google Scholar] [CrossRef]
- Lei, F.; Olsson, L.; Jørgensen, S.B. Dynamic Effects Related to Steady-State Multiplicity in Continuous Saccharomyces Cerevisiae Cultivations: Steady-State Multiplicity. Biotechnol. Bioeng. 2004, 88, 838–848. [Google Scholar] [CrossRef] [PubMed]
- Granata, T.; Follonier, C.; Burkhardt, C.; Rattenbacher, B. Methods for Oxygenation of Continuous Cultures of Brewer’s Yeast, Saccharomyces Cerevisiae. Fermentation 2021, 7, 282. [Google Scholar] [CrossRef]
- Cuperus, F.S. Influence of UV-B Radiation on Quality Determination Compounds in Must and Wine and Suspension Cell Cultures of Vitis vinifera; ETH Zürich: Zürich, Switzerland, 2007. [Google Scholar]
- Hirasuna, T.J.; Shuler, M.L.; Lackney, V.K.; Spanswick, R.M. Enhanced Anthocyanin Production in Grape Cell Cultures. Plant Sci. 1991, 78, 107–120. [Google Scholar] [CrossRef]
- Möller, J.; Bhat, K.; Guhl, L.; Pörtner, R.; Jandt, U.; Zeng, A. Regulation of Pyruvate Dehydrogenase Complex Related to Lactate Switch in CHO Cells. Eng. Life Sci. 2021, 21, 100–114. [Google Scholar] [CrossRef]
- Arndt, L.; Wiegmann, V.; Kuchemüller, K.B.; Baganz, F.; Pörtner, R.; Möller, J. Model-based Workflow for Scale-up of Process Strategies Developed in Miniaturized Bioreactor Systems. Biotechnol. Prog. 2021, 37, e3122. [Google Scholar] [CrossRef]
- Möller, J.; Kuchemüller, K.B.; Steinmetz, T.; Koopmann, K.S.; Pörtner, R. Model-Assisted Design of Experiments as a Concept for Knowledge-Based Bioprocess Development. Bioprocess Biosyst. Eng. 2019, 42, 867–882. [Google Scholar] [CrossRef]
- Maschke, R.W.; Eibl, D. Process Transfer of CHO Cultivations Using the Minifors 2 as an Example; Infors HT Application Note: Wädenswil, Switzerland, 2019. [Google Scholar]
- Müller, J.; Ott, V.; Eibl, D.; Eibl, R. Seed Train Intensification Using an Ultra-High Cell Density Cell Banking Process. Processes 2022, 10, 911. [Google Scholar] [CrossRef]
- Rhiel, M.; Mitchell-Logean, C.M.; Murhammer, D.W. Comparison of Trichoplusia ni BTI-Tn-5B1-4 (High FiveTM) and Spodoptera frugiperda Sf-9 Insect Cell Line Metabolism in Suspension Cultures. Biotechnol. Bioeng. 1997, 55, 909–920. [Google Scholar] [CrossRef]
- Ghasemi, A.; Bozorg, A.; Rahmati, F.; Mirhassani, R.; Hosseininasab, S. Comprehensive Study on Wave Bioreactor System to Scale up the Cultivation of and Recombinant Protein Expression in Baculovirus-Infected Insect Cells. Biochem. Eng. J. 2019, 143, 121–130. [Google Scholar] [CrossRef]
- Bögli, N.C.; Ries, C.; Adams, T.; Greller, G.; Eibl, D.; Eibl, R. Large-Scale, Insect-Cell–Based Vaccine Development. BioProInt 2015, 10, 40–49. [Google Scholar]
- Castillo Salvador, A.E.; Fuge, G.; Jandt, U.; Zeng, A.-P. Growth Kinetics and Validation of Near-Physiologically Synchronized HEK293S Cultures. Eng. Life Sci. 2015, 15, 509–518. [Google Scholar] [CrossRef]
- Martínez-Monge, I.; Comas, P.; Triquell, J.; Lecina, M.; Casablancas, A.; Cairó, J.J. A New Strategy for Fed-Batch Process Control of HEK293 Cell Cultures Based on Alkali Buffer Addition Monitoring: Comparison with O.U.R. Dynamic Method. Appl. Microbiol. Biotechnol. 2018, 102, 10469–10483. [Google Scholar] [CrossRef]
- Fontova, A.; Lecina, M.; López-Repullo, J.; Martínez-Monge, I.; Comas, P.; Bragós, R.; Cairó, J.J. A Simplified Implementation of the Stationary Liquid Mass Balance Method for On-Line OUR Monitoring in Animal Cell Cultures: Simplified OUR on-Line Monitoring Based on Stationary Liquid Mass Balance. J. Chem. Technol. Biotechnol. 2018, 93, 1757–1766. [Google Scholar] [CrossRef]
- Sohoni, S.V.; Bapat, P.M.; Lantz, A.E. Robust, Small-Scale Cultivation Platform for Streptomyces Coelicolor. Microb. Cell Factories 2012, 11, 9. [Google Scholar] [CrossRef]
- Anderlei, T.; Keebler, M.V.; Cairó, J.J.; Lecina, M. HEK293 Cell-Based Bioprocess Development at Bench Scale by Means of Online Monitoring in Shake Flasks (RAMOS and SFR). In Animal Cell Biotechnology; Methods in Molecular Biology; Pörtner, R., Ed.; Springer: New York, NY, USA, 2020; Volume 2095, pp. 83–103. ISBN 978-1-07-160190-7. [Google Scholar]
- Lennox, E.S. Transduction of Linked Genetic Characters of the Host by Bacteriophage P1. Virology 1955, 1, 190–206. [Google Scholar] [CrossRef]
- Terrific Broth (TB) Medium. Cold Spring Harb. Protoc. 2015. Available online: http://cshprotocols.cshlp.org/content/2015/9/pdb.rec085894 (accessed on 14 July 2022).
- YPD. Cold Spring Harbor Protocols. 2006. Available online: http://cshprotocols.cshlp.org/content/2006/1/pdb.rec8194 (accessed on 14 July 2022).
- Murashige, T.; Skoog, F. A Revised Medium for Rapid Growth and Bio Assays with Tobacco Tissue Cultures. Physiol. Plant. 1962, 15, 473–497. [Google Scholar] [CrossRef]
- Zhao, L.; Fan, L.; Zhang, X.; Zhu, M.; Tan, W. The Role of Microenvironment in Aggregation of the 293-Human Embryonic Kidney Cells. Korean J. Chem. Eng. 2007, 24, 796–799. [Google Scholar] [CrossRef]


| Attribute | Information | Value |
|---|---|---|
| O2, threshold | Oxygen limit when it can be assumed that exponential growth is impossible. | 10–20% |
| Growth speed | Growth speed of the organism | Fast, medium, slow |
| Organism | Flask Type | Backscatter | OUR |
|---|---|---|---|
| E. coli | Without baffles | Average | Good |
| With baffles | Noisy at low filling volumes | Good | |
| S. cerevisiae | Without baffles | Average | Good |
| With baffles | Noisy at low filling volumes | Good | |
| V. vinifera | With and without baffles | Good | Metabolic changes affect signal |
| CHO cells | Without baffles | Detection of dead cells | Good |
| High Five | Without baffles | Detection of dead cells | Good |
| HEK293 | With and without baffles | Detection of dead cells | Good |
| Organism | Medium | µoffline | µBSL, man. | µBSL, auto. | µOUR, man. | µOUR, auto. | qO2 | YX/S |
|---|---|---|---|---|---|---|---|---|
| (Replicates) | [h−1] | [h−1] | [h−1] | [h−1] | [h−1] | [mol g−1 h−1] | [g g−1] | |
| E. coli | LB (6) | 1.2982 ± 0.1153 | - | - | 1.2752 ± 0.2049 | 1.2075 ± 0.1511 | 1.65 ± 0.28 × 10⁻² | - 1 |
| TB (6) | 1.2889 ± 0.0453 | - | - | 1.3421 ± 0.0419 | 1.3778 ± 0.0191 | 1.82 ± 0.33 × 10⁻² | 1.679 ± 0.032 2 | |
| Biener (4) | 0.6199 ± 0.0194 | - | - | 0.6432 ± 0.0041 | 0.5820 ± 0.0021 | 2.13 ± 0.41 × 10⁻² | 0.434 ± 0.065 | |
| S. cerevisiae | YPD (10) | 0.4964 ± 0.0344 | 0.6226 ± 0.1294 | 0.5110 ± 0.0907 | 0.4895 ± 0.0446 | 0.4744 ± 0.0424 | 2.59 ± 0.39 × 10⁻³ | 0.812 ± 0.168 2 |
| V. vinifera | MS (12) | 0.0084 ± 0.0009 | 0.0088 ± 0.0009 | 0.0080 ± 0.0008 | - | - | 2.29 ± 0.40 × 10⁻⁴ | 0.474 ± 0.037 |
| [mol cell−1 h−1] | [106 cells g−1] | |||||||
| CHO DP-12 | TC-42 (8) | 0.0349 ± 0.0017 | - | - | 0.0335 ± 0.0018 | 0.0327 ± 0.0011 | 2.88 ± 0.62 × 10⁻¹³ | 1.990 ± 0.140 |
| ExpiCHO-S | SPM (6) | 0.0390 ± 0.0007 | - | - | 0.0359 ± 0.0005 | 0.0362 ± 0.0007 | 2.28 ± 0.24 × 10⁻¹³ | 3.126 ± 0.065 |
| High Five | Exp.Five (8) | 0.0445 ± 0.0014 | - | - | 0.0453 ± 0.0017 | 0.0430 ± 0.0010 | 4.18 ± 0.02 × 10⁻¹³ | 1.274 ± 0.057 |
| HEK293 | FS293 (6) | 0.0315 ± 0.0026 | - | - | 0.0365 ± 0.0010 | 0.0355 ± 0.0005 | 9.86 ± 3.76 × 10⁻¹⁴ | 1.392 ± 0.151 |
| Organism | µauto. 1 | µlit | qO2, auto. | qO2, lit. | YX/S | YX/S,lit | References |
|---|---|---|---|---|---|---|---|
| [h−1] | [h−1] | [mol g−1 h−1] | [mol g−1 h−1] | [g g−1] | [g g−1] | ||
| E. coli 2 | 0.5820 ± 0.0021 | 0.54-0.56 | 2.13 ± 0.41 × 10⁻² | 1.3–2.2 × 10⁻² | 0.434 ± 0.065 | 0.50–0.54 | [54,55,60,61] |
| S. cerevisiae | 0.4744 ± 0.0424 | 0.42–0.51 | 2.59 ± 0.39 × 10⁻³ | 1.0–9.0 × 10⁻³ | 0.812 ± 0.168 | N.A. 2 | [56,62,63,64,65,66] |
| V. vinifera | 0.0080 ± 0.0008 | 0.0065–0.01 | 2.29 ± 0.40 × 10⁻⁴ | 1.1–7.1 × 10⁻⁴ | 0.474 ± 0.037 | 0.47–0.49 | [57,67,68] |
| [mol cell−1 h−1] | [mol cell−1 h−1] | [106 cells g−1] | [106 cells g−1] | ||||
| CHO DP-12 | 0.0327 ± 0.0011 | 0.0358–0.0363 | 2.88 ± 0.62 × 10⁻¹³ | 3.10 × 10⁻¹³ | 1.990 ± 0.140 | 2.063–2.216 | [58,69,70,71,72] |
| ExpiCHO-S | 0.0362 ± 0.0007 | 0.0316–0.0422 | 2.28 ± 0.24 × 10⁻¹³ | 2.30–2.90 × 10⁻¹³ | 3.126 ± 0.065 | 3.3–3.4 | [59,73] |
| High Five | 0.0430 ± 0.0010 | 0.028–0.044 | 4.18 ± 0.02 × 10⁻¹³ | 2.88–9.00 × 10⁻¹³ | 1.274 ± 0.057 | 1.250 | [74,75,76] |
| HEK293 | 0.0355 ± 0.0005 | 0.03–0.05 | 9.86 ± 3.76 × 10⁻¹⁴ | 1.30–1.85 × 10⁻¹³ | 1.392 ± 0.151 | N.A. | [77,78,79] |
| Cell Line | Origin/Source | Media |
|---|---|---|
| CHO DP-12 #1934 | Subclone, courtesy of Prof. Noll, Bielefeld | TC-42 (cat. 511-0001, Xell AG, Bielefeld, Germany) 1 |
| ExpiCHO-S-6H8 | Thermo Fisher Scientific, cat. A29127 | ExpiCHO Stable production medium (cat. A3711001) 2 |
| Freestyle 293 (HEK) | Thermo Fisher Scientific, cat. R79007 | FreeStyle Expression 293 (cat. 12338018) |
| High Five | Thermo Fisher Scientific, cat. B85502 | Express Five SFM (cat. 10486025) 3 |
| Cell Line | Temperature [°C] | Shaking Rate [rpm] | Vrel [%] | CO2 [%] |
|---|---|---|---|---|
| CHO DP-12 | 37 | 120 | 32 | 7.5 |
| EXPI-CHO S | 37 | 130 | 24–32 | 8.0 |
| Freestyle 293 | 37 | 130 | 32 | 8.0 |
| High Five | 27 | 100 | 24 | 0.0 |
Publisher’s Note: MDPI stays neutral with regard to jurisdictional claims in published maps and institutional affiliations. |
© 2022 by the authors. Licensee MDPI, Basel, Switzerland. This article is an open access article distributed under the terms and conditions of the Creative Commons Attribution (CC BY) license (https://creativecommons.org/licenses/by/4.0/).
Share and Cite
Maschke, R.W.; Pretzner, B.; John, G.T.; Herwig, C.; Eibl, D. Improved Time Resolved KPI and Strain Characterization of Multiple Hosts in Shake Flasks Using Advanced Online Analytics and Data Science. Bioengineering 2022, 9, 339. https://doi.org/10.3390/bioengineering9080339
Maschke RW, Pretzner B, John GT, Herwig C, Eibl D. Improved Time Resolved KPI and Strain Characterization of Multiple Hosts in Shake Flasks Using Advanced Online Analytics and Data Science. Bioengineering. 2022; 9(8):339. https://doi.org/10.3390/bioengineering9080339
Chicago/Turabian StyleMaschke, Rüdiger W., Barbara Pretzner, Gernot T. John, Christoph Herwig, and Dieter Eibl. 2022. "Improved Time Resolved KPI and Strain Characterization of Multiple Hosts in Shake Flasks Using Advanced Online Analytics and Data Science" Bioengineering 9, no. 8: 339. https://doi.org/10.3390/bioengineering9080339