Article

Optimization of Extraction Parameters to Enhance the Antioxidant Properties of Pyrus spinosa Fruit Extract

by
Konstantina Kotsou
1,
Anna Papagiannoula
2,
Theodoros Chatzimitakos
1,
Vassilis Athanasiadis
1,
Eleni Bozinou
1,
Athanassios I. Sfougaris
2 and
Stavros I. Lalas
1,*
1
Department of Food Science and Nutrition, University of Thessaly, 43100 Karditsa, Greece
2
Crop Production and Rural Environment, Laboratory of Ecosystems and Biodiversity Management, Department of Agriculture, University of Thessaly, Fytokou Str., 38446 Volos, Greece
*
Author to whom correspondence should be addressed.
Beverages 2024, 10(3), 56; https://doi.org/10.3390/beverages10030056
Submission received: 1 May 2024 / Revised: 24 June 2024 / Accepted: 3 July 2024 / Published: 5 July 2024

Abstract

:
Pyrus spinosa (PS), also known as wild pear, is an indigenous species to the Mediterranean basin. It has attracted interest for its potential use in the food and beverage industries due to its antioxidant properties. This research aims to develop an antioxidant-rich PS fruit extract by optimizing the extraction parameters. More specifically, through a comprehensive study of the extraction parameters (including extraction duration, temperature, and ethanol concentration), the optimal conditions were determined that can achieve the highest antioxidant properties. High-Performance Liquid Chromatography (HPLC) was employed for the identification and quantitation of the polyphenolic compounds present in PS fruits. The optimized extraction conditions significantly enhanced the antioxidant properties of the extract, with the total polyphenol content increasing by up to 345% (reaching a value of 50.97 mg gallic acid equivalents per g of dry weight in the optimum sample), total flavonoid content by up to 273%, and ascorbic acid content by up to 653%. Furthermore, the antioxidant capacity of the extracts increased by 2356% (by FRAP method) and 1622% (by the DPPH method), with varying extraction parameters. These findings highlight the importance and the effectiveness of optimizing the extraction parameters in order to increase the antioxidant properties of PS fruit extract. Based on these findings, PS extracts can be further utilized in the food and beverage industries to develop new products that will benefit from the antioxidant properties.

1. Introduction

Wild almond pear, Pyrus spinosa (syn. Pyrus amygdaliformis); PS, is a species of floral plant of the family Rosaceae, native to the northern Mediterranean region [1], and abundant in Greece. In ecological terms, PS is a xerophilic species, showing a high level of adaptability, being able to thrive in extreme conditions, such as dry, hot, and degraded environments [2]. In addition, it grows in sandy, clay, stony, and calcareous soils, as well as in high-salinity environments.
The importance of Pyrus spp. as a food source is due to its fiber, minerals, ascorbic acid (vitamin C), and organic acids. In addition, the fruits of the Pyrus genus are a rich source of polyphenols with good antioxidant activity [3]. As far as the PS plant is concerned, it contains ascorbic acid, with leaves presenting the highest amount (26 mg/100 g of fresh weight) followed by seeds (25 mg/100 g of fresh weight) and fruits (24 mg/100 g of fresh weight) [4]. In addition, PS fruits contain important polyphenols, with chlorogenic acid being the main one [4], bestowing good antioxidant properties to the fruits. More specifically, the fruit extract of the PS plant (100 mg/mL) was found to be able to scavenge 91.2% of free radicals, while seed extracts could scavenge only 1% of free radicals [5]. Pyrus spinosa (PS) is particularly noteworthy due to its diuretic properties, which have been documented to be therapeutic for a range of conditions including bladder inflammation, bacteriuria, hypertension, and kidney stones. In addition, it has also been reported to aid the recovery from urinary tract disorders and extend its benefits to liver function and the menstrual cycle [3]. Despite the limited research on PS plants, in 2016, it was included in the list of world economic plants [6], highlighting its potential economic and medicinal value that necessitates further investigations.
The consumption of beverages of plant origin is currently expanding in response to new dietary trends [7], with more than 37% of the European population reporting that they consume beverages of plant origin [8]. Consequently, the food industry has focused on the development of nutritious and functional foods and beverages [9]. Representative examples are fruit spirits and liqueurs that have gained great popularity as spirit-based beverages. Functional foods, in general, can be considered to be conventional foods and beverages enriched with plant extracts offering additional health benefits [10,11]. The constituents of functional natural plant extracts are mostly secondary metabolites of the plant, which can be divided into polyphenols, polysaccharides, terpenes, alkaloids, pro-proteins, and lipids. Among them, polyphenols are the main active ingredients in plant-based beverages [12]. However, plants also contain ascorbic acid, compounds with well-documented antioxidant properties, in varying amounts in their different parts, such as fruits, flowers, leaves, roots, stems, and leaves [13].
Given that studies on PS fruits are scanty and sparse, and since PS fruits are important in terms of bioactivity, the present study aimed to develop antioxidant-rich extracts from PS fruits by proposing an optimized extraction protocol for PS fruit that maximizes its antioxidant properties. By systematically varying extraction duration, temperatures, and hydroethanolic solvent composition, the goal was to identify the most effective conditions for obtaining the maximum polyphenol and ascorbic acid content. This optimized extract protocol is intended to provide a valuable stepstone for further research and industrial applications.

2. Materials and Methods

2.1. Chemicals and Reagents

All solvents used were at least of HPLC grade and obtained from Carlo Erba (Val de Reuil, France). Gallic acid, rutin, anhydrous sodium carbonate, 2,2-diphenyl-1-picrylhydrazyl (DPPH), 2,4,6-tri-2-pyridinyl-1,3,5-triazine (TPTZ), and Folin–Ciocalteu reagent were obtained from Penta (Prague, Czech Republic). Chemical standards for the HPLC-based determination of polyphenols (i.e., neochlorogenic acid, chlorogenic acid, ferulic acid, rutin, kaempferol-3-glucoside), iron (III) chloride, hydrochloric acid, ascorbic acid, and trichloroacetic acid were followed, and they were purchased from Sigma-Aldrich (Steinheim, Germany). Deionized water was used for all the conducted experiments.

2.2. Fruit Collection and Preparation

The PS fruits were harvested in October 2023 from a wild yield in Volos, Thessaly, Greece. Fruits were at full maturity, with a characteristic green-brown color [1,5]. Harvesting was carried out carefully by the agricultural authors and, subsequently, they were thoroughly washed first with tap water and then with deionized water. A stainless-steel knife was used to cut the fruits into small pieces in order to lyophilize them. A Biobase BK-FD10P lyophilizer (Jinan, China) was used for the lyophilization, and it ran for 24 h at 7 Pa and −54 °C. To increase the efficiency of the extraction process, the dried fruits were ground into a powder with an average size of 200–400 μm. In order to retain all of their bioactive compounds, they were kept in a freezer (−40 °C).

2.3. Extraction Process

A multifactorial system used for the extraction of PS fruits is presented in Table 1, containing all the examined parameters of the extraction such as the concentration of solvent, ethanol (CEtOH, % v/v), temperature (T, °C), and time (t, min). As an extraction method, conventional stirring was employed at 500 rounds per minute (rpm) using a magnetic stirrer (Heidolph Instruments GmbH & Co. KG, Schwabach, Germany). The followed solid-to-liquid ratio was 1:20 (1 g of sample with 20 mL of solvent) after preliminary experiments. After the completion of the extraction process, the sample was centrifuged at 3600× g for 10 min using equipment from Remi Elektrotechnik Ltd. (Palghar, India). The supernatant was then collected and stored at −40 °C until it was used for further analysis.

2.4. Response Surface Methodology (RSM) Extraction Optimization and Design of Experiment

In the Supplementary Materials, extensive information on the application of the Box–Behnken design within response surface methodology (RSM) to improve the efficiency of the sample in extracting bioactive compounds is provided.

2.5. Analyses of PS Fruit Extracts

The dry weight (dw) of the PS fruit was used to express all the reported findings. The total polyphenol content (TPC) of PS fruits was determined using the methodology described by Lakka et al. [14]. The total flavonoid content (TFC) was measured using the previously published method by Paleologou et al. [15]. A previously published technique by Paleologou et al. [15] was used to assess the antioxidant activity using the FRAP assay. Athanasiadis et al. [16] previously detailed the experimentation process used to evaluate the DPPH radical scavenging activity. The ascorbic acid content (AAC) of PS fruit was measured using a colorimetric assay that was detailed by Athanasiadis et al. [16].

2.6. HPLC-Based Analysis of the Polyphenolic Compounds

The analysis utilized a Shimadzu CBM-20A liquid chromatograph and a Shimadzu SPD-M20A diode array detector, both provided by Shimadzu Europa GmbH in Duisburg, Germany. Separation of compounds occurred on a Phenomenex Luna C18 (2) column from Phenomenex Inc. in Torrance, CA, USA, maintained at 40 °C (100 Å, 5 μm, 4.6 mm × 250 mm). The mobile phase comprised 0.5% aqueous formic acid (A) and a mixture of 0.5% formic acid in acetonitrile/water (6:4) (B). Solvents were HPLC grade with low UV absorption suitable for UV spectroscopy. The gradient program employed was as follows: starting at 5% B and increasing to 40% B, then a transition to 50% B over 10 min, further increasing to 70% B in the subsequent 10 min, and then maintaining this level for 10 min. The flow rate of the mobile phase was set at 1 mL/min. Retention time and absorbance spectrum comparisons were made against those of pure chemical standards for compound identification. Quantification was accomplished at the λmax of each compound using calibration curves ranging from 0 to 50 μg/mL.

2.7. Statistical Analysis

The analyses were carried out in triplicate, the standard deviation was calculated, and the data were reported as mean values of the triplicate analyses ± standard deviation. A one-way analysis of variance (ANOVA) test was used to determine the statistical significance of differences in mean values; p < 0.05 was considered statistically significant. JMP® Pro 16 software (SAS, Cary, NC, USA) was used for associated statistics.

3. Results and Discussion

3.1. Extraction Optimization

In order to determine the most suitable extraction procedure, the influence of each extraction factor (CEtOH, T, and t) was evaluated using the RSM approach. The influence of each combination of extraction parameters was assessed according to the content of the extracts in polyphenols, flavonoids, and ascorbic acid, as well as according to their antioxidant activity, measured by FRAP and DPPH assays. The results are presented in Table 2. As can be seen, the most efficient combination of independent variables was design points 2 and 7, while on the contrary, design points 6 and 15 were found to be the least efficient combination in terms of the examined responses. Based on the results, it occurs that when ethanol is added to the extraction solvent, enhanced responses are achieved, with optimum values achieved with 50% of CEtOH. Likewise, it occurs that the higher the extraction temperature, the higher the extraction yield, with optimal results obtained when the extraction was carried out at 80 °C compared to the lowest examined temperature of 20 °C. Based on this finding, it would be anticipated that direct extraction on fresh samples could be carried out by adjusting the ethanol concentration to the optimum value (vide infra). This would be an easy option that would negate the need for drying steps and would reduce the overall cost. Further studies should be undertaken to examine whether this is possible and whether the results would be comparable to the extraction performed using dried samples.
Solvent concentration is considered a key factor for extraction procedures as it can influence the outcome of the isolation of various bioactive compounds positively or negatively [17]. Pure ethanol or various % of CEtOH is generally the most suitable solvent for extracting phenolic compounds and antioxidant compounds from natural sources [18] because the polar and non-polar groups contained in the chemical structure of ethanol encourage intermolecular interactions with both hydroxyl groups and the aromatic groups of polyphenols [19]. In addition, the presence of ethanol assists the extraction process since it disrupts the lipid bilayer of cell membranes, increasing their permeability. This disruption facilitates the release of intracellular compounds into the solvent. Also, water, being highly polar, aids in the initial swelling of the plant material and helps to solubilize polar compounds.
Extraction T is also of great significance as an extraction parameter that influences the efficiency of extraction [20]. As for conventional extractions, such as stirring, the TPC is highest at an extraction T of 60–80 °C [21]. In addition, T around 75 °C is considered ideal for maintaining the AAC [22], while T above 85 °C can be destructive for the AAC [23]. Comparing the present results with the aforementioned data, it is evident that the optimal extraction parameters include heating at high temperatures, which favors the extraction procedure, without causing any damage to the extracted compounds.
In regard to the extraction time, at the initial phase of the extraction process, the rapid solubilization of easily accessible polyphenolic compounds takes place, yielding high TPC values. As time passes, the process becomes slower, resulting in slower extraction, up to the point that no further enhancement is observed. However, an extended extraction time can lead to the breakdown of polyphenols and other antioxidants, potentially reducing the overall quality and antioxidant capacity of the extract. Overall, the measured concentrations of bioactive compounds are the combination of the extracted compounds minus the degraded ones, something that can result in prolonged times being more effective that lower times if the equilibrium between the two processes shifts towards the extraction and not towards the degradation.
In Table 3, the statistical parameters, second-order polynomial equations, and coefficients (R2 > 0.94) of each model are exhibited, suggesting a high level of accuracy with the developed models. Plots of the actual response versus the predicted response for each examined parameter as well as the desirability functions are presented in Figures S1–S5. Three-dimensional plots for TPC can be seen in Figure 1, and the three-dimensional plots for the rest of the responses are presented in the Supplementary Materials in Figures S6–S9.

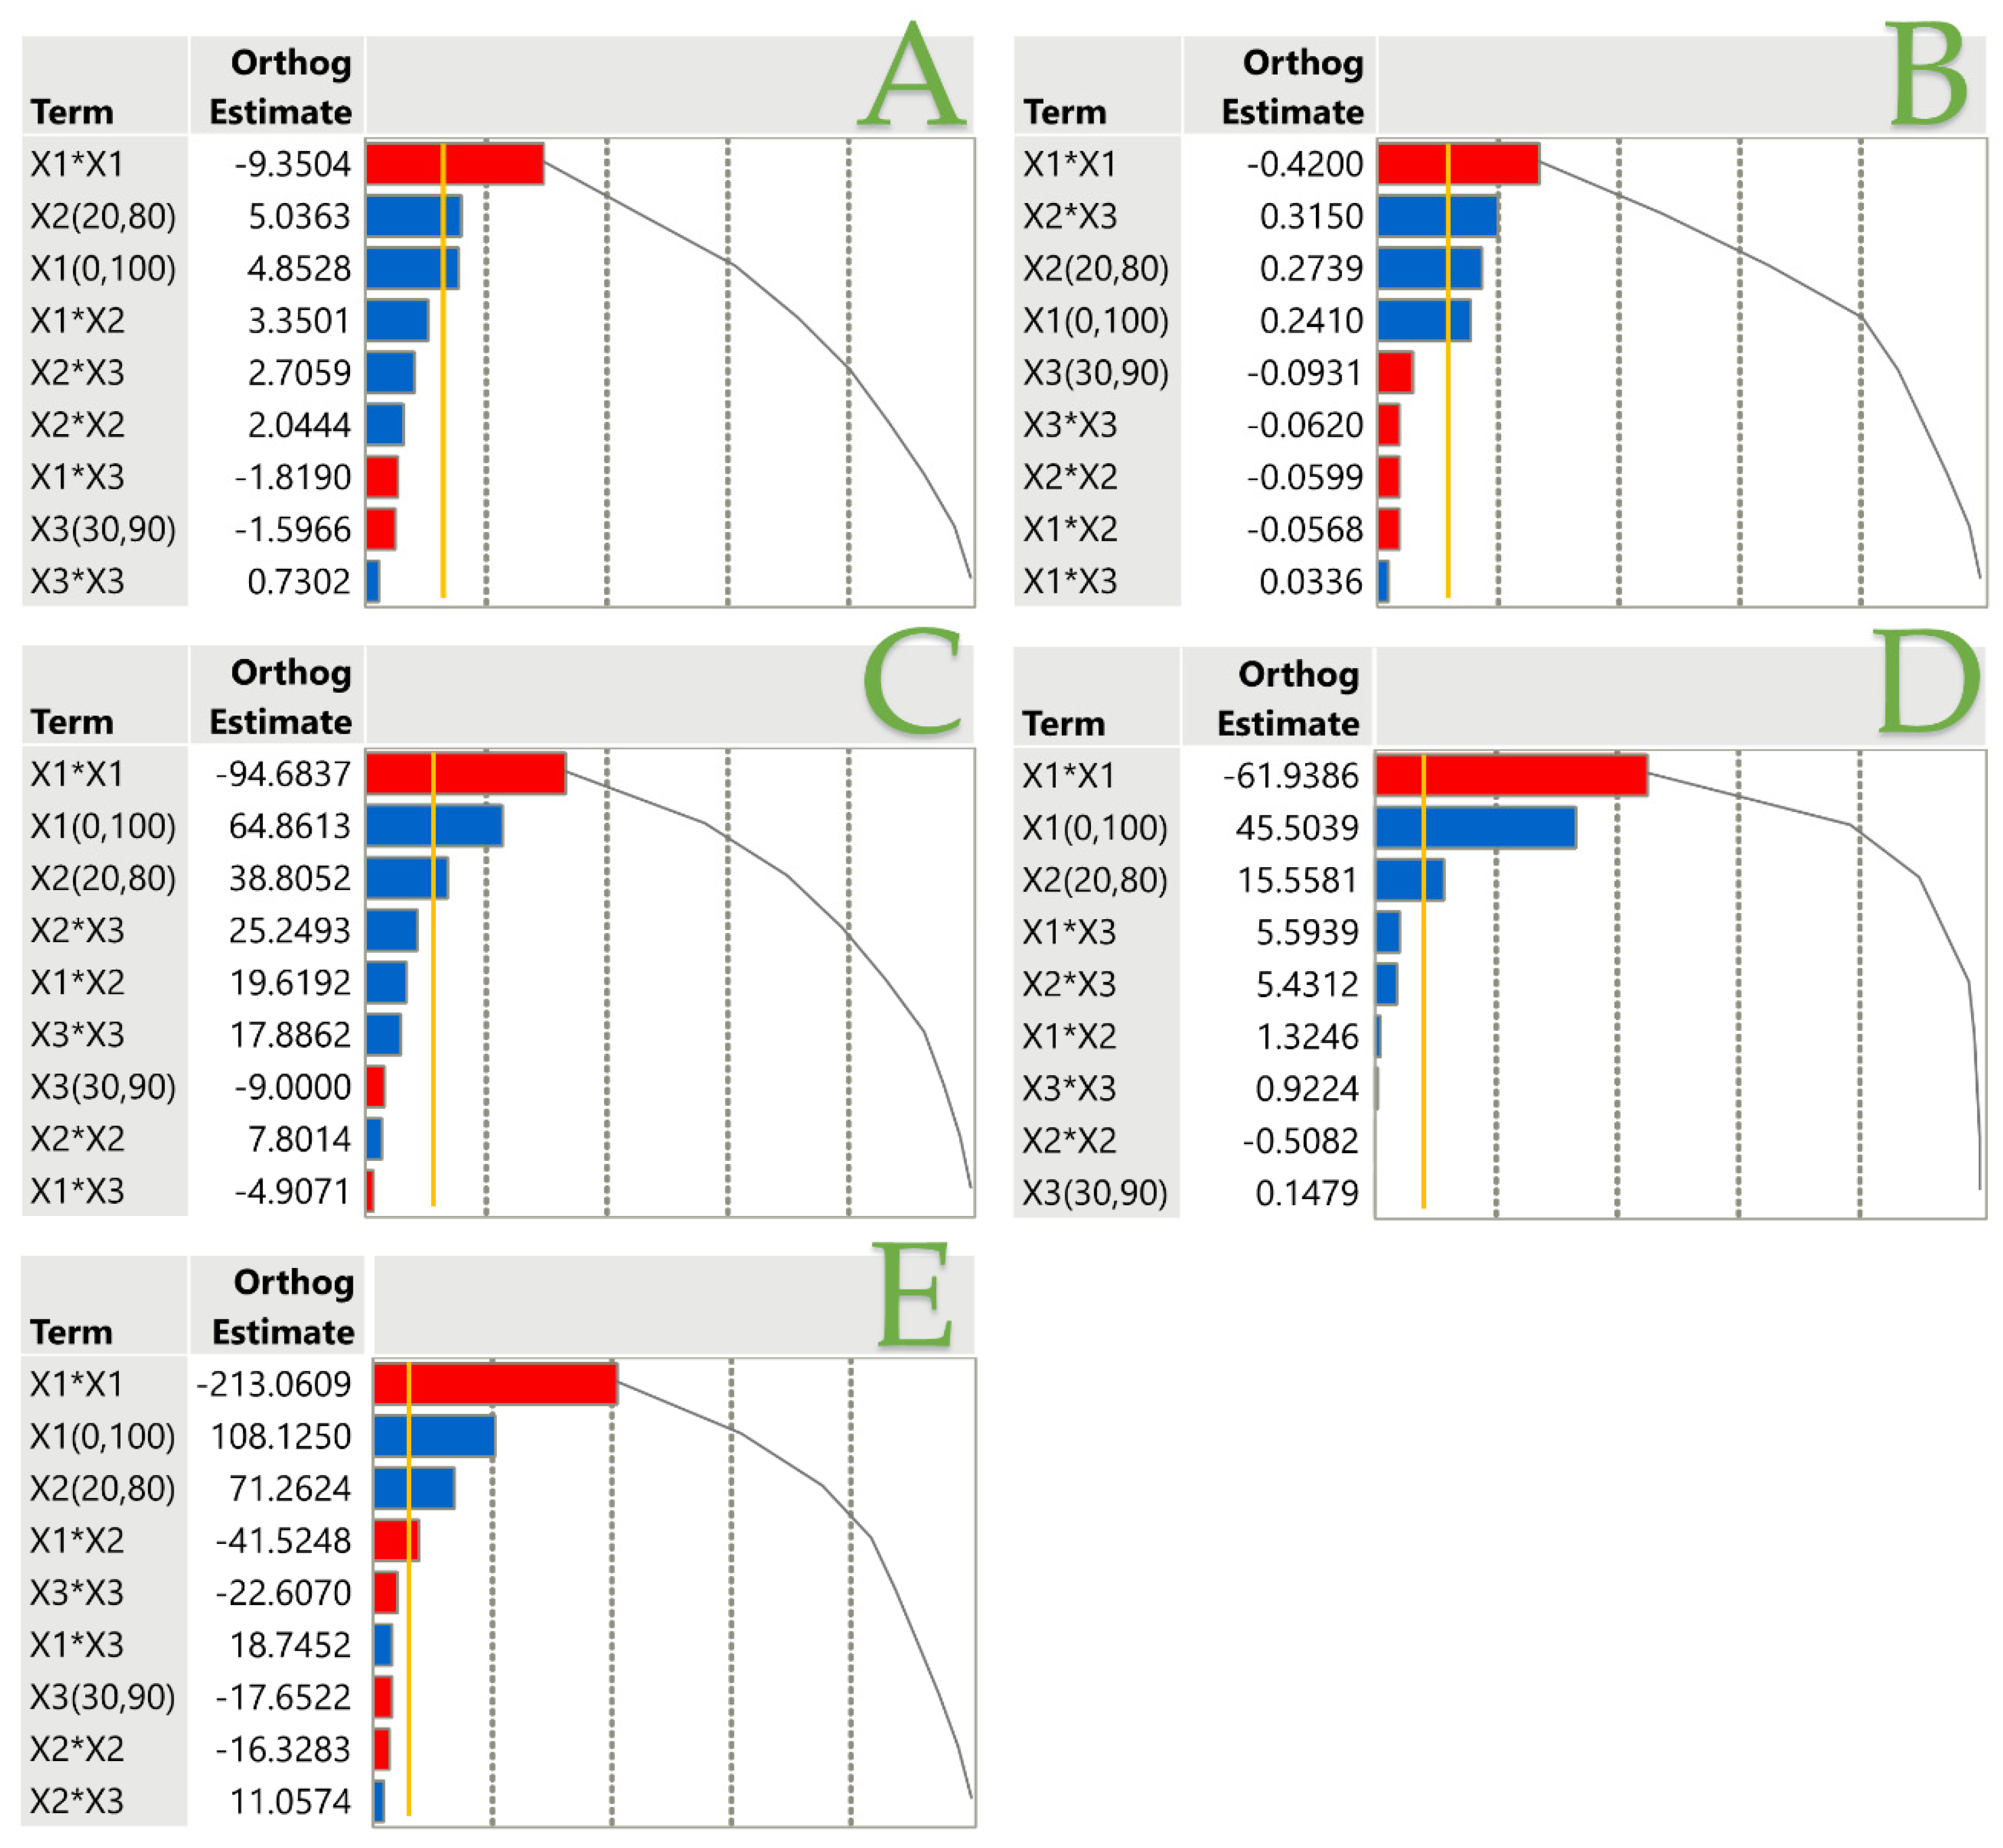
3.2. Pareto Plot Analysis for the Impact of the Extraction Parameters on Assays

In Figure 2, the extraction parameters and their effectiveness in enhancing the measured responses are illustrated. The red bar underlines the negative influence of the parameters and the blue one underlines the positive influence, with the gold line indicating the significance level. From the plots, it occurs that CEtOH and T are the main factors that positively influenced the effectiveness of the extraction of PS fruits, as was expected since these parameters are key extraction factors, as noted before. The quadratic effect of ethanol concentration was found to be the most important parameter, highlighting the non-linear relationship between ethanol concentration and extraction efficiency.

3.3. Analysis of the Extracts and Optimal Extraction Conditions

3.3.1. Total Polyphenol Content (TPC) and Total Flavonoid Content (TFC) of the PS Fruit Extracts

Table 2 shows the influence of combinations of various parameters on the TPC in PS fruit extracts. The TPC ranged from 12.88 mg gallic acid equivalents (GAE)/g dry weight (dw) to 57.37 mg GAE/g dw, showing an increase of 345.42%. According to Table 4, CEtOH 62%, T 80 °C, and t 90 min are the most suitable factors for obtaining the highest TPC yields. Pyrus communis is a well-known pear. P. communis is mainly consumed as juice (recommended during pregnancy for both mother and baby), and daily consumption of fresh pear has been found to prevent uterine cancer, especially in women [24]. Depending on the variety and growing region, the TPC in P. communis will vary [25]. Considering previous research, the TPC value of P. communis was found to range from 2.19 mg/g dw [26] to 31.90 mg/g dw [27]. Comparing the optimum result from the present study with the aforementioned ones, PS fruit extract can be richer in TPC in 79.84 to 2519.63% than P. communis. These results highlight the unexplored potential of PS fruits as food products, compared to more commonly consumed juices such as P. communis juice.
Flavonoids provide several health benefits because they prevent oxidation and gene mutations and reduce inflammation. According to Table 2, following the suggested parameters, a flavonoid-enhanced PS extract (up to 273.81%) can be observed. Hence, the optimum TFC can be exhibited using 57% CEtOH for 90 min at 80 °C, as can be seen in Table 4. Studying a previous experimental survey where Mandrone et al. [28] examined three varieties of P. communis, the TFC was recorded to span from approximately 1 mg RtE/g to 3 mg RtE/g. These results are in perfect agreement with the results of the present study, signaling the importance of further exploration and utilization of PS fruits, that so far present a rich combination of bioactive compounds with a multitude of beneficial properties in human health.

3.3.2. Antioxidant Capacity of the PS Fruit Extracts

For a multifaceted exploration of the antioxidant capacity of PS fruit extracts, two methods, FRAP and DPPH, were employed. A notable result, according to Table 2, shows that design point 2 yielded the highest results for both methods, while following design point 15 yielded the lowest antioxidant capacity values. Of special note is that with appropriate parameters, the antioxidant capacity can be increased by 2356.11% (by FRAP method) and 1622.05% (by DPPH method), leading to excellent antioxidant PS fruit extracts. By following almost identical parameters, according to Table 4, maximum antioxidant capacity can be ensured regardless of the method. These parameters are also quite convergent with those that should be followed to obtain the maximum TPC, suggesting that the polyphenols are possibly the ones that provide strong antioxidant capacity in the extract. The antioxidant capacity in the Pyrus genus has been studied previously with emphasis on the DPPH method. More specifically, according to Alexandri et al. [29], the antioxidant capacity in the PS species scored a value up to 71.21 μg ascorbic acid equivalents (AAE)/g (0.40 μmol AAE/g), while when the antioxidant property of P. communis was examined by Petridis et al. [30], the value scored was 20.57 μmol AAE/g. Hence, it is perceived that by following the appropriate extraction methods, the antioxidant activity in PS fruit extracts can be rapidly increased, surpassing even that of common pear, which has been reported to contain high antioxidant capacity [31].

3.3.3. Ascorbic Acid Content (AAC) of the PS Fruit Extracts

By applying extraction with solvent 50% CEtOH for 30 min at 80 °C, it is possible to ensure a 653.36% enhancement in the AAC of PS fruit extract. Ascorbic acid is a natural antioxidant [32] offering diverse applications in the healthcare sector, protecting against heart diseases and preventing cancer occurrence [33]. Consequently, the importance of the consumption of fruits or their food products rich in ascorbic acid becomes perceptible. One of them that stands out is the PS fruit extract, prepared under the suggested conditions because according to previous research on the AAC in PS fruit, the recorded value was 24.00 mg/100 g [4]. The aforementioned value is greatly reduced by that which can be obtained by following the suggested extraction parameters of either Table 2 or Table 4, which focuses on the optimum parameters for each bioactive component. As for P. communis, its AAC varied from 9.10 to 29.70 mg/100 g [34], decreased values compared to those that can be secured from PS fruits.

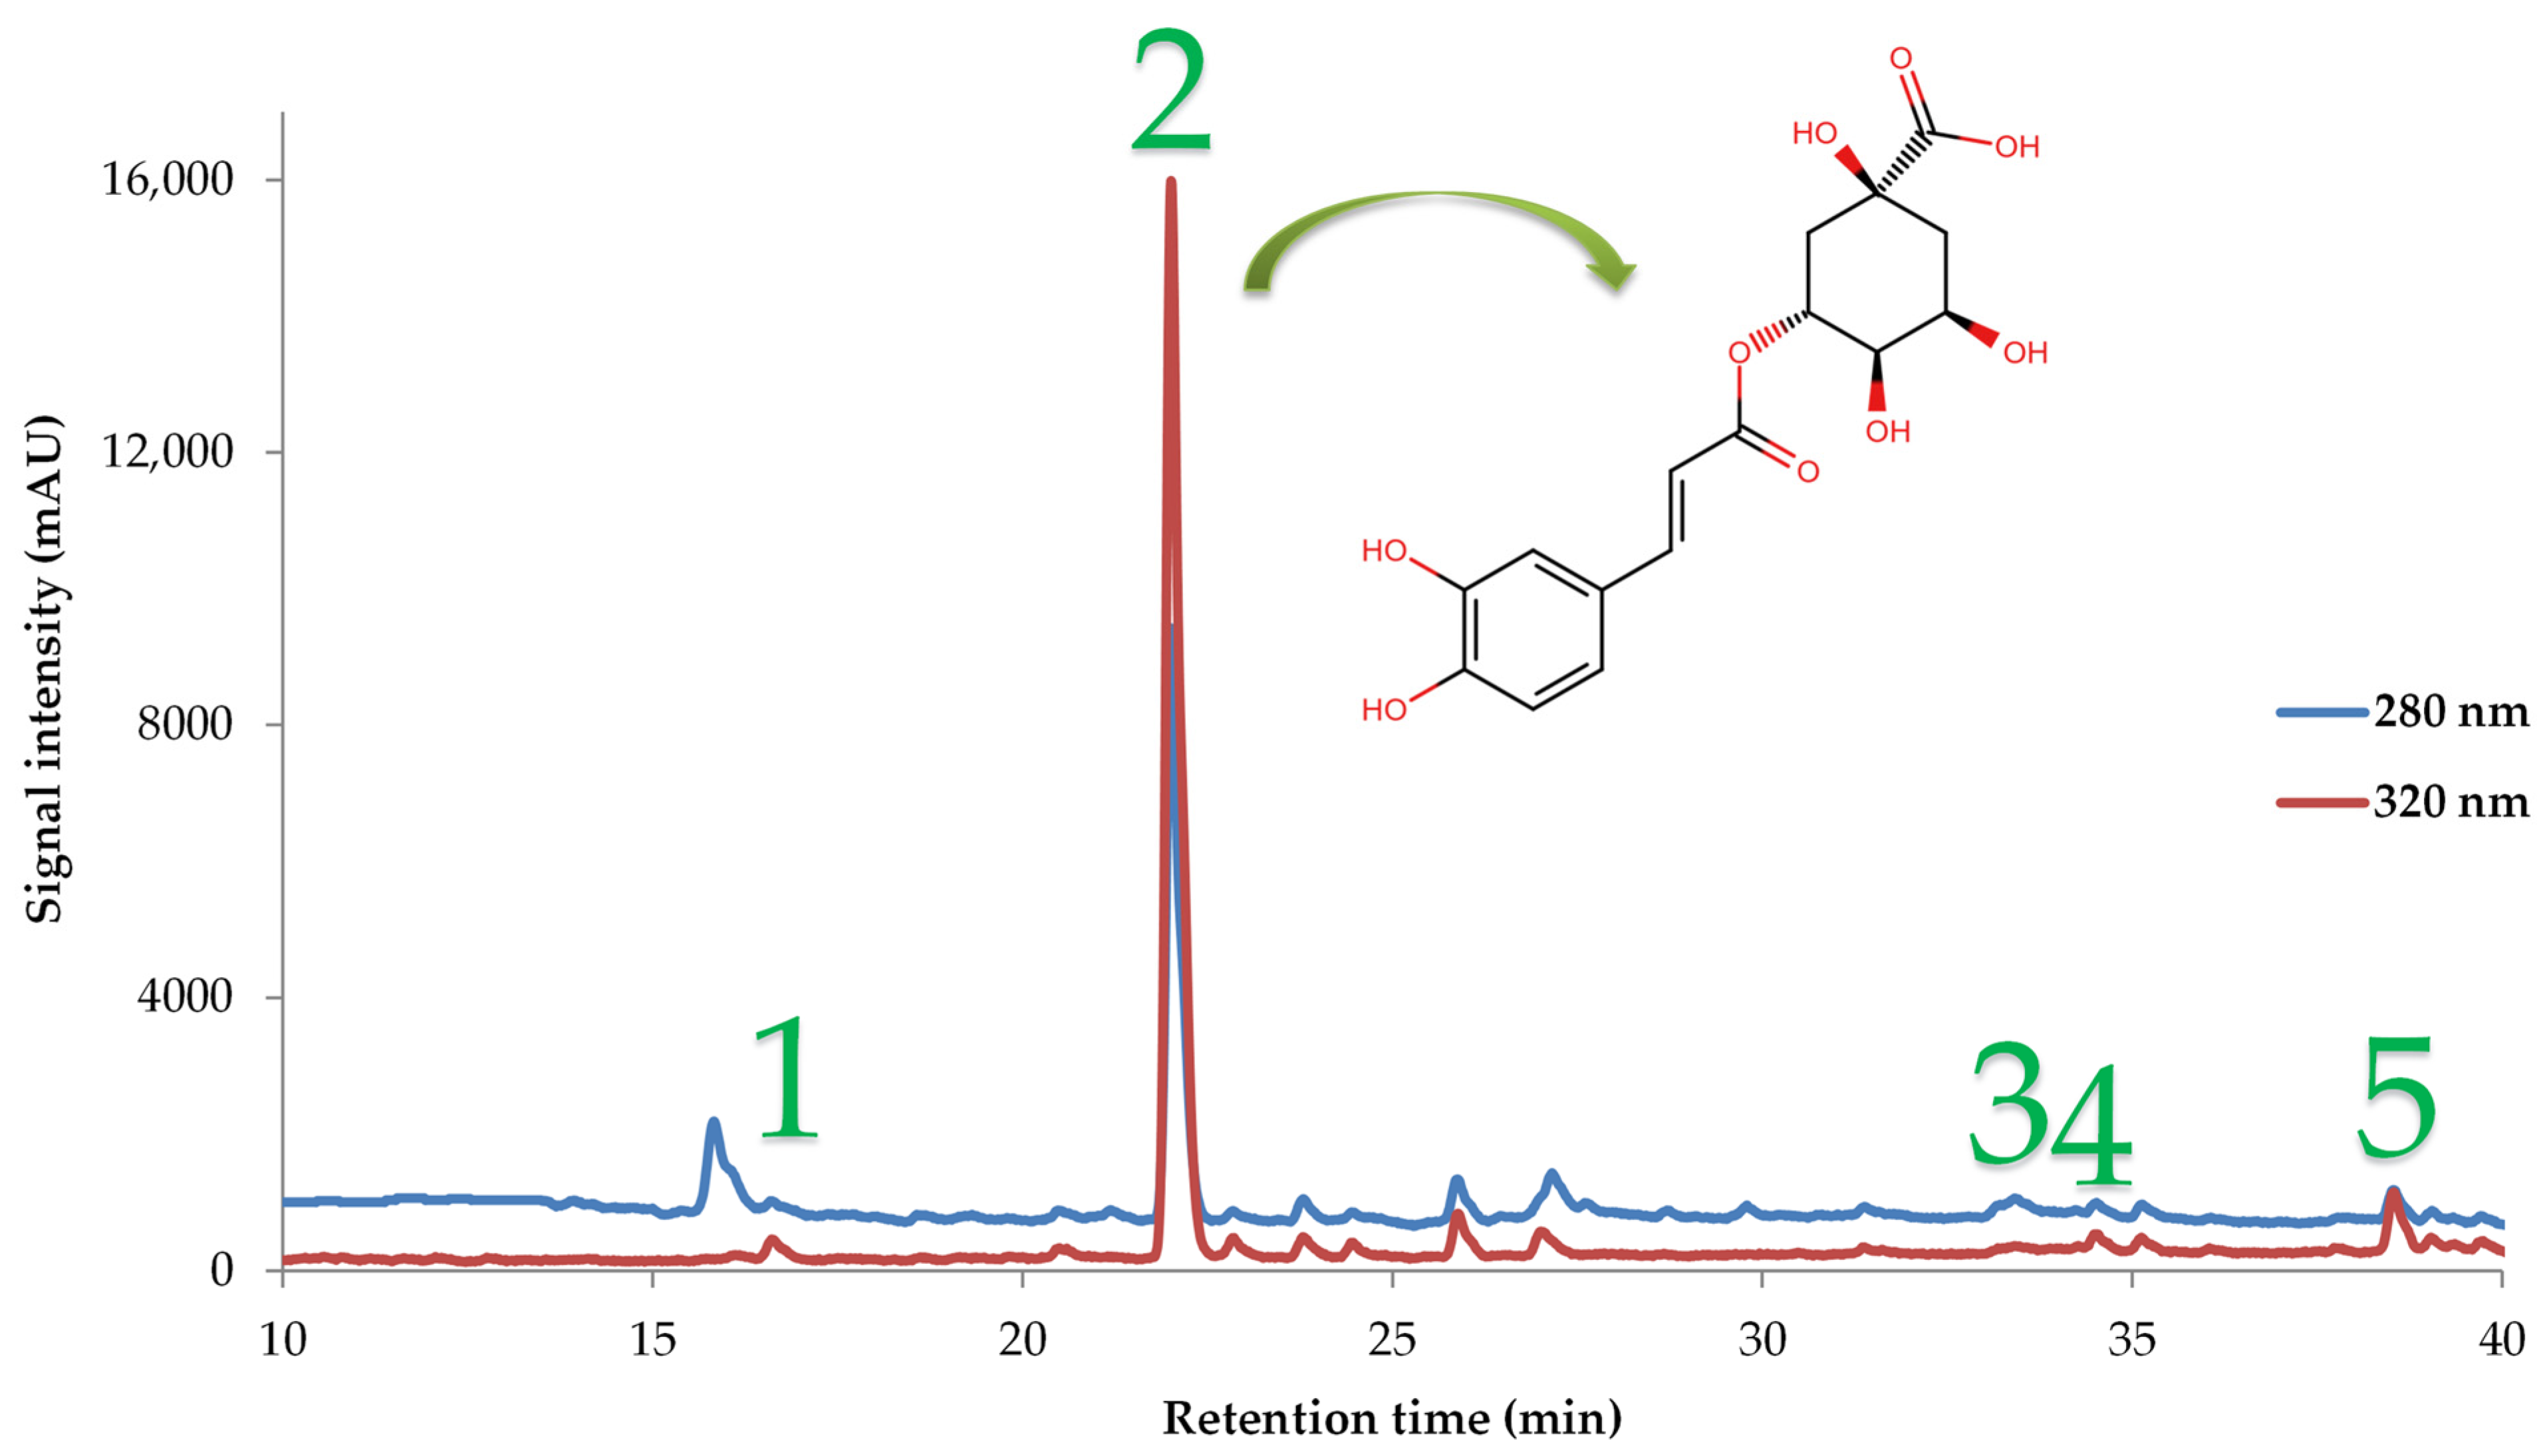
3.3.4. Polyphenolic Compounds of the Optimum PS Fruit Extract

Figure 3 and Table 5 present all the identifying polyphenolic compounds included in PS fruit extracts. The main polyphenolic compound is chlorogenic acid, representing 80.83% of the total identified polyphenolic compounds. This outcome was expected owing to previous surveys that have reported that one of the main polyphenolic compounds in various Pyrus spp. fruits (including P. communis and P. spinosa) is chlorogenic acid [5,34]. The amount of chlorogenic acid detected is extremely high and significant, since apples, which are considered a rich plant source of chlorogenic acid, especially the core, noted values of 2.10 mg/g dry fruit [35]. Chlorogenic acid is well known for its anti-obesity and anti-diabetic properties that have been linked to the metabolism of glucose [36]. Kaempferol was also found in appreciable quantities, accounting for 15.44% of the total identified polyphenolic compounds, according to Table 5. The existence of kaempferol boosts to a strong extent the health benefits of PS fruit extract as it exhibits strong antioxidant, cardiovascular, and neuroprotective properties [37].

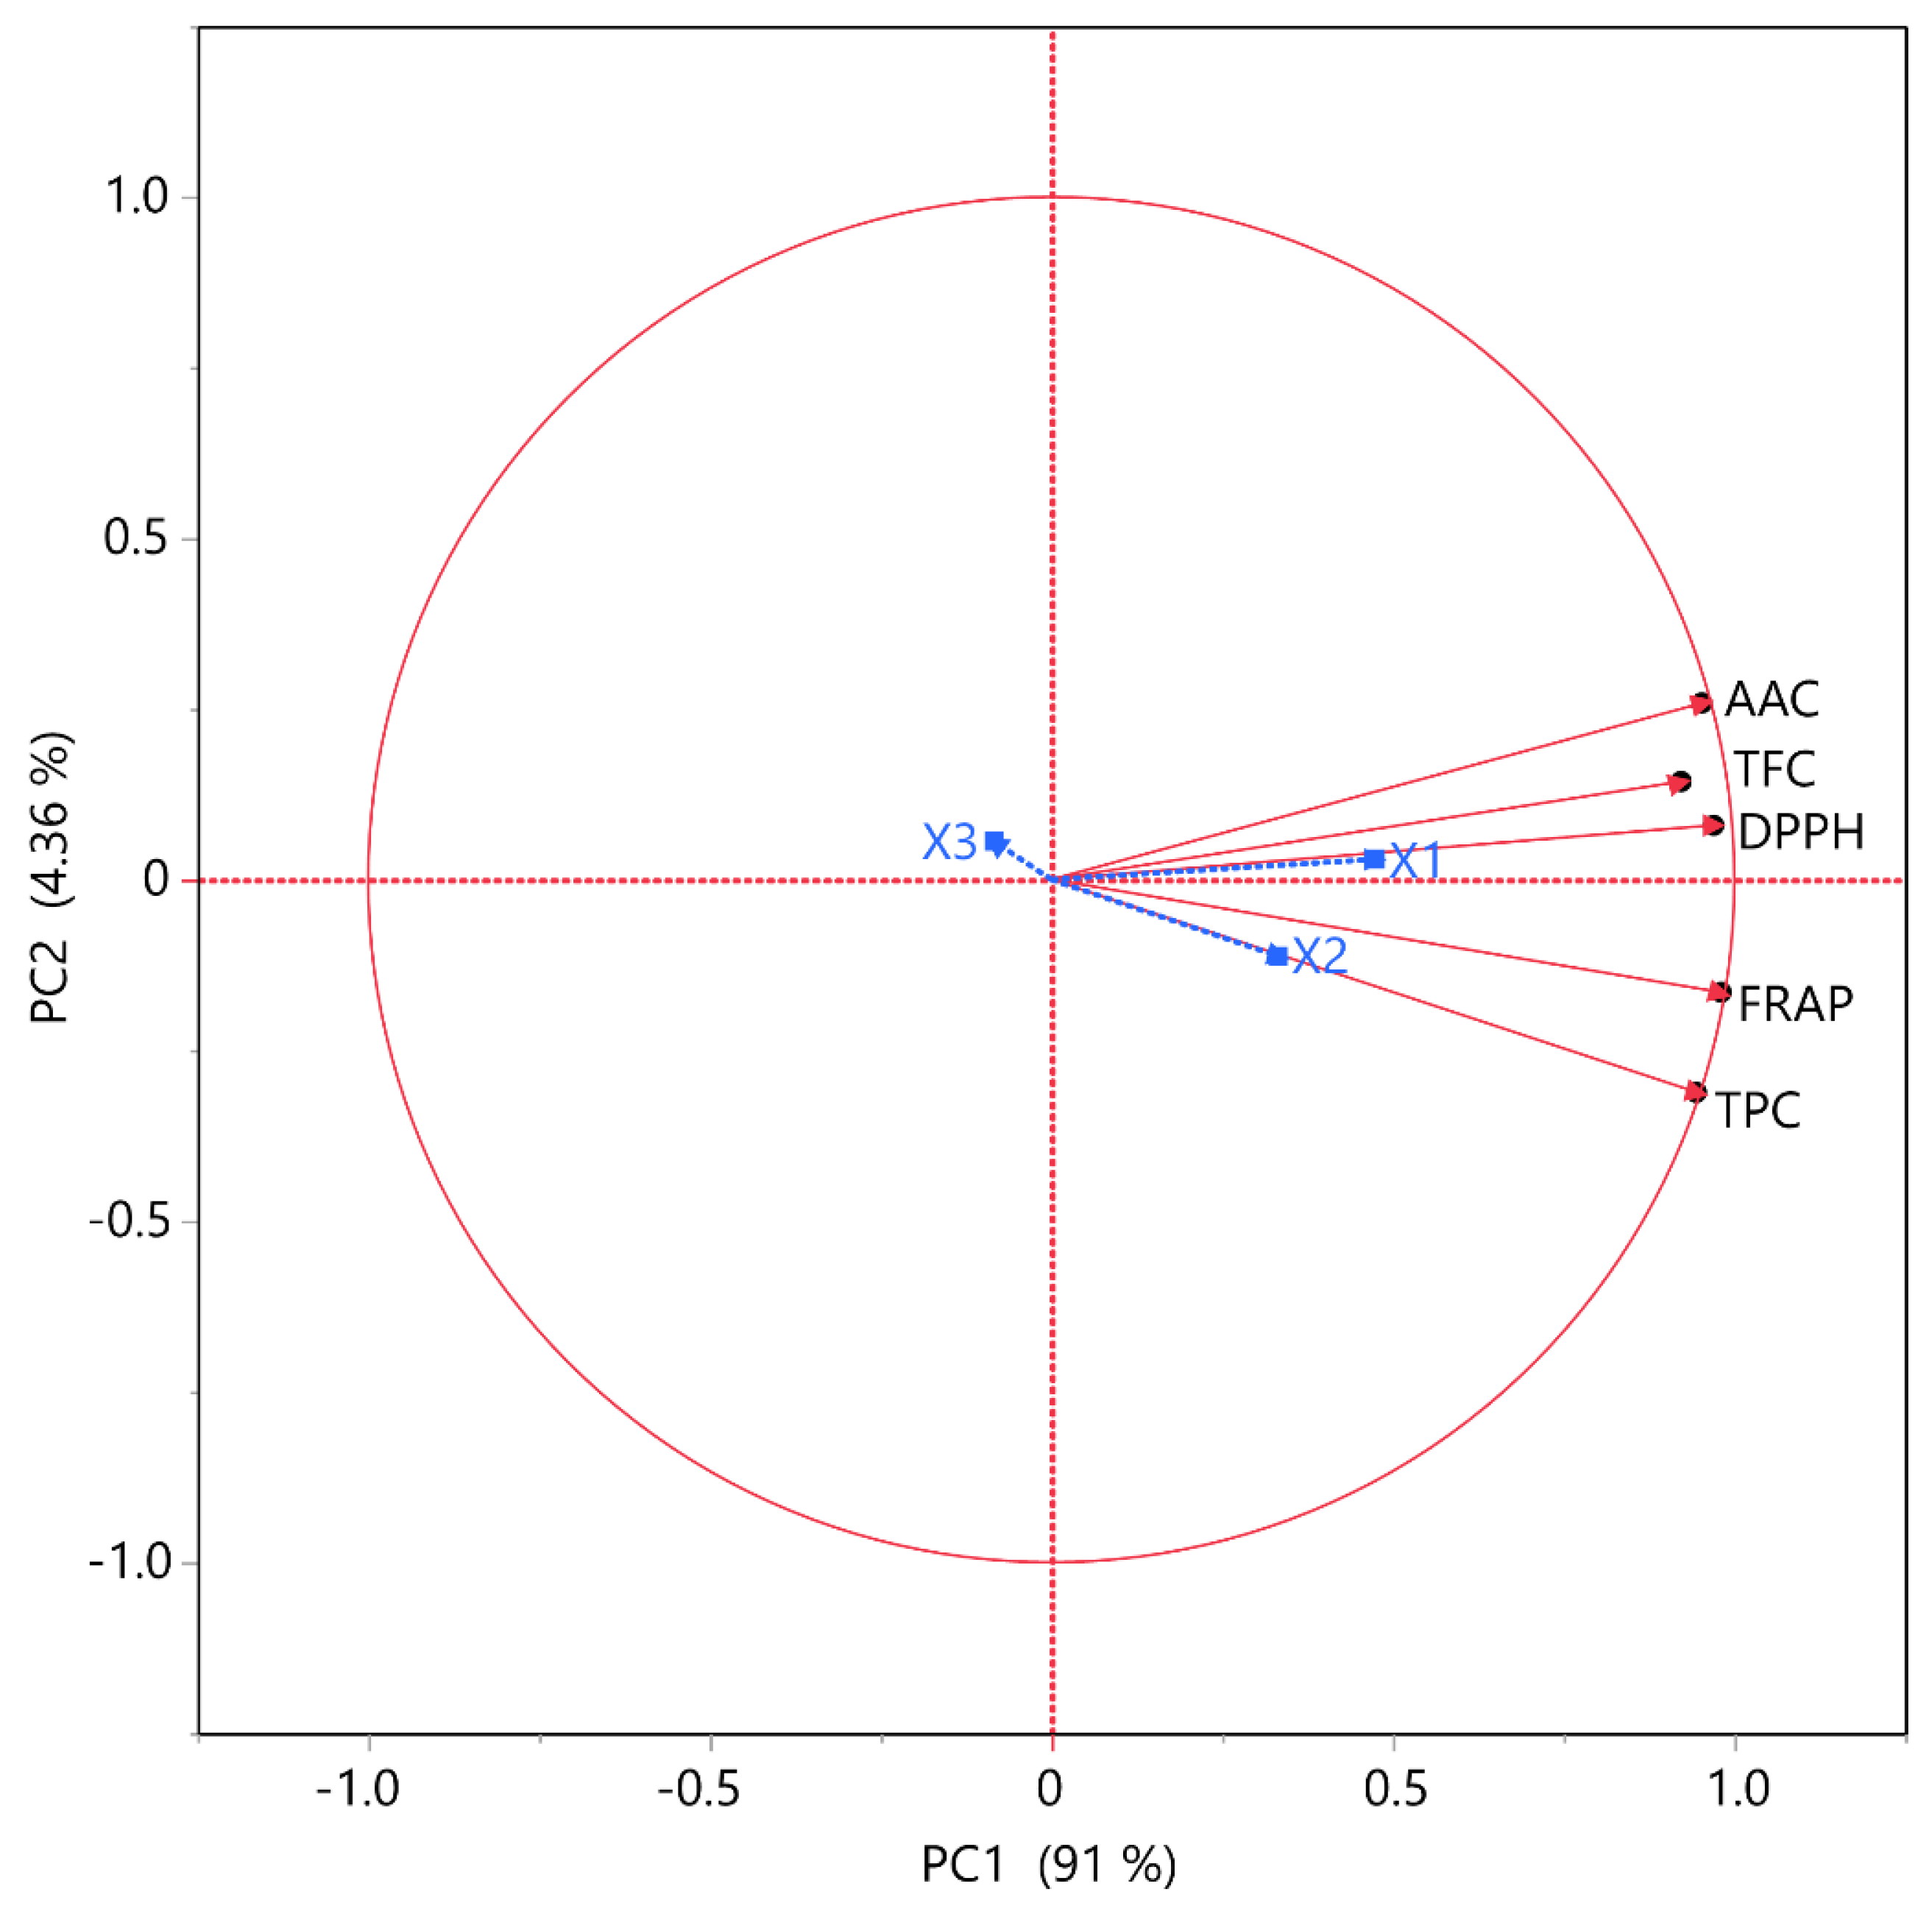
3.4. Principal Component Analysis (PCA) and Multivariate Correlation Analysis (MCA)

Figure 4 and Table 6 illustrate the correlation of values between the different bioactive compounds, confirming previous survey data. The PCA variables include the response values obtained from each of the 15 extraction conditions (Table 2), which are regarded as individual samples. In particular, Figure 4 reveals that principal component (PC) 1 explains 91% of the variability, exhibiting a positive correlation with all the tested variables’ TPC, TFC, FRAP, DPPH, and AAC and the extraction parameters of extraction T (X2) and % CEtOH (X1). This positive correlation indicates that the primary extraction parameters significantly influence the bioactive compound yield, suggesting that extraction process optimization is critical for maximizing antioxidant properties. Furthermore, it is distinguished on the extraction factors that the one that mainly influences the increase in all bioactive compounds is X1. This is in accordance with the results presented so far. The ethanol concentration was found to be the most influential factor. It is also obvious that the T parameter is of great importance, as the maximum (80 °C) was the optimal T for both the different variables and the antioxidant activity. Elevated temperatures likely increase the solubility of the bioactive compounds and enhance the mass transfer rate, leading to higher yields of antioxidants. The close clustering of TPC, TFC, FRAP, DPPH, and AAC in the PCA plot indicates that these compounds respond in a similar way to the changes in the extraction conditions, validating the effectiveness of the chosen parameters. Through a comprehensive analysis of the data, this method enables a more meaningful classification and assists in determining the optimal extraction conditions.
In terms of Table 6, the positive and high correlation between the variables is worth noting, since with a maximum correlation value of 1, the lowest correlation presented is greater than 0.82 between the TPC and AAC. Most of the bioactive compounds have an even higher correlation coefficient, with a maximum value of 0.9666, between the TPC and FRAP antioxidant activity. This result indicates that polyphenols provide strong antioxidant activity in PS fruits. An equally high correlation was noted between the AAC and antioxidant activity of the DPPH method, which means that ascorbic acid shows high free radical scavenging, reducing all of their negative health effects such as cancer risk [38]. An interesting result is the strong correlation coefficient (above 0.95) between the two antioxidant methods, which means that the antioxidants probably both have the ability the reduce the iron–tripyridyltriazine complex (Fe3+-TPTZ) to an iron–tripyridyltriazine complex (Fe2+-TPTZ) and the binding of free radicals.

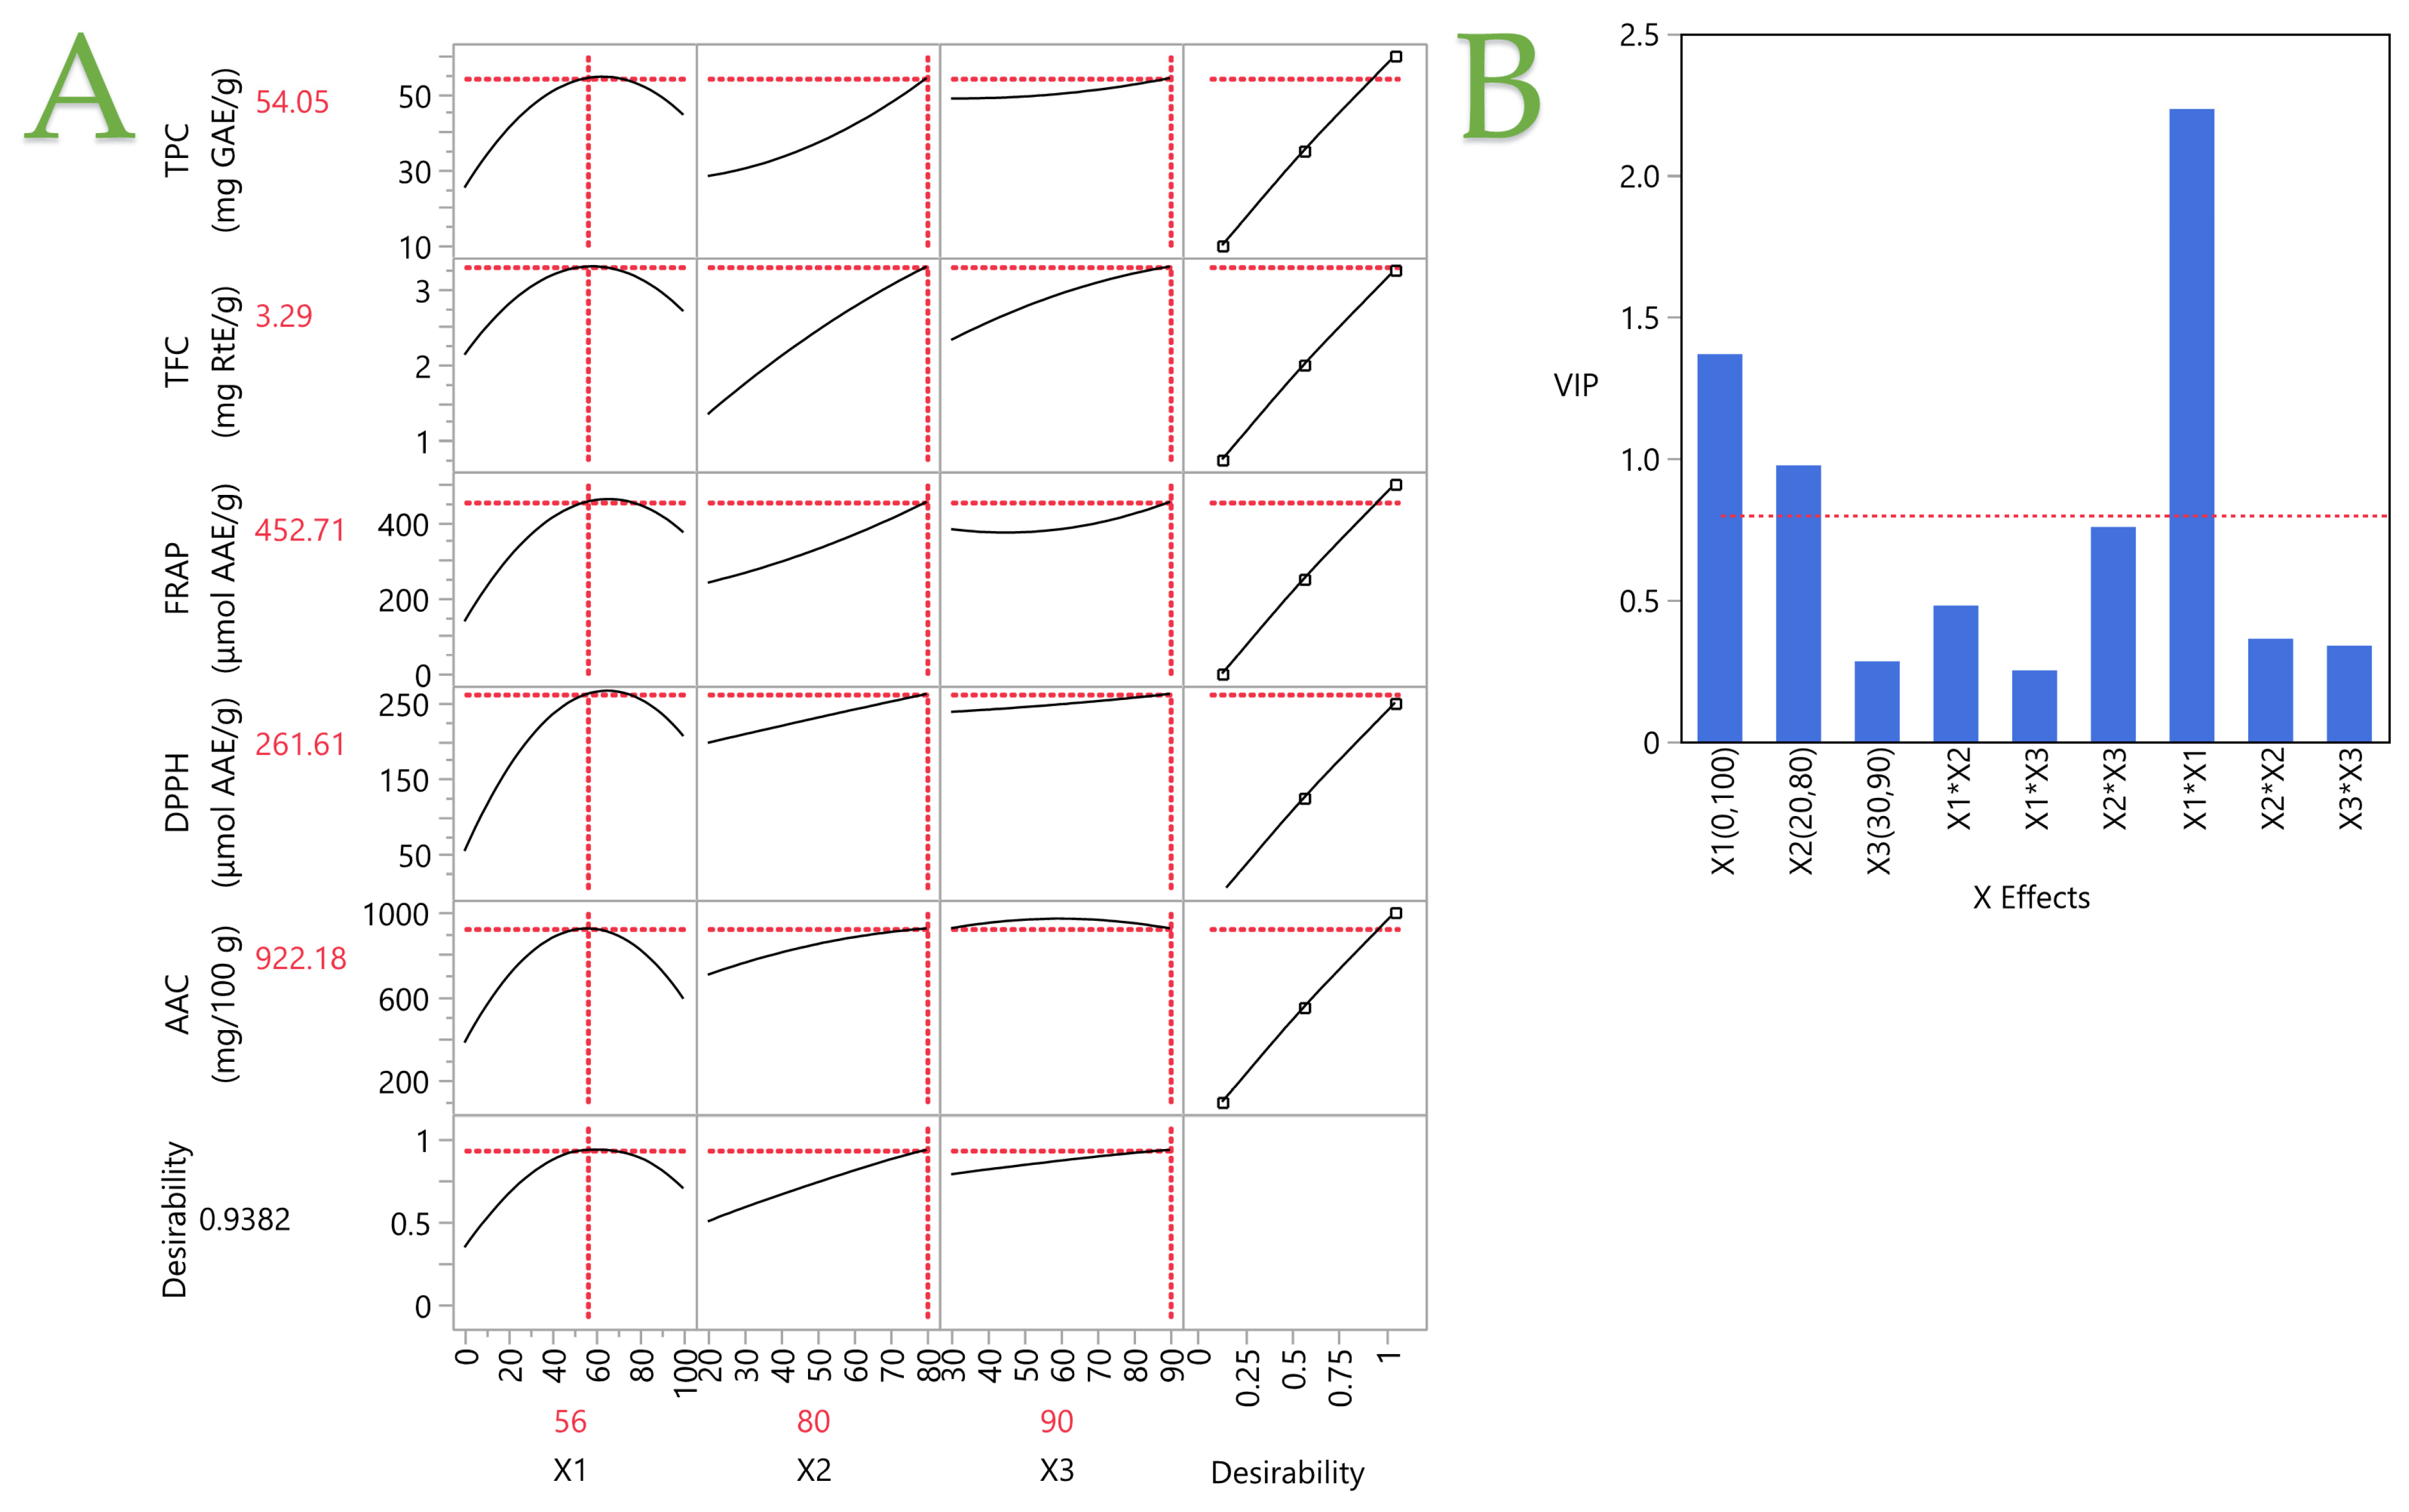
3.5. Partial Least Squares (PLSs) Analysis

A partial least squares (PLSs) model was developed to evaluate the effect of the different parameters of the extraction conditions (X1, X2, and X3), and the plot of the load correlation is visualized in Figure 5A. This plot highlights the influence of the extraction conditions on the PS fruit extracts. The results are in close alignment with those presented in Section 3.3. It was observed that variable X1, representing CEtOH, reached a plateau at 60% v/v ethanol, meaning that the values of all the bioactives were significantly lower at CEtOH less than or greater than 60%. Regarding variable T (X2), higher levels were observed to be optimal, indicating that extraction T at 80 °C was preferable. Finally, regarding t (X3), it was observed that higher values were associated with higher responses, leading to the choice of a longer t of 90 min.
In Figure 5B, the significance of each extraction parameter is presented based on its potential to increase the levels of each bioactive compound. From this figure, it is evident that the impact of % CEtOH reaches a value of 1.37, surpassing the minimum significance threshold of 0.8, making it the key factor for maximizing the extraction of PS fruit extract. Additionally, T also demonstrates significance as an extraction parameter, with an influence value of 0.97.
The experimental data and the predictions from the PLSs model are in excellent agreement, as evidenced by the high correlation coefficient of 0.999 and the high determination coefficient (R2) of 0.9979. Furthermore, a p-value of less than 0.0001 indicates that the deviations between the observed and predicted values are not statistically significant. This robust correlation is further supported by the experimental conditions X1:56, X2:80, and X3:90, which align with the data in Table 7, reinforcing the model’s validity.

4. Conclusions

In conclusion, it becomes clear that the underexplored PS fruit is a rich source of antioxidant compounds. By employing a mixture of water and ethanol, two solvents commonly used in the food and beverage industries, the extraction yield can be significantly enhanced compared to plain water extraction. In addition, by using the optimal extraction parameters that were defined from our study, an extract with better antioxidant properties than extracts from fruits of the same species can be obtained. The as-prepared extract holds promise for its use in the food and beverage industries since it can bestow good antioxidant properties to the food/beverage, resulting in the production of value-added products. This study can serve as a benchmark for future studies to further evaluate the extracts from PS and also focus on other bioactivities aside from the antioxidant one. Moreover, further studies can be undertaken to examine whether direct extraction from fresh samples can be carried out by adding the appropriate ethanol volume. Overall, our study highlights the untapped potential of PS fruits and paves the way for their broader utilization in food science and industry, offering an alternative to more traditional fruit sources.

Supplementary Materials

The following supporting information can be downloaded at: https://www.mdpi.com/article/10.3390/beverages10030056/s1, Figures S1–S5 comprise plots that illustrate the comparison between the actual response and the predicted response for each parameter under examination, accompanied by the desirability functions. Figures S6–S9 present three-dimensional response plots for the remaining responses.

Author Contributions

Conceptualization, T.C., V.A. and S.I.L.; methodology, T.C., V.A. and S.I.L.; software, V.A.; validation, K.K., T.C., V.A., E.B. and S.I.L.; formal analysis, V.A. and A.P.; investigation, A.P., E.B., V.A. and T.C.; resources, A.I.S. and S.I.L.; data curation, V.A. and T.C.; writing—original draft preparation, K.K., T.C. and E.B.; writing—review and editing, T.C., V.A., K.K., E.B., A.P., A.I.S. and S.I.L.; visualization, V.A. and T.C.; supervision, A.I.S. and S.I.L.; project administration, A.I.S. and S.I.L.; funding acquisition, S.I.L. All authors have read and agreed to the published version of the manuscript.

Funding

This research received no external funding.

Institutional Review Board Statement

Not applicable.

Informed Consent Statement

Not applicable.

Data Availability Statement

The original contributions presented in the study are included in the article/Supplementary Materials, further inquiries can be directed to the corresponding authors.

Conflicts of Interest

The authors declare no conflicts of interest.

References

  1. Vidaković, A.; Liber, Z.; Šatović, Z.; Idžojtić, M.; Volenec, I.; Zegnal, I.; Pintar, V.; Radunić, M.; Poljak, I. Phenotypic diversity of almond-leaved pear (Pyrus spinosa forssk.) along eastern Adriatic coast. Forests 2021, 12, 1630. [Google Scholar] [CrossRef]
  2. Tsoulpha, P.; Alexandri, S.; Tsaktsira, M. Critical factors affecting an efficient micropropagation protocol for Pyrus spinosa Forskk. J. Appl. Hortic. 2018, 20, 190–195. [Google Scholar] [CrossRef]
  3. Hong, S.Y.; Lansky, E.; Kang, S.S.; Yang, M. A review of pears (Pyrus spp.), ancient functional food for modern times. BMC Complement. Med. Ther. 2021, 21, 219. [Google Scholar] [CrossRef] [PubMed]
  4. Saadatian, M.; Mohammad, R.H.; Jumaah, A.A.; Oagaz, J.A. Evaluation of Nutritional Value, Fatty Acids and Polyphenols Profiles of Pyrus amygdaliformis L. Grown in North-East Kurdistan Regional Government, Iraq. J. Oleo Sci. 2022, 71, 985–990. [Google Scholar] [CrossRef] [PubMed]
  5. Özderin, S. Determination of Some Chemical Properties of Wild Pear (Pyrus spinosa Forsk.). BioResources 2022, 17, 1659–1669. [Google Scholar] [CrossRef]
  6. Wiersema, J.H.; León, B. World Economic Plants; CRC Press: Boca Raton, FL, USA, 2016; ISBN 9780429102158. [Google Scholar]
  7. Pérez-Rodríguez, M.L.; Serrano-Carretero, A.; García-Herrera, P.; Cámara-Hurtado, M.; Sánchez-Mata, M.C. Plant-based beverages as milk alternatives? Nutritional and functional approach through food labelling. Food Res. Int. 2023, 173, 113244. [Google Scholar] [CrossRef] [PubMed]
  8. Smart Protein Project. Plant-Based Foods in Europe: How Big is the Market? Smart Protein Plant-Based Food Sector Report; European Union’s Horizon 2020 Research and Innovation Programme. 2021, p. 199. Available online: https://smartproteinproject.eu/plant-based-food-sector-report/ (accessed on 1 May 2024).
  9. Deziderio, M.A.; de Souza, H.F.; Kamimura, E.S.; Petrus, R.R. Plant-Based Fermented Beverages: Development and Characterization. Foods 2023, 12, 4128. [Google Scholar] [CrossRef] [PubMed]
  10. Temple, N.J. A rational definition for functional foods: A perspective. Front. Nutr. 2022, 9, 957516. [Google Scholar] [CrossRef] [PubMed]
  11. Xie, A.; Dong, Y.; Liu, Z.; Li, Z.; Shao, J.; Li, M.; Yue, X. A Review of Plant-Based Drinks Addressing Nutrients, Flavor, and Processing Technologies. Foods 2023, 12, 3952. [Google Scholar] [CrossRef]
  12. Wu, T.; Zhu, W.; Chen, L.; Jiang, T.; Dong, Y.; Wang, L.; Tong, X.; Zhou, H.; Yu, X.; Peng, Y.; et al. A review of natural plant extracts in beverages: Extraction process, nutritional function, and safety evaluation. Food Res. Int. 2023, 172, 113185. [Google Scholar] [CrossRef]
  13. Lourenço, S.C.; Moldão-Martins, M.; Alves, V.D. Antioxidants of natural plant origins: From sources to food industry applications. Molecules 2019, 24, 4132. [Google Scholar] [CrossRef] [PubMed]
  14. Lakka, A.; Grigorakis, S.; Kaltsa, O.; Karageorgou, I.; Batra, G.; Bozinou, E.; Lalas, S.; Makris, D.P. The effect of ultrasonication pretreatment on the production of polyphenol-enriched extracts from Moringa oleifera L. (drumstick tree) using a novel bio-based deep eutectic solvent. Appl. Sci. 2020, 10, 220. [Google Scholar] [CrossRef]
  15. Paleologou, I.; Vasiliou, A.; Grigorakis, S.; Makris, D.P. Optimisation of a green ultrasound-assisted extraction process for potato peel (Solanum tuberosum) polyphenols using bio-solvents and response surface methodology. Biomass Convers. Biorefinery 2016, 6, 289–299. [Google Scholar] [CrossRef]
  16. Athanasiadis, V.; Chatzimitakos, T.; Bozinou, E.; Kotsou, K.; Palaiogiannis, D.; Lalas, S.I. Optimization of Extraction Parameters for Enhanced Recovery of Bioactive Compounds from Quince Peels Using Response Surface Methodology. Foods 2023, 12, 2099. [Google Scholar] [CrossRef]
  17. Pham, T.N.; Lam, T.D.; Nguyen, M.T.; Le, X.T.; Vo, D.V.N.; Toan, T.Q.; Vo, T.S. Effect of various factors on extraction efficiency of total anthocyanins from Butterfly pea (Clitoria ternatea L. Flowers) in Southern Vietnam. IOP Conf. Ser. Mater. Sci. Eng. 2019, 544, 012013. [Google Scholar] [CrossRef]
  18. Hikmawanti, N.P.E.; Fatmawati, S.; Asri, A.W. The effect of ethanol concentrations as the extraction solvent on antioxidant activity of Katuk (Sauropus androgynus (L.) Merr.) leaves extracts. IOP Conf. Ser. Earth Environ. Sci. 2021, 755, 012060. [Google Scholar] [CrossRef]
  19. Huamán-Castilla, N.L.; Díaz Huamaní, K.S.; Palomino Villegas, Y.C.; Allcca-Alca, E.E.; León-Calvo, N.C.; Colque Ayma, E.J.; Zirena Vilca, F.; Mariotti-Celis, M.S. Exploring a Sustainable Process for Polyphenol Extraction from Olive Leaves. Foods 2024, 13, 265. [Google Scholar] [CrossRef]
  20. Agarwal, H.; Gupta, C.; Chauhan, Y.S.; Hu, C. Parameter Extraction. In BSIM-Bulk MOSFET Model for IC Design—Digital, Analog, RF and High-Voltage; Agarwal, H., Gupta, C., Chauhan, Y.S., Hu Analog, R.F., Eds.; Elsevier: Amsterdam, The Netherlands, 2023; pp. 221–243. ISBN 978-0-323-85677-5. [Google Scholar]
  21. Antony, A.; Farid, M. Effect of Temperatures on Polyphenols during Extraction. Appl. Sci. 2022, 12, 2107. [Google Scholar] [CrossRef]
  22. Yin, X.; Chen, K.; Cheng, H.; Chen, X.; Feng, S.; Song, Y.; Liang, L. Chemical Stability of Ascorbic Acid Integrated into Commercial Products: A Review on Bioactivity and Delivery Technology. Antioxidants 2022, 11, 153. [Google Scholar] [CrossRef]
  23. Essodolom, P.; Ekpetsi Chantal, B.; Mamatchi, M.; Kousanta, A. Effect of Temperature on the Degradation of Ascorbic Acid (Vitamin C) Contained in Infant Supplement Flours During the Preparation of Porridges. Int. J. Adv. Res. 2020, 8, 116–121. [Google Scholar] [CrossRef]
  24. Abbas, S.R.; Bano, S. Significance of pyrus communis as a medicinal plant [A Review]. Rev. Pap. Abbas Bano V 2020, 8, 35–40. [Google Scholar]
  25. Li, X.; Wang, T.; Zhou, B.; Gao, W.; Cao, J.; Huang, L. Chemical composition and antioxidant and anti-inflammatory potential of peels and flesh from 10 different pear varieties (Pyrus spp.). Food Chem. 2014, 152, 531–538. [Google Scholar] [CrossRef] [PubMed]
  26. Cebulak, T.; Oszmiański, J.; Kapusta, I.; Lachowicz, S. Effect of abiotic stress factors on polyphenolic content in the skin and flesh of pear by UPLC-PDA-Q/TOF-MS. Eur. Food Res. Technol. 2019, 245, 2715–2725. [Google Scholar] [CrossRef]
  27. Kolniak-Ostek, J.; Kłopotowska, D.; Rutkowski, K.P.; Skorupinska, A.; Kruczynska, D.E. Bioactive compounds and health-promoting properties of pear (Pyrus communis L.) fruits. Molecules 2020, 25, 4444. [Google Scholar] [CrossRef] [PubMed]
  28. Mandrone, M.; Antognoni, F.; Aloisi, I.; Potente, G.; Poli, F.; Cai, G.; Faleri, C.; Parrotta, L.; Del Duca, S. Compatible and incompatible pollen-styles interaction in Pyrus communis L. Show different transglutaminase features, polyamine pattern and metabolomics profiles. Front. Plant Sci. 2019, 10, 741. [Google Scholar] [CrossRef] [PubMed]
  29. Alexandri, S.; Tsaktsira, M.; Hatzilazarou, S.; Kostas, S.; Nianiou-Obeidat, I.; Economou, A.; Scaltsoyiannes, A.; Tsoulpha, P. Selection for Sustainable Preservation through In Vitro Propagation of Mature Pyrus spinosa Genotypes Rich in Total Phenolics and Antioxidants. Sustainability 2023, 15, 4511. [Google Scholar] [CrossRef]
  30. Petridis, A.; Koukourikou, M.; Sotiropoulos, T.; Stylianidis, D. Antioxidant activity of fruits produced in Northern Greece. HortScience 2010, 45, 1341–1344. [Google Scholar] [CrossRef]
  31. Patricia, V.M.; Syaputri, F.N.; Tugon, T.D.A.; Mardhatillah, A. Antioxidant Properties of Pyrus communis and Pyrus pyrifolia Peel Extracts. Borneo J. Pharm. 2020, 3, 64–70. [Google Scholar] [CrossRef]
  32. Doseděl, M.; Jirkovský, E.; Macáková, K.; Krčmová, L.K.; Javorská, L.; Pourová, J.; Mercolini, L.; Remião, F.; Nováková, L.; Mladěnka, P. Vitamin C—Sources, physiological role, kinetics, deficiency, use, toxicity, and determination. Nutrients 2021, 13, 615. [Google Scholar] [CrossRef]
  33. Aune, D.; Giovannucci, E.; Boffetta, P.; Fadnes, L.T.; Keum, N.N.; Norat, T.; Greenwood, D.C.; Riboli, E.; Vatten, L.J.; Tonstad, S. Fruit and vegetable intake and the risk of cardiovascular disease, total cancer and all-cause mortality-A systematic review and dose-response meta-analysis of prospective studies. Int. J. Epidemiol. 2017, 46, 1029–1056. [Google Scholar] [CrossRef]
  34. Öztürk, A.; Demirsoy, L.; Demirsoy, H.; Asan, A.; Gül, O. Phenolic compounds and chemical characteristics of pears (Pyrus Communis L.). Int. J. Food Prop. 2015, 18, 536–546. [Google Scholar] [CrossRef]
  35. Liang, N.; Kitts, D.D. Role of chlorogenic acids in controlling oxidative and inflammatory stress conditions. Nutrients 2015, 8, 16. [Google Scholar] [CrossRef]
  36. Naveed, M.; Hejazi, V.; Abbas, M.; Kamboh, A.A.; Khan, G.J.; Shumzaid, M.; Ahmad, F.; Babazadeh, D.; FangFang, X.; Modarresi-Ghazani, F.; et al. Chlorogenic acid (CGA): A pharmacological review and call for further research. Biomed. Pharmacother. 2018, 97, 67–74. [Google Scholar] [CrossRef]
  37. Singh, D.; Kumari, K.; Ahmed, S. Natural herbal products for cancer therapy. In Understanding Cancer: From Basics to Therapeutics; Jain, B., Pandey, S.B.T.-U.C., Eds.; Academic Press: Cambridge, MA, USA, 2022; pp. 257–268. ISBN 9780323998833. [Google Scholar]
  38. Wang, X.Q.; Wang, W.; Peng, M.; Zhang, X.Z. Free radicals for cancer theranostics. Biomaterials 2021, 266, 120474. [Google Scholar] [CrossRef]
Figure 1. The optimal extraction of PS fruit extracts is shown in 3D graphs that show the impact of the process variables considered in the response (total polyphenol content—TPC, mg gallic acid equivalents—GAE/g). Plot (A), covariation of X1 and X2; plot (B), covariation of X1 and X3; plot (C), covariation of X2 and X3.
Beverages 10 00056 g001
Figure 2. Pareto plots of transformed estimates for total polyphenol content—TPC (A), total flavonoid content—TFC (B), FRAP (C), DPPH (D), and ascorbic acid content—AAC (E) assays. A gold reference line is drawn on the plot to indicate the significance level (p < 0.05). Positive values are shown by blue bars, and negative values are shown by red bars.
Beverages 10 00056 g002
Figure 3. Exemplary HPLC chromatogram at 280 and 320 nm of PS fruit optimal extract demonstrating polyphenolic compounds that were identified. 1: Neochlorogenic acid (λmax: 294 nm); 2: chlorogenic acid (λmax: 325 nm); 3: ferulic acid (λmax: 320 nm); 4: rutin (λmax: 356 nm); 5: kaempferol-3-glucoside (λmax: 265 nm).
Beverages 10 00056 g003
Figure 4. Principal component analysis (PCA) for the measured variables. Each X variable is presented with a blue color.
Beverages 10 00056 g004
Figure 5. Partial least squares (PLSs) prediction profiler of each variable and desirability function with extrapolation control for the optimization of PS fruit extracts are shown in plot (A), while the Variable Importance Plot (VIP) option graph with the VIP values for each predictor variable is shown in plot (B). A red dashed line in plot (B) at 0.8 indicates the significance level of each variable.
Beverages 10 00056 g005
Table 1. The multifactorial system was used for process optimization.
Independent VariablesCoded UnitsCoded Levels
−101
C (%, v/v)X1050100
T (°C)X2205080
t (min)X3306090
Table 2. Experimental findings for the three independent variables under investigation and the dependent variable’s responses.
Design PointIndependent VariablesResponses
X1 (C, %)X2 (T, °C)X3 (t, min)TPC 1TFC 2FRAP 3DPPH 4AAC 5
11 (100)1 (80)0 (60)40.262.3315.92184.04585.14
20 (50)1 (80)1 (90)57.373.14454.38242.1896.08
30 (50)0 (50)0 (60)34.472.64275.28231.83927.76
4−1 (0)0 (50)−1 (30)13.721.4481.0936.58302.06
51 (100)0 (50)−1 (30)32.942.06282.17150.32565.9
6−1 (0)1 (80)0 (60)12.881.9566.7565.08490.18
70 (50)1 (80)−1 (30)50.262.3336.26231.78933.34
80 (50)0 (50)0 (60)34.652.57274.9211.23887.53
90 (50)−1 (20)−1 (30)39.512.91345.74223.77791.31
101 (100)0 (50)1 (90)20.522.06193.54183.51621.9
110 (50)−1 (20)1 (90)25.661.31268.28192.02668.4
120 (50)0 (50)0 (60)34.42.8272.81221.25897.21
13−1 (0)0 (50)1 (90)15.391.1830.4726.44212.86
141 (100)−1 (20)0 (60)20.931.63115.7122.74540.5
15−1 (0)−1 (20)0 (60)19.50.8418.514.04123.89
1 Total polyphenol content (TPC) in mg gallic acid equivalents (GAE)/g dw; 2 total flavonoid content (TFC) in mg rutin equivalents (RtE)/g dw; 3 ferric-reducing antioxidant power (FRAP) in μmol ascorbic acid equivalents (AAE)/g dw; 4 2,2-diphenyl-1-picrylhydrazyl (DPPH) in μmol AAE/g dw; 5 ascorbic acid content (AAC) in mg/100 g dw.
Table 3. Mathematical models created using RSM were used to optimize the extraction of PS fruit. The models contained only significant terms.
ResponsesSecond-Order Polynomial Equations (Models)R2
Predicted
R2
Adjusted
p-ValueEquation
TPCY = 44.25 + 0.79X1 − 0.81X2 − 0.44X3 − 0.007X12 + 0.005X22 + 0.002X32 + 0.004X1X2 − 0.002X1X3 + 0.006X2X30.93530.81880.0168(1)
TFCY = 2.23 + 0.04X1 − 0.01X2 − 0.02X3 − 0.0003X12 − 0.0001X22 − 0.0001X32 − 0.0001X1X2 + 0.0001X1X3 + 0.0007X2X30.98250.95110.0007(2)
FRAPY = 360.79 + 8.33X1 − 4.81X2 − 7.62X3 − 0.07X12 + 0.02X22 + 0.04X32 + 0.03X1X2 − 0.006X1X3 + 0.05X2X30.96890.91280.0029(3)
DPPHY = 65.13 + 5.69X1 + 0.02X2 − 1.19X3 − 0.05X12 − 0.001X22 + 0.002X32 + 0.002X1X2 + 0.007X1X3 + 0.01X2X30.98880.96850.0002(4)
AACY = −64.3 + 21.51X1 + 8.54X2 + 2.87X3 − 0.17X12 − 0.04X22 − 0.05X32 − 0.05X1X2 + 0.02X1X3 + 0.02X2X30.99360.9820<0.0001(5)
Table 4. Maximum predicted responses and optimum extraction conditions for the dependent variables.
ResponsesOptimal Conditions
Maximum Predicted ResponseC (%, v/v)T (°C)t (min)
TPC (mg GAE/g dw)54.40 ± 13.24628090
TFC (mg RtE/g dw)3.30 ± 0.34578090
FRAP (μmol AAE/g dw)458.81 ± 89.49638090
DPPH (μmol AAE/g dw)265.91 ± 33.08648090
AAC (mg/100 g dw)968.07 ± 57.73548060
Table 5. Polyphenolic compounds under optimal extraction conditions (X1:56, X2:80, and X3:90).
Polyphenolic CompoundOptimal Extract (mg/g dw)Quantity (%)
Neochlorogenic acid0.54 ± 0.03 2.28
Chlorogenic acid19.22 ± 0.86 80.83
Ferulic acid0.20 ± 0.01 0.85
Rutin0.14 ± 0.010.60
Kaempferol-3-glucoside3.67 ± 0.19 15.44
Total identified23.77 ± 1.10
Table 6. Multivariate correlation analysis of measured variables.
ResponsesTPCTFCFRAPDPPHAAC
TPC0.83750.96660.87450.8237
TFC 0.86340.83320.8684
FRAP 0.95400.8895
DPPH 0.9581
AAC
Table 7. Maximum desirability for all variables using the partial least squares (PLSs) prediction profiler under the optimal extraction conditions (X1:56, X2:80, and X3:90).
VariablesPLSs Model ValuesExperimental Values
TPC (mg GAE/g dw)54.0550.97 ± 3.24
TFC (mg RtE/g dw)3.293.15 ± 0.72
FRAP (μmol AAE/g dw)452.71411.72 ± 9.45
DPPH (μmol AAE/g dw)261.61271.91 ± 2.74
AAC (mg/100 g dw)922.18879.12 ± 11.65
Disclaimer/Publisher’s Note: The statements, opinions and data contained in all publications are solely those of the individual author(s) and contributor(s) and not of MDPI and/or the editor(s). MDPI and/or the editor(s) disclaim responsibility for any injury to people or property resulting from any ideas, methods, instructions or products referred to in the content.

